
Abstract
The circadian clock is a molecular timekeeper that matches endogenous rhythms in diverse traits with 24-h cycles in the external environment. Although a lack of clock resonance to the environment is detrimental to performance, clock phenotypes in wild populations nevertheless deviate substantially from the predicted optimal cycle length of 24 h, and significant genetic variation exists for circadian parameters. Here, we describe covariation between 2 traits considered to reflect adaptation to different aspects of temporal environmental heterogeneity, circadian rhythms (adaptation to daily environmental cycles) and flowering time (adaptation to seasonal cycles), in a Rocky Mountain population of the mustard Boechera stricta, a North American relative of Arabidopsis thaliana. We found that 18 families that differ in circadian period in leaf movement by 3.5 h expressed genetic diversity in first-year growth, reproductive phenology, vegetative size at reproduction, and starch concentration following vernalization. The families exhibited a large (~90-day) range in mean flowering time, even though the spatial scale of population sampling covered only a few hundred meters. Circadian period covaried with other traits such that longer-period families flowered earlier and at a larger size, a trait combination predicted to yield a fitness benefit in the wild. Circadian clock research in model systems has previously shown that mutations in clock genes influence phenology. Our results widen the scope of this research by illustrating a link between naturally segregating clock variation and reproductive phenology among wild genotypes, suggesting that the causes of genetic diversity in the clock lie partly in adaptation to seasonal environmental heterogeneity.
Twenty-four-hour cycles in environmental factors such as light and temperature characterize many natural ecosystems on the earth, creating natural selection for organisms to coordinate varied biological functions with these daily cycles (Pittendrigh, 1981). In addition to fluctuations over the course of a single day, abiotic factors exhibit substantial variation across seasons within a year, with increasing variability in day length with distance from the equator (Hut et al., 2013). This variation in abiotic conditions means that the optimal time for growth and reproduction varies spatially. The circadian clock is an endogenous timekeeper found in all domains of life that allows for the anticipation of predictable daily changes in the surrounding environment (Bell-Pedersen et al., 2005), but the complexity of the clock and the range of its phenotypic outputs suggest that it plays an essential role also in adaptation to larger-scale seasonal heterogeneity in environmental conditions (Troein et al., 2009).
In plants, circadian rhythms occur in a wide range of traits, from the expression of individual genes to photosynthesis, leaf movement, and defense against herbivores with time-specific feeding behavior (Millar, 2016). On the level of ecosystems, Resco de Dios and Gessler (2017) estimate that circadian regulation accounts for a significant proportion (~20%) of daily fluctuations in photosynthesis. Point mutations in clock genes may result in arrhythmicity with disadvantageous consequences on performance in cycling experimental conditions (Green et al., 2002; Yerushalmi and Green, 2009). In the same manner, experimental manipulations of the environment may create detrimental mismatches for functional clocks (Atamian et al., 2016; O’Donnell et al., 2011). Classically, the circadian resonance hypothesis predicts that performance is optimized when the length of circadian cycles matches that of the external environment (Yerushalmi and Green, 2009; West and Bechtold, 2015), a prediction that is borne out in cyanobacteria, plants, and animals (Dodd et al., 2005; Emerson et al., 2008; Ouyang et al., 1998; Pittendrigh and Minis, 1972; Rubin et al., 2017; Spoelstra et al., 2016; Woelfle et al., 2004). Nevertheless, it is noteworthy that genotypes experiencing selection in their native habitats frequently express ample diversity in the function of the circadian clock, such that period lengths differ profoundly from the expected optimum of 24 h under natural conditions. For instance, in the model system Arabidopsis thaliana, a set of 150 genotypes sampled across multiple continents displayed a circadian period range of 6.5 h in leaf movement (Michael et al., 2003). Latitudinal gradients in photoperiod are frequently considered key factors in shaping the overall patterns of genetic diversity in the clock in wild species (Hut et al., 2013; Millar, 2016), while the annual extent of photoperiodic variation at a given site may affect phenotypic plasticity in clock outputs (de Montaigu and Coupland, 2017). Coincidentally, genetic clock variability can be considerable among divergent cultivars of commercially valuable plants (Dakhiya et al., 2017; Greenham et al., 2017; Lou et al., 2011; Müller et al., 2016; Yarkhunova et al., 2016) and between cultivars and their wild progenitors (Müller et al., 2016). These observations indicate that differing environmental conditions induce spatially variable selection on clock phenotypes in the wild and that, similar to natural selection, domestication has advanced the scope of genetic variation in the circadian clock in agriculturally valuable species.
In nature, it is typical for genetic diversity to arise at multiple discrete ecological levels. In a recent study examining the distribution of quantitative genetic variation in the circadian clock on a relatively regional scale in the central Rocky Mountains, Salmela et al. (2016b) observed that in Boechera stricta, a widely distributed North American relative of A. thaliana, genetic differences in circadian period length in leaf movement were manifested not only among populations from different elevations but also among maternal lineages within populations. In fact, the breadth of quantitative diversity within the populations exceeded that observed among the populations and comprised a hefty proportion of the global variation in A. thaliana (Michael et al., 2003). Further, Salmela et al. (2016b) found that in the population with the most genetic variation in the clock, families with longer average circadian periods were generally larger after 8 weeks of growth and their growth ranks were similar across differing combinations of photoperiod and temperature. Simulations of among-year growing season temperature heterogeneity revealed that for first-year growth, genetic variances differed more than family ranks in response to treatment (Salmela et al., 2016a). Thus, it appears likely that local genetic diversity in the clock in this perennial species is maintained due to its association with traits other than early growth.
In plants, timing of flowering needs to be tuned to the local environment for optimal fitness, making it one of the most extensively studied quantitative traits in evolutionary biology in the context of adaptation to seasonal environmental heterogeneity (Blackman, 2017). Many candidate genes for flowering in A. thaliana are closely related to the clock (Johansson and Staiger, 2015; Greenham and McClung, 2015), and mutations in clock genes have pleiotropic effects on flowering (e.g., Park et al., 1999). These findings are in accordance with the theoretical assumption that a complex circadian clock facilitates adaptation to both short- and long-term fluctuations in the environment (Troein et al., 2009), yet the relationship between the 2 timekeeping systems in natural plant populations has not been evaluated before. If the same genes contributed to both circadian rhythms and flowering time in wild species, an association between clock function and timing of reproduction would be anticipated to emerge when examining divergent clock genotypes in common-garden settings. Here, we test for this predicted association by measuring the extent of genetic variation in flowering time in a Rocky Mountain population of B. stricta that displays significant genetic variation in circadian period under ecologically relevant temperature and photoperiod settings (Salmela et al., 2016b). We hypothesize that if the 2 sets of traits are interconnected, local diversity will also be discovered in flowering time and that it will covary with circadian period. Further, we expect that the potential for selection on circadian period and flowering time in the wild will be indicated by associations between these traits and vegetative size at reproduction, which is positively associated with reproductive fitness in this species (Anderson et al., 2011; Anderson et al., 2012). Finally, we explore genetic diversity and its covariation with circadian period in carbohydrate concentrations that vary among natural accessions (Cross et al., 2006) and whose changes function as signals to the clock and photoperiodic responses in A. thaliana (Bläsing et al., 2005; Corbesier et al., 1998; Ohto et al., 2001).
Materials and Methods
We collected seeds by maternal family from a single population in southeastern Wyoming on July 26, 2012. The sampled population was located at about 300 to 500 m from the South Brush Creek SNOTEL weather station (41.333° N, 106.500° W; elevation 2572 m) with available long-term data on climate. Because of our interest in naturally occurring genetic (among-family) variation on a very local level, we used wild-collected seeds in our experiment. Consequently, the observed among-family differences possibly result not only from heritable genetic differences but also from maternal effects, the importance of which in this species is not known. It is likely that the used seeds matured under similar environmental conditions due to sampling on 1 day only and within a limited area at 1 location, which could be expected to reduce the magnitude of environment-induced effects in the dataset.
We planted seeds from 18 family lines, representing the same seed lots that were used in the preceding circadian screen by Salmela et al. (2016b) and its follow-up on the potential of growing season temperature heterogeneity to induce genotype × environment interactions in the population (Salmela et al. 2016a). The number of replicates planted per family ranged from 6 to 20, providing the means for quantifying among-family differentiation. Seeds were cold-stratified on moist paper in the dark for 4 days at 4 °C before germinating in growth chambers for 6 days (12L:12D, 21 °C; PGC-9/2 with Percival Advanced Intellus Environmental Controller, Percival Scientific, Perry, IN). We applied the extensive temperature records from the SNOTEL weather station located in the vicinity of the population’s home site to identify and establish ecologically relevant temperature cycles in the growth chambers. After potting in the Sunshine Redi-Earth soil (Sungro Horticulture, Agawam, MA), seedlings were grown for 8 weeks in randomized order in 2 chamber compartments with conditions that simulated average late June temperature and photoperiod conditions across 4 B. stricta sites in the region and that matched the environment used in the circadian screen by Salmela et al. (2016b). Maximum photosynthetic irradiance, measured using the light meter LI-250 (LI-COR Biosciences, Lincoln, NE), was approximately 200 µmol m-2 s-1 at the plant level. Temperature in the treatment varied gradually between about 5 °C at 0400 h and about 17 °C at 1500 h, with the photoperiod set to its peak at the site in late June, 15 h. Plants were measured for rosette diameter at 6 weeks of age.
B. stricta is a perennial species that overwinters as a rosette and flowers in the early stages of a growing season in its high-elevation habitats. In experimental settings, vernalization can be used to simulate winter conditions. To induce flowering, plants were placed in a walk-in cooler for 6 weeks at a temperature of 4 °C, reduced light intensity (maximum photosynthetic irradiance approximately 4.5-5.5 µmol m-2 s-1), and shortened photoperiod (12L:12D). Because environmental conditions affect trait means and variances in circadian rhythms and phenology (Edwards et al., 2005; Lou et al., 2011; Kusakina et al., 2014; Rubin et al., 2017; Sasaki et al., 2015), we wanted to measure phenological responses in the same photoperiod and temperature cycles that were used for the circadian screen on young seedlings of the same families, limiting the potentially interfering effects of other environmental factors and facilitating a comparison of the 2 datasets. Thus, after the vernalization, plants were placed back into the earlier growth conditions where timing of bolting and flowering along with size at reproduction (the number of leaves and the rosette diameter) were scored. Bolting of plants was checked daily and scored as the appearance of an ~1-mm inflorescence. Flowering was scored as the first open flower on the inflorescence of the plant. Both variables were expressed as the number of days after the vernalization.
In 9 families with 20 replicates planted, a subset of plants was harvested for aboveground biomass 1 week and 5 weeks after removal from the vernalization. At both time points, samples were taken between late morning and early afternoon. Dried leaf tissue was used for the analysis of sugars via the anthrone method used by Guadagno et al. (2017). Ground tissue was incubated in ethanol at 80 °C, centrifuged for 3 cycles of 10 min each, and hydrolyzed in 5 mL of anthrone solution. Soluble nonstructural carbohydrates were determined spectrophotometrically at 620 nm using glucose as a standard. For starch, residual samples were incubated in HClO4 and then centrifuged for 10 min before hydrolyzation in anthrone. Then starch concentrations were determined spectrophotometrically as for nonstructural carbohydrates. All sugar concentrations were calculated on a dry matter basis (% DW). Due to the small size of individual plants, pooling of samples was necessary such that sample sizes for the 2 time points (1 week vs. 5 weeks) became unbalanced, and we therefore conservatively interpret results for the carbohydrate analyses.
We used general linear models to examine whether the measured traits were differentiated among families: that is, whether genetic variation was manifested in the population. A block effect was included in the models for phenology and growth, indicating differences in chamber conditions; family × block interactions were nonsignificant for all traits and thus were excluded from analyses. Because clock function was evaluated in a separate set of replicates, we applied family means of circadian period, flowering time, and other performance metrics to explore bivariate associations among these traits based on Pearson’s correlation. Circadian period estimates for leaf movement were published in Salmela et al. (2016b) and were based on the method by Greenham et al. (2015) and images of small seedlings taken every 20 min for 5 days following entrainment in the same temperature cycles and photoperiod as in the current experiment. Two families had 3 replicates for period estimation, while all the others had a minimum of 5 replicates. The range of family means for period length was 3.5 h. For starch and nonstructural carbohydrate concentrations, we analyzed the overall effects of time point and family. We used IBM SPSS Statistics Version 22 to perform all analyses.
Results
We observed among-family variation in all the measured growth and phenological traits (Table 1), signaling quantitative genetic diversity in the South Brush Creek population. Families were differentiated in size by 6 weeks after planting, when family means for rosette diameter ranged from 3.37 to 5.53 cm. Of the 128 plants retained for the phenology measurements, 3 plants died during the vernalization treatment, 119 bolted, and 115 flowered. The 6 plants that did not enter the reproductive stage were all from different families. The 4 plants that bolted but did not flower were also all from different families, 2 of which also included plants that did not bolt at all. Total phenotypic and among-family variation in reproductive phenology and size at reproduction was abundant (Fig. 1, a-c). Family means of flowering time (4-10 replicates scored per family) under the experimental conditions varied by almost 90 days (Fig. 1a), with the earliest families flowering on average about 44 days after the vernalization. The 2 measures of size at reproduction varied 2- to 3-fold among families (Fig. 1, b and c) and were positively associated with rosette diameter at 6 weeks (r = 0.535-0.554, p < 0.05).
General linear model results for rosette diameter at 6 weeks, bolting time, flowering time, and size at reproduction in a Wyoming population of Boechera stricta.
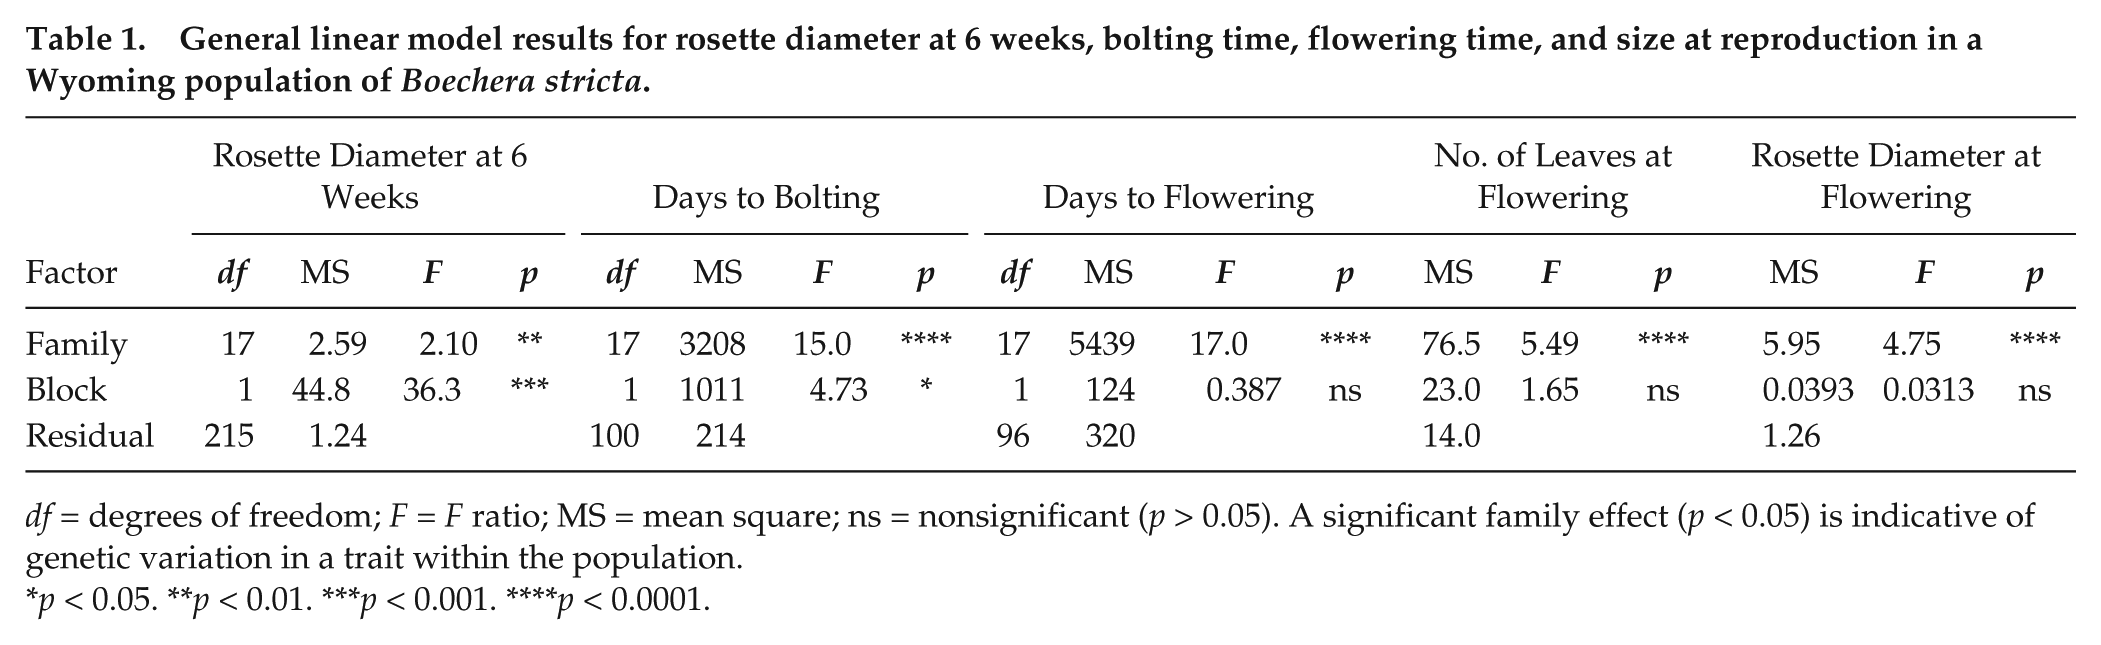
df = degrees of freedom; F = F ratio; MS = mean square; ns = nonsignificant (p > 0.05). A significant family effect (p < 0.05) is indicative of genetic variation in a trait within the population.
p < 0.05. **p < 0.01. ***p < 0.001. ****p < 0.0001.
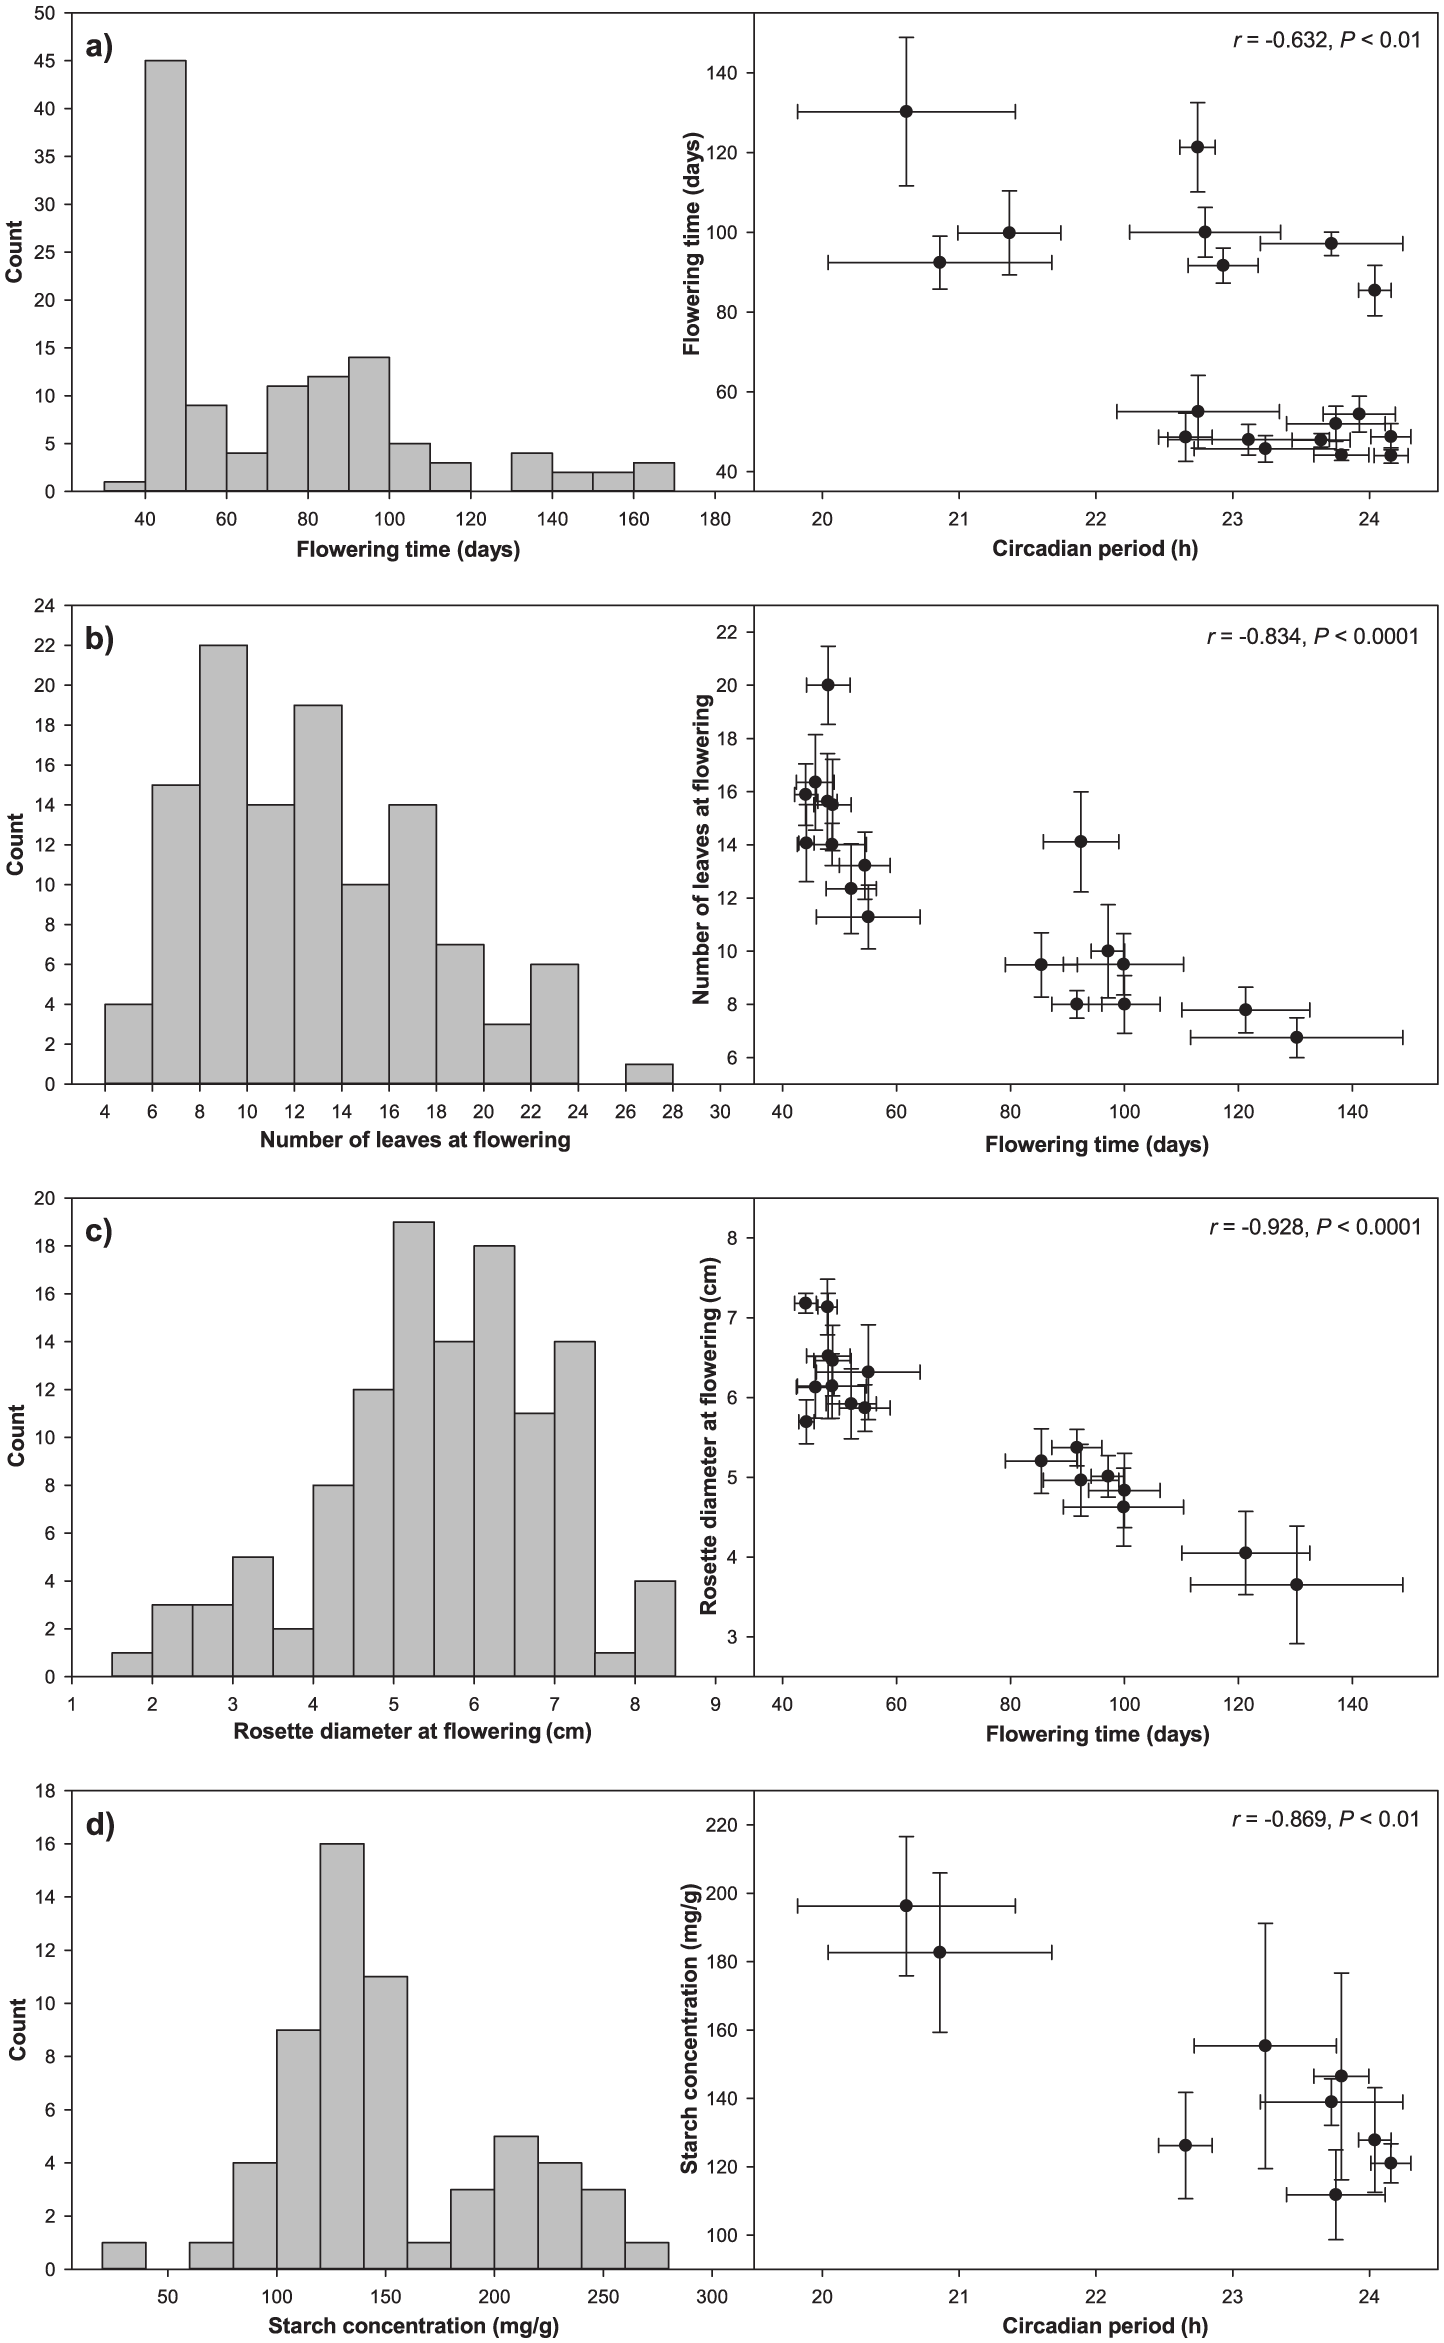
Circadian period in leaf movement, reproductive phenology, and size at reproduction covary in a Rocky Mountain population of the widely distributed mustard Boechera stricta. Histograms on the left show total phenotypic variation for each trait in this experiment, while scatterplots on the right are representative of quantitative genetic variation segregating among families. (a) The negative correlation between family means of circadian period and flowering time indicates earlier flowering when the endogenous clock cycles at a pace of approximately 24 h. (b and c) The negative association between family means of flowering time and 2 measures of size at reproduction suggests that a longer circadian period and earlier flowering confer a fitness advantage in the population. (d) Genetic diversity in the clock and reproductive phenology may be related to differences among families in starch concentration, with evidence for higher concentration in shorter-period and late-flowering families following vernalization. Bars in the plots mark standard errors of the family means.
We found evidence for covariation between circadian rhythms in leaf movement and flowering time in the South Brush Creek population, with longer-period families generally flowering earlier after the vernalization (r = −0.632, p < 0.01) (Fig. 1a). In like manner, flowering time was negatively associated with both measures of size at reproduction. Families that flowered earlier had more leaves (r = −0.834, p < 0.0001) (Fig. 1b) and a larger rosette diameter (r = −0.928, p < 0.0001) (Fig. 1c). In turn, families with longer circadian periods had larger rosette diameters at reproduction (r = 0.638, p < 0.01). The correlation between period and the number of leaves at reproduction was also positive but nonsignificant (r = 0.375, p = 0.125).
We sampled 106 replicates for carbohydrate analyses 1 week and 5 weeks after the vernalization (9 families at both time points, 7 of which were common to both). Pooling yielded 16 samples at the first time point and 43 samples at the second time point, with the replicate number per family and across the 2 dates ranging from 4 to 9. We observed a significant effect of time point for both nonstructural carbohydrate (a 38.7% increase, from 49.9 to 69.2 mg/g between the time points; F1,49 = 25.1, p < 0.0001) and starch concentrations (a 26.1% increase, from 128.4 to 161.9 mg/g between the time points; F1,49 = 5.45, p < 0.05). For nonstructural carbohydrates there was no average effect of family across the time points (F8,49 = 1.77, p > 0.05). For starch, we found some evidence for an overall family effect (F8,49 = 2.03, p = 0.062), with family means varying from 111.8 to 196.2 mg/g (Fig. 1d). Further, family means for starch concentration covaried negatively with those for circadian period (r = −0.869, p < 0.01) (Fig. 1d) and rosette diameter at reproduction (r = −0.757, p < 0.05) and positively with those for flowering time (r = 0.672, p < 0.05).
Discussion
In this experiment, we were interested in determining whether genetic diversity in the circadian clock in a natural plant population is linked to similar local variability in reproductive phenology, as expected based on theoretical modeling and the partial overlap in the genetic underpinnings of the 2 timekeeping systems (Greenham and McClung, 2015; Johansson and Staiger, 2015; Troein et al., 2009). Although naturally occurring quantitative genetic diversity in the clock is ubiquitous at variable spatial scales in the wild (e.g. Dakhiya et al., 2017; de Montaigu et al., 2015; Greenham et al., 2017; Helm and Visser, 2010; Michael et al., 2003; Pivarciova et al., 2016), little is known of the ecological and evolutionary determinants of such diversification, particularly on a very regional level (Salmela et al., 2016b).
Earlier research on the South Brush Creek population of the mustard B. stricta from southeastern Wyoming indicated that families with longer average circadian periods grow larger in their first year (Salmela et al., 2016b), which is in accordance with the pleiotropy of clock genes (Dodd et al., 2005; Park et al., 1999). In the current study, we continued to monitor these perennial plants into their second year when flowering can be triggered by vernalization simulating winter conditions. Our experimental setup revealed considerable genetic variation in flowering time within the South Brush Creek population, with means among maternal families sampled within a small area varying by almost 90 days in growth chamber settings. This range of genetic diversity is likely to vary in response to different vernalization temperatures (e.g., Anderson et al., 2011; Nordborg and Bergelson, 1999; Sasaki et al., 2015). Further, we found evidence for systematic covariation between circadian rhythms expressed early in the life cycle and timing of reproduction after vernalization, with shorter-period families tending to flower later in their second year. This association could arise from a partially shared genetic architecture controlling the clock and phenology (e.g., Shim et al., 2017). Indeed, many candidate genes for flowering time that have been identified in A. thaliana are clock-related (Brachi et al., 2010); in Brassica rapa, the same chromosomal regions may regulate both timekeeping systems (Lou et al., 2011). In another mustard, Capsella bursa-pastoris, early and late flowering accessions vary substantially in the expression levels of clock genes (Slotte et al., 2007). The correlation of endogenous rhythms with reproductive phenology in our plant model resembles patterns found in birds, where within-population polymorphisms in specific clock genes are associated with breeding phenology (Caprioli et al., 2012; Liedvogel et al., 2009) and where individuals that are active earlier during the day may start breeding earlier in the season in the wild (Graham et al., 2017). In contrast, Helm and Visser (2010) observed no covariation between circadian period in locomotor activity and egg-laying date in a bird population raised in aviaries.
One possible mechanism by which the circadian clock could influence transition to flowering is through carbohydrates, the daily fluctuating concentrations of which regulate and are regulated by the clock (Bläsing et al., 2005). For example, in A. thaliana, genetic differences in circadian period affect starch turnover over the course of a day, which in turn may influence growth (Graf et al., 2010). We found some indication of a higher starch concentration after vernalization in families that flowered late and at a smaller size. The association between starch concentration and size is similar to that among 24 diverse natural accessions of A. thaliana (Cross et al., 2006). However, we did not detect robust evidence for overall among-family variation in nonstructural carbohydrate concentration, one component of which is sucrose, a stimulant of flowering time and circadian rhythms in A. thaliana (Corbesier et al., 1998; Dalchau et al., 2011). Sucrose is quickly translocated from shoots to roots to synchronize circadian oscillations above and below ground (James et al., 2008), and it is possible that the vernalization triggered the translocation of small water-soluble sugars to the roots and that only at the end of the vernalization did nonstructural carbohydrates start increasing in the leaves. Due to the small size of plants, pooling of samples was necessary for carbohydrate analyses in this experiment. Thus, we only examined potential overall genetic diversity across the 2 sampling dates. To determine the role of carbohydrate dynamics in transition to reproduction in more detail, more intensive temporal sampling, detailed analyses of specific sugars such as sucrose, and a balanced experimental design across time points are required such that family-specific responses to time of sampling can be quantified.
Flowering time is often considered to be under directional selection for earlier initiation in natural settings (Anderson et al., 2011; Anderson et al., 2012; Austen et al., 2017; Munguía-Rosas et al., 2011). Furthermore, the trait frequently diverges across different environmental gradients such as growing season length (Anderson and Gezon, 2015; Méndez-Vigo et al., 2011), a sign of the trait having an important role in adaptation to spatial heterogeneity. Our findings in the South Brush Creek population reveal potential for local selection on flowering time: early-flowering families were larger in their vegetative size at reproduction, which in turn contributes positively to reproductive fitness in B. stricta examined in various experimental and field settings (Anderson et al., 2012). Annual species like A. thaliana may display a reversed trend for the age versus size relationship (Mitchell-Olds 1996). The pattern of earlier flowering at a larger size will require a faster growth rate and thus dilution of sugar pools, as we have observed. Yet, while the patterns of trait covariation in our study imply that families that cycle at a pace of approximately 24 h and flower early should possess a competitive edge, these patterns also bring up the puzzle of how multiple genotypes with such highly divergent phenotypes in circadian cycling and life history can coexist at the same site.
To date, evolutionary research has mostly focused on characterizing quantitative genetic diversity among populations in relation to large-scale environmental variability (Linhart and Grant, 1996; Savolainen et al., 2007), resulting in a limited comprehension of factors that lead to the maintenance of genetic variation within populations in traits frequently assumed to experience strong selection (e.g., Méndez-Vigo et al., 2013). In theory, self-pollination could diminish genetic variability in species like A. thaliana and B. stricta (reviewed in Wright et al., 2013), but empirical evidence does not demonstrate particularly limited diversity in these species (e.g., Méndez-Vigo et al., 2013; Song et al., 2006; Salmela et al., 2016ab). However, what the high rate of self-pollination in B. stricta does suggest is that long-distance gene flow from other populations in the region is unlikely to account for the high within-population diversity in South Brush Creek (cf. Yeaman and Jarvis, 2006). A plausible alternative explanation is an association between reproductive phenology and fitness, the direction and strength of which are dependent on the prevailing environmental conditions (Ollerton and Lack, 1992). Under this scenario, experiments without temporal or spatial replication would not be able to capture the dynamics of natural selection. Indeed, the pervasive variation in reproductive phenology and fitness could spawn from a more complex and fluctuating form of selection (Austen et al., 2017). In an experimental population of A. thaliana, highly divergent environments at geographically distinct field sites may modify the interactions between size, phenology, and reproductive fitness (Fournier-Level et al., 2013), but it remains to be determined whether fine-scale spatial or temporal environmental heterogeneity at a given site could shift optimal flowering time in plant populations from one extreme to the other. At South Brush Creek, spring conditions are highly variable in terms of temperature and snow depth, which, along with biotic factors, might shift the phenotypic optimum toward later flowering in some years and influence the range of variation expressed among families. It is also important to note that although statistical analyses may provide evidence for timing of flowering affecting reproductive fitness, scatterplots used to invoke directional selection in the wild (e.g., Anderson et al., 2012; Munguía-Rosas et al., 2011) are often indicative of only weak associations between these traits. Further, Anderson et al. (2012) found only low covariation between flowering times of individual plants in 2 successive years in a wild population of B. stricta, possibly marking genotype × environment interactions in phenology that may also conserve diversity in our study system.
In conclusion, our study has revealed notable genetic variation in reproductive phenology on a very local level within a native population of the common mustard B. stricta from the central Rocky Mountains. We also found evidence for covariation between circadian rhythms, timing of reproduction, and size at reproduction. Thus, genetic diversity in the circadian clock detected in small seedlings may be shaped in part by phenological traits that are expressed at later stages of a plant’s life cycle and that are better characterized in terms of their consequences on reproductive fitness and role in adaptation to spatial heterogeneity. Based on our results, one would expect natural selection at the study site to favor families that have circadian periods closer to the predicted optimum of 24 h in length and that initiate flowering earlier in spring. Temporally replicated experiments in natural conditions are required to quantify the capacity of naturally occurring environmental heterogeneity to alter the optimal circadian and flowering phenotypes across years, a mechanism that could help preserve such within-population variation in a high-elevation habitat characterized by among-year fluctuations, for instance, in seasonal temperature regimes.
Footnotes
Acknowledgements
The authors thank Yulia Yarkhunova for helping with the seed collection in the field, Kathryn Traverso for help in the laboratory, and 2 reviewers for their comments that improved the article. Funding was provided by the National Science Foundation (grant number IOS-1025965 to B.E.E. and C.W.).
Conflict of Interest Statement
The author(s) have no potential conflicts of interest with respect to the research, authorship, and/or publication of this article.