
Abstract
In many animals, the circadian clock plays a role in adapting to the coming season by measuring day length. The mechanism for measuring day length and its neuronal circuits remains elusive, however. Under laboratory conditions, the fruit fly, Drosophila melanogaster, displays 2 activity peaks: one in the morning and one in the evening. These peaks appear to be regulated by 2 separate circadian oscillators (the morning and evening oscillators) that reside in different subsets of pacemaker clock neurons in the brain. The morning and evening activity peaks can flexibly change their phases to adapt to different photoperiods by tracking dawn and dusk, respectively. In this study, we found that cryptochrome (CRY) in the evening oscillators (the fifth small ventral lateral neuron [5th s-LNv] and the dorsal lateral neurons [LNds]) limits the ability of the evening peak to track dusk during long days. In contrast, light signaling from the external photoreceptors (compound eyes, ocelli, and Hofbauer–Buchner eyelets) increases the ability of the evening peak to track dusk. At the molecular level, CRY signaling dampens the amplitude of PAR-domain protein 1 (PDP1) oscillations in most clock neurons during long days, whereas signaling from the visual system increases these amplitudes. Thus, our results suggest that light inputs from the two major circadian photoreceptors, CRY and the visual system, have opposite effects on day length adaptation. Their tug-of-war appears to determine the precise phase adjustment of evening activity.
Introduction
Most animals living outside tropical areas need to anticipate seasonal changes, which allow them to adapt behaviors such as reproduction, diapause, migration, and hibernation. To prepare for the coming season, many animals, including many insect species, use circadian clock–mediated photoperiodic time measurement (Meijer et al., 2010; Saunders and Bertossa, 2011; Koštál, 2010).
The fruit fly, Drosophila melanogaster, which is often used as a model system for studies on circadian rhythms, originated from tropical areas but has long been used to study day length adaptation (Majercak et al., 1999; Pegoraro et al., 2014; Menegazzi et al., 2017).
The degree of day length adaptation can be easily judged from Drosophila’s daily activity pattern: under laboratory conditions, flies display 2 main activity bouts, one in the morning (the so-called morning peak or M-peak) and one in the evening (the so-called evening peak or E-peak) (Helfrich-Förster, 2000), although a third activity peak is additionally observed in the afternoon under seminatural conditions (Vanin et al., 2012; Menegazzi et al., 2012; De et al., 2013; Green et al., 2015). Both activity peaks flexibly change their phase in response to different photoperiods and temperature cycles by tracking dawn and dusk (Rieger et al., 2012; Bywalez et al., 2012). The 2 peaks are regulated by 2 separate oscillators that reside in different subsets of pacemaker clock neurons in the brain (Yoshii et al., 2012). So far, approximately 150 neurons have been classified as pacemaker clock neurons that control activity rhythms. These pacemaker clock neurons are divided into 9 clusters: 3 groups of dorsal neurons (DN1as and DN1ps, DN2s, and DN3ss), the lateral posterior neurons (LPNs), the dorsal lateral neurons (LNds), the fifth small ventral lateral neuron (5th s-LNv), the large ventral lateral neurons (l-LNvs), and the small ventral lateral neurons (s-LNvs) (Helfrich-Förster, 2003; Helfrich-Förster et al., 2007). The M-peak is mainly controlled by the s-LNv clock neurons, which express the neuropeptide pigment-dispersing factor (PDF), and the E-peak is regulated by the 5th s-LNv and the LNd neurons (Grima et al., 2004; Stoleru et al., 2004). The roles of the other clusters of clock neuron, DN1, DN2, DN3, and LPN, are not as well understood, but it has been previously shown that the DN1 group, which consists of approximately 15 cells per brain hemisphere, is composed of morning and evening oscillators (Zhang et al., 2010).
The M and E oscillators are coupled to each other, thereby limiting the phase angle between the M- and E-peaks (ΨM-E) to a strain- and species-specific value for extremely long days (Yoshii et al., 2012; Rieger et al., 2012; Menegazzi et al., 2017). Mutant flies lacking all external photoreceptors (compound eyes, ocelli, and Hofbauer–Buchner [H-B] eyelets) lose the ability to flexibly adjust the phase of the M- and E-peaks to different day lengths (Rieger et al., 2003), suggesting that light input from these photoreceptors allows the 2 oscillators to track dawn and dusk. Besides the external photoreceptors, the Drosophila circadian clock uses cryptochrome (CRY) for light perception. CRY is a UV/blue-light-sensitive protein that is expressed in some of the clock neurons (Stanewsky et al., 1998; Emery et al., 1998; Yoshii et al., 2008; Benito et al., 2008). Once CRY is activated by light, it changes its C-terminal conformation, binds to the core clock protein TIMELESS (TIM), and initiates the degradation of TIM, thereby resetting the molecular clock (Ceriani et al., 1999; Busza et al., 2004; Vinayak et al., 2013).
CRY is expressed in both M- and E-oscillator cells (Klarsfeld et al., 2004; Yoshii et al., 2008; Benito et al., 2008). Limited information is available, however, regarding the role of CRY in M and E oscillators during different photoperiods. In the present study, we show that CRY expression in the E-oscillator cells is responsible for keeping ΨM-E at a certain value during extremely long days, which opposes the ΨM-E-increasing role of the visual system. Thus, we conclude that CRY and the external photoreceptors counterbalance each other, allowing a D. melanogaster–specific adaptation of ΨM-E to long photoperiods under laboratory conditions.
Materials and Methods
Fly Strains
Drosophila melanogaster w1118 (w; Dolezelova et al., 2007) flies were used as a control strain in this study. This line was originally used to create the cry01 mutant; therefore, both have the same genetic background except for the replacement of the cry-locus by a mini-white-containing P-element transgene in the mutant (Dolezelova et al., 2007). To rescue cry expression in a subset of clock neurons, cry01 mutants were crossed with the following transgenic lines: uas-cry (Emery et al., 1998), gmr-gal4 (Freeman, 1996), cry-gal4 #39 (Klarsfeld et al., 2004), Pdf-gal4 (Renn et al., 1999), npf-gal4 (Wu et al., 2003), mai179-gal4 (Grima et al., 2004), Pdf-gal8096A (Stoleru et al., 2004), Clk4.1M-gal4 (Zhang et al., 2010), and R54D11-gal4 (Pfeiffer et al., 2008), as described in Yoshii et al. (2015). w;gmr-hid flies lack all external photoreceptors (Bergmann et al., 1998; Klarsfeld et al., 2004). Heterozygous flies (w;gmr-hid/+) were used for the experiments because they also lack all external photoreceptors, but their morphological damages are relatively moderate compared to those of homozygous flies. s-tim and ls-tim alleles were examined in all strains in a previous study (Yoshii et al., 2015). All strains possess the s-tim allele except for the Pdf-gal80 line that possesses ls-tim. The flies were reared under 12:12 light–dark (LD) cycles on Drosophila medium (0.7% agar, 8.0% glucose, 3.3% yeast, 4.0% cornmeal, 2.5% wheat embryo, and 0.25% propionic acid) at 25 °C.
Activity Recording and Data Analysis
Three- to 6-day-old male flies were used to record locomotor activity rhythms. The flies were confined into recording tubes containing an agar–sugar diet (2% agar and 4% sucrose) for activity monitoring using Drosophila Activity Monitors (DAM2, Trikinetics Inc., MA). The monitors were placed in an incubator (CN-40A, Mitsubishi Electric, Tokyo, Japan) that maintained a constant temperature of 20 (± 0.25) °C. Standard cool white LEDs (LED-PARADAISE, Saitama, Japan) were set above the monitors in the incubator, and lights were controlled by an LC4 light controller (Trikinetics Inc.). The light intensity used in all experiments was 100 Lux (3.2 µW/cm2). To ensure that all strains were completely entrained under LD cycles with different photoperiods, the activity rhythms of all strains were recorded at least for 10 days in the same LD condition. Activity was recorded in 1-min bins by using a conventional infrared light sensor that counted the number of beam crosses for each individual fly.
For visual inspection, raw data were displayed as actograms using ActogramJ (http://actogramj.neurofly.de/; Schmid et al., 2011). To analyze daily activity profiles for each strain and each LD condition, the daily activity profiles of single flies were first calculated on 5 consecutive days (days 10–14). Then, the activity profiles from individual flies were averaged among all flies that survived until the end of the recording period. Finally, the data were smoothed using an 11-point moving average. To determine the phase of the evening activity, the daily activity profiles of individual flies (days 10–14) were plotted, and the phase of the evening peak was manually determined for each fly as previously described (Rieger et al., 2007). For statistical analysis, one-way analysis of variance (ANOVA) with Tukey’s multiple comparison test was used after testing for the normal distribution of data using the Kolmogorov–Smirnov test. Statistical tests were carried out using EZR software (Kanda, 2013).
Immunohistochemistry and Confocal Imaging
Whole flies were fixed in 4% paraformaldehyde in phosphate-buffered saline (PBS) with 0.1% Triton X-100 for 2.5 h at room temperature (RT). Fixed flies were washed 3 times in PBS, and then their brains were dissected. After washing 3 times with PBS containing 0.5% Triton-X (PBS-T), brains were blocked in PBS-T containing 5% normal donkey serum at RT for 1 h and subsequently incubated in primary antibodies for 48 h at 4 °C. After washing 6 times in PBS-T, the brains were incubated with secondary antibodies for 3 h at RT. The brains were then washed 6 times in PBS-T and mounted in Vectashield mounting medium (Vector Laboratories, Burlingame, CA). The primary antibodies used were rabbit anti-PAR domain protein 1 (PDP1; 1:9000; provided by Dr. Justin Blau; Cyran et al., 2003) and mouse anti-PDF (1:1000; Developmental Studies Hybridoma Bank, Iowa City, IA; Cyran et al., 2005). We used the following fluorescence-conjugated secondary antibodies at a 1:500 concentration: Alexa Fluor 555 nm (goat anti-rabbit) and 647 nm (goat anti-mouse) conjugates (Life Technologies, Carlsbad, CA).
Staining was visualized using laser scanning confocal microscopes (FV1200, Olympus, Tokyo, Japan). For quantification of PDP1 immunostaining, the confocal microscope settings were maintained constant throughout the experiments. For each time point, 9 hemispheres from 9 different brains were analyzed. Measurement of staining intensity was performed using Fiji (Schindelin et al., 2012), as described previously (Yoshii et al., 2009a).
Results
Effects of CRY and the Presence of Eyes on ΨM-E
w control, cry01 (no cry), and gmr-hid/+ (no external eyes) strains were subjected to 3 different photoperiods: LD 12 h:12 h (LD12:12), LD16:8, and LD20:4, to examine their locomotor activity rhythms. As previously reported, the control flies showed 2 distinct activity peaks in LD12:12, one in the morning and one in the evening (Fig. 1; Rieger et al., 2003). In LD16:8, the phase of the M-peak almost coincided with lights-on, whereas the phase of the E-peak was approximately 2 h before lights-off. In LD20:4, the phase of the E-peak was even more advanced in relation to lights-off. The ΨM-E in LD12:12, 16:8, and 20:4 were 10.6 ± 0.1 h (mean ± SEM, n=30), 13.4 ± 0.1 h (n=28), and 12.2 ± 0.1 (n=30), respectively (Fig. 2). Thus, the ΨM-E was significantly extended in LD16:8 compared with LD12:12, whereas there was no further extension in LD20:4 compared with LD16:8. The ΨM-E in LD20:4 was slightly but significantly shorter than in LD16:8. This may suggest that LD20:4 is beyond the limit of the possible extension of ΨM-E, and then the coupling between the M and E oscillators in some flies is oriented toward maintaining a regular ΨM-E.
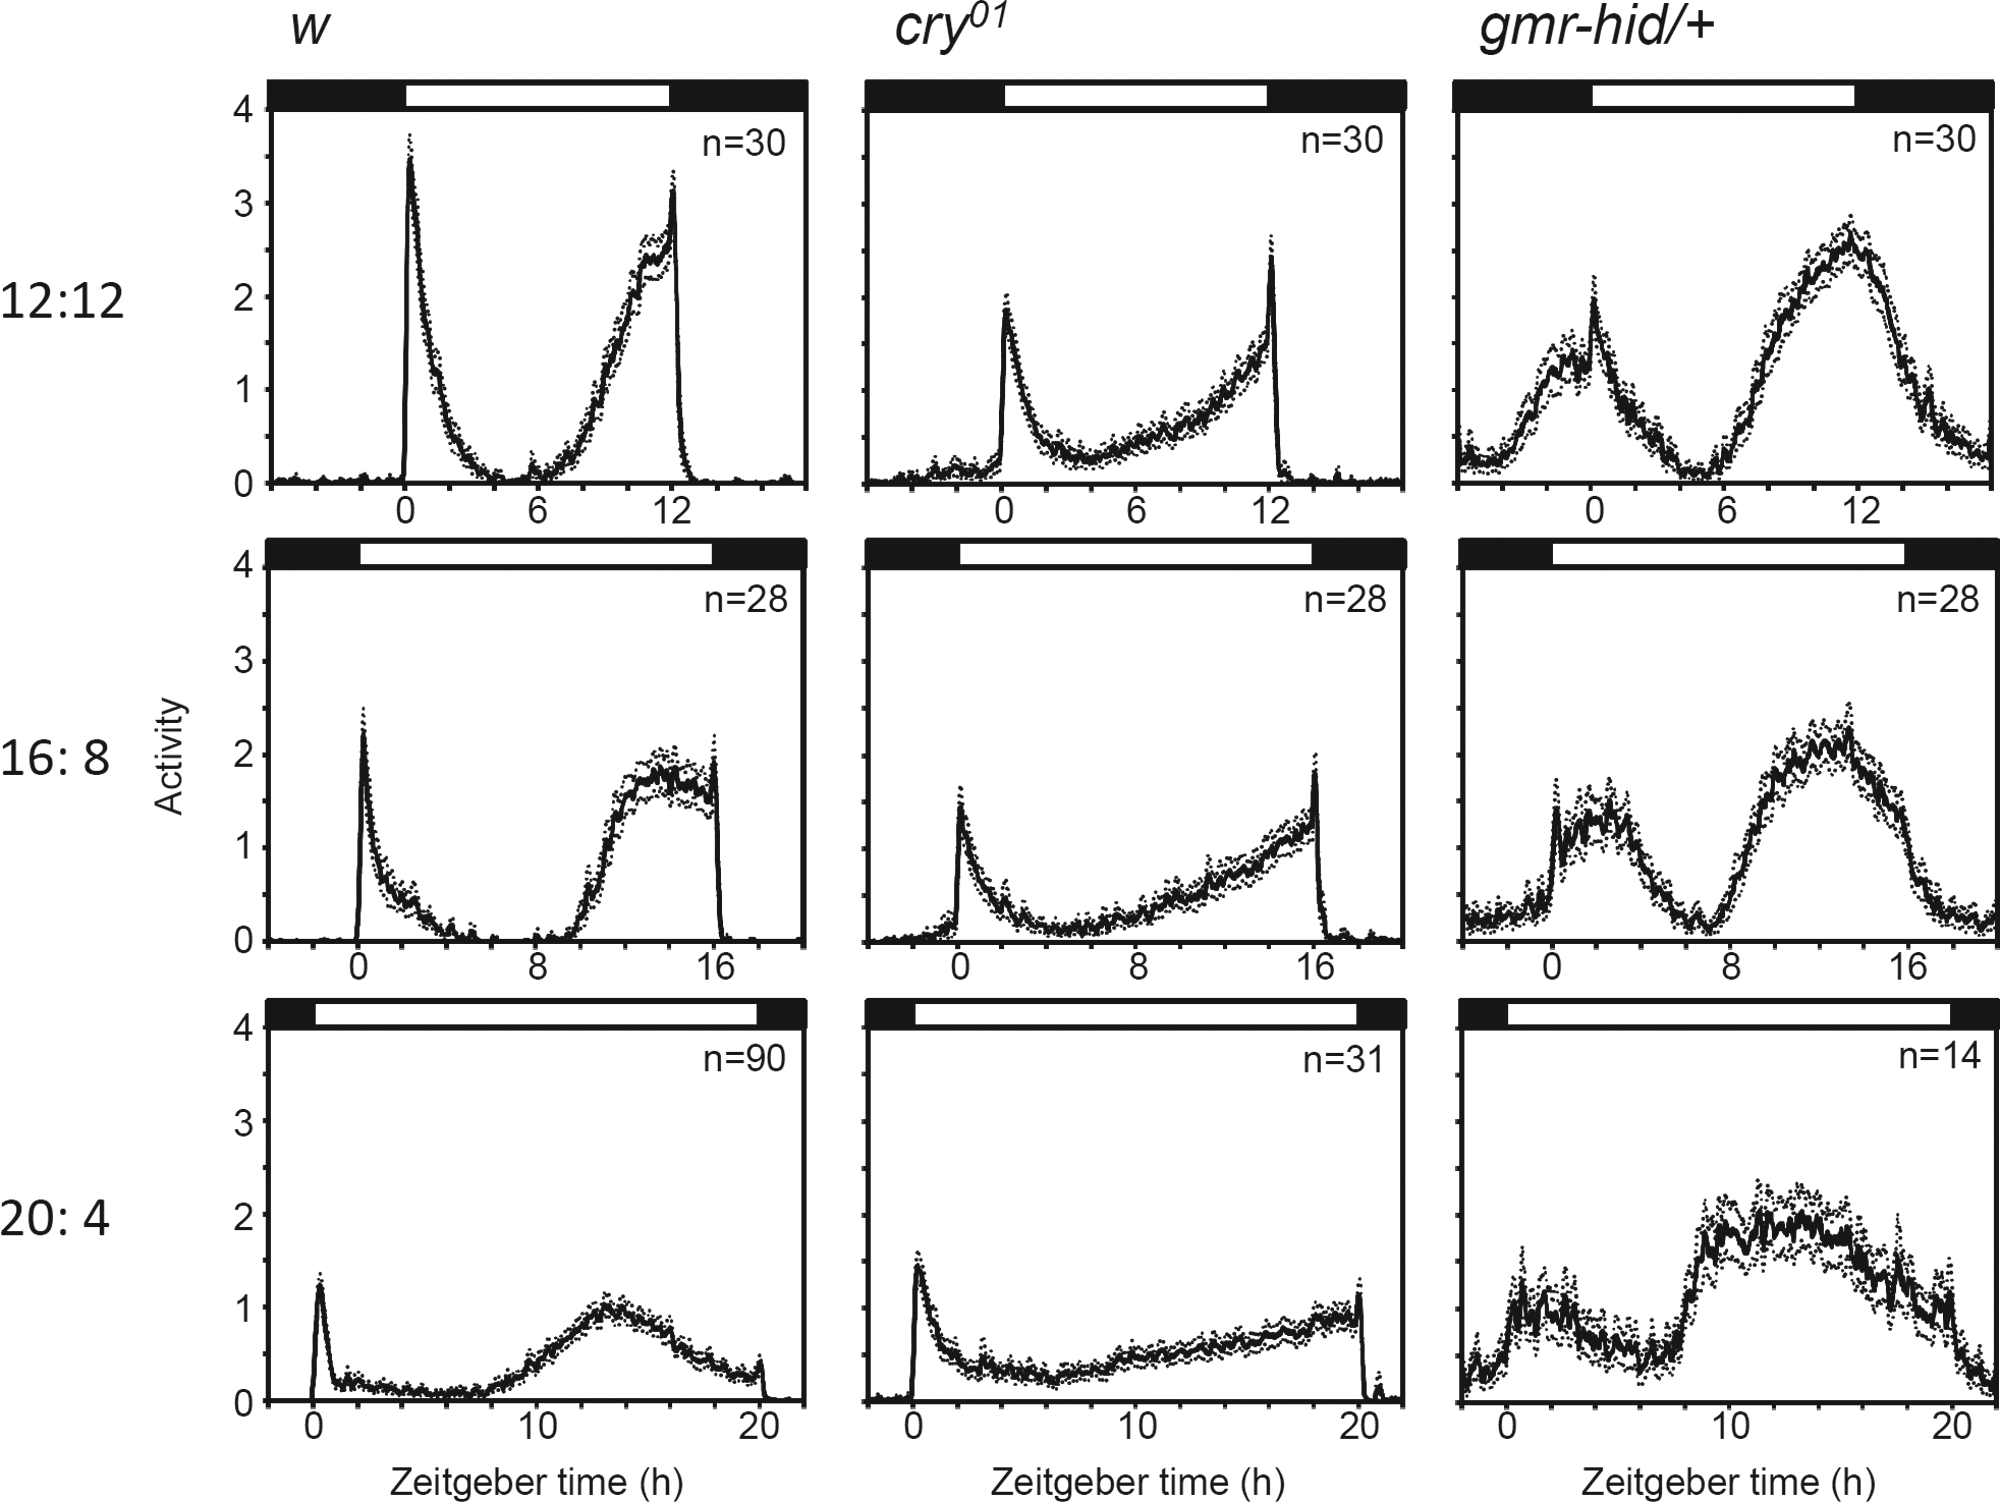
Activity profiles (mean ± SEM) of the 3 strains (w control, cry01, and gmr-hid/+) of flies under LD12:12, LD16:8, and LD20:4 photoperiods. Activity was recorded on 15 days with the same photoperiod to ensure that the flies were completely entrained. The mean activity was calculated from data obtained on days 10–14 (5 days), followed by smoothing with a moving average of 11 points.
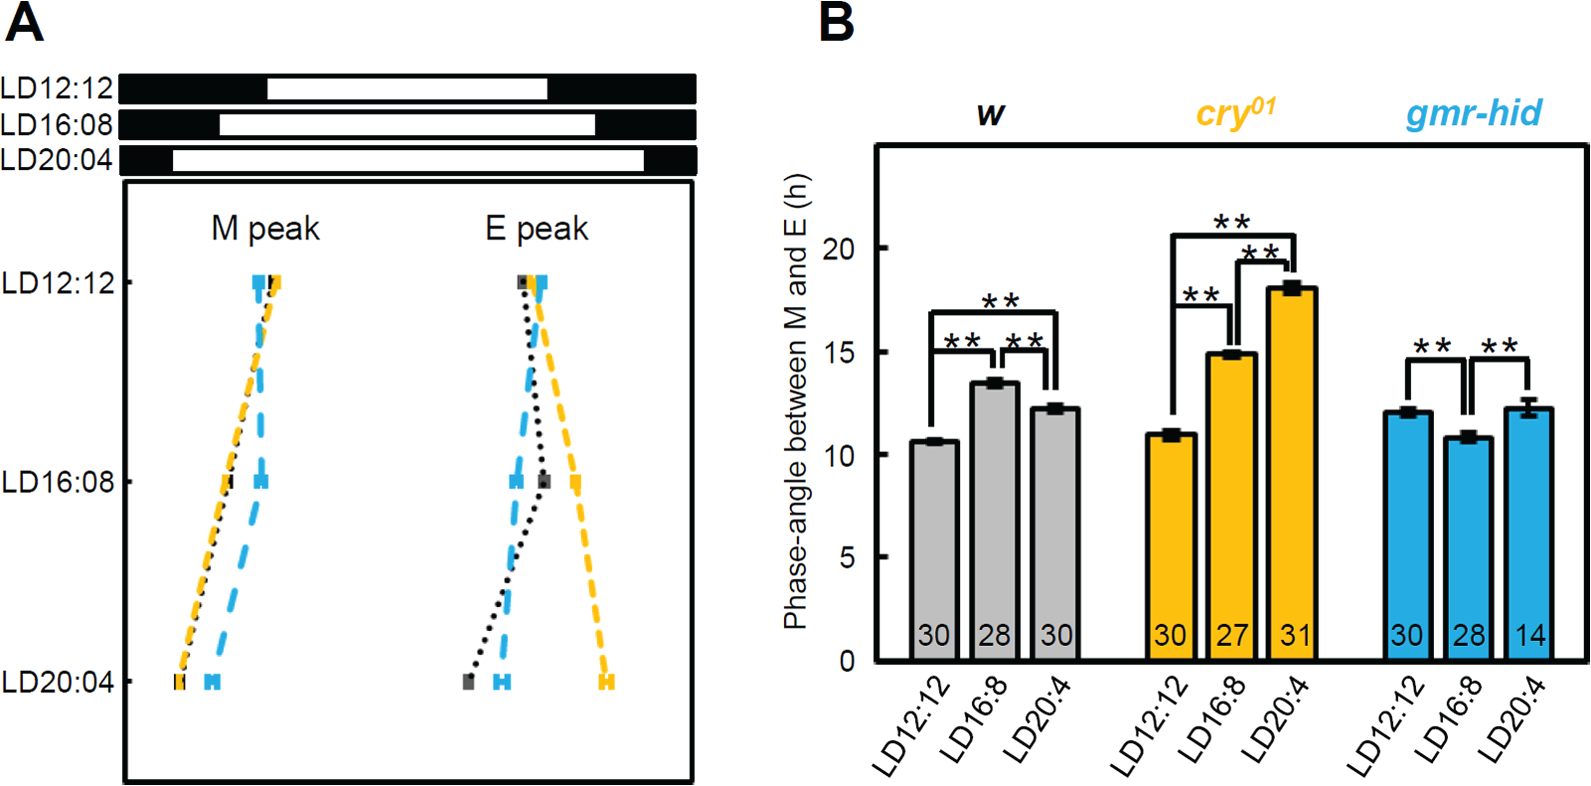
Phase angle relationship between morning (M) and evening (E) activity peaks. (A) Phases (mean ± SEM) of the M- and E-peaks of w control (black), cry01 (orange), and gmr-hid/+ flies (light blue) under 3 photoperiods. (B) Phase angle (mean ± SEM) between M– and E–peaks of w control (gray), cry01 (orange) and gmr-hid/+ flies (light blue) under 3 photoperiods. The phase angle of w control flies in LD16:8 became larger compared to LD12:12 but was not further extended in LD20:4. The phase angle of cry01 flies extended as the photoperiod lengthened, whereas that of gmr-hid/+ flies was rather insensitive to the photoperiod. Numbers in the columns indicate the number of flies used. **p<0.01, one-way analysis of variance (ANOVA) followed by Tukey’s multiple comparison test.
cry01 mutants can be even more flexible and further extend the ΨM-E during long days (Figs. 1 and 2). As in the control flies, the phases of the M-peak were close to lights-on in all photoperiods. Following the trough after the M activity, the E activity gradually increased and peaked at lights-off even under LD20:4. ΨM-E extended to 18.1 ± 0.2 h (n=31) under LD20:4, reflecting a highly flexible ΨM-E. This result suggests that the CRY-dependent light entrainment limits the extension of ΨM-E under extremely long photoperiods.
gmr-hid/+ eyeless flies behaved differently compared to cry01 mutants when subjected to long photoperiods (Figs. 1 and 2). They also showed distinct M- and E-peaks but responded with subtler changes at lights-on and -off, suggesting that photoreception from the external photoreceptors caused the drastic responses to light changes (Rieger et al., 2003). The phase of the M-peak followed lights-on in all photoperiods, whereas the phase of the E-peak was directed away from lights-off, resulting in ΨM-E remaining constant under the 3 conditions. This finding is in agreement with a previous study, in which it was shown that the ΨM-E of photoreceptor mutants such as clieya, so1, and hdcJK910 was insensitive to changes in day length, although many of those mutants were not able to entrain to LD20:4, presumably due to a different light intensity and/or light source used (Rieger et al., 2003). Thus, CRY- and eye-mediated photoreception has an opposite effect on the ΨM-E. Because the M-peak could largely follow dawn in all photoperiods, the differences in ΨM-E are mainly caused by differences of the E-peak in its ability to follow dusk. Therefore, the phase adjustment of the E-peak became the primary focus of the remaining experiments.
Effects of CRY and the External Photoreceptors on the Molecular Clock
Although fruit flies show a bimodal activity pattern, the molecular oscillations of the clock proteins PER, TIM, and PDP1 have a unimodal shape with one distinct peak and trough every 24 h (Shafer et al., 2002; Nitabach et al., 2006). Furthermore, under LD12:12, PER and TIM maxima and minima, respectively, do not occur ~10 h out of phase in the clock neurons controlling morning and evening activity. Only slight phase differences in PER and TIM oscillations have been observed among the different clock neurons (Bachleitner et al., 2007; Yoshii et al., 2009a; Menegazzi et al., 2013). This indicates that the control of morning and evening activity occurs downstream of the molecular clock.
Nevertheless, if the clock measures day length, some changes in the molecular cycling of the clock proteins must occur when day length is extended from 12 h to 20 h. There is some evidence that PER and TIM oscillations become slightly out of phase during natural long summer days (Vanin et al., 2012; Menegazzi et al., 2013), but nothing is known about the oscillations in the second molecular feedback loop that leads to a cycling of the circadian protein Clock (Clk) and stabilizes the first feedback loop (Brown et al., 2012). Therefore, we decided to investigate the cycling of PDP1 in all clock neurons of the 3 strains under 12:12 and 20:4 LD cycles.
As expected, we observed only small differences in the timing of PDP1 cycling between the different clock neurons (Fig. 3 and Suppl. Fig. S1). In all clock neurons, levels of PDP1 peaked during the night and troughed during the day. Furthermore, the phases of the PDP1 oscillations in most of the clock neurons were similar between LD12:12 and LD20:4. A small delay of the PDP1 minimum and maximum was observed in the LNds of cry01 mutants during long days (Fig. 3), but the degree of the phase delay was not as great as the changes observed in behavior.
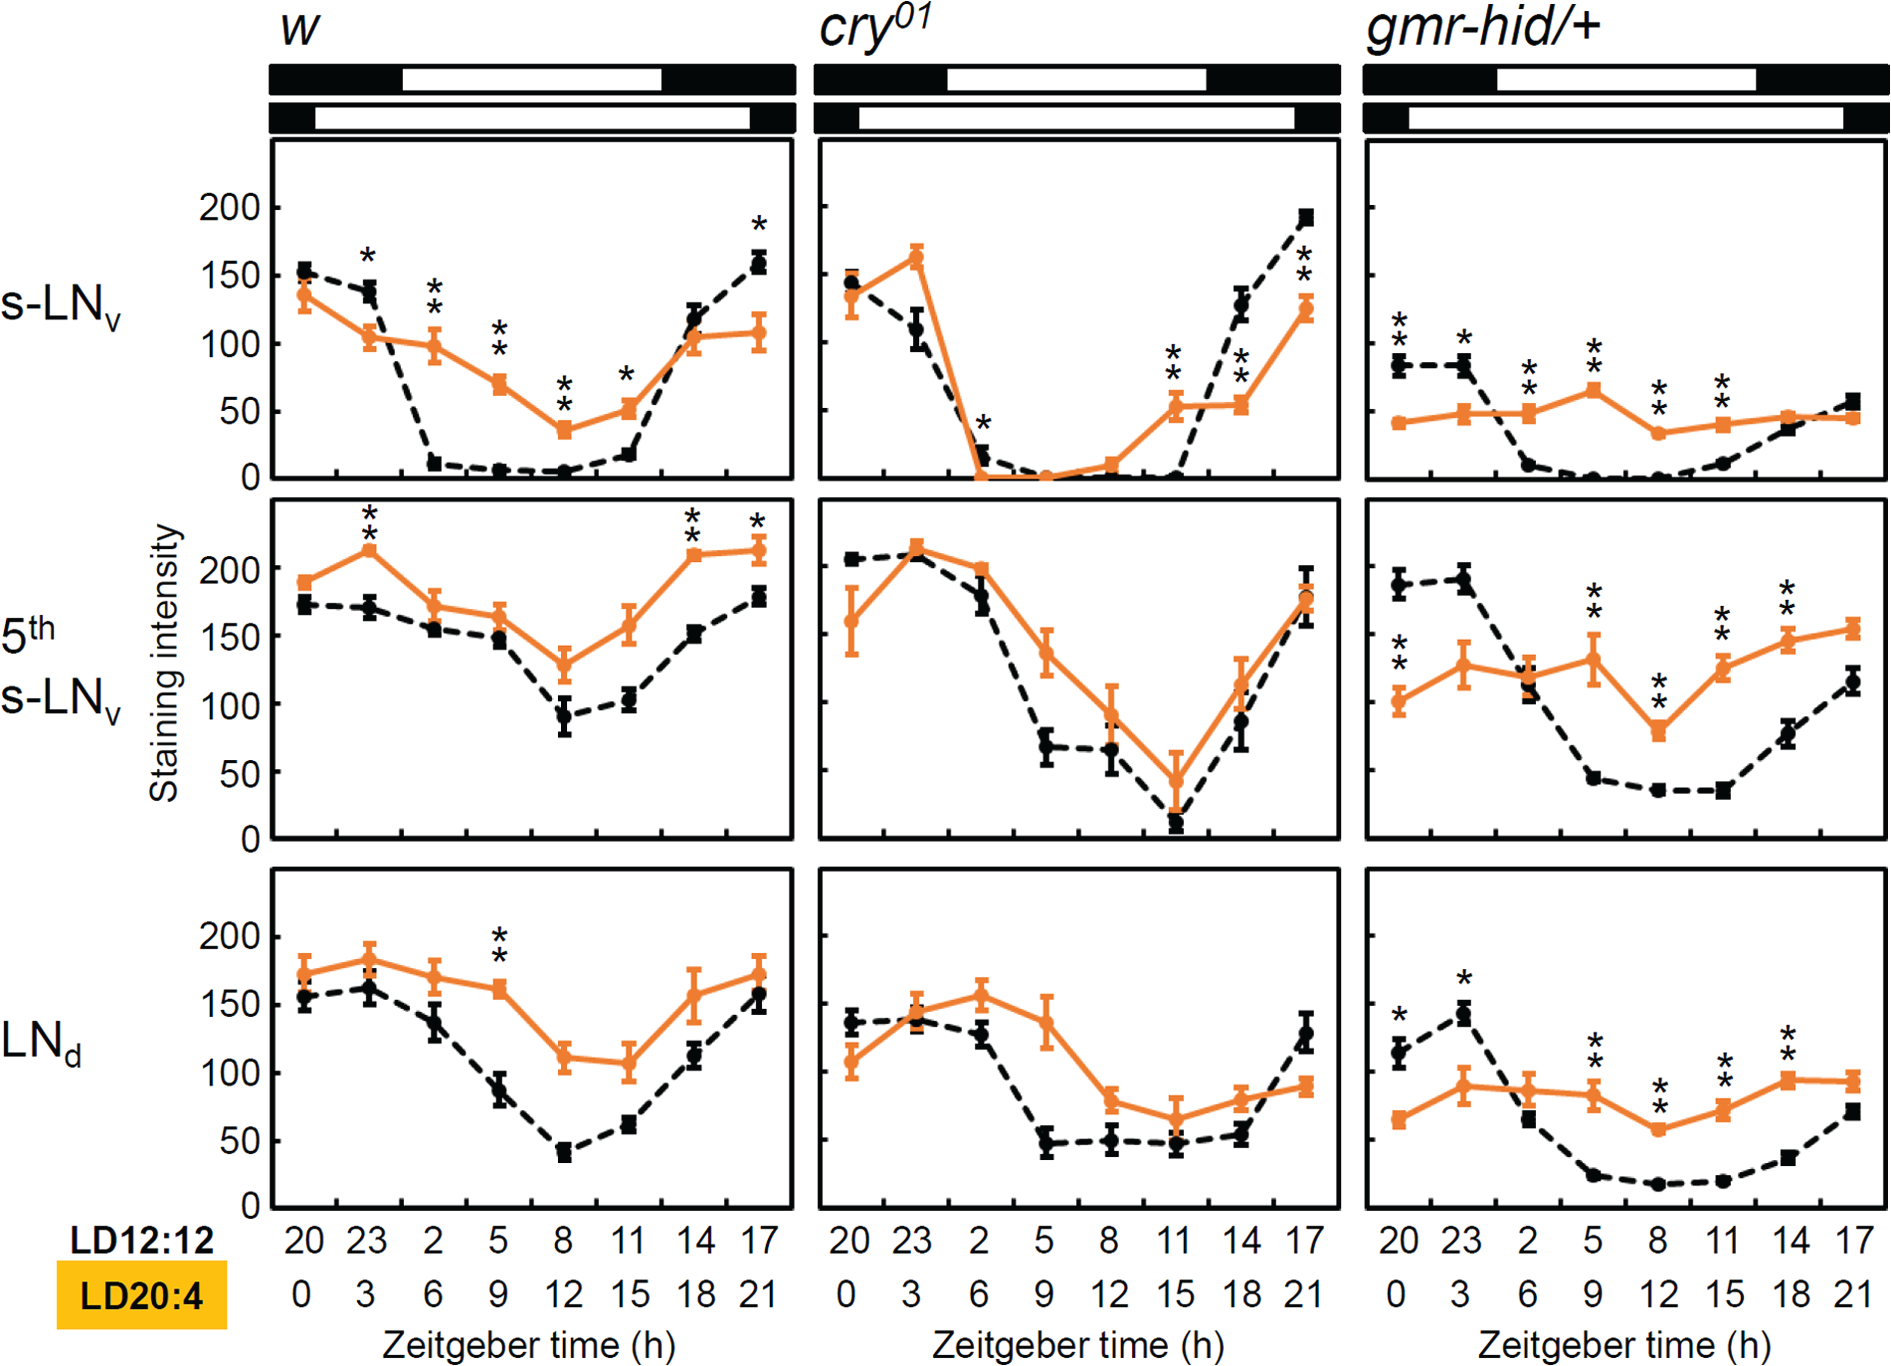
PAR-domain protein 1 (PDP1) clock protein oscillation of w control, cry01, and gmr-hid/+ flies under LD12:12 (black, dashed line) and LD20:4 (orange, solid line). Mean PDP1 staining intensity (± SEM) was calculated from the measurements of 9 hemispheres in 9 different brains. PDP1 oscillations were plotted from midnight for the 2 photoperiods as shown in the activity rhythms (Fig. 1). The amplitudes of PDP1 oscillations in M (s-LNv) and E oscillators (5th s-LNv and LNd) were dependent on strains and photoperiods. For other clock neuronal clusters, see Supplementary Figure 1. *p<0.05, **p<0.01; Mann–Whitney U test followed by Bonferroni correction.
The most striking differences occurred in the amplitude of PDP1 cycling. First, the PDP1 cycling amplitude was very different in the 3 strains. In cry01 mutants, PDP1 cycled with the highest amplitude, control flies showed an intermediate amplitude, and flies without external photoreceptors (gmr-hid/+ flies) had the lowest amplitude. In addition, PDP1 cycling amplitude was highly dependent on day length. During LD20:4, it was significantly decreased in control and gmr-hid/+ flies as compared to during LD12:12. Only in cry01 mutants did no reduction in PDP1 cycling amplitude occur under LD20:4. Thus, CRY and the external photoreceptors have opposite effects on PDP1 cycling amplitude.
The l-LNv, DN1a, DN1p, and DN2 clock neurons showed obvious PDP1 cycling under LD12:12 in the control flies, whereas PDP1 expression was not clearly rhythmic in cry01 and gmr-hid/+ flies (Suppl. Fig. S1). Thus, these clock neurons need light-input signals from both CRY and the visual system to express a robust molecular rhythm. Because the DN2 clock neurons are CRY-negative, CRY-dependent light sensing in the CRY-positive clock neurons would be required for molecular oscillation of PDP1 in the DN2 neurons.
Restoration of CRY in E Oscillators
CRY is present in many brain neurons and in the compound eyes (Yoshii et al., 2008; Benito et al., 2008). CRY expression in the eyes plays a role in visual sensitivity (Mazzotta et al., 2013), and CRY expression in the clock neurons is important for circadian light entrainment (Emery et al., 2000; Lamba et al., 2014; Yoshii et al., 2015). To investigate whether CRY expression in the clock neurons is important for long-day adaptation, we rescued cry expression in a cry01 background using the GAL4–UAS system and recorded activity rhythms under LD20:4 (Fig. 4). When we rescued cry expression with cry-gal4 (all cry-positive cells), mai-gal4 (3 CRY-positive LNds, the 5th s-LNv, approximately 2 l-LNvs, and s-LNvs and one DN10a), mai-gal4/Pdf-gal80 (3 CRY-positive LNds, the 5th s-LNv, and one DN1a), npf-gal4 (one CRY-positive LNd, 2 CRY-negative LNds, the 5th s-LNv, and 1–2 l-LNvs), and R54D11-gal4 (one CRY-positive LNd, the 5th s-LNv, one l-LNv, and 1–2 s-LNvs), the phase of the E-peak was restored to wild-type levels (Figs. 1 and 4). In contrast, cry rescue in the PDF neurons (l-LNv and s-LNv, Pdf-gal4), the DN1p neurons (Clk4.1M-gal4), and the eyes (gmr-gal4) did not restore the wild-type phenotype. These results suggest that cry rescue in the 5th s-LNv and the LNds effectively restores the phase of the E-peak under LD20:4, which is in line with the current Drosophila model proposing that the 5th s-LNv and the LNd neurons are E oscillators.
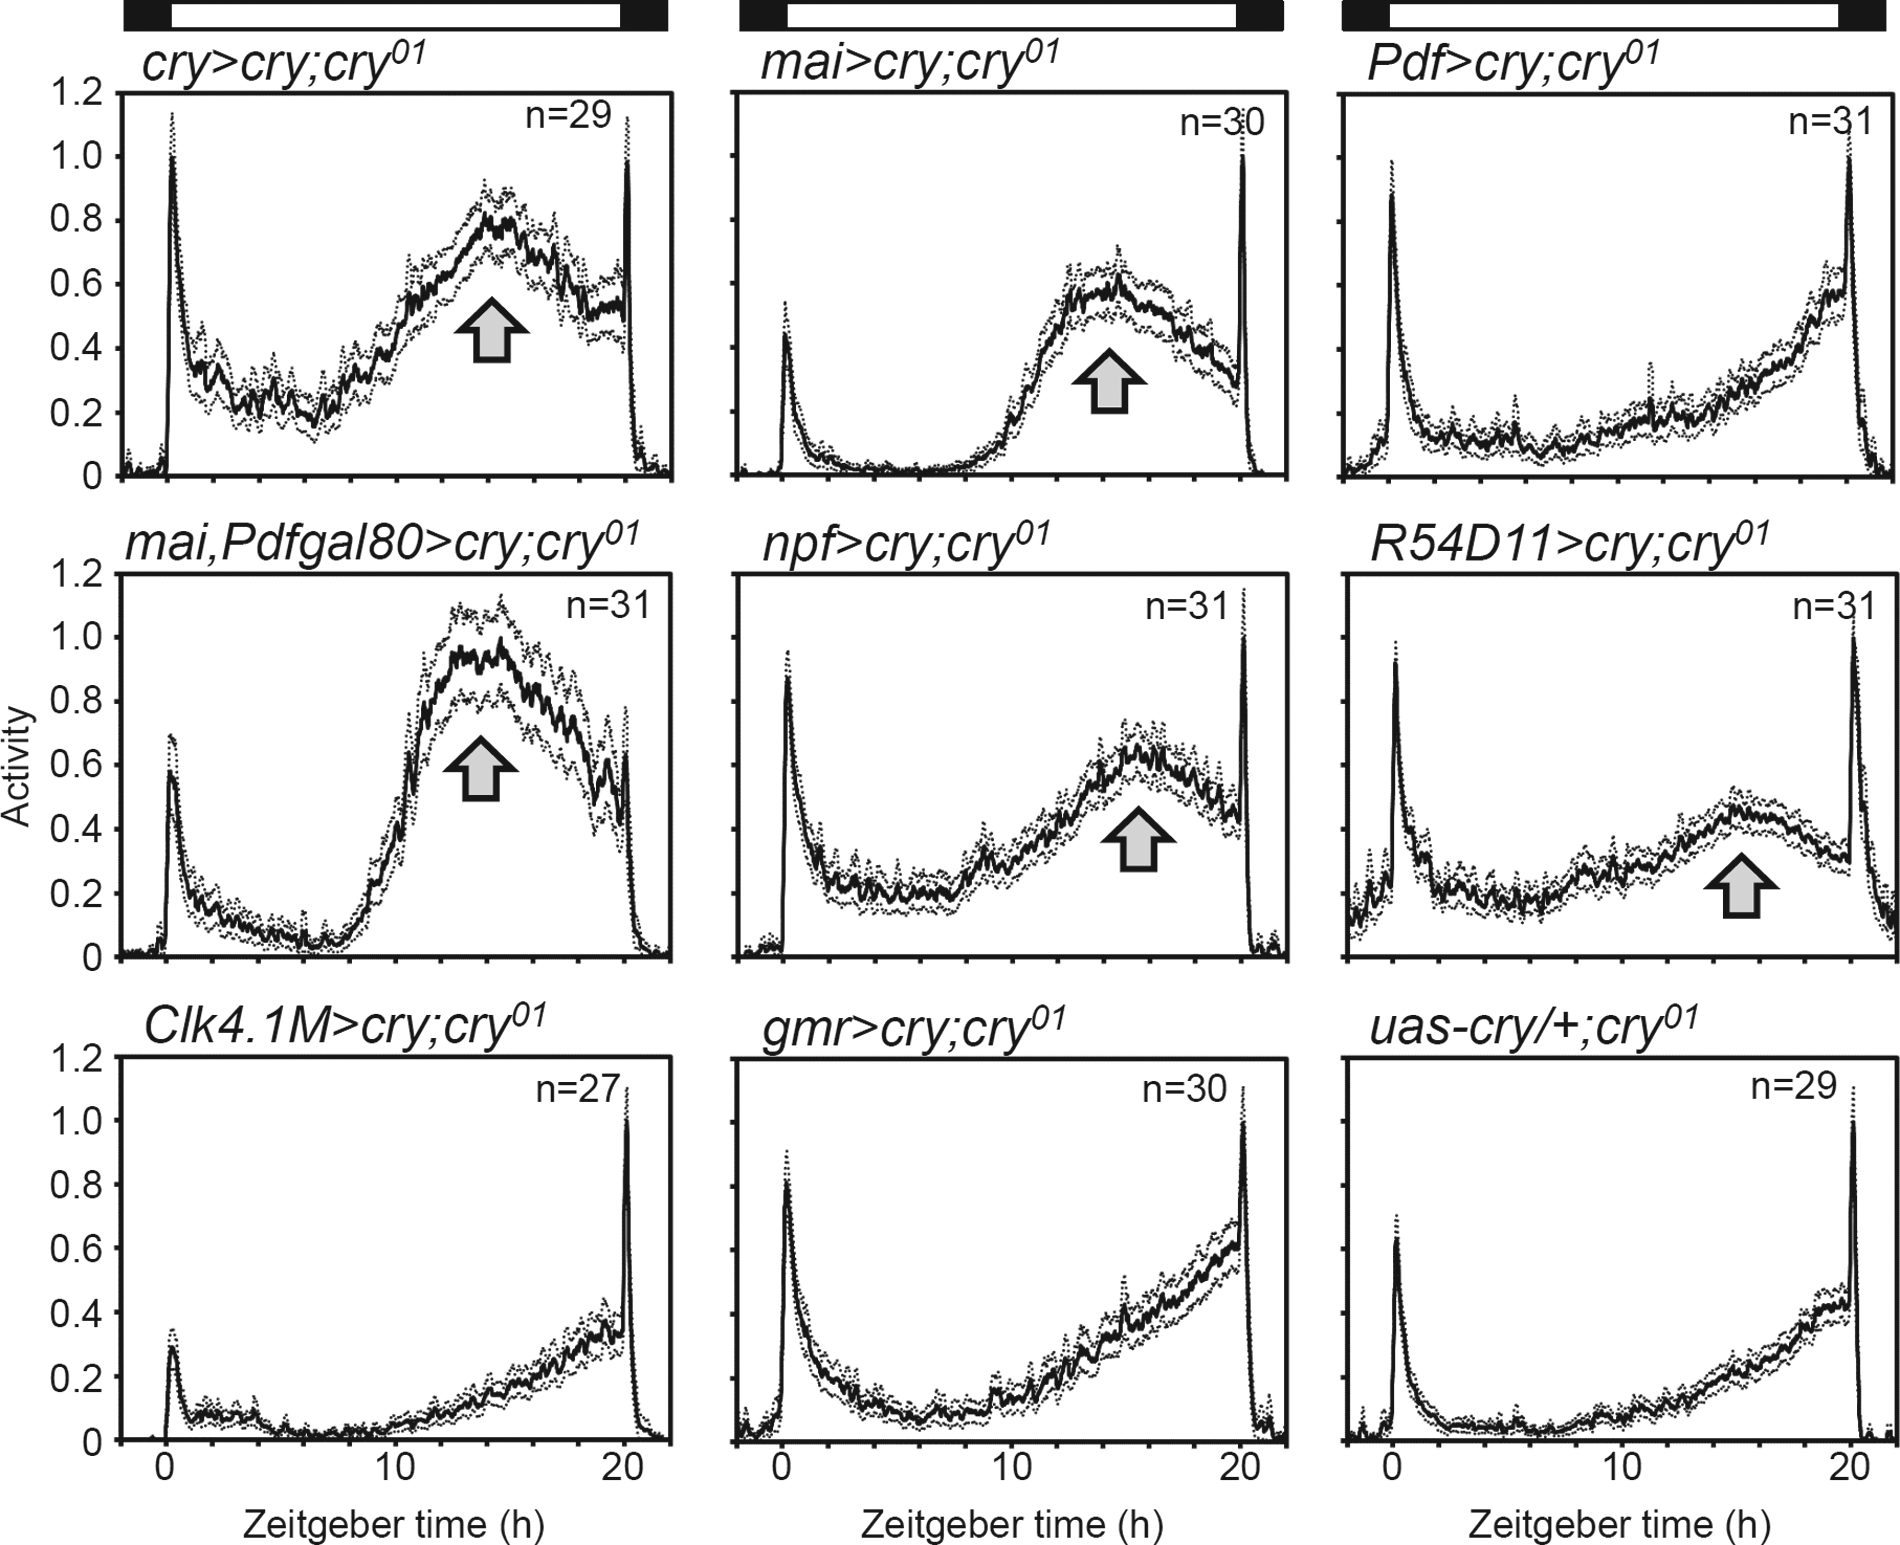
Activity profiles (mean ± SEM) of flies in which cry expression was rescued in certain clock neurons under LD20:4. Cry rescue using cry-gal4, mai-gal4, mai-gal4/Pdf-gal80, npf-gal4, and R54D11-gal4 restores control like E-peaks (arrows).
cry-gal4 and mai-gal4 restore CRY expression in all CRY-positive LNds, whereas npf-gal4 and R54D11-gal4 restore it only in one of the CRY-positive LNds. The partial rescue of cry in a different number of LNds is reflected in the ΨM-E: flies in which cry expression was rescued in one CRY-positive LNd showed a longer ΨM-E than the flies in which cry expression was rescued with cry-gal4, mai-gal4, and mai-gal4/Pdf-gal80 (Figs. 4 and 5). Thus, CRY expression in the 5th s-LNv and all 3 CRY-positive LNds is required for maintaining a normal ΨM-E in LD20:4.
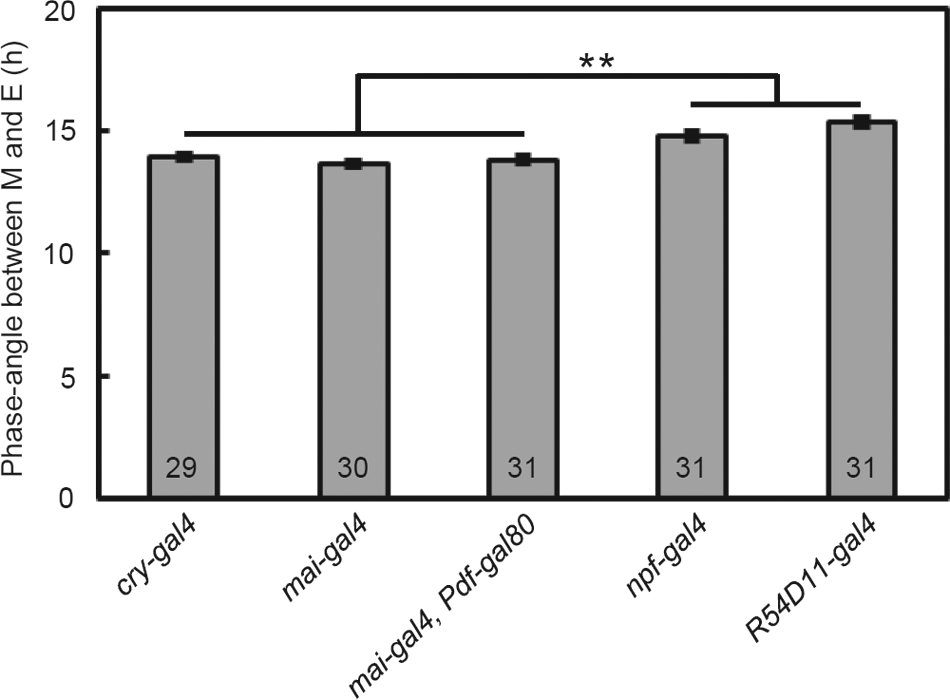
Phase angle (mean ± SEM) between M and E peaks of the flies in which cry was rescued in the 5th s-LNv and LNds under LD20:4. The flies in which cry was rescued in all CRY-positive LNds (cry-gal4, mai-gal4 and mai-gal4/Pdf-gal80) showed significantly shorter ΨM-E than the flies in which cry was rescued in a part of the CRY-positive LNds (npf-gal4 and R54D11-gal4). There was no statistical difference between the cry rescued strains with cry-gal4, mai-gal4, and mai- mai-gal4/Pdf-gal80 and between the cry rescued strains with npf-gal4 and R54D11-gal4. Numbers in the columns indicate the number of flies used. **p<0.01, one-way analysis of variance (ANOVA) followed by Tukey’s multiple comparison test.
Discussion
The original 2-oscillator model proposed by Pittendrigh and Daan (1976) nicely explains the split rhythms of M and E activity under constant light conditions in the hamster. The 2 oscillators that control M and E activity have different responsiveness to light, accelerating the speed of the M oscillator and decelerating that of the E oscillator, thereby allowing the M and E oscillators to track dawn and dusk, respectively. At the behavioral level, a similar phenomenon can be observed in Drosophila melanogaster (Majercak et al., 1999; Helfrich-Förster, 2000), and the neurons representing the 2 oscillators have been characterized (Grima et al., 2004; Stoleru et al., 2004). Therefore, Drosophila is an excellent model to study the contributions of the circadian clock to the anticipation of seasonal changes.
In the present study, we focused on the photoreceptors involved in the phase adjustment of the E activity peak under long-day conditions. We demonstrated that the light input mediated by CRY limits the ability of the E-peak to follow dusk during long days, whereas the light input from the external photoreceptors enables a flexible phasing of the E-peak. CRY and the external photoreceptors also had opposite effects on PDP1 oscillation in clock neurons, decreasing and increasing the amplitude of the oscillations, respectively, during long days.
Both CRY and the external photoreceptors are highly sensitive to light but have different effects on the clock (Helfrich-Förster et al., 2002; Vinayak et al., 2013). For example, CRY is important for rapid light entrainment (Kistenpfennig et al., 2012), whereas the external photoreceptors play a role in moonlight detection and slow entrainment (Helfrich-Förster et al., 2001; Bachleitner et al., 2007; Yoshii et al., 2016). The visual system comprises photoreceptor cells expressing 6 different rhodopsins, which also have roles in light entrainment (Szular et al., 2012; Schlichting et al., 2014; Saint-Charles et al., 2016). Using multiple light input pathways, the Drosophila clock can be precisely entrained by light in a short period of time (Helfrich-Förster et al., 2001; Yoshii et al., 2015). Given that light-activated CRY promotes TIM degradation in a cell-autonomous way (Ceriani et al., 1999; Busza et al., 2004), a long light exposure would simply decelerate the speed of the clock in all CRY-positive clock neurons, including the M and E oscillators, due to slow accumulation of the clock proteins PER and TIM (Marrus et al., 1996). Therefore, the CRY pathway would not be suited to individually change the speed of the M and E oscillators, although the CRY-negative clock neurons, such as the DN2s, can indirectly be influenced by the CRY pathway probably through a neural network (Suppl. Fig. S1; Yoshii et al., 2015). In contrast, the effects of the external photoreceptors under long light exposure are more complex; cry mutants display split rhythms under constant light conditions, with the M-peak free-running with a short period and the E-peak splitting into 2 components, one with a short period and the other with a long period (Yoshii et al., 2004; Rieger et al., 2006; Dolezelova et al., 2007). This suggests that the external photoreceptors differently affect the M and E oscillators by accelerating and decelerating the speed of the clocks. Therefore, light-input signaling from the external photoreceptors would be more suited to allow a flexible ΨM-E.
We also found that the amplitude of PDP1 oscillations is correlated with ΨM-E under long photoperiods: a high amplitude correlates with a flexible ΨM-E, and a low amplitude with a rigid ΨM-E. This is different from how the mammalian suprachiasmatic nucleus (SCN) responds to long photoperiods. Measurement of single-cell Period-1 bioluminescence reveals that the posterior SCN clocks track dawn, whereas the anterior SCN clocks contain 2 populations that track dawn and dusk (Inagaki et al., 2007; Naito et al., 2008), suggesting that the SCN is composed of at least 2 different oscillators generating distinct molecular oscillations. In contrast, in Drosophila, it seems that the M and E oscillators do not follow dawn and dusk by phasing the molecular oscillations, but rather measure day length by changing the amplitude of the molecular oscillations. PDP1 is, however, just one of the clock components, and its role in the clock mechanism is still under debate, because 2 different functions, transcription of the Clk gene and a role downstream of the circadian clock, have been proposed previously (Benito et al., 2007; Zheng et al., 2009). Thus, PDP1 oscillation might not represent the status of the clock, and further analysis of other major clock proteins such as PER and TIM would be required.
How one-peak molecular oscillations that change amplitude with changing photoperiods can control the phase of the E-peak is, however, unknown. PDP1 cycling is very similar in M and E clock neurons (Fig. 3). Nevertheless, only the cry rescue in the E oscillators restores the wild-type phase of the E activity peak (Fig. 4). This confirms that distinct oscillator cells are responsible for the E-peak (Grima et al., 2004; Stoleru et al., 2004). It is possible that the amplitude of the molecular oscillations in the M and E neurons encodes different temporal outputs. By measuring intracellular Ca2+ levels in vivo, Liang et al. (2016, 2017) recently demonstrated that the neuronal activity of the M neurons occurs 10–12 h before the neuronal activity of the E neurons in LD12:12. Furthermore, the time between Ca2+ peaks in the M and E neurons increased during long days. Thus, the amplitude of the molecular oscillations may influence the phase of the Ca2+ peaks in the M and E neurons in opposite directions. Liang et al. (2016, 2017) also revealed that PDF/PDF-receptor signaling from the M to the E neurons together with light inputs determines the phase of the Ca2+ rhythms in the E neurons. The amplitude of the molecular oscillations may influence daily PDF secretion. Small-amplitude molecular oscillations in the M neurons may lead to a small amount of constant PDF secretion, resulting in phase-advanced Ca2+ rhythms in the E neurons and an early E-peak as seen in Pdf0 mutants (Renn et al., 1999; Yoshii et al., 2009b). In contrast, high-amplitude molecular oscillations may lead to a high amount of secreted PDF, which may delay the Ca2+ rhythms in the E neurons and consequently also delay the E-peak (Schlichting et al., 2016; Menegazzi et al., 2017). The interactions between molecular oscillations, neuropeptide signaling, and Ca2+ rhythms need to be further elucidated in future studies.
Footnotes
Acknowledgements
We would like to thank J.C. Hall, F. Rouyer, A Klarsfeld, M. Rosbash, P.H. Taghert, R. Stanewsky, P. Emery, P.E. Hardin, M. Freeman, P. Shen, and the Bloomington stock center for providing the fly lines. We are also grateful to J. Blau and the DSHB for providing antibodies. This work was funded by the Japan Society for the Promotion of Science (KAKENHI 23870021, 25840121, and 15H05600) and the German Research Foundation (DFG Grant FO207/15-1). C.K. was supported by JSPS Fellowship PE12050.
Author Contributions
C.K., M.N., R.N., and T.Y. performed and analyzed the experiments. K.T. and C.H-F. provided data analysis, lab equipment, and technical supports. T.Y. and C.H-F. wrote the manuscript.
Conflict of Interest Statement
The author(s) have no potential conflicts of interest with respect to the research, authorship, and/or publication of this article.
Notes
References
Supplementary Material
Please find the following supplemental material available below.
For Open Access articles published under a Creative Commons License, all supplemental material carries the same license as the article it is associated with.
For non-Open Access articles published, all supplemental material carries a non-exclusive license, and permission requests for re-use of supplemental material or any part of supplemental material shall be sent directly to the copyright owner as specified in the copyright notice associated with the article.