
Abstract
Complex interactions of environmental cues and transcriptional clocks drive rhythmicity in organismal physiology. Light directly affects the circadian clock; however, little is known about its relative role in controlling metabolic variations in vivo. Here we used high time-resolution sampling in Drosophila at every 2 h to measure metabolite outputs using a liquid-chromatography tandem mass spectrometry (LC-MS/MS) approach. Over 14% of detected metabolites oscillated with circadian periodicity under light-dark (LD) cycles. Many metabolites peaked shortly after lights-on, suggesting responsiveness to feeding and/or activity rather than the preactivity anticipation, as observed in previous transcriptomics analyses. Roughly 9% of measured metabolites uniquely oscillated under constant darkness (DD), suggesting that metabolite rhythms are associated with the transcriptional clock machinery. Strikingly, metabolome differences between LD and constant darkness were observed only during the light phase, highlighting the importance of photic input. Clock mutant flies exhibited strong 12-h ultradian rhythms, including 4 carbohydrate species with circadian periods in wild-type flies, but lacked 24-h circadian metabolic oscillations. A meta-analysis of these results with previous circadian metabolomics experiments uncovered the possibility of conserved rhythms in amino acids, keto-acids, and sugars across flies, mice, and humans and provides a basis for exploring the chrono-metabolic connection with powerful genetic tools in Drosophila.
Diurnal patterns in organismal physiology arise from a complex interaction of environmental inputs, such as light and food, with endogenous circadian clocks. Synchrony of these clocks with predictable environmental patterns confers a selective advantage, particularly to maintain metabolic homeostasis amidst anticipatory activity and feeding behaviors (Edery, 2000). The intersection of metabolism and circadian rhythms is of increasing interest (reviewed by Bass, 2012). Correlations of clock dysfunction with metabolic pathologies are increasingly evident. Major metabolic organs display rhythmic physiology, which includes cyclic insulin secretion from the pancreas (Perelis et al., 2015); therefore, it is perhaps not surprising to find clock disruptions associated with diabetes, obesity, and metabolic syndrome in genetic mouse models (Marcheva et al., 2010; Turek et al., 2005). These associations are alarming given the ubiquity of circadian disruption in modern society, including the high prevalence of shift work and increased light exposure at all hours of the night. Adiposity, weight, lipid, and glucose metabolism are the most common alterations found in animal studies modeling disruptions in sleep, light, and feeding (Opperhuizen et al., 2015), although much work remains to delineate impacts of environmental cues on metabolic variations. Specifically, while the impact of light on transcriptional clocks is understood (Emery et al., 1998), metabolic variations associated with both light-dark cycles and genetic clocks have not been directly addressed.
The mechanisms of the core endogenous circadian clock were first described in Drosophila melanogaster, where the core clock consists of a transcription-translation feedback loop very similar in structure to mammalian clocks (Glossop and Hardin, 2002). The CLOCK/CYCLE (CLK/CYC) complex binds to E-box elements to drive expression of many gene products, including period and timeless (reviewed in Hardin, 2011). These protein products (PER and TIM) dimerize and translocate to the nucleus to repress CLK/CYC activity. Timely degradation of TIM is followed by turnover of PER, which breaks the repressive arm of the clock and allows CLK-CYC-mediated transcriptions to resume. This clock mechanism exists across most fly tissues, including metabolically active organs such as the fat body (functionally similar to the mammalian liver and adipose). While flies have served well to uncover the architecture of circadian processes, relatively few studies have used flies as a model organism in chrono-metabolic studies. The interaction of the core clock with metabolic homeostasis has been established through analysis, including comparative transcriptomics, of the fat body (Xu et al., 2011). Oscillations of transcripts in the fat body are controlled by clocks in the fat body or the brain (Xu et al., 2011; Erion et al., 2016; Barber et al., 2016) and most are also influenced by the time of feeding; however, the extent of circadian control on metabolism has not yet been established.
Circadian transcriptomics in mice have shown a striking enrichment of oscillating transcripts for rate-limiting metabolic enzymes (Panda et al., 2002). Many of these metabolic enzymes also display ultradian patterns of 8- or 12-h periods, which may reflect the impact of feeding and behavior on metabolism superimposed on the canonical 24-h pattern. Circadian and ultradian metabolite cycles have recently been discovered in mouse liver through use of liquid chromatography mass spectrometry (LC-MS) metabolomics with high sampling resolution (Krishnaiah et al., 2017). Metabolomics is an increasingly popular approach to uncover metabolic rhythms through holistic analysis of metabolites by MS or nuclear magnetic resonance (NMR) (Rhoades et al., 2017). While informative, previous studies have not incorporated key experimental design considerations in understanding circadian processes. Most circadian metabolomics studies in animals have used 4- or 6-h sampling resolution (Abbondante et al., 2016; Chaix et al., 2014; Eckel-Mahan et al., 2013), which is adequate to discern 24-h periods but may not be sufficient to discover ultradian metabolic patterns (Krishnaiah et al., 2017). Additionally, in these studies, tissues or blood is harvested under light-dark conditions, which does not allow for separation of environment- and clock-associated metabolic patterns. True circadian patterns can be discerned following an entrainment protocol and exhibit a period length of roughly 24 h, independent from environment cycles. For example, the circadian rhythm can be ascertained only in constant environmental conditions, such as constant darkness (DD) for in vivo systems.
In this study, we sought to profile small polar metabolites with 2-h resolution in Drosophila under both light-dark (LD) and DD conditions. In addition to discerning associations of metabolic and environmental cycles, we analyzed per mutant flies under LD to separate light-regulated metabolic cycles from genetic clocks. To provide a broad spectrum of metabolites, we used LC-MS, and we chose to analyze fly bodies to reduce confounding effects from the brain and eyes. Univariate periodicity algorithms and multivariate statistical models were used to discern both metabolite oscillations under a functional clock and broader metabolic shifts in the context of both light-dark cycles and the per mutation. The metabolite rhythms we report here have been noted across species, suggesting that flies will serve an important role in deriving mechanistic understanding of the chrono-metabolic connection.
Materials and Methods
Drosophila Strains
Both fly strains (Drosophila melanogaster), which included Iso31 (isogenic w1118 stock) and per01 mutants (Konopka and Benzer, 1971), were maintained at 25 °C in 12:12-h LD conditions on standard cornmeal/molasses medium.
Fly Entrainment and Collection
Male flies were sorted shortly after eclosion and were entrained in LD incubators for a minimum of 3 days before circadian collection, by which time all flies were 5 to 10 days of age. Wild-type flies were either maintained in LD conditions (WT-LD) or placed in constant darkness for a minimum of 24 h before collection to assess light-independent rhythms (WT-DD), while per01 flies were maintained in LD cycles (Per-LD). Two vials, each containing 12 flies, were collected at each time point to serve as biological duplicates for ZT0 to ZT22 at 2-h intervals. Zeitgeber time (ZT) 0 corresponds to lights-on, with lights-off at ZT12.
Metabolite Extraction and LC-MS/MS Metabolomics
Fly heads and bodies were separated before metabolite extraction (which excluded the wings but maintained the cuticle intact). Via a method adapted from the Bligh-Dyer extraction (Bligh and Dyer, 1959), 600 µL of cold 2:1 methanol:chloroform was added to the fly body samples and homogenized in a bead-based tissue homogenizer at 25 Hz for 4 min (TissueLyser II; Qiagen, Hilden, Germany). Then, 200 µL of both water and chloroform was added, followed by centrifugation at 18,787 × g for 7 min at 4 °C. Next, 350 µL of the upper layer, comprising the aqueous layer, was separated and dried down overnight under vacuum. Samples were resuspended in 100 µL of 50:50 water:acetonitrile for LC-MS injection. Liquid chromatography conditions and mass spectrometer parameters for hydrophilic interaction chromatography (HILIC) analysis for small polar metabolites were executed as previously reported (Rhoades and Weljie, 2016). Then, 5-µL injections were performed for each sample in duplicate on a Waters Acquity H-Class UPLC coupled to a Waters TQ-S micro-mass spectrometer (Milford, MA), using an XBridge BEH Amide column for chromatographic separation (2.1 × 150 mm, 2.5 µm). The LC solvents consisted of 95:5 water:acetonitrile with 20 mM ammonium acetate at pH 9 (mobile phase A) and acetonitrile for mobile phase B. The gradient was changed from 15% to 70% mobile phase A over 5 min at 0.15 mL/min, followed by an isocratic hold for 10 min. The column was washed in 98% mobile phase A and then reequilibrated in starting conditions for 5 min before the next injection. The MS operated in ion-switching mode with a capillary voltage of 3 kV for electrospray positive mode (ESI+) and 2 kV for negative mode (ESI–). The desolvation gas flow was set to 900 L/h and desolvation temperature at 450 °C, with the source temperature set at 150 °C. Metabolites were detected using multiple reaction monitoring (MRM), with mass transitions and voltages optimized as previously described. For metabolites without a clear identification, these signals were labeled by their mass transition and retention time on the LC chromatogram: for example, Unknown_245.08->113.03_5.56, representing a metabolite with parent ion mass 245.08, daughter ion mass 113.03, and retention time at 5.56 min.
Data Processing and Analysis
LC-MS chromatograms were processed using TargetLynx under MassLynx version 4.1. Ion counts were exported and processed in R (version 3.3). Quality control (QC) samples, which consisted of a pooled sample of all biological samples, were injected at the beginning of the batch for LC column equilibration and every 8 injections during the analysis to account for instrumental drift. For every metabolic feature, a locally weighted scatterplot smoothing function (LOESS) was fit to the QC data, which was then used as a normalization factor for the samples as a function of run order. Additionally, metabolic features that appeared in less than 50% of the QC samples and displayed a relative standard deviation (RSD) greater than 30% were dropped from the final dataset. Those that remained (236 of the 345 metabolic features) were considered reliably detected metabolites. Principal components analysis (PCA) was performed in SIMCA 14.0 (UMetrics, Umeå, Sweden) to observe data integrity through balanced scores and loadings plots. This criterion guided additional data normalization measures, which we addressed through total sample intensity normalization after LOESS correction. Technical replicate values were than averaged and analyzed for rhythmicity using the ARSER algorithm (Yang and Su, 2010) in the MetaCycle R package (version 1.1; Wu et al., 2016). As ARSER cannot handle missing data, missing values were imputed through mean-imputation within the set of reliably detected metabolites for a single metabolite’s observed values, and each circadian time replicate was spread out across 48 h for rhythmicity testing, which was performed twice through shuffling the replicates to guard against replicate bias. Note that only the 236 metabolites that passed the QC criteria were used for missing value imputation, biological group comparisons, and ARSER analysis. These 2 ARSER results were then averaged before filtering lists of significant cyclers, testing period lengths of 20 to 28 h, 12 h, and 8 h.
For block-testing, values in each of the 3 biological groups were further divided into 4 windows, consisting of values from ZT0-6, ZT6-12, ZT12-18, and ZT18-24. These groups were then tested in a univariate manner, metabolite by metabolite, both across time blocks and across biological groups. The resulting p values from 2-sided t tests were adjusted through a Benjamini-Hochberg false discovery rate correction using the stats R package (version 3.3, Benjamini and Hochberg, 1995). For multivariate assessment of global metabolic shifts within and across biological groups, orthogonal partial least squares discriminant analysis (OPLS-DA) models were fit in SIMCA 14.0, with model validity assessed through a cross-validation Q2 value and CV-ANOVA p value (Eriksson et al., 2006). Plots were made using VennDiagram v1.6, heatmap3 v1.1, and ggplot2 v2.2.
Results
Circadian and Light-induced Rhythms Identified in Wild-type Flies
Rhythmicity tests in WT flies under LD conditions revealed 34 metabolites with period lengths between 20 and 28 h, which represents 14.4% of the 236 detected metabolites (i.e., the entire set of metabolites that passed QC criteria in our data-processing procedures) and contains an abundance of sugars and acylcarnitines (p < 0.05 and q < 0.3; Fig. 1A, Suppl. Table S1). Seven metabolites exhibited a 12-h period, and 11 metabolites exhibited an 8-h period in this WT-LD. Twenty-nine metabolites yielded true circadian patterns in the WT-DD condition, with 7 metabolites overlapping the WT-LD group (fructose, 3-hydroxybutyrate, acetyl-amino sugars, gluconate, an unknown monosaccharide, ribitol/xylitol, riboflavin) (Fig. 1, B and C). The strengths of rhythms, by comparison of amplitudes, were not significantly different between 20- to 28-h cyclers in WT-LD and WT-DD (Suppl. Fig. S1). We were thus able to identify sets of metabolite rhythms associated with endogenous clocks, LD cycles, or both.
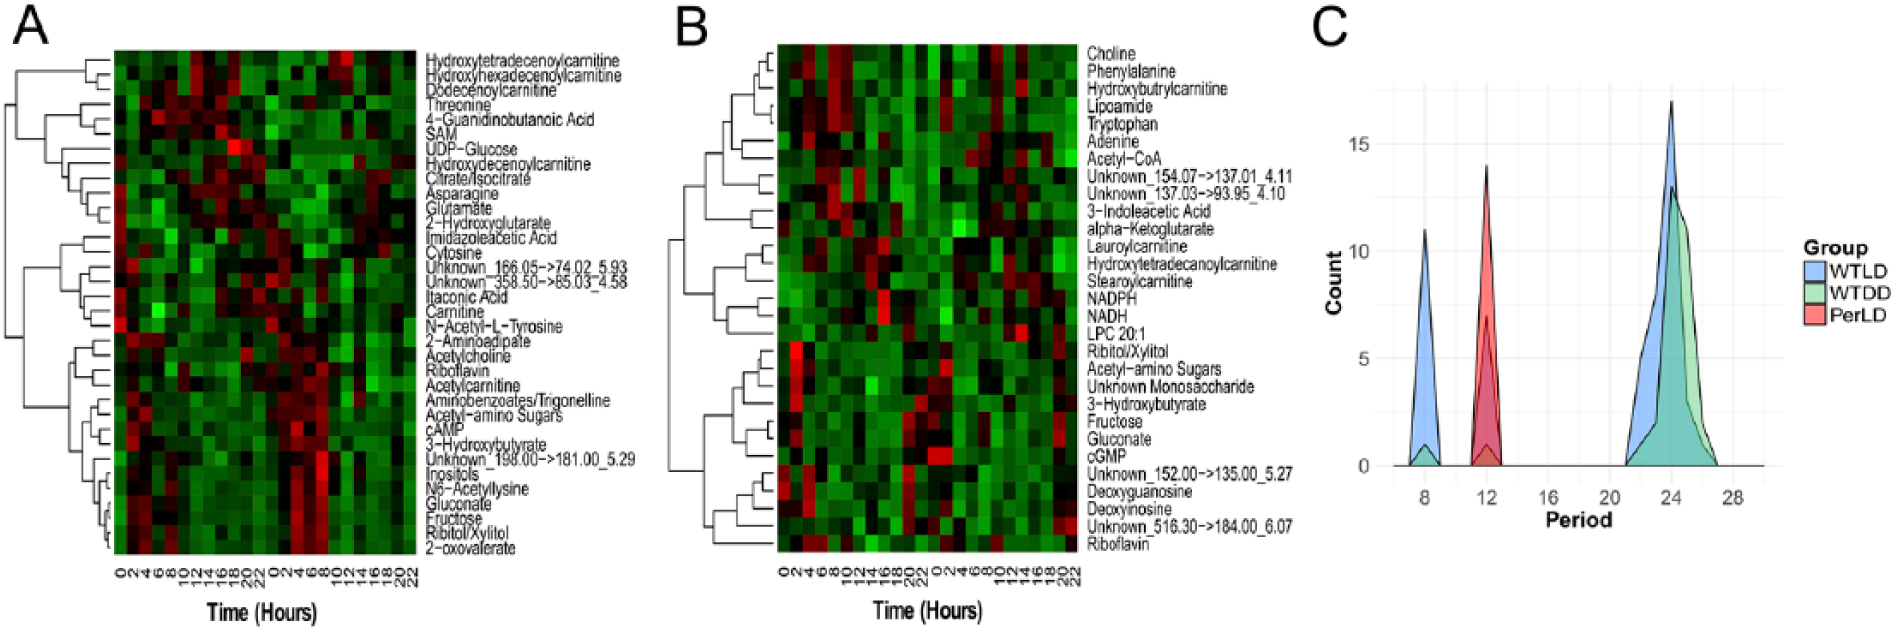
Identification of metabolites expressed rhythmically in fly bodies. (A) Metabolites that significantly cycle with 20- to 28-h periods in WT-LD (p < 0.05, q < 0.3, ARSER algorithm). (B) Metabolites that significantly cycle with 20- to 28-h periods in WT-DD (p < 0.05, q < 0.3, ARSER algorithm). (C) Density of circadian periods by group, whereby ARSER testing occurred at 8-h, 12-h, or 20- to 28-h searches.
Ultradian Metabolites Enriched in per Mutants
No circadian metabolites or ultradian metabolites of 8-h periods were detected in per flies; however, we noted an abundance of metabolites with 12-h periods (Suppl. Table S1). Interestingly, the amplitudes for these cyclers were significantly higher than those of 12-h cyclers in the WT-LD condition (p = 0.001; Suppl. Fig. S1). Four of these metabolites displayed a clear rhythm even with a more stringent significance criterion at q < 0.1. While no overlapping metabolites arose across 12-h cyclers in WT-LD and Per-LD conditions, ten out of fourteen 12-h cyclers in the Per-LD condition were found in the 20- to 28-h list for WT-LD (2-oxovalerate, fructose, acetyl-amino sugars, gluconate, ribitol/xylitol, inositols, N6-acetyllysine, cAMP, acetylcholine, and aminobenzoates/trigonelline), and cGMP additionally overlapped with WT-DD (Fig. 2). Thus, of these fourteen 12-h cyclers, only three did not also oscillate in WT-LD or WT-DD (imidazole, bisphosphoglycerate, aconitate). Four metabolites overlapped across all three lists; these consisted only of carbohydrates (fructose, acetyl-amino sugars, ribitol/xylitol, gluconate; Fig. 2A) and may reflect a consequence of complex interactions of light- and clock-associated feeding behavior. Of note, the amplitudes of these carbohydrate rhythms were on average 1.76- and 1.85-fold higher in WT-LD over WT-DD and Per-LD, respectively (p = 0.004 and p = 0.013, paired Student t test).
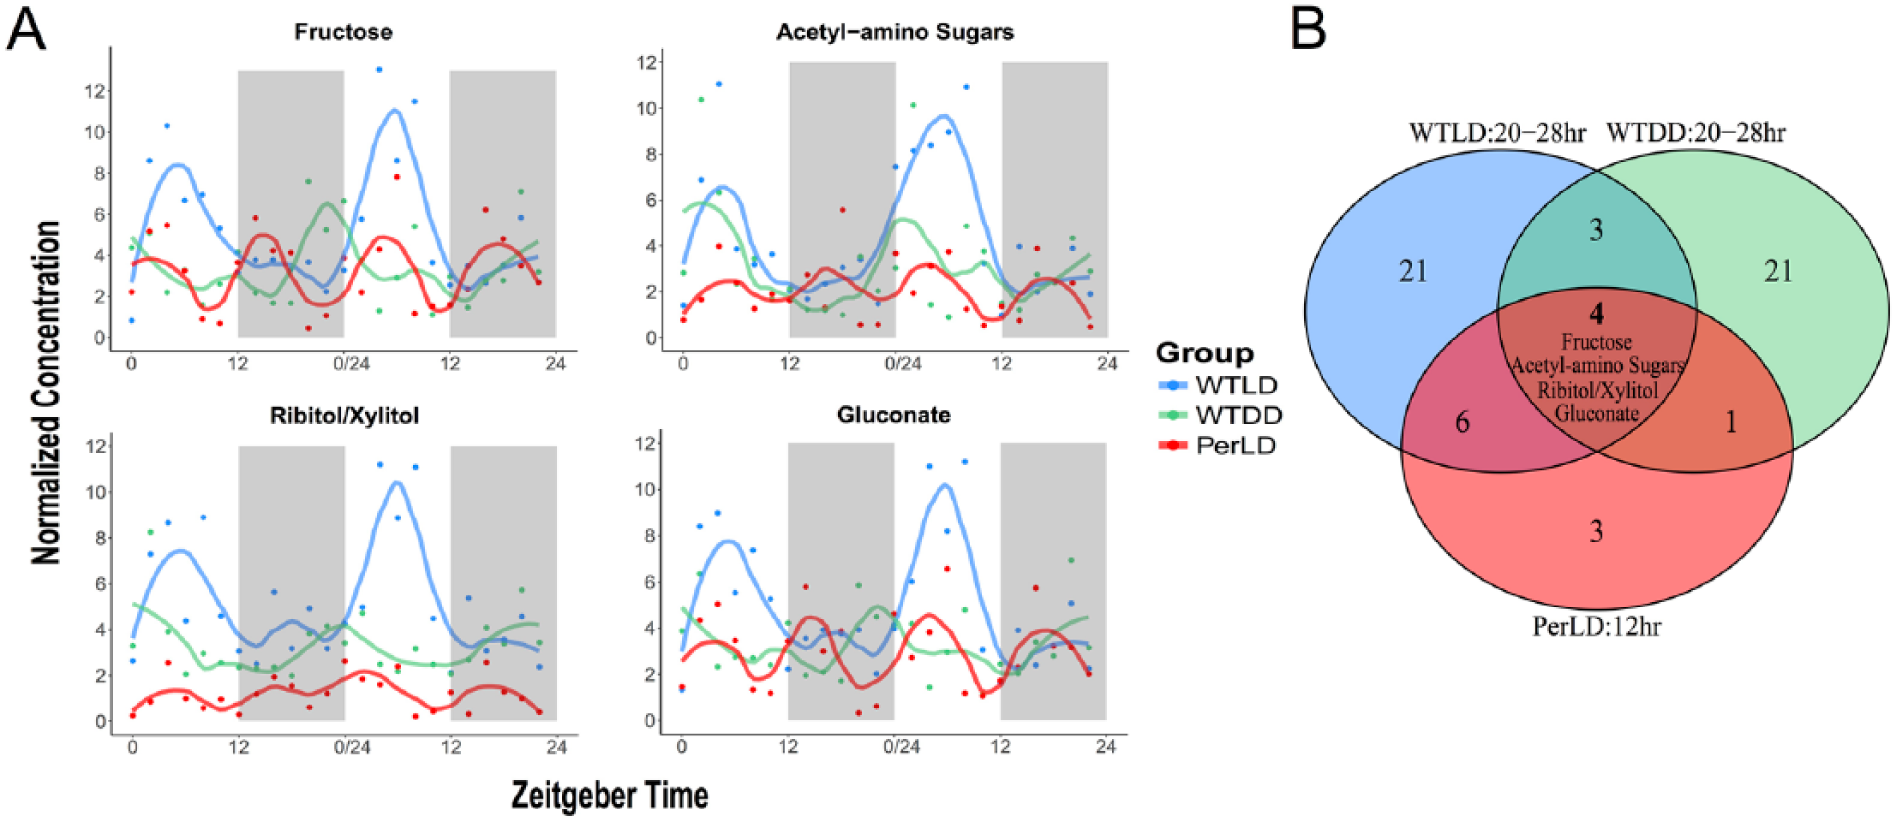
Effects of light and the clock on the pattern of cycling metabolites. (A) Time-course concentrations of the 4 carbohydrate species that oscillate with 20- to 28-h periods in WT and a 12-h period in per, with larger amplitudes noted in WT-LD compared with WT-DD and Per-LD by way of a paired t test (p = 0.004 and p = 0.013, respectively). (B) Overlapping cycling metabolites across all 3 groups with unique periods.
Unique Phases in Significant Metabolites across Experimental Groups
Of the significant cyclers with a 20- to 28-h period in WT-LD, we noted major phases of metabolites in the morning (ZT4-6) and at the end of the active phase (ZT12). In contrast, peak expression of cycling metabolites in DD was largely condensed toward the end of the active phase (Fig. 3A). The abundance of 12-h cyclers in Per-LD also had highly condensed phases, with antiphasic peaks in the early light and dark phases and an absence of the evening rush seen in the WT-LD (Fig. 3B). Additionally, the 7 metabolites that overlap with WT-LD and WT-DD displayed dramatically different phases under these 2 conditions, which was most strikingly the case for the sugar compounds (Fig. 3C).
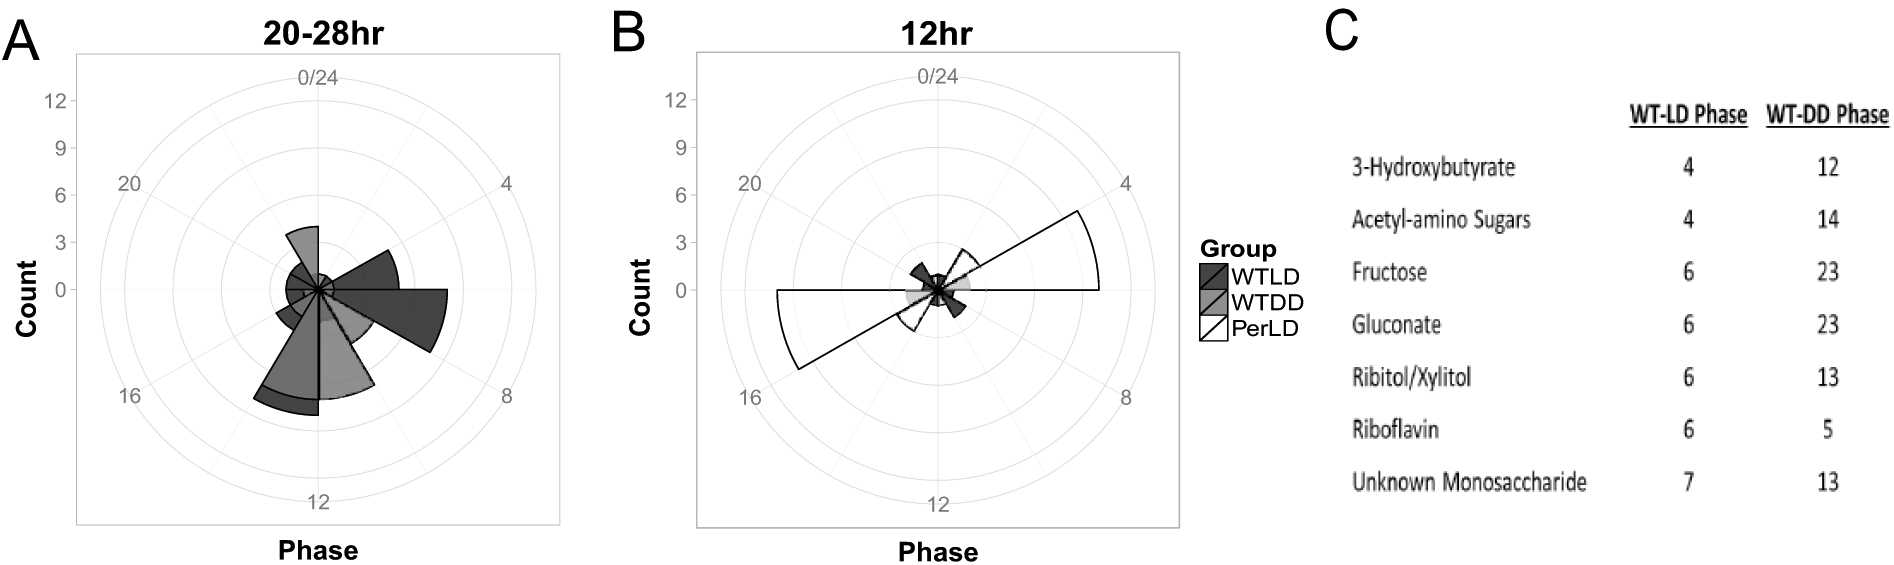
Radial plot indicating phases for significant (A) 20- to 28-h cyclers in WT-LD and WT-DD and (B) 12-h cyclers in all 3 groups, as calculated by ARSER. (C) Phases of the 7 circadian overlaps in WT-LD and WT-DD. Note that the dark grey areas in (A) are indicative of overlap between WTLD and WTDD counts.
Light- and Clock-driven Alterations in Global Metabolite Profiles
As expected, the per mutants displayed large global metabolite differences from WT, irrespective of time, through principal components analysis, while WT-LD and WT-DD samples had general overlap in their metabolic signatures (Fig. 4). To gauge global time-dependent shifts in metabolite signatures, the time points were binned into 4 blocks of ZT0-6, ZT6-12, ZT12-18, and ZT18-24. With univariate testing, the metabolic separation between WT-LD and WT-DD could be found only during the ZT6-12 window (p < 0.05 and q < 0.3; Table 1), suggesting a set of metabolites that are altered under light exposure. Within the WT-LD group, strong time-dependent patterns were noted in amino acid and nitrogen metabolism (Suppl. Fig. S2A), while medium- to long-chain acylcarnitines comprised the majority of metabolite changes in WT-DD across time blocks (Table 1). Differences between the WT-LD and Per-LD groups were noted across each time block, driven mostly by changes in amino acid and nitrogen metabolism (Suppl. Fig. S2B). These pathway enrichments in WT-LD were lost in the per flies, as no metabolites were found to significantly change within the per dataset across the blocked times. As an additional measure of global metabolite shifts, OPLS-DA score plots demonstrated a convergence of WT-LD and WT-DD profiles during the dark phase (Fig. 5). The strongest discriminant model with the most predictive power across the 3 groups occurred at ZT6-12 (R2X = 0.585, R2Y = 0.874, Q2 = 0.654, p = 0.003), while a significant model could not be fit at ZT18-24 (p = 0.24).
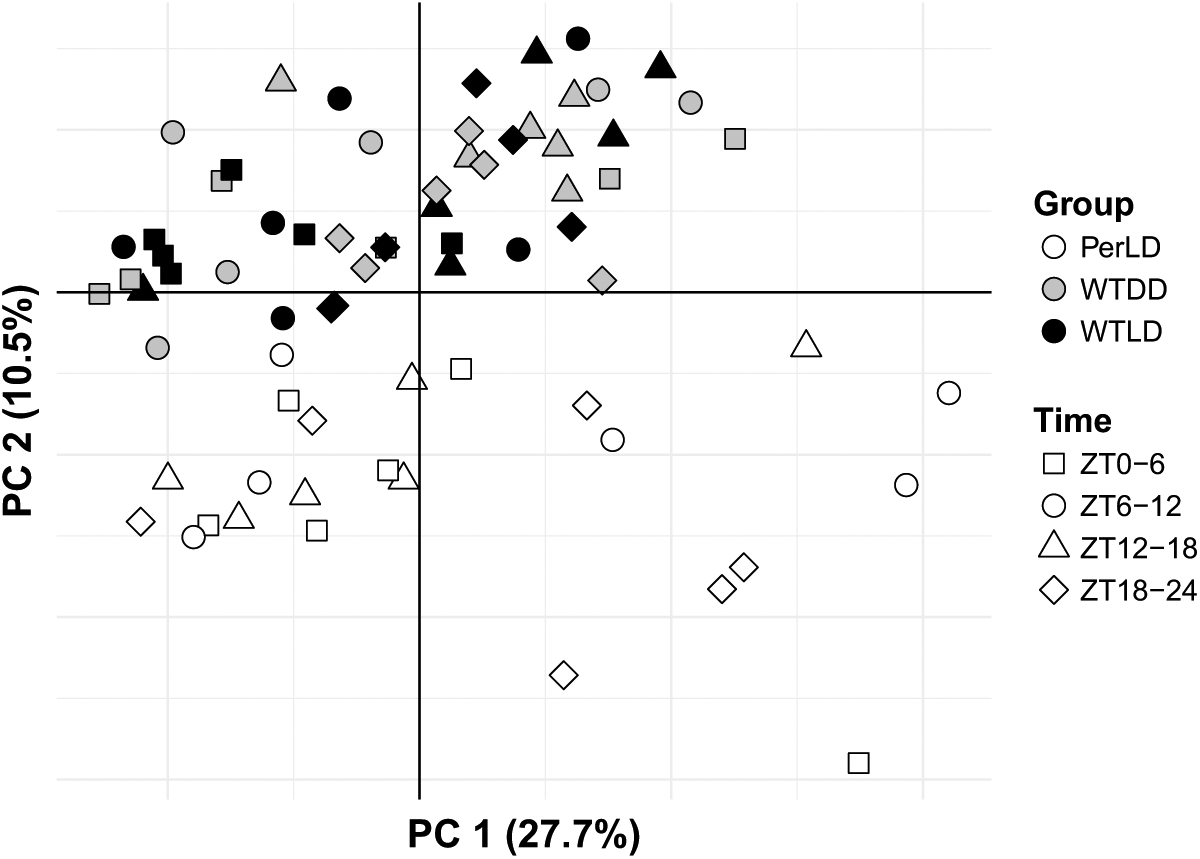
Principal components scores plot for all samples using all detected metabolites. Variances explained for the first 2 components were 27.7% and 10.5%, respectively.
Metabolites that significantly changed between WT-LD and WT-DD in ZT6-12 and within WT-DD across each time block (p < 0.05, q < 0.3).
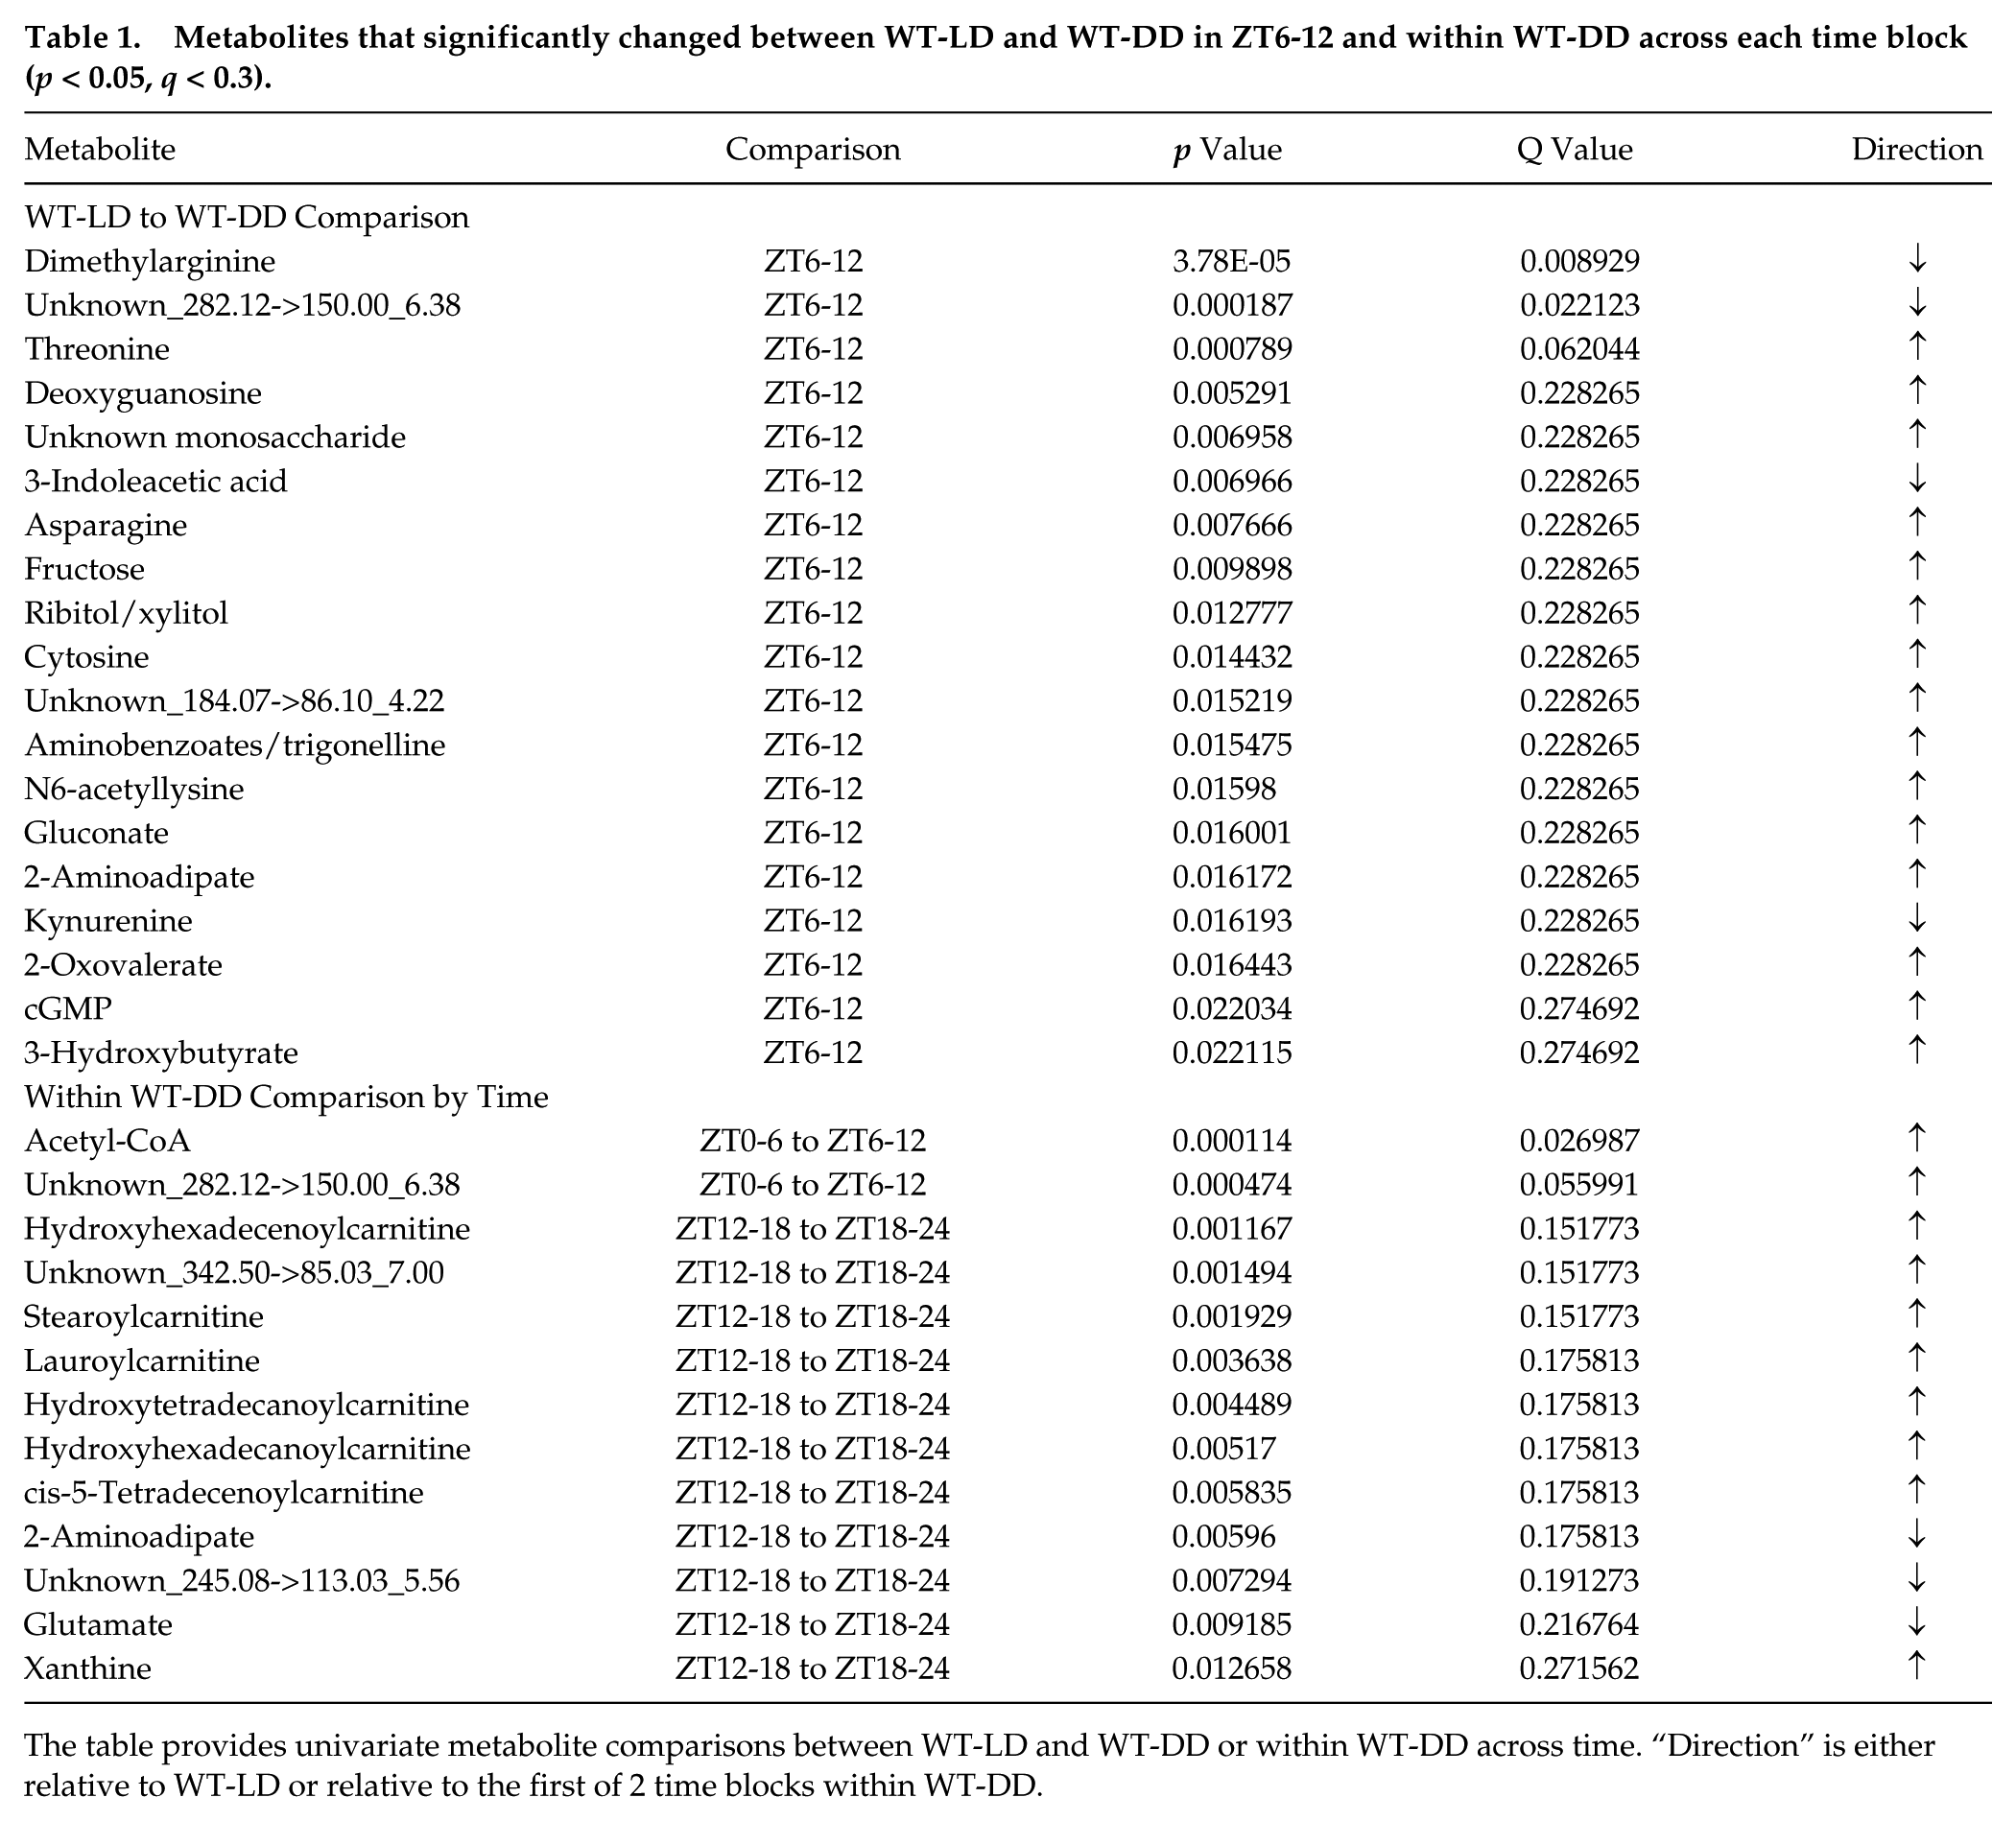
The table provides univariate metabolite comparisons between WT-LD and WT-DD or within WT-DD across time. “Direction” is either relative to WT-LD or relative to the first of 2 time blocks within WT-DD.
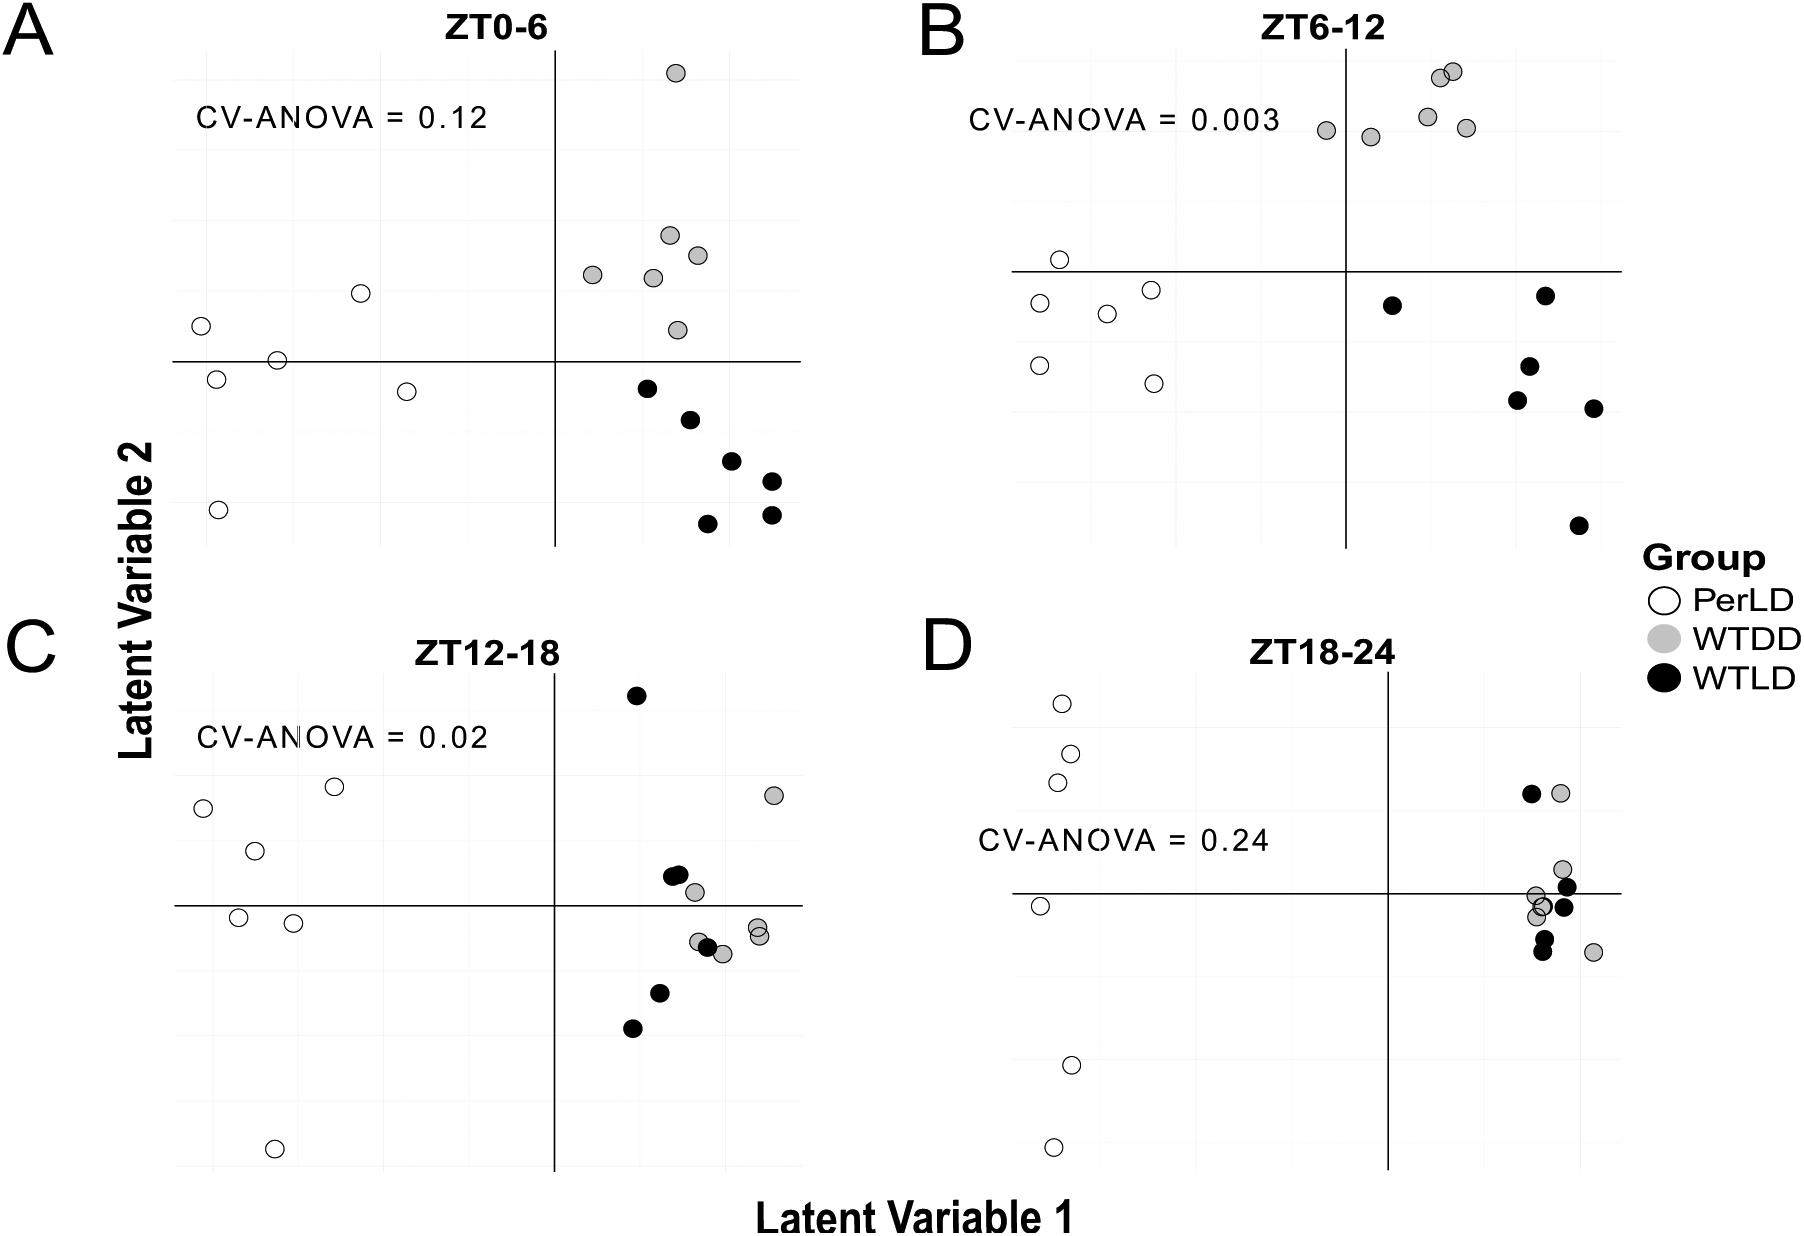
OPLS-DA scores for discriminant analysis of all 3 groups in each of the 4 time windows. Significant models were fit to (B) ZT6-12 samples (R2X = 0.585, R2Y = 0.874, Q2 = 0.654, p = 0.003) and (C) ZT12-18 samples (R2X = 0.458, R2Y = 0.488, Q2 = 0.265, p = 0.02) but not to (A) ZT0-6 (p = 0.12) or (D) ZT18-24 (p = 0.24), noting the convergence of metabolite profiles in WT-LD and WT-DD at the end of the dark phase in ZT18-24.
Overlapping Rhythms across Published Circadian Metabolomic Datasets
We compared our list of significantly diurnal metabolites (i.e., ~24-h period under the presence of light-dark cycles) from WT-LD to the only currently published fly metabolomics study, which analyzed small polar metabolites in whole flies under conditions of cycling light and temperature, and we found overlaps in alanine, tryptophan, AMP, creatine, and lactate (Gogna et al., 2015). Of these metabolites, the phases for alanine and creatine aligned closely across studies (ZT15 and ZT18 for creatine, ZT13 and ZT16 for alanine); however, the phases of other metabolites generally differed.
For a comparison of significantly circadian metabolites conserved across species, we separated datasets that used LD and DD paradigms (Suppl. Table S2). A majority of prior circadian metabolomics studies have used LD, and we found 15 out of 35 of the WT-LD 20- to 28-h cyclers in our study to oscillate in other species, including zebrafish, mice, and humans (Li et al., 2015; Zwigahft et al., 2015; Giskeødegård et al., 2015; Davies et al., 2014; Chaix et al., 2014; Hatori et al., 2012; Eckel-Mahan et al., 2012; Dallmann et al., 2012; Ang et al., 2012). These metabolites include glutamate (found in all 4 species), 2-hydroxyglutarate, 2-aminoadipate, fructose, 3-hydroxybutyrate, 4-guanidinebutanoate, threonine, citrate/isocitrate, carnitine, inositol, hydroxyhexadecenoylcarnitine, aminobenzoates/trigonelline, acetylcarnitine, UDP-glucose, and riboflavin. While some of these studies do not report the entire set of detected metabolites, we did note a significant overlap in significant metabolites with Hatori et al.: χ2(1, N = 506) = 20.98, p = 4.6e-06 (meta-analysis of Hatori et al.’s dataset described in Krishnaiah et al., 2017). Of the 4 carbohydrate species in our WT-LD set, only fructose overlapped with previous studies, which may stem from species-specific variation in carbohydrate metabolism and nutrient utilization. Only one other study has performed high-resolution small polar metabolite analysis under constant darkness in mice (Krishnaiah et al., 2017), which yielded 3-hydroxybutyrate, adenine, and fructose as overlaps to this study.
Discussion
To our knowledge this is the first report of high-resolution circadian metabolomics to catalogue metabolic variations associated with transcriptional clocks and imposed photocycles. First, we discovered a unique set of metabolites that continue to oscillate in constant darkness. In our experimental design, DD sampling did not occur until the flies were exposed to a minimum of 24 h of darkness, which may have dampened the rhythms but allowed further separation of metabolite patterns from the influence of light-dark cycles. We suspect that because many of the overlapping metabolites with 20- to 28-h periods across LD and DD were carbohydrates, a continued feeding rhythm is a major driver in metabolite rhythms, as has been noted in proteomics profiles in mouse liver (Mauvoisin et al., 2014). These sugars were uniformly increased during the light phase in WT-LD compared with WT-DD, perhaps due to a heightened feeding rhythm under the presence of light (Barber et al., 2016). While we did not observe trehalose and glycogen in our LC-MS assay, other studies have observed increased glycogen and trehalose oscillations under LD paradigms with a direct correlation to feeding behavior (Seay and Thummel, 2011). Furthermore, it is interesting to note that these direct associations of carbohydrate changes and feeding behavior may support our findings that metabolite changes largely occurred after lights-on, instead of anticipatory increases beforehand, like seen in transcripts (Wijnen et al., 2006). One intriguing hypothesis from these results is that the upregulation of an enzyme’s transcript before lights-on would correspond to a “readiness” to metabolize carbohydrates at the time of feeding, given the lag between transcription and metabolic activity (Krishnaiah et al., 2017). In addition, we demonstrate a set of light-associated metabolites with large enrichments in amino acid and nitrogen metabolism, which is likely correlated to light-induced locomotor behavior and overlaps with a large enrichment of amino acid rhythms in mice under LD (Minami et al., 2009). Interestingly, indoleacetic acid and kynurenine were among the few metabolites that decreased in the presence of light, which may suggest either (a) an effect of light on dampening certain neurotransmitter processes or (b) increasing locomotion, which has been previously linked to kynurenine metabolism (Agudelo et al., 2014). Altered LD schedules and restricted feeding paradigms would provide additional mechanistic insight into the relative contributions of feeding, free-running periods, and transcriptional clocks on these conserved metabolic cycles in WT.
Only one study previously discovered 14 diurnal polar metabolites with 2-h resolution in whole adult flies using NMR (Gogna et al., 2015), with one additional experiment using lipid profiling at 4-h resolution (Katewa et al., 2016). Gogna et al. sought to maximize metabolite rhythmicity by entraining flies in both LD and temperature cycles, which may establish a control baseline metabolite rhythm but is insufficient to discern endogenous circadian processes. Despite adequate sampling resolution, this study did not use statistical algorithms to discern periodicity, such as JTK_CYCLE or ARSER (Hughes et al., 2010; Yang and Su, 2010). We note some overlaps of rhythmic but noncircadian metabolites; however, the phases generally differed, and the relative insensitivity of NMR compared with LC-MS yielded fewer possible comparisons. Given the impact of environmental cues on metabolite phases and rhythmicity noted here, the relatively low overlap with Gogna et al. is perhaps not surprising, and future studies will need to tease out the relative contributions of additional environmental cues such as temperature and humidity. Additionally, Gogna et al. analyzed whole flies, whereas we analyzed fly bodies in our study. Contributions of metabolites in the eye and brain may impart some additional effects to the detected metabolome.
We were surprised to find how many metabolites uniquely oscillated in WT-DD compared with WT-LD. Within the WT-DD group, circadian cycling patterns in acylcarnitines were observed, which corroborates existing metabolomics studies in humans under constant or highly controlled conditions (Ang et al., 2012; Dallmann et al., 2012; Davies et al., 2014). We speculate that under constant environmental conditions, rhythms in lipid metabolism may persist but are largely transformed under the presence of light and may partly explain our set of unique rhythms in constant darkness. Previous transcript analyses in Drosophila heads have also noted that close to half of significantly cyclic transcripts in DD were not found in LD conditions (Wijnen et al., 2006). This alignment with our metabolomic findings suggests that transcriptional and metabolic programs are largely transformed with imposed photoperiods. Interestingly, Wijnen et al. also uncovered a similarly large number of cycling transcripts in clock mutants under LD relative to WT flies in LD, further demonstrating the substantial influence of environmental cycles on rhythmic processes. However, the light-driven transcripts displayed 24-h periods instead of the 12-h enrichment we report here for metabolites, which may be a consequence of statistical testing in 2-h versus 4-h sampling resolution. We can confidently speak to the influence of light on the global metabolome given that metabolite profiles were indistinguishable during the dark phases of the WT-LD and WT-DD groups by both univariate and multivariate testing.
One drawback in LC-MS is relatively high variance, which may explain a rhythmicity of over 14% of detected metabolites in our study, compared with upward of 50%, as reported in mouse liver (Krishnaiah et al., 2017). Furthermore, metabolites with q < 0.1 were observed only in 8-h rhythms in WT-LD and 12 h rhythms in WT-LD and Per-LD (3, 2, and 4 metabolites respectively). In addition to the variance noted in our LC-MS analysis, we partly attribute this finding to increased variance by testing for multiple periods across 20 and 28 h, as opposed to single-period testing of 8 or 12 h. However, given that peripheral clocks tend to oscillate with unique phases (Zhang et al., 2014), we would not expect such a high enrichment of circadian metabolites in whole bodies. In addition, the age of flies in our study ranged from 5 to 10 days, which may add some additional variance in the dataset. The mouse liver metabolomics study incorporated 1-h sampling resolution, which greatly augments power in circadian testing algorithms, even over the 2-h resolution used here, and may additionally explain relatively lower enrichment in cyclic metabolites. Given our experimental design and biological variance, we believed that ARSER analysis was more suitable to discern periodicity in the data, although it has been reported to yield a higher false-positive rate for transcriptomics analyses (Wu et al., 2016). Future experiments may require higher sampling density and/or replicates, although investigators must remain mindful of resource allocation for large-scale LC-MS experiments (Dunn et al., 2011).
The abundance of 12-h cyclers in Per-LD likely derives from light and/or activity patterns, which would be otherwise dampened or overridden by an intact clock and may in part explain the strong amplitudes of these ultradian rhythms. A dampened secondary peak of feeding in per mutants (Barber et al., 2016) may explain the uniquely biphasic phase enrichments of circadian metabolites in WT-LD compared with a strong enrichment of antiphasic phases for Per-LD at ZT4 and ZT16 in Figure 3. Previous transcriptomics studies found large phase enrichments in WT flies at ZT8 and ZT20, which differ slightly from metabolite phases (Ceriani et al., 2002). For WT flies in constant darkness, the feeding rhythm loses much of its biphasic nature (Barber et al., 2016), which would corroborate our speculation that the second feeding peak persists without light and accounts for the condensed metabolite phases toward the end of the subjective day in WT-DD. These changes in feeding patterns are consistent with alterations in locomotor activity, which also tends to lose bimodality in DD (Helfrich-Förster, 2000). The large overlap of Per-LD 12-h cyclers and circadian WT-LD metabolites suggests a complex synergy of circadian and light-regulated processes, with a conserved surge of metabolite phases in the morning. However, altered period lengths between Per-LD and WT-LD may stem from partial effects of photoperiods on metabolic cycling amidst functional clocks. We posit that while clocks serve an evolutionary advantage in anticipating environmental cues like light, these cues can themselves trigger adaptive responses in activity and feeding, which would confer an additional survival advantage in, for example, seasonal changes of light-dark cycles.
Drosophila can serve as a practical model to develop mechanistic detail from these metabolomics studies, with the depth of genetic tools, ease of environmental manipulations, low cost, and high throughput experimentation. Encouragingly, some circadian metabolites were found across multiple species, potentially expanding the utility of Drosophila as a powerful model for chrono-metabolic studies. However, many of these studies in mice and humans sample liver and blood, respectively, which will likely differ from systemic metabolic rhythmicity in the whole fly body. Nonetheless, a sizable number of human circadian and sleep metabolomics studies have been performed, which have yielded some conserved metabolite hits even across analytical platforms (Rhoades et al., 2017). We hope expanded experimental designs for flies will yield a similar result.
Footnotes
Acknowledgements
We thank Paula Haynes for assistance in Drosophila husbandry and Gang Wu and Michael Hughes for insight into algorithms for circadian rhythmicity testing. S.D.R. is supported through a Pharmacology T32 Training Grant (T32 GM008076), and additional support for this work comes from the National Center for Research Resources (Grant No. UL 1RR024134).
Conflict of Interest Statement
The author(s) have no potential conflicts of interest with respect to the research, authorship, and/or publication of this article.
Author Contributions
Conceptualization: S.D.R., K.N., A.S., A.M.W. Methodology: S.D.R., K.N., S.Z., A.S., A.M.W. Formal analysis: S.D.R., A.M.W. Investigation: S.D.R., K.N., S.Z. Visualization: S.D.R. Writing—original draft: S.D.R. Writing—review & editing: S.D.R., S.Z., A.S., A.M.W.
Notes
References
Supplementary Material
Please find the following supplemental material available below.
For Open Access articles published under a Creative Commons License, all supplemental material carries the same license as the article it is associated with.
For non-Open Access articles published, all supplemental material carries a non-exclusive license, and permission requests for re-use of supplemental material or any part of supplemental material shall be sent directly to the copyright owner as specified in the copyright notice associated with the article.