
Abstract
Metformin is widely used in the treatment of type 2 diabetes to lower blood glucose. Although metformin is a relatively safe and effective drug, its clinical efficacy is variable and under certain circumstances it may contribute to life-threatening lactic acidosis. Thus, additional understanding of metformin pharmacokinetics and pharmacodynamics could provide important information regarding therapeutic use of this widely prescribed drug. Here we report a significant effect of time of day on acute blood glucose reduction in response to metformin administration and on blood lactate levels in healthy mice. Furthermore, we demonstrate that while metformin transport into hepatocytes is unaltered by time of day, the kinetics of metformin-induced activation of AMP-activated protein kinase (AMPK) in the liver are remarkably altered with circadian time. Liver-specific ablation of Bmal1 expression alters metformin induction of AMPK and blood glucose response but does not completely abolish time of day differences. Together, these data demonstrate that circadian rhythms affect the biological responses to metformin in a complex manner.
There is a long history of interest in, and evidence supporting, the idea that daily fluctuations in drug absorption, metabolism, and elimination can alter the effectiveness and toxicity of many pharmaceutical compounds (Paschos et al., 2010; Dallmann et al., 2014). The xenobiotic metabolizing system constitutes a series of biochemical reactions that enable the transport, solubilization, chemical conversion, and eventual elimination of a wide variety of environmental toxins and drug compounds. Many of the enzymes and transporters involved in xenobiotic metabolism have been found to undergo daily or circadian oscillations of expression at the mRNA and/or protein level (Panda et al., 2002; Storch et al., 2002; Ueda et al., 2002; Gorbacheva et al., 2005; Robles et al., 2014). A recent study demonstrated that daily rhythms in acetaminophen toxicity and pentobarbital sleep time require an intact circadian clock in the liver (DeBruyne et al., 2014), suggesting that the liver clock regulates some aspects of the metabolism of those drugs. Combining genome-wide expression data from many tissues, investigators have suggested that ~43% of all genes, including the targets of many drugs, undergo daily oscillations of expression in at least one organ (Zhang et al., 2014). Thus, the efficacy and/or toxicity of clinical compounds may be subject to time of day dependent modulation due to rhythms in the availability of the drug and its metabolites and in the expression of their targets.
Metformin (i.e., Glucophage) is currently the most widely prescribed drug for type 2 diabetes worldwide. It is also the treatment of choice for polycystic ovary syndrome (PCOS) and is being investigated as a treatment for certain types of cancer and even to delay aging. It is believed to exert its clinical effects by inhibiting mitochondrial complex I (Foretz et al., 2014). The resulting reduced flux through the electron transport chain lowers cellular ATP production, leading to activation of AMP-activated protein kinase (AMPK). Liver-specific deletion of the AMPK upstream activating kinase LKB1 (expressed from the Stk11 gene) abolishes metformin-induced reduction of fasting blood glucose in obese mice (Shaw et al., 2005), suggesting that LKB1-catalyzed phosphorylation of AMPK is required for metformin-mediated changes in hepatic glucose production. However, metformin acutely reduces blood glucose production in hepatocytes of mice harboring liver-specific deletion of both AMPKα1 and AMPKα2 (Foretz et al., 2010). This suggests that the acute effect of metformin on hepatic glucose production does not require AMPK. A possible explanation for these seemingly contradictory results came from a recent study elegantly showing that AMPK-mediated phosphorylation of acetyl CoA carboxylases (ACC1 and ACC2) contributes to the effectiveness of chronic metformin treatment by reducing hepatic lipid accumulation but does not contribute to acute suppression of hepatic glucose production (Fullerton et al., 2013). Acute blood glucose reduction in response to metformin may involve suppression of glucagon signaling (Miller et al., 2013).
Previous studies have demonstrated that AMPK may be subject to circadian modulation. AMPK activation can influence circadian clock timing by altering the stability of the core clock repressors CRY1 and PER2 and thus may contribute to metabolic entrainment of peripheral clocks (Um et al., 2007; Lamia et al., 2009). AMPK activity itself may also be influenced by time of day, as evidenced by daily rhythms in the activity of its substrate acetyl CoA carboxylase (ACC) in rat liver (Davies et al., 1992) and of AMPKα1 nuclear localization in mouse liver (Lamia et al., 2009). Metformin is most commonly prescribed as an immediate-release formula, which reaches a peak concentration in plasma within 1 to 3 h and is usually taken twice each day. An extended-release formulation that peaks in circulation 4 to 8 h after delivery is recommended for single daily dosing. In either case, the concentration of metformin in circulation at different times of day will depend on the time at which it is taken, and our findings suggest that this may critically affect its effectiveness and/or toxicity.
To determine whether circadian clocks can influence the clinical efficacy and/or toxicity of metformin, we treated wild-type or liver clock–deficient mice with metformin at different times of day. We observed a striking difference in the activation of liver AMPK and blood glucose lowering response of wild-type mice to metformin at different times of day. Both AMPK activation and blood glucose reduction were greater during the nighttime active period than during the day when mice were resting. Blood lactate levels were also higher at night. The time of day difference in liver AMPK activation was reversed in mice lacking BMAL1 in hepatocytes, while time of day differences in acute blood glucose reduction were only partially reduced, suggesting that circadian clocks modulate the response to metformin both cell-autonomously and systemically.
Materials and Methods
Mice
C57Bl6/J mice were from The Scripps Research Institute (TSRI) breeding colony. BmalL/L mice harboring loxP sites surrounding exon 8 of the Bmal1 gene (stock #007668, B6.129S4[Cg]-Arntltm1Weit/J) and Albumin-Cre mice (stock #003574, B6.Cg-Tg[Alb-cre]21Mgn/J) were purchased from Jackson Laboratories (Bar Harbor, ME) and were bred to obtain Bmal1L/L (control) and Bmal1L/L;Albumin-CreTg/+ (L-Bmal1–/–) littermates. Standard genotyping protocols with primers from the Jackson Laboratories strain information pages were used. Mice were entrained to a 12-h light/12-h dark cycle for at least 2 weeks prior to experiments, and all experiments were performed at 11 to 14 weeks of age. All animal care and treatments were in accordance with TSRI guidelines for the care and use of animals and were approved by the TSRI Institutional Animal Care and Use Committee (IACUC).
Blood Glucose and Lactate Measurements
Mice were placed in clean cages (without food) 2 h prior to experiments and were injected intraperitoneally with metformin (Sigma, St. Louis, MO; 250 mg/kg of bodyweight dissolved in saline at a concentration of 25 mg/mL) or vehicle (saline) at indicated zeitgeber times (ZT, hours after lights-on). Blood glucose and lactate were measured using an Accu-Chek Aviva Plus glucometer (Roche, Indianapolis, IN) and a Lactate Scout+ (EKF Diagnostics, Cardiff, UK) before the injection and 30 and/or 60 min after injection. Mice injected with metformin were injected with 20% glucose at the end of the experiment until blood glucose levels returned to normal. Mice with very low blood glucose levels following the experiment were injected with glucose and placed on heating pads.
Tissue Harvest
Mice were placed in clean cages (without food) 2 h prior to injection of metformin. Tissues were harvested 10, 20, 30, or 60 min after injection. For control samples (0 min), mice were injected with saline and dissected within 30 min. At 5 min prior to tissue harvest, mice were anesthetized using a PAM anesthesia machine (Patterson Scientific, Pewaukee, WI) and a mixture of oxygen (2 L/min) and isoflurane (2%-3%) (Isothesia; Henry Schein, Dublin, OH), and the livers were dissected and snap frozen in liquid nitrogen within 2 seconds. After livers were snap frozen, the mice were sacrificed by cervical dislocation under anesthesia, and additional tissues were dissected.
Metformin Quantification
Liver pieces were weighed and homogenized using a dounce homogenizer (Kimble Chase, Rockwood, TN) in 500 µL of 80% methanol including an internal metformin standard at a final concentration of 2 µg/mL, diluted from Metformin-d6 hydrochloride stock (Santa Cruz Technologies, Santa Cruz, CA; 1 mg resuspended in 1 mL DMSO). Samples were diluted prior to analysis as needed to ensure that measurements were within the linear range of measurements determined by a standard curve. Metformin and the internal standard (Metformin-d6) were analyzed on an Agilent 6410 triple quadrupole mass spectrometer in MRM mode, coupled to an Agilent 1100 lc system (Agilent, Santa Clara, CA). The transition states monitored were 136.1 → 60.1 (quantitative transition) and 60.1 (qualitative transition) for the internal standard and 130 → 60.1 (quantitative) and 71.1 (qualitative) for metformin. Spray chamber settings were N2 drying gas flow = 10 L/min, drying gas temperature = 350 °C, and nebulizer pressure = 30 psi. Capillary voltage was set to 4000 V. The column used was a Phenomenex 2.0 × 50 mm Kinetex C18 (Phenomenex, Torrance, CA). Mobile phase A consisted of H2O/40 mM heptafluorobutyric acid (HFBA), and mobile phase B consisted of MeOH. Flow rate was 200 µL/min. Gradient was T = 0 90:10 to T = 5 min 5:95, with stop time at 10 min, followed by a 4-min re-equilibration step (post-time). Volume of extract injected was 5 µL. Concentrations were calculated from a 5-point calibration curve. The concentration of metformin was normalized to tissue weight.
Tissue Preparation for qPCR and Western Blot Analysis
Liver pieces were pulverized, and the powder was quickly transferred to either (a) lysis buffer containing 50 mM Tris·HCl pH 7.5, 1 mM EGTA, 1 mM EDTA, 1 mM sodium orthovanadate, 50 mM sodium fluoride, 10 mM sodium-β-glycerophosphate, 5 mM sodium pyrophosphate, 1 mM DTT, 0.27 M sucrose, complete protease inhibitor cocktail (Roche, Basel, Switzerland; 1 tablet/0.50 mL), and 1% NP40 for protein isolation for Western blot analysis or (b) Qiazol for RNA isolation, and was further homogenized for 1 min with stainless steel beads using the Qiagen Retsch TissueLyser (Qiagen, Germany). For protein lysates, cell debris was removed by centrifugation at 13,000 × g at 4 °C for 30 min, and protein concentration was determined using Pierce BCA assay (Thermo Scientific, Waltham, MA). RNA was extracted from pulverized tissues with Qiazol reagent using standard protocols (Cat. #799306, Qiagen).
Quantitative RT-PCR
Complementary DNA (cDNA) was prepared from 1 µg RNA using qScript cDNA synthesis kit (Quantabio, Beverly, MA) and analyzed for gene expression using quantitative real-time PCR with iQ SYBR Green Supermix (Bio-Rad, Hercules, CA) on a CFX96 real-time PCR system using fluorescence detection and the following primers: hprt-F TGCTCGAGATGTCATGAAGG; hprt-R TATGTCCCCCGTTGACTGAT; slc47a1-F CTGGCAATTGCGGTTATCAATGTCAC; slc47a1-R GTCTGGGTGAGCCTGGATACATC; slc22a1-F GACGCCTGGAAAGTGGACC; slc22a1-R GCAACATGGATGTATAGTCTGGG; bmal1-F TCAAGACGACATAGGACACCT; bmal1-R GGACATTGGCTAAAACAACAGTG; Slc16a1-F CACATAACGATACTAGATTTGCGCTGCATC; Slc16a1-R GCCAATAGAAATGAAGGCTCCGACTAACAC; Slc16a7-F TATGCGGGAGGTCCCATCAG; Slc16a7-R CGGTGAGATAAAGCTCTATCACG.
Western Blots
Total cell lysates (30-50 µg) were separated by SDS-PAGE and transferred to polyvinylidene difluoride (PVDF) membranes. Proteins were detected by standard Western blotting procedures. Antibodies recognizing AMPKα1 (2795S), phospho-AMPK T172 (2535S), RAPTOR (2280S), and phospho-RAPTOR S792 (2083S) were purchased from Cell Signaling Technologies (Danvers, MA); BMAL1 antibody (ab93806) was purchased from Abcam (Cambridge, MA), and TUBULIN-a antibody (T5168) was purchased from Sigma.
Statistics
All data were analyzed by ANOVA with post hoc testing using GraphPad Prism 7 software. In Figure 1, blood glucose and lactate data each were analyzed by 3-way ANOVA. For lactate, multiple comparisons were performed for each measurement with each other measurement that differed by any 1 of the 3 factors, using Sidak’s test to correct for multiple comparisons. For glucose, data were further analyzed by 2-way ANOVA for each subset of data as shown. For basal glucose measurements, only ZT altered the measurements, so multiple comparisons were performed between ZTs regardless of treatment using Tukey’s test to correct for multiple comparisons. For comparison of glucose measurements 30 min after injection of metformin either with measurements prior to metformin injection in the same mice (repeated-measures 2-way ANOVA) or with measurements 30 min after injection with saline (regular 2-way ANOVA), multiple comparisons were performed at each ZT using Sidak’s test to correct for multiple comparisons. In Figure 2, all gene expression data were analyzed by regular 1-way ANOVA. For transcripts in which a main effect of ZT was detected, each ZT was compared with ZT0 in post hoc testing using Dunnett’s test to correct for multiple hypothesis testing. Measurements of metformin concentration in Figure 2D were analyzed by 2-way ANOVA with multiple comparisons between times after treatment corrected using Sidak’s test. Quantitation of data in Figure 3 was compared using 2-way ANOVA and p values were corrected for multiple comparisons using Sidak’s test (shown in Suppl. Fig. S1). In Figure 4, blood glucose data were analyzed by repeated-measures 2-way ANOVA in subgroups as shown. Multiple comparisons were performed using Tukey’s test or Sidak’s test as recommended to correct for multiple hypothesis testing. In Figure 5, gene expression data were analyzed using 2-way ANOVA. Post hoc analyses were performed using Tukey’s test to correct for multiple hypothesis testing. All p values were adjusted to correct for multiple comparisons.
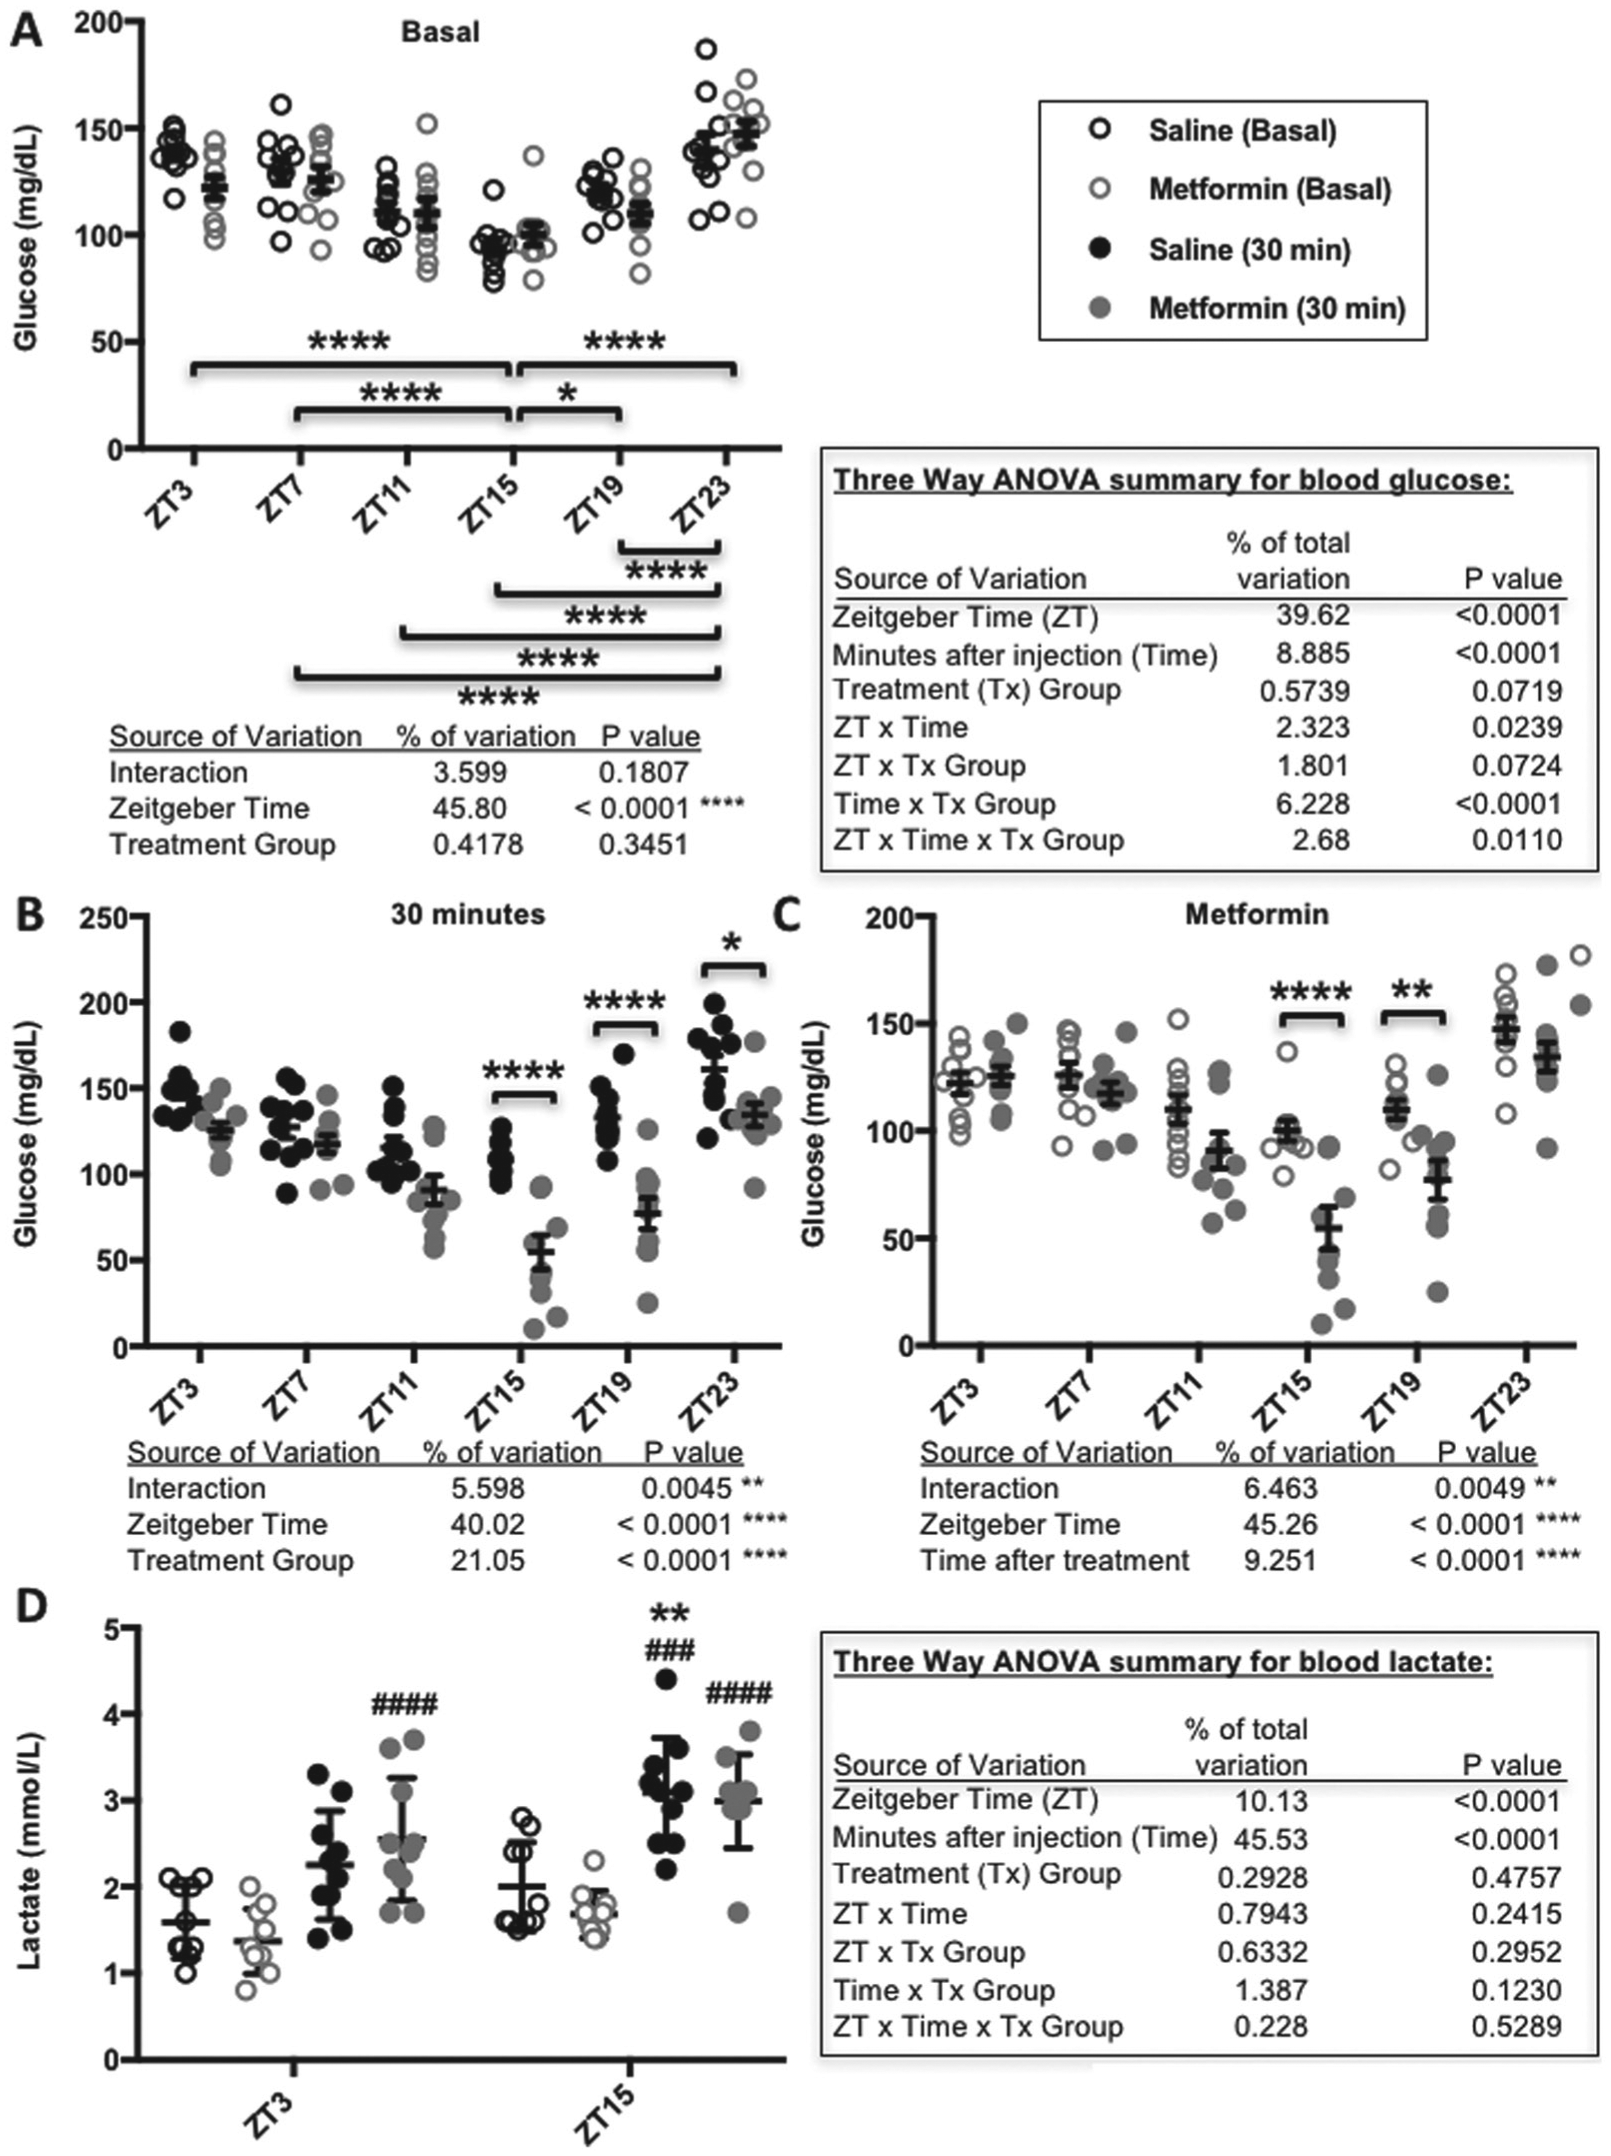
Metformin response is greatest at ZT15 and ZT19. (A-C) Blood glucose and (D) lactate levels measured in male C57BL6/J mice before (basal) and 30 min after intraperitoneal injection of 250 mg of metformin per kilogram of bodyweight at the indicated zeitgeber times (ZT, hours after lights-on). In A-C, *p < 0.05, **p < 0.01, ****p < 0.0001. In D, **p < 0.001 vs. ZT3, ###p < 0.0005, ####p < 0.0001 vs. basal. The p values were calculated by 2- or 3-way ANOVA with post hoc testing corrected for multiple comparisons. N = 10 animals per group.
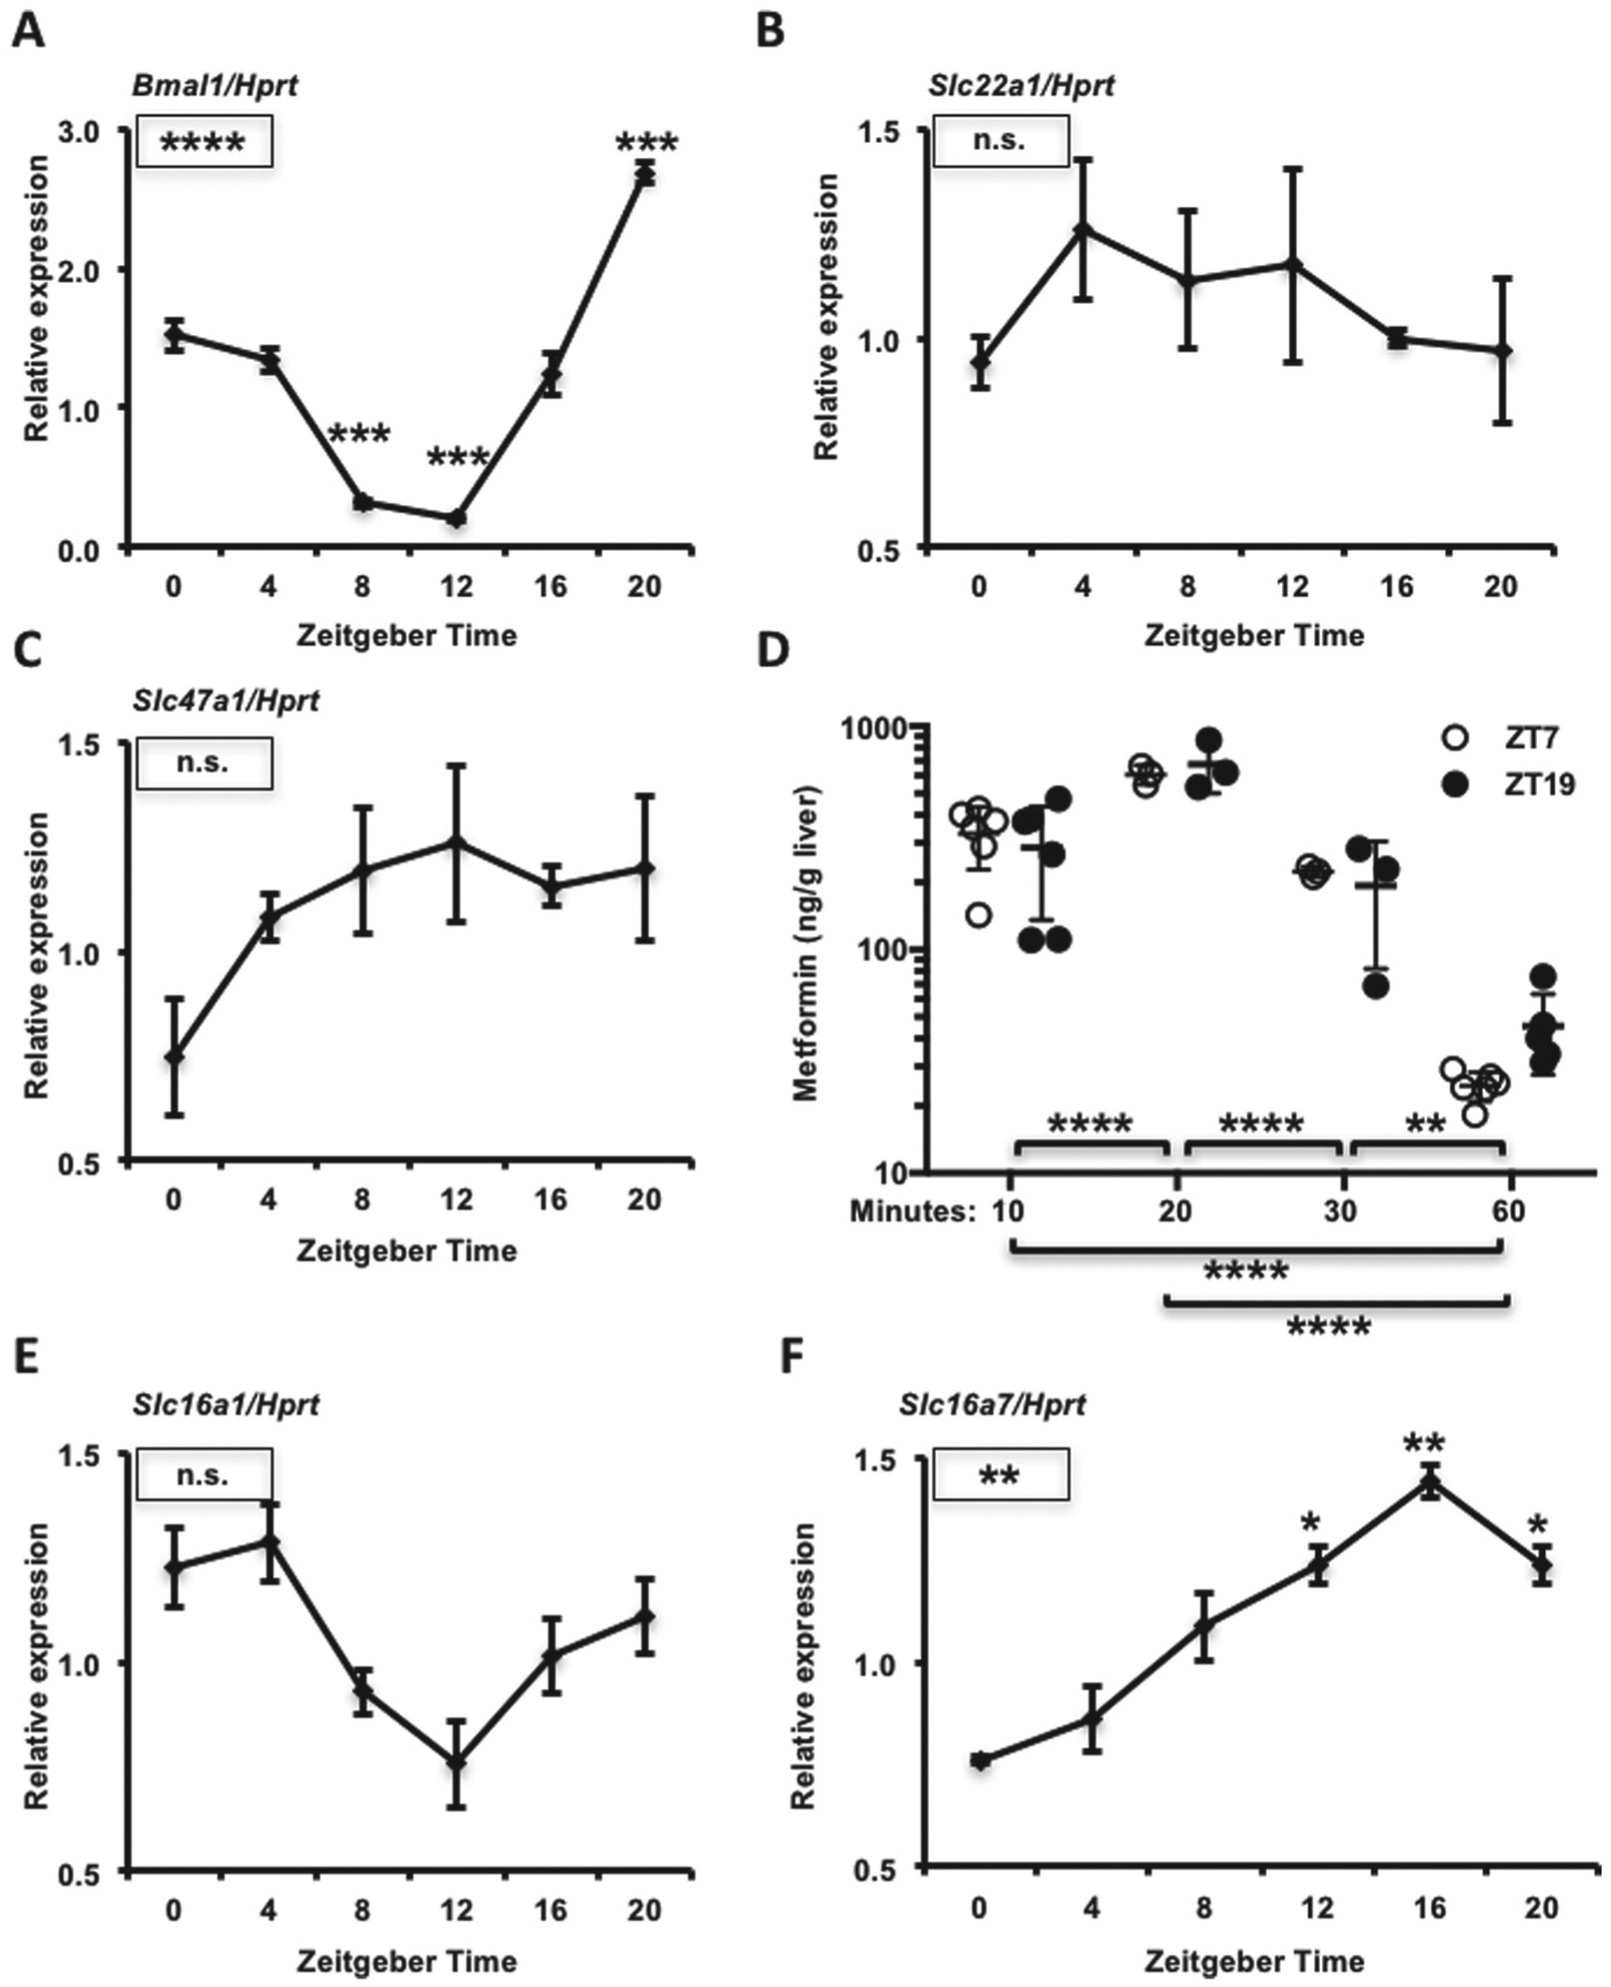
Transporter expression and metformin accumulation in mouse liver. mRNA expression of (A) Bmal1, (B) Slc22a1, (C) Slc47a1, (E) Slc16a1, and (F) Slc16a7 detected by qPCR in mouse livers collected at the indicated ZTs. Data represent the mean ± SEM for n = 3-6 samples per condition. *p < 0.05, **p < 0.01, ***p < 0.001, ****p < 0.0001. Boxed symbols represent p values calculated by 1-way ANOVA. Symbols above individual data points represent post hoc testing vs. ZT0 corrected for multiple comparisons. (D) Metformin concentration in mouse liver, as detected by mass spectrometry. Tissues were snap frozen in liquid nitrogen at the indicated times after intraperitoneal injection with metformin at ZT7 (open circles) or ZT19 (closed circles). **p < 0.01, ****p < 0.0001 by 2-way ANOVA with post hoc test corrected for multiple comparisons.
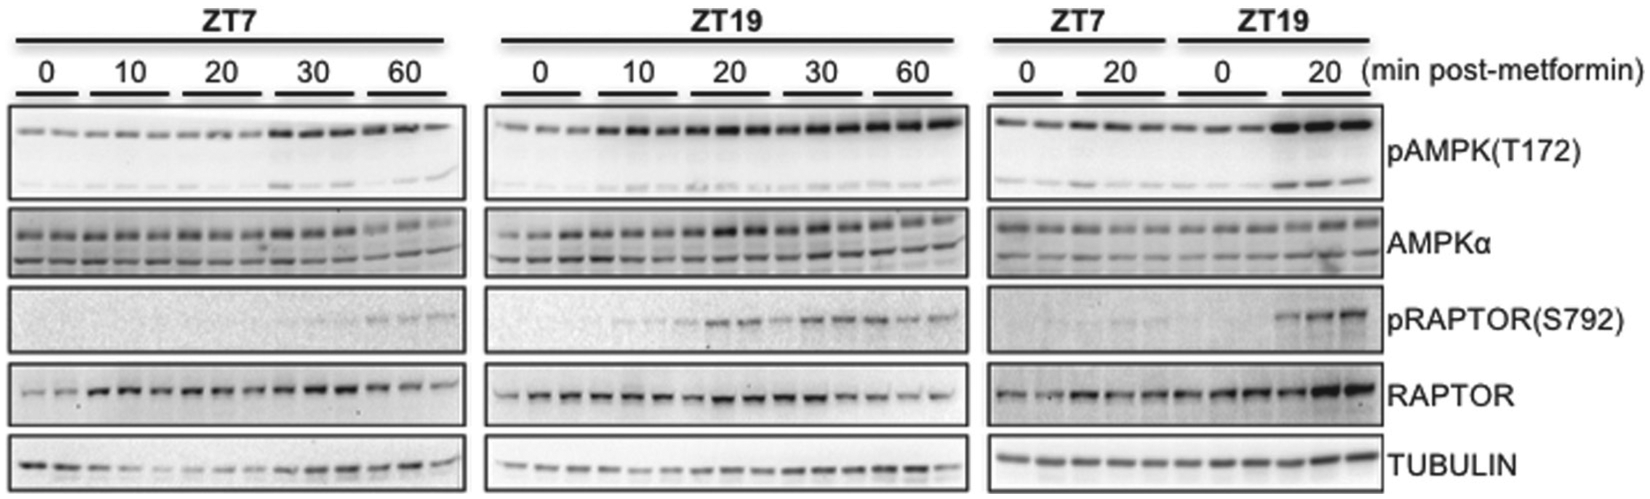
AMPK activation by metformin is influenced by time of day. Phosphorylated and total levels of AMPK and RAPTOR were detected by Western blot in protein samples prepared from C57Bl6/J mouse livers snap frozen in liquid nitrogen at the indicated times after intraperitoneal injection with metformin at the indicated ZTs. pAMPK and pRAPTOR represent phosphorylation on T172 and S792, respectively. Each lane represents a unique animal. A representative experiment is shown.
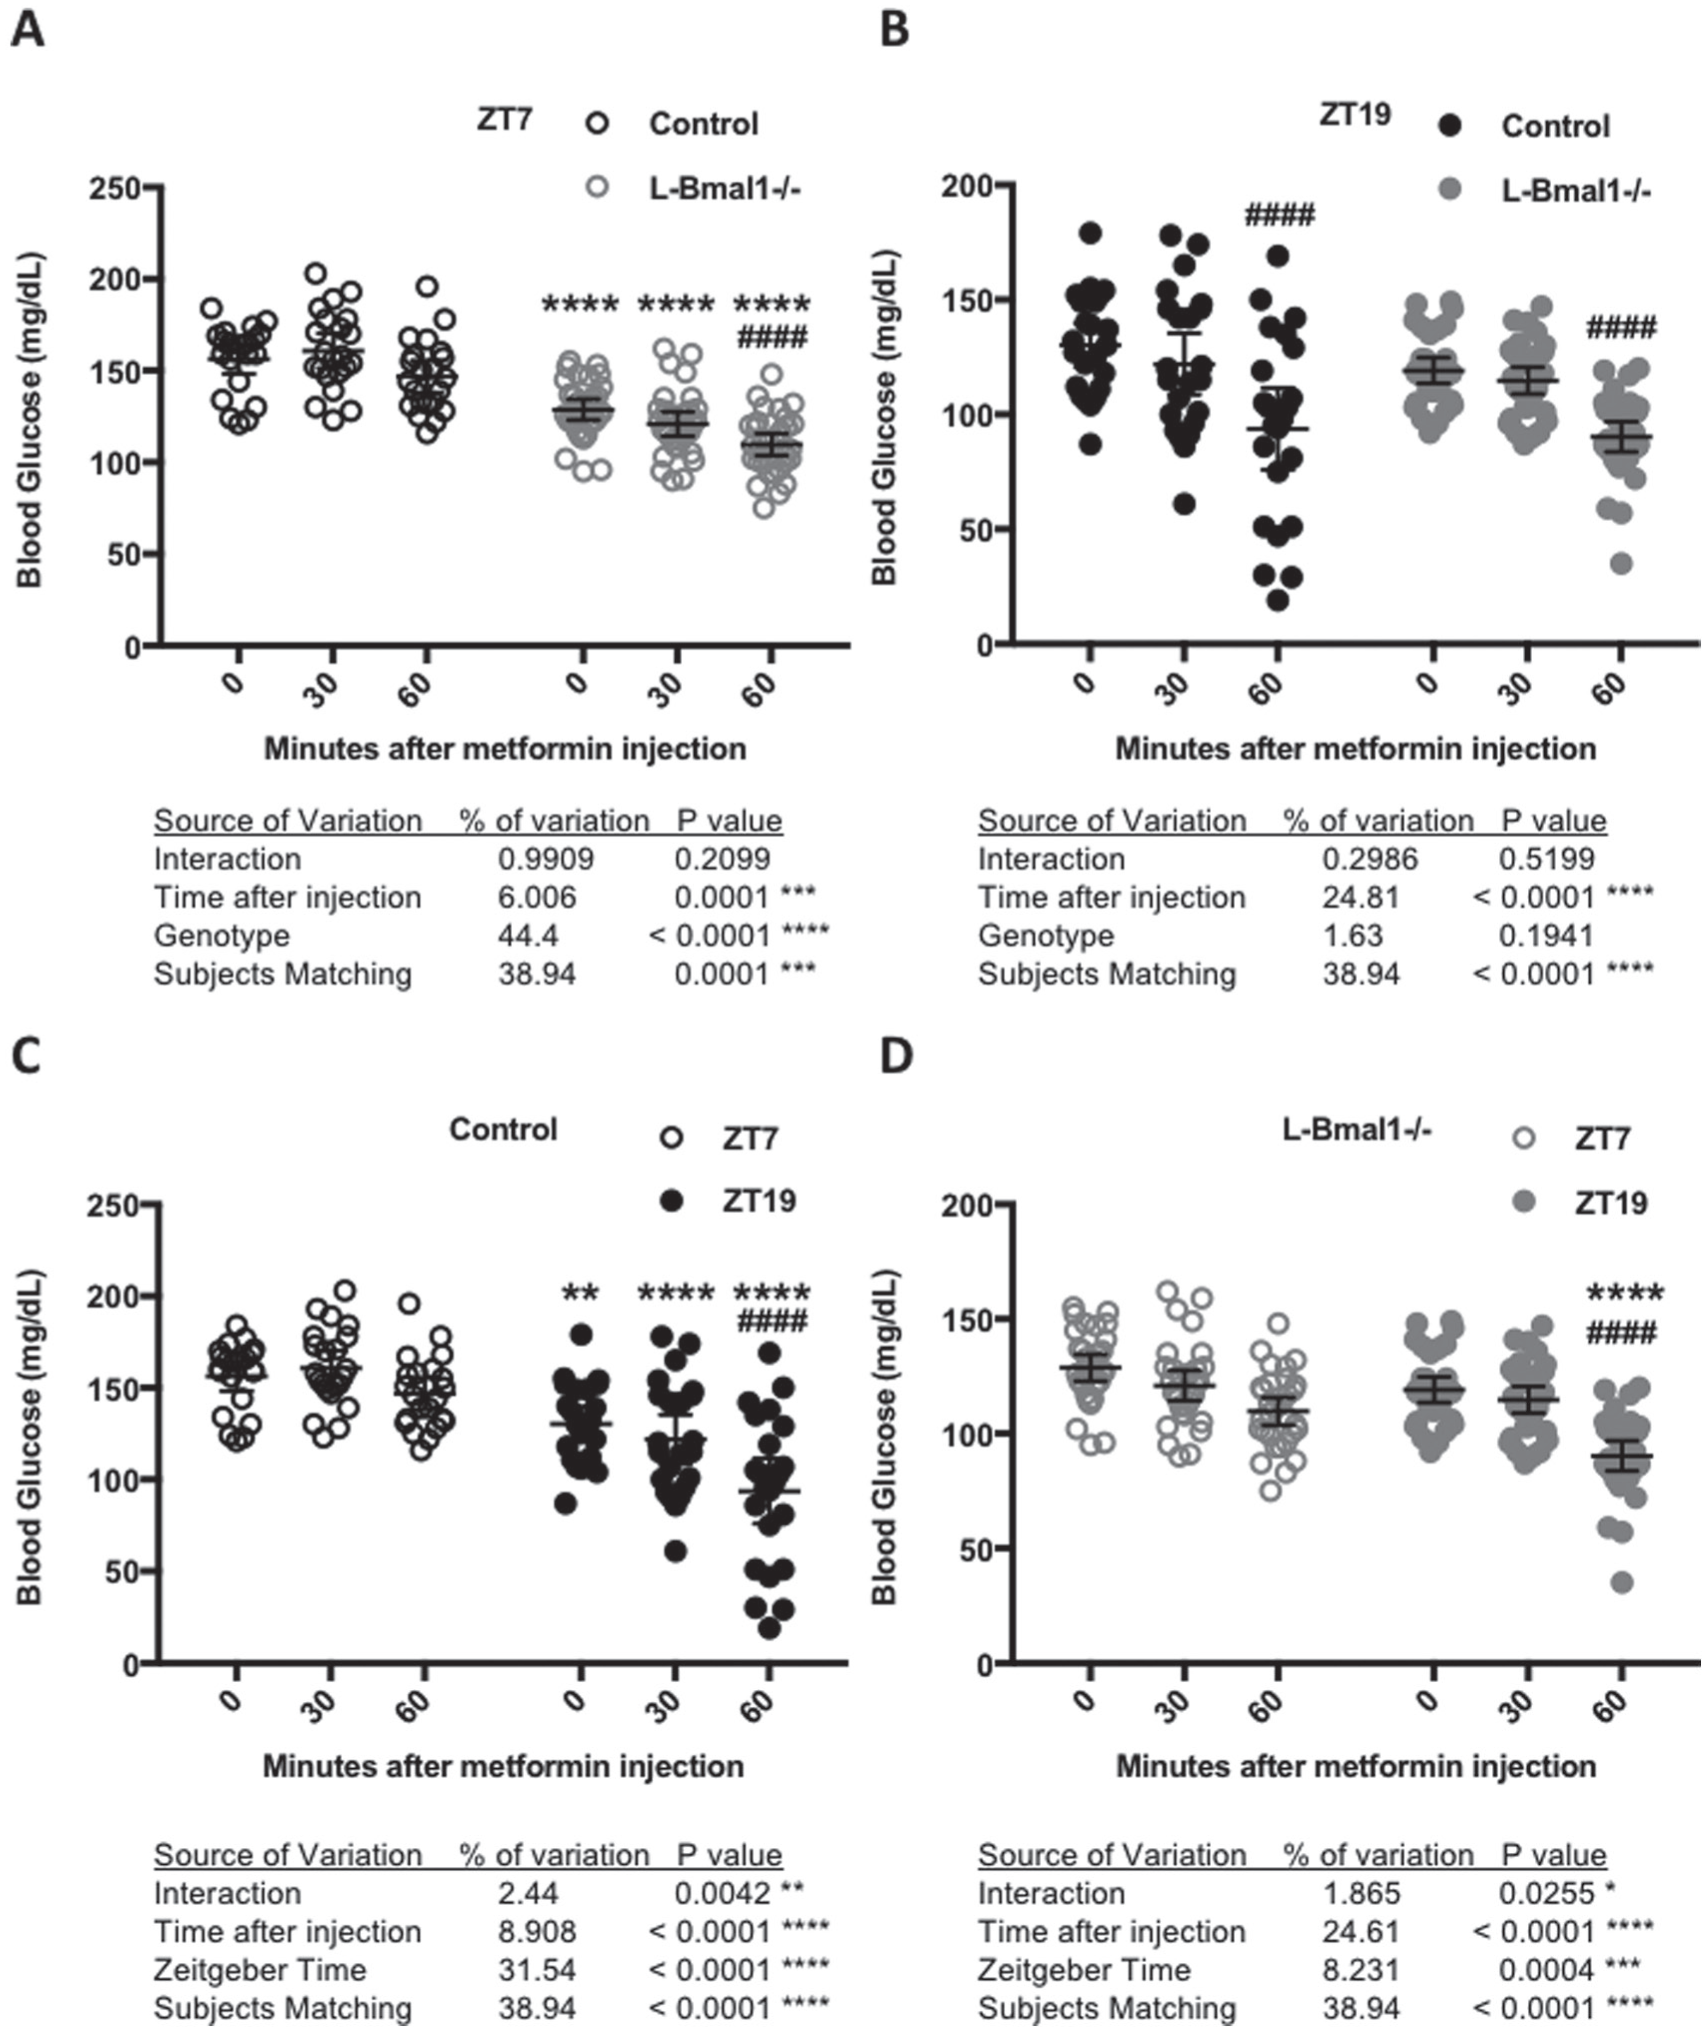
The liver clock contributes to daily variation in blood glucose reduction in response to metformin. Blood glucose measured at the indicated times after intraperitoneal injection of metformin in control (black, n = 22) or L-Bmal1–/– (gray, n = 32) mice at ZT7 (open symbols) or ZT19 (closed symbols). Data are displayed for comparison of L-Bmal1–/– vs. control at (A) ZT7 or (B) ZT19 or for comparison of ZT7 vs. ZT19 in (C) control or (D) L-Bmal1–/– animals. *p < 0.05, **p < 0.01, ***p < 0.001, ****p < 0.0001 by 2-way ANOVA for factors depicted in each panel. Results of post hoc testing are indicated by symbols above grouped data: In A and B, ****p < 0.0001 vs. control; ####p < 0.0001 vs. ZT7. In C and D, **p < 0.01, ****p < 0.0001 vs. control; ####p < 0.0001 vs. Time 0 (pretreatment).
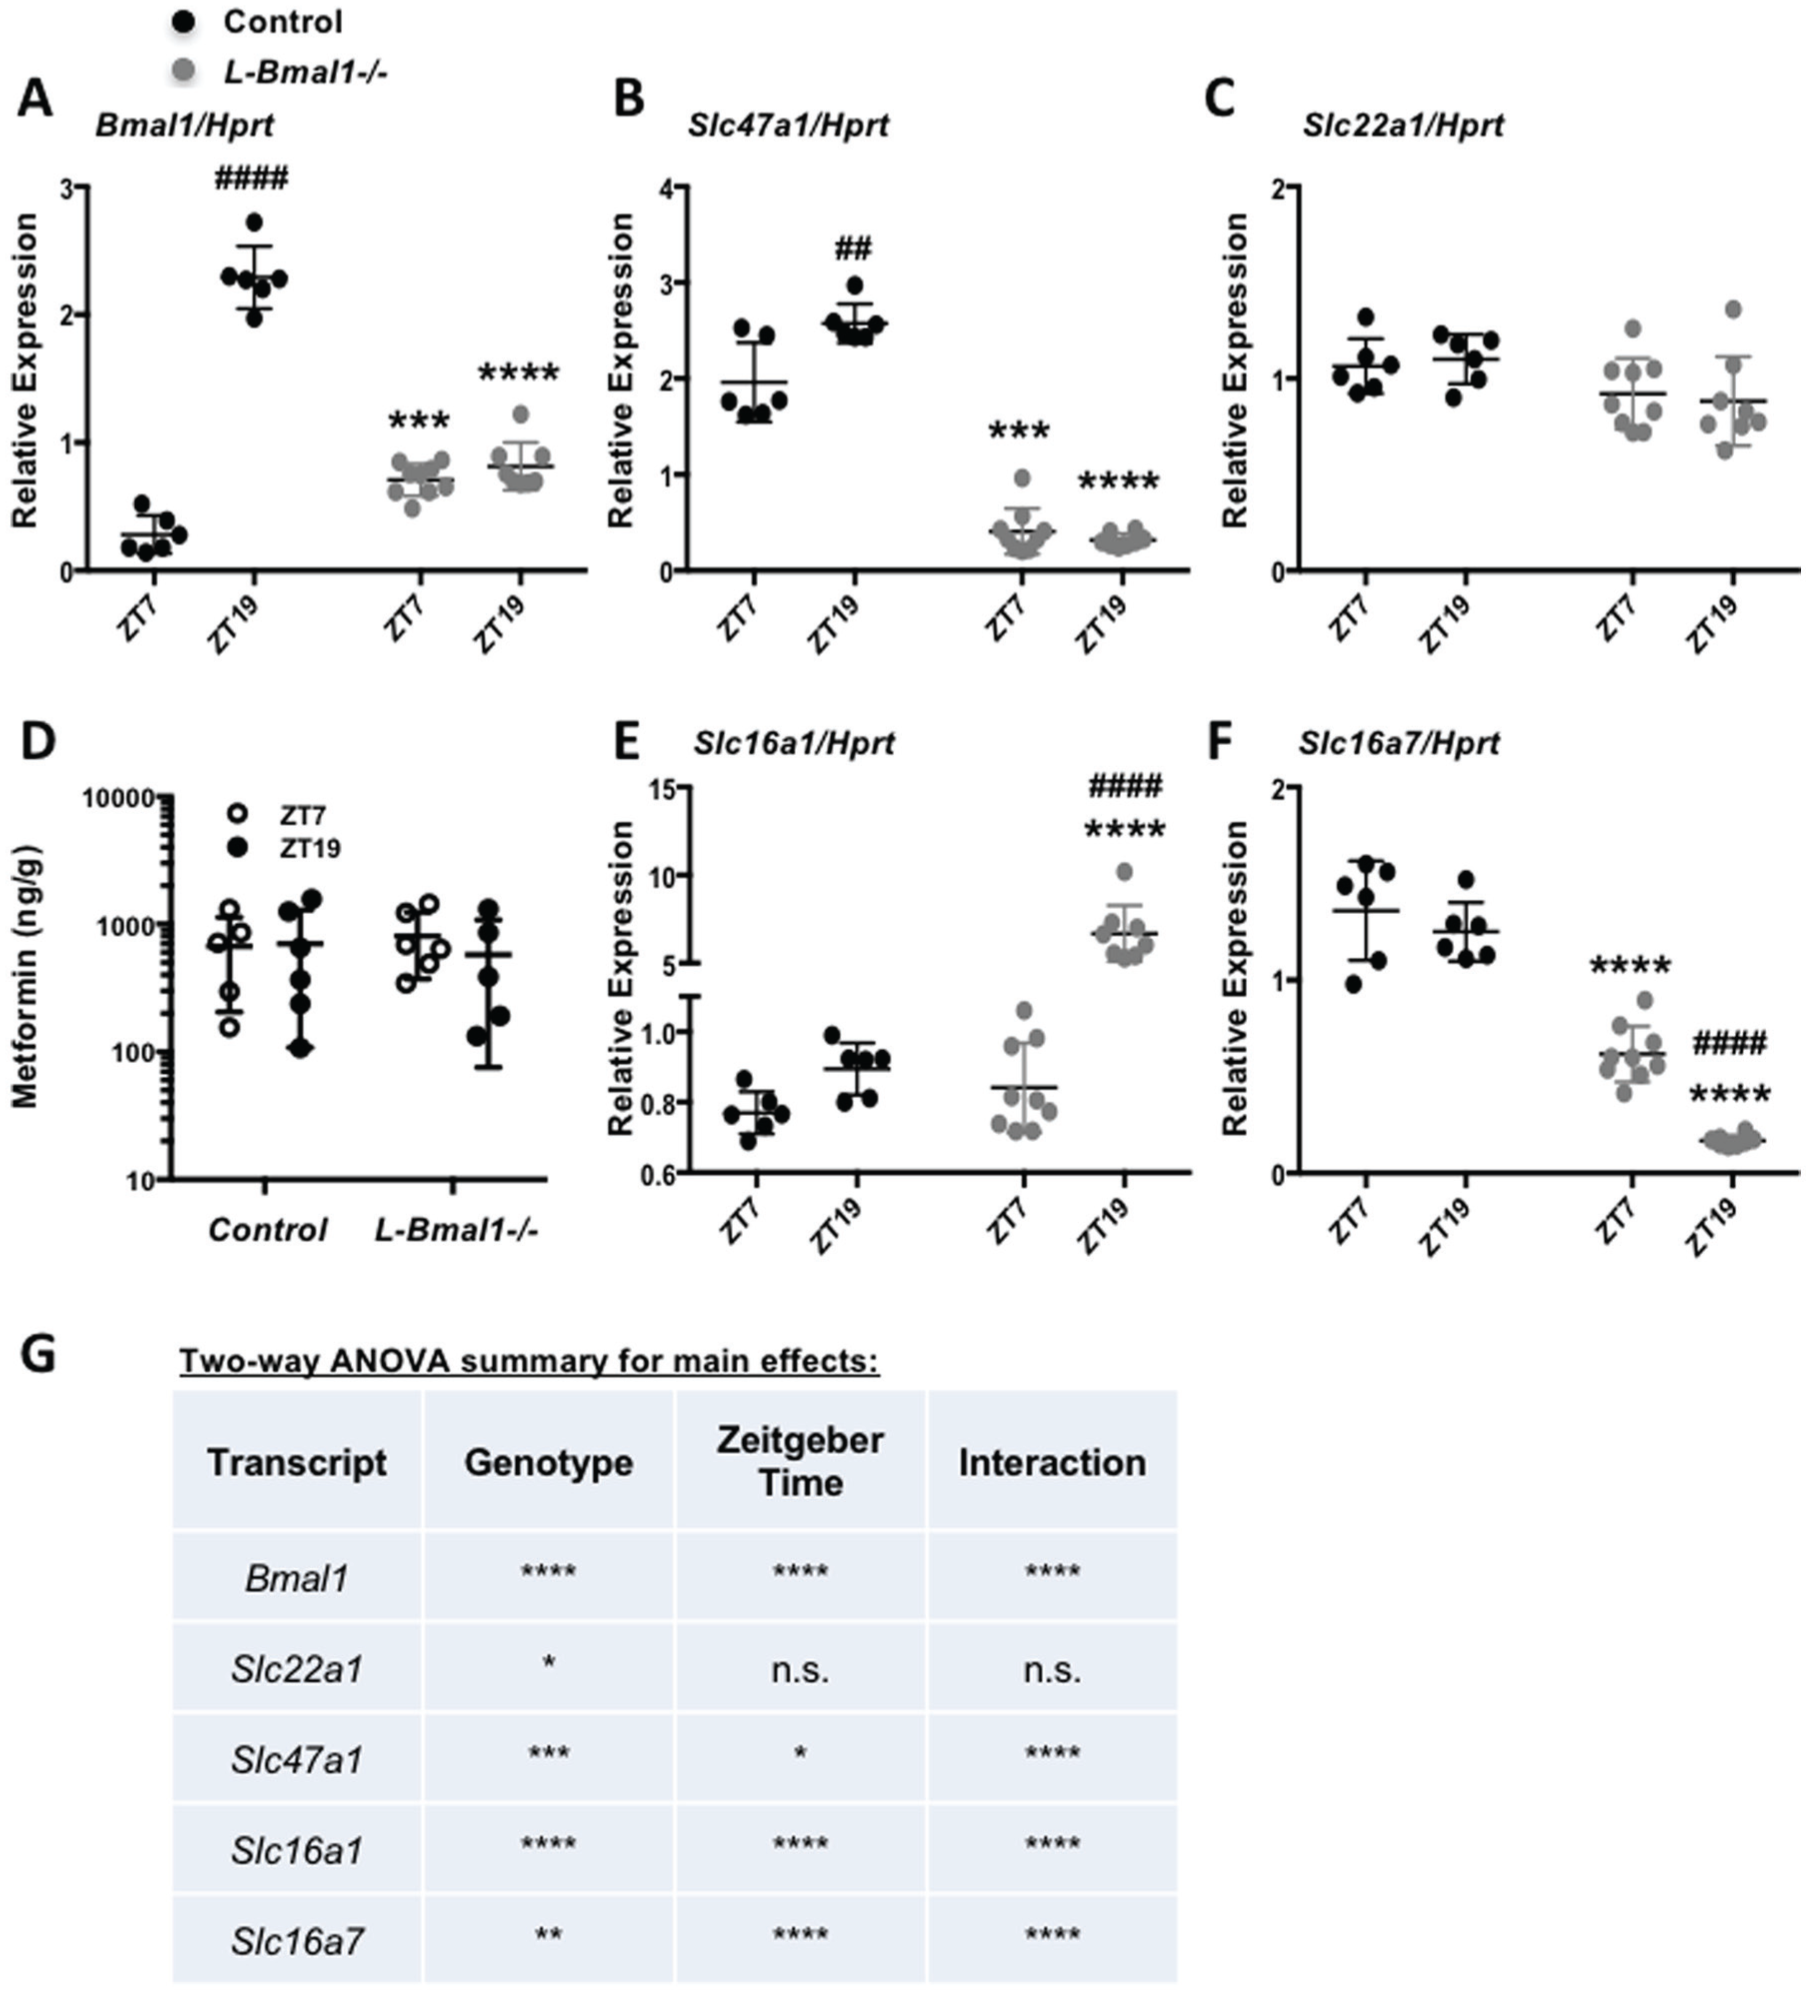
The liver clock modulates transporter expression. mRNA expression of (A) Bmal1, (B) Slc47a1, (C) Slc22a1, (E) Slc16a1, and (F) Slc16a7 detected by qPCR in mouse livers collected at the indicated ZTs. n = 6-9 samples per condition. ***p < 0.001, ****p < 0.0001 vs. control; ##p < 0.01, ####p < 0.0001 vs. ZT7 by post hoc testing corrected for multiple comparisons. (D) Metformin detected by mass spectrometry in control and L-Bmal1–/– mouse livers snap frozen in liquid nitrogen 20 min after intraperitoneal injection with metformin. (G) Results of 2-way ANOVAs of gene expression data presented in A-C and E-F. *p < 0.05, **p < 0.01, **p < 0.001, ****p < 0.0001 for an effect of genotype, zeitgeber time, or interaction between the two as indicated.
Results
Acute Glucose Lowering Response to Metformin Depends on the Time of Day
Clinically, metformin treatment is usually given at a dose of 500 to 3000 mg daily. There is some debate in the literature regarding the appropriate dose of metformin that should be given to rodents to approximate a clinically relevant dose in humans, ranging from 15 to 300 mg/kg bodyweight (Shu et al., 2007; Foretz et al., 2010; Fullerton et al., 2013; Chandel et al., 2016). We treated C57Bl6/J mice with a dose of 250 mg of metformin per kilogram of bodyweight to examine acute responses. Like previous reports (La Fleur et al., 1999; la Fleur et al., 2001), we observed a daily rhythm in basal blood glucose levels in healthy mice, reflected by the significant effect of zeitgeber time (ZT, hours after lights-on). As expected, there was no effect of assigned treatment group on pretreatment blood glucose levels (Fig. 1A). Overall, metformin treatment resulted in a significant reduction in blood glucose 30 min after injection compared with saline-treated mice (p < 0.0001 for treatment group). There was also a striking effect of time of day, reflected by a statistically significant interaction between ZT and metformin treatment on blood glucose levels (Fig. 1B and 1C). We observed the greatest reduction in blood glucose in response to metformin treatment at ZT15 and ZT19, corresponding to the middle of the active phase for mice and likely similar to late morning in humans.
In addition to observing a daily rhythm in metformin-induced acute blood glucose reduction, we observed unexpected severe toxicity of metformin at night with the relatively high dose used in this study. In preliminary experiments using C57Bl6/J mice, we observed greater than 60% mortality within 12 h after treatment with 250 mg/kg metformin at ZT19 (data not shown). We could reverse this outcome by providing supplemental glucose and heating pads to maintain glycemic and thermal homeostasis within 30 to 60 min of metformin delivery. While we did not measure a significant effect of metformin (vs. saline) on blood lactate levels 30 min after injection, both basal and postinjection blood lactate were elevated at night (Fig. 1D). These observations suggest that time of day could affect the occurrence of lactic acidosis.
Rhythmic Expression of Liver Transporters
Many events could influence blood glucose reduction in response to metformin. These include drug transport, the effectiveness of complex I inhibition, and the expression or localization of components of molecular pathways involved in the physiological response. Metformin entry into hepatocytes is largely driven by the organic cation transporter 1 (OCT1) expressed from the solute carrier family 22 member 1 gene (Slc22a1) (Shu et al., 2007). CLOCK, BMAL1, CRY1, CRY2, and PER2 all bind to the promoter region of Slc22a1 in mouse liver (Koike et al., 2012), suggesting that the hepatic circadian clock could directly regulate its expression. Multidrug and toxin extrusion-1 (MATE-1) protein, expressed from the solute carrier family 47 member 1 gene (Slc47a1), enables the export of metformin from hepatocytes (Hume et al., 2013; Hibma et al., 2015; Jensen et al., 2016). CRY1 and CRY2 bind to the promoter region of Slc47a1 in mouse liver (Koike et al., 2012), suggesting that it could also be under clock control. We measured the expression of Slc22a1 and Slc47a1 in C57Bl6/J mouse liver and found that Slc47a1 tends to be more highly expressed at night, while we observed no effect of zeitgeber time on the expression of Slc22a1 (Figs. 2A-C).
Although we did not measure differential expression of mRNAs encoding metformin transporters, it remains possible that transporter protein level or membrane localization is modulated by ZT and thus influences drug distribution. To determine whether metformin accumulation in the liver is influenced by zeitgeber time, we measured the concentration of metformin present in liver at 10, 20, 30, and 60 min after intraperitoneal metformin administration. Metformin peaked in the liver 20 min after administration (Fig. 2D). While there was a trend toward greater metformin retention in liver 60 min after drug delivery at ZT19 compared with ZT7, it was not statistically significant. Metformin concentrations in liver at earlier time points were indistinguishable between ZT7 and ZT19, indicating that differences in drug transport cannot explain the observed differences in blood glucose levels in the first 30 min after injection.
We also observed a difference in blood lactate levels at different times of day (Fig. 1D), and this could contribute to the rare but dangerous occurrence of lactic acidosis in patients treated with metformin and other drugs. Lactate transport is mediated by a family of proton-linked monocarboxylate transporters (MCT1, 2, 3, and 4) expressed by genes of the solute carrier family 16 (Slc16a1, Slc16a7, Slc16a8, and Slc16a3, respectively). Both Slc16a1 and Slc16a7 have been reported to undergo circadian oscillation of transcription in mouse liver, and their loci are bound by all the circadian transcription factors that have been examined (Koike et al., 2012). We measured similar daily expression patterns of Slc16a1 and Slc16a7 in mouse liver to those previously reported (Fig. 2E and 2F). Slc16a1 and especially Slc16a7 transcripts, encoding monocarboxylate transporters 1 and 2 (MCT1 and MCT2), are rhythmically expressed, and these expression patterns could contribute to the elevated blood lactate that we measured at ZT15 compared with ZT3.
Time of Day Alters Metformin-induced Activation of AMPK
To begin to investigate possible mechanisms downstream of drug transport underlying the observed differences in metformin effects on blood glucose at different times of day, we measured the kinetics of the signal transduction response to metformin at ZT7 and ZT19. These 2 time points exhibit similar basal blood glucose levels but markedly different reductions in blood glucose in response to metformin. Consistent with the observed enhanced reduction of blood glucose during the night, the activating phosphorylation of AMPK on threonine 172 (T172) occurred more quickly after metformin treatment at ZT19 compared with treatment at ZT7. We also examined the phosphorylation of a well-established target of AMPK-directed posttranslational modification, RAPTOR (Gwinn et al., 2008), which was enhanced at ZT19 (Fig. 3 and Suppl. Fig. S1). These data suggest that daily oscillations in AMPK activation in the liver could contribute to time of day dependent changes in acute metformin response.
The Liver Circadian Clock Contributes to Daily Rhythms in Metformin Response
To investigate the role of the liver circadian clock in apparent circadian modulation of the response to metformin, we used mice with hepatocyte-specific loss of clock function due to Albumin-Cre induced deletion of Bmal1 (L-Bmal1–/–) (Lamia et al., 2008). We treated L-Bmal1–/– mice with metformin at ZT7 and ZT19 and found that they are more sensitive to metformin than control littermates at ZT7 (blood glucose decreases 15% in L-Bmal1–/– compared with 6% in control within 60 min of metformin treatment; Fig. 4A) while there was no significant effect of genotype at ZT19 (Fig. 4B). Analyzing the results for each genotype independently revealed that L-Bmal1–/– mice remain hypersensitive to the acute blood glucose lowering effect of metformin at ZT19 compared with ZT7, although the effect is less severe than in control littermates (Fig. 4C and 4D). Together, these data indicate that the liver clock contributes to daily changes in acute blood glucose reduction in response to metformin but that systemic circadian effects on physiology also play a role.
Local Clock Control of Transporter Expression
Because we and others have measured rhythmic expression of several transporters in mouse liver, we examined whether hepatocyte clocks directly affect these transcripts. Quantitative RT-PCR revealed increased expression of Slc47a1 at ZT19 compared with ZT7 in control mice and a striking reduction in Slc47a1 expression in the livers but not in the kidneys of mice harboring hepatocyte-specific ablation of Bmal1 regardless of the time of day (Fig. 5A, 5B, 5G; Suppl. Fig. S2A). Note that the primers used for qPCR amplify a portion of the Bmal1 transcript upstream of the deleted exon so it appears to be increased in L-Bmal1–/– relative to control livers at the time of trough expression in control mice; this is likely an artifact of the experimental setup. Slc22a1 expression was also slightly reduced in L-Bmal1–/– livers (Fig. 5C and 5G). Thus, the liver circadian clock may regulate hepatic drug efflux by modulating the abundance of Slc47a1 mRNA. However, circadian regulation of transporter expression is unlikely to contribute to the observed time of day dependent differences in metformin-induced blood glucose excursion: 20 min after injection of metformin at either ZT7 or ZT19, there were no statistically significant effects of genotype or time of day on metformin accumulation in mouse liver in L-Bmal1–/– mice and control littermates (Fig. 5D).
The liver clock also seems to contribute to rhythmic expression of lactate transporters. Slc16a1 is highly elevated in the livers of L-Bmal1–/– mice at ZT19, while Slc16a7 expression is strongly repressed in L-Bmal1–/–mice (Fig. 5, E-G). These gene expression changes do not seem to have a major impact on acute blood lactate accumulation, since hepatocyte-specific ablation of Bmal1 had no effect on blood lactate within 1 h of metformin treatment at ZT7 or ZT19 (Suppl. Fig. S2B). However, we cannot exclude the possibility that blood lactate is influenced by ablation of the liver clock either at another ZT or after prolonged metformin treatment.
Liver Circadian Clock Modulates AMPK Activation
To determine whether the liver circadian clock is required for time of day differences in AMPK activation by metformin that we observed in C57Bl6/J mice, we examined the effect of metformin on the phosphorylation of AMPK and its substrate RAPTOR in L-Bmal1–/– mice and control littermates. Liver-specific deletion of Bmal1 enhanced the metformin-induced activation of AMPK signaling at ZT7 and reduced its activation at ZT19 (Fig. 6 and Suppl. Fig. S3). We confirmed liver-specific deletion of Bmal1 in these animals using Western blot and qPCR analyses of liver and kidney samples (Figs. 5A and 6; Suppl. Figs. S2C and S3A). In kidney, we detected a small increase in AMPK activation 20 min after metformin treatment, indicating some entry of metformin into other organs outside of its major site of action. Importantly, this result was unaltered by ablation of Bmal1 in the liver (Suppl. Fig. S2C), suggesting that the observed difference in liver signal transduction reflects a tissue-autonomous effect of the hepatic circadian clock. Taken together, our findings in L-Bmal1–/– mice indicate that the liver clock influences both blood glucose reduction and AMPK activation in response to metformin. While these data suggest that circadian regulation of AMPK signaling could influence the effects of metformin on chronic blood glucose regulation, additional systemic and AMPK-independent pathways affect acute blood glucose disposal in a circadian manner.
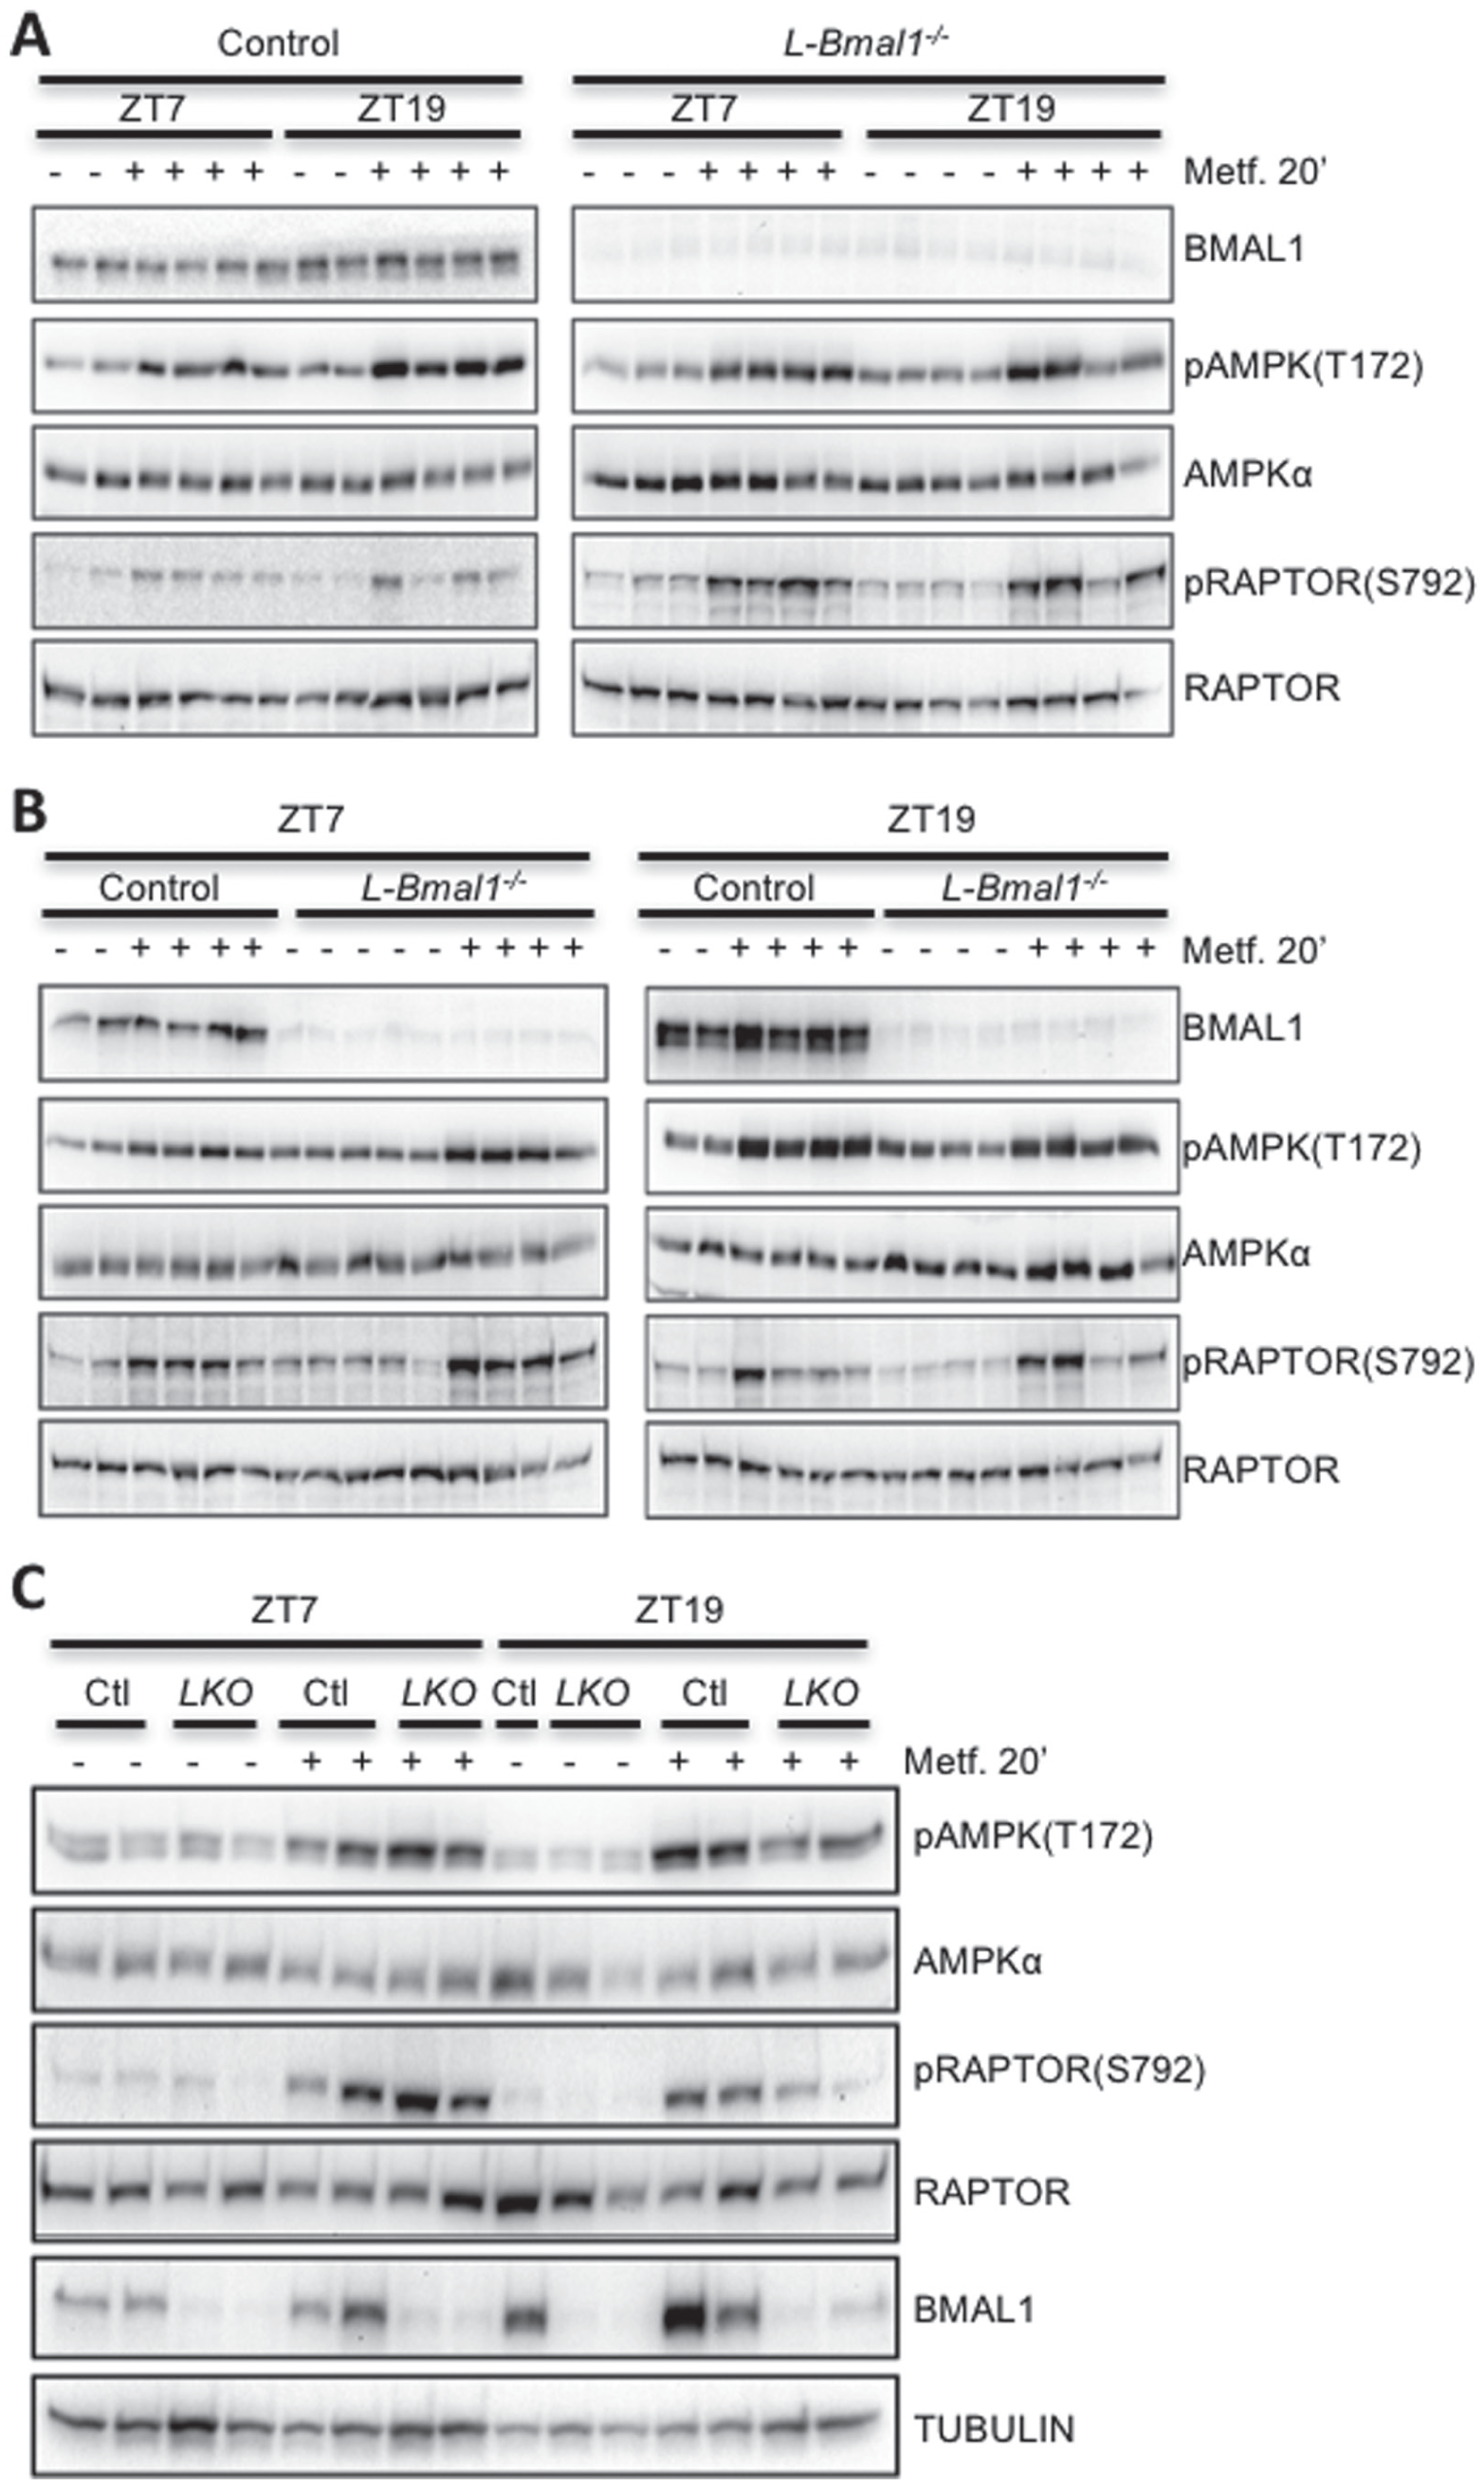
AMPK signaling is regulated by the circadian clock. BMAL1 and phosphorylated and total levels of AMPK and RAPTOR were detected by Western blot in protein samples prepared from mouse livers snap frozen in liquid nitrogen 20 min after intraperitoneal injection with saline (–) or metformin (+) at the indicated zeitgeber times (ZT). Each lane represents a unique animal. Samples are presented in various arrangements to facilitate comparison of (A) ZT7 vs. ZT19, (B) control (Ctl) vs. L-Bmal1–/– (LKO), or (C) both together.
Discussion
Here, we demonstrate that acute reduction in blood glucose in response to metformin depends on the time of day of treatment in mice. We also reveal that the kinetics of metformin-induced activation of AMPK are dramatically different in the middle of the day (ZT7) compared with the middle of the night (ZT19, active phase for mice). The much more rapid activation of AMPK at night does not seem to depend on alterations in drug absorption or distribution to hepatocytes, since the concentration of metformin present in the liver at 10 or 20 min after drug administration was indistinguishable between ZT7 and ZT19. In response to metformin, daily rhythms in AMPK activation were lost upon disruption of the liver circadian clock, but time of day differences persisted in acute blood glucose reduction. Together, these data indicate that the liver circadian clock modulates either the ability of metformin to inhibit the mitochondrial respiratory chain or some aspect of signal transduction by which metformin-induced changes in cellular energy status activate AMPK. Circadian rhythms in mitochondrial morphology and function (Peek et al., 2013; Jacobi et al., 2015) and AMPK expression and localization (Lamia et al., 2009) have been reported and could contribute to the observed effects. In addition, a recent study showed that intracellular concentrations of magnesium are subject to daily oscillation in a wide variety of species (Feeney et al., 2016), which could potentially modulate the kinetics of many signal transduction pathways, including the activation of AMPK. Because the effects of chronic low-dose metformin treatment on liver fatty acid accumulation and thus hepatic glucose production seem to require AMPK dependent phosphorylation of ACC (Fullerton et al., 2013), these findings suggest that the timing of metformin treatment could affect its clinical efficacy. It was recently shown that cotreatment with melatonin can enhance the efficacy of metformin to improve glucose tolerance (Thomas et al., 2016), supporting the idea that the circadian system can affect metformin response.
Although alterations in metformin transport cannot explain the divergent kinetics of AMPK activation following daytime or nighttime drug administration, we found that the liver circadian clock regulates the expression of Slc47a1 (Fig. 5B), which encodes the metformin efflux transporter MATE-1. We did not measure any significant effect of the liver clock on metformin accumulation in liver within 1 h of administration. However, while most studies of metformin focus on the liver, metformin also accumulates in skeletal muscles, adipose tissues, intestine, kidneys, bladder, and other tissues (Chen et al., 2009; Hume et al., 2013; Chen et al., 2015; Shingaki et al., 2015). Additional measurements are required to determine whether daily rhythms of absorption, distribution, or efflux significantly contribute to metformin pharmacokinetics. Metformin can influence metabolism in extrahepatic locations: For example, it activates AMPK and enhances GLUT4 translocation and glucose uptake in muscles (Lee et al., 2011; Magnoni et al., 2012; Kristensen et al., 2014). Thus, time of day dependent differences in accumulation or downstream actions of metformin in muscle could underlie the effect of ZT on the acute blood glucose lowering impact of metformin in L-Bmal1–/– mice. The long-term effects of metformin on blood glucose likely involve chronic changes in lipid accumulation in the liver; thus, small differences in drug distribution or hepatic drug retention could influence long-term clinical outcomes.
While metformin is a relatively safe and effective drug, it may contribute to lactic acidosis. Interestingly, a strong daily rhythm in urine lactate has been observed in humans (Bongaerts et al., 1995). We also observed significant differences in blood lactate at different ZTs in mice (Fig. 1D). Lactate is transported across cell membranes by monocarboxylate transporters (MCTs) (Hertz and Dienel, 2005), many of which undergo strong circadian oscillations of expression in mouse liver (Fig. 2E and 2F) (Koike et al., 2012) and fibroblasts (Huber et al., 2016). In addition to the daily rhythm in metformin-induced acute blood glucose reduction, we observed unexpected severe toxicity of metformin at night, which could be reversed by providing supplemental glucose and heating pads to maintain glycemic and thermal homeostasis. These observations suggest that differences in metformin retention and/or lactate transport at different ZTs could affect the occurrence of lactic acidosis and may explain the severe toxicity of nighttime metformin treatment that we observed. The mechanisms underlying the occurrence of lactic acidosis are not well understood (Boucaud-Maitre et al., 2016; DeFronzo et al., 2016; Lepelley et al., 2016), and understanding the reason for the observed increase in blood lactate specifically after nighttime drug delivery in rodents may shed light on this rare but dangerous phenomenon.
In recent years, there has been an upsurge of interest in using metformin and related biguanides to treat cancers that undergo apoptosis in response to energy stress due to tumor-specific alterations in metabolism (Shackelford et al., 2013; Koritzinsky, 2015; Momcilovic et al., 2015; Momcilovic and Shackelford, 2015). To understand whether timing of treatment could alter drug efficacy or safety in this context, it will be important to investigate the mechanisms of drug transport, AMPK activation, and other relevant parameters in tumors of interest. Some tumors have dampened circadian rhythms (Relogio et al., 2014), so it may be possible to time biguanide treatment to optimize transport into tumor cells while minimizing the risk of undesired systemic effects. However, it was recently demonstrated that the presence of tumors in the lung altered circadian patterns of gene expression and metabolite profiles in mouse liver (Masri et al., 2016), indicating that cancer patients may not have typical rhythms of response to metformin. Metformin has also been proposed and is now being tested as an antiaging treatment (Check Hayden, 2015). If approved, this would result in an enormous increase in its already widespread use, such that better understanding of metformin pharmacokinetics and pharmacodynamics would be even more critical.
Footnotes
Acknowledgements
This work was supported by grants from the National Institutes of Health to K.A.L. (DK097164), by a Searle Scholars award to K.A.L. from the Kinship Foundation, and by fellowships from the Swedish Research Council and The Foundation Blanceflor Boncompagni Ludovisi, née Bildt, to E.H. We thank Reuben Shaw, Michael Downes, and Sabine Jordan for helpful discussions, sharing reagents, and/or critical reading of the manuscript.
Conflict of Interest Statement
The author(s) have no potential conflicts of interest with respect to the research, authorship, and/or publication of this article.
Notes
References
Supplementary Material
Please find the following supplemental material available below.
For Open Access articles published under a Creative Commons License, all supplemental material carries the same license as the article it is associated with.
For non-Open Access articles published, all supplemental material carries a non-exclusive license, and permission requests for re-use of supplemental material or any part of supplemental material shall be sent directly to the copyright owner as specified in the copyright notice associated with the article.