
Abstract
Light is the primary signal that calibrates circadian neural circuits and thus coordinates daily physiological and behavioral rhythms with solar entrainment cues. Drosophila and mammalian circadian circuits consist of diverse populations of cellular oscillators that exhibit a wide range of dynamic light responses, periods, phases, and degrees of synchrony. How heterogeneous circadian circuits can generate robust physiological rhythms while remaining flexible enough to respond to synchronizing stimuli has long remained enigmatic. Cryptochrome is a short-wavelength photoreceptor that is endogenously expressed in approximately half of Drosophila circadian neurons. In a previous study, physiological light response was measured using real-time bioluminescence recordings in Drosophila whole-brain explants, which remain intrinsically light-sensitive. Here we apply analysis of real-time bioluminescence experimental data to show detailed dynamic ensemble representations of whole circadian circuit light entrainment at single neuron resolution. Organotypic whole-brain explants were either maintained in constant darkness (DD) for 6 days or exposed to a phase-advancing light pulse on the second day. We find that stronger circadian oscillators support robust overall circuit rhythmicity in DD, whereas weaker oscillators can be pushed toward transient desynchrony and damped amplitude to facilitate a new state of phase-shifted network synchrony. Additionally, we use mathematical modeling to examine how a network composed of distinct oscillator types can give rise to complex dynamic signatures in DD conditions and in response to simulated light pulses. Simulations suggest that complementary coupling mechanisms and a combination of strong and weak oscillators may enable a robust yet flexible circadian network that promotes both synchrony and entrainment. A more complete understanding of how the properties of oscillators and their signaling mechanisms facilitate their distinct roles in light entrainment may allow us to direct and augment the circadian system to speed recovery from jet lag, shift work, and seasonal affective disorder.
Since the relatively recent advent of high-speed flight and artificial lighting, a growing proportion of the human population suffers chrono-disruption due to mismatch between biological and environmental timing. Circadian disruption by events such as jet lag and shift work are implicated in physiological disorders ranging from decreased cognitive performance and weight gain to diabetes and cancer (Stevens and Rea, 2001; Lemmer, 2006; Knutson et al., 2007; Kreier et al., 2007; Maemura et al., 2007; Mazuski and Herzog, 2015). Circadian neural circuits coordinate and synchronize physiological and behavioral activities by integrating environmental cues. Light is the most powerful cue for most organisms (Pittendrigh and Daan, 1976; Tauber and Kyriacou, 2001). Light-evoked changes in mammalian cellular oscillator dynamics are still largely unexplored due to the technical difficulty of introducing a physiological light signal in vitro (Evans et al., 2011; Foley et al., 2011; Webb et al., 2012). For the mammalian circadian pacemaker, the suprachiasmatic nucleus (SCN), physiologically activating retina-mediated photic responses while monitoring large numbers of deep brain individual cellular oscillators by imaging or electrophysiology remains a formidable challenge, both ex vivo and in vivo. However, in the Drosophila circadian system, circuit-wide responses to light can be monitored longitudinally in cultured whole-brain explants (Ayaz et al., 2008; Roberts et al., 2015) due to expression of the blue light receptor cryptochrome (CRY) in circadian neurons (Emery et al., 1998; Stanewsky et al., 1998; Fogle et al., 2011).
To examine dynamic signatures of single-neuron oscillators and their potential roles in entrainment, we analyzed and compared ex vivo and in silico responses to single-oscillator longitudinal light. Ex vivo analysis was based on real-time bioluminescence imaging of the conserved and critical circadian gene period in cultured Drosophila whole-brain explants, as previously described (Roberts et al., 2015). Explants were either maintained in constant darkness for 6 days or exposed to a circadian-time 22-h (CT 22) phase-advancing white light pulse after nearly 2 days in culture. The Drosophila circadian network minimally consists of 6 neuronal subgroups that include large and small ventrolateral neurons (l-LNvs and s-LNvs), dorsolateral neurons (LNds), and 3 subsets of dorsal neurons (DNs 1, 2, and 3) (Sheeba, 2008a). Recent studies have further subdivided these subgroups by chemical or genetic markers (Shafer et al., 2006; Hamasaka et al., 2007; Johard et al., 2009; Zhang et al., 2010a; Zhang et al., 2010b; Collins et al., 2012). Visualization and quantification of longitudinal changes in circadian network phase, amplitude, and synchrony with single-oscillator resolution allow us to compare the contributions of different types of circadian oscillators to free-running behavior and light-induced phase shifts.
Motivated by the striking qualitative trends observed in the whole-brain imaging data, we also developed a mathematical model of a relatively simple network consisting of 3 categories of oscillators with differing light responses, signaling mechanisms, and damping rates. The primary purpose of our model is to explore how and why complex dynamic signatures might emerge, with distinct patterns appearing under constant conditions and in response to a strong phase-advancing stimulus. It has long been recognized that robust and synchronous circadian networks are critical for strong and healthy behavioral outputs. However, our ex vivo findings and computational modeling suggest that transiently desynchronizing and damping certain components of the circadian neural network may be a key adaptive feature of circadian systems that facilitates large shifts in phase while restoring synchronous rhythmicity after the adjustment is complete. The combination of single-cell resolution imaging with mathematical modeling may allow us to predict how the dynamic interplay of complementary oscillatory types and transient desynchrony could be harnessed to generate potential treatments for jet lag, shift work, and seasonal affective disorder.
Materials and Methods
Experimental Bioluminescence Data
Adult, male XLG-Per-Luc flies were entrained to a standard 12-h:12-h LD schedule for ≥3 days. Drosophila whole brains were dissected, cultured, and mounted on the stage of an inverted microscope (Olympus IX71, Tokyo, Japan) as previously described (Roberts et al., 2015), with cycling bioluminescence at single-cell resolution measured at 30-min intervals by the software MetaMorph (Molecular Devices, Sunnyvale, CA). Whole-brain explants were either maintained in constant darkness (DD) for 6 days (n = 12) or exposed to a phase-advancing 12.57 W/m2 (2000 lux), 15-min white light pulse at CT 22 on the second day of DD (n = 12).
Raster Plots (Pseudo-heat Maps)
Pseudo-heat maps of individual oscillator PER-luc expression over time in cultured Drosophila whole-brain explants were generated using MATLAB scripts (version 8.2; MathWorks, Natick, MA). Analysis of experimental data used throughout this study was based on bioluminescence imaging experiments reported previously (Roberts et al., 2015). Pseudo-heat maps were generated for each neuronal subgroup and also stacked for plots of “all cells.” Warmer colors indicate higher amplitude, whereas cooler colors indicate lower amplitude.
Circular Phase Plots (Sine Fit)
Circular phase plots were generated based on sine-fit estimates of wavelet detrended time series using the midpoint of 2-day sliding windows. Custom MATLAB scripts integrated the WMTSA Wavelet Toolkit (C. Cornish, University of Washington, Seattle, WA) for application of a discrete wavelet transform to all data sets. These plots show the phases of individual oscillators categorized by neuronal subgroup as well as for “all cells” (combined across all subgroups from 12 brains). The circular plots display phases in terms of CT, with CT 0 set equal to the overall mean phase of “all cells” for Day 1. The inner circle shows the alpha = 0.05 threshold for the resultant vector for the Rayleigh test. The null hypothesis is that phases are uniformly distributed. If the resultant vector ends outside the inner circle, then the phase distribution is significantly different from the uniform distribution. The absence of plots for certain time points indicates that the rhythmicity of neurons in that subgroup at that time point was too dampened for reliable sine-fit measures (i.e., did not meet the criteria for “reliably rhythmic cells”). Oscillators were deemed reliably rhythmic if their goodness-of-sine-fit was greater than a threshold value of 0.82, their period was between 18 h and 30 h, and their amplitude was at least 1.5, as described by Roberts et al. (2015).
Validation of Sine-fit Estimates
To verify that single-oscillator phases were reliably extracted through sine-fits of the wavelet detrended time series, circular phase plots were also generated using a time delay embedding method. Briefly, the time series were embedded in a higher dimension via lagging by 6 h so that oscillations circle the origin; see Kantz and Schreiber (2003) for details on time delay embedding. The polar angle was then used as a phase estimate. As with the sine-fit estimates, phases are displayed in terms of CT, with CT 0 set equal to the overall mean phase of “all cells” for Day 1. Phase plots generated using 2-dimensional embedded phase analysis showed the same patterns of oscillator activity as plots generated using sine-fit estimates. MATLAB scripts were used to calculate the correlation coefficients (rho) and p values between the time delay embedding estimates and the sine-fit phase estimates across all neuronal subgroups for all time points and conditions. The p value is based on the null hypothesis that there is no correlation in phase estimates between these two methods. The strong positive, linear correlation (indicated by high rho values) and low p values in Supplementary Table S1 confirm that sine-fit estimates of phase using 2-day sliding windows are sufficiently reliable and consistent. The same neurons were analyzed for both methods for corresponding time points, subgroups, and conditions.
Calculation of Order Parameter
To quantify changes in synchrony over time, we use the order parameter R, defined as by Gonze et al. (2005) for a system of N oscillators with state variable X:

where angle brackets denote time average and
Phase Ensemble Animations
Custom MATLAB scripts were used to generate phase ensemble animations based on bioluminescence experimental data comparing changes in phase and amplitude over time among oscillators of brain explants either maintained in constant darkness or exposed to a phase-advancing white light pulse as described by Roberts et al. (2015). The phase of each oscillator is represented by the polar angle of the disks, whereas amplitude is indicated by the radial distance of the disks from the center of the circle (drift toward the center indicates damping amplitude). The animations were generated using custom MATLAB scripts with estimates of phase and amplitude calculated using 2-dimensional embedding applied to wavelet-detrended traces. Phase and amplitude dynamics are shown at 3 levels of resolution: single neuron oscillators (Suppl. Movie 1), individual neuronal subgroups (Suppl. Movie 2), and whole network (Suppl. Movie 3).
Model Simulations
Mathematical modeling was performed using custom MATLAB scripts to explore the qualitative emergent dynamic behaviors of a network composed of different oscillator types, based on current knowledge of what we expect to be present in the Drosophila circadian network. This model provides a simplified negative feedback loop, roughly mimicking that of the circadian transcriptional-translational feedback loop while remaining simple enough for an exact stability analysis (Tyson, 2002). The model is built on 3 types of oscillators with distinct types of signaling, light responses, and degrees of dampening. However, they are not meant to specifically represent particular neuronal subgroups or neurotransmitters. The main premise is to demonstrate through a relatively simple model how different dynamic signatures could be generated and how these could be advantageous to the circadian system.
Each oscillator is simulated using a modified version of the Goodwin model (Bliss et al., 1982; Tyson, 2002) which consists of 3 differential equations forming a negative feedback loop:
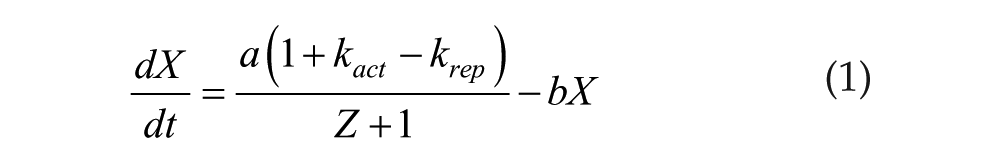


The parameters are set so that oscillations dampen toward steady-state values over time (see Table 1):

Parameter values for Goodwin model.
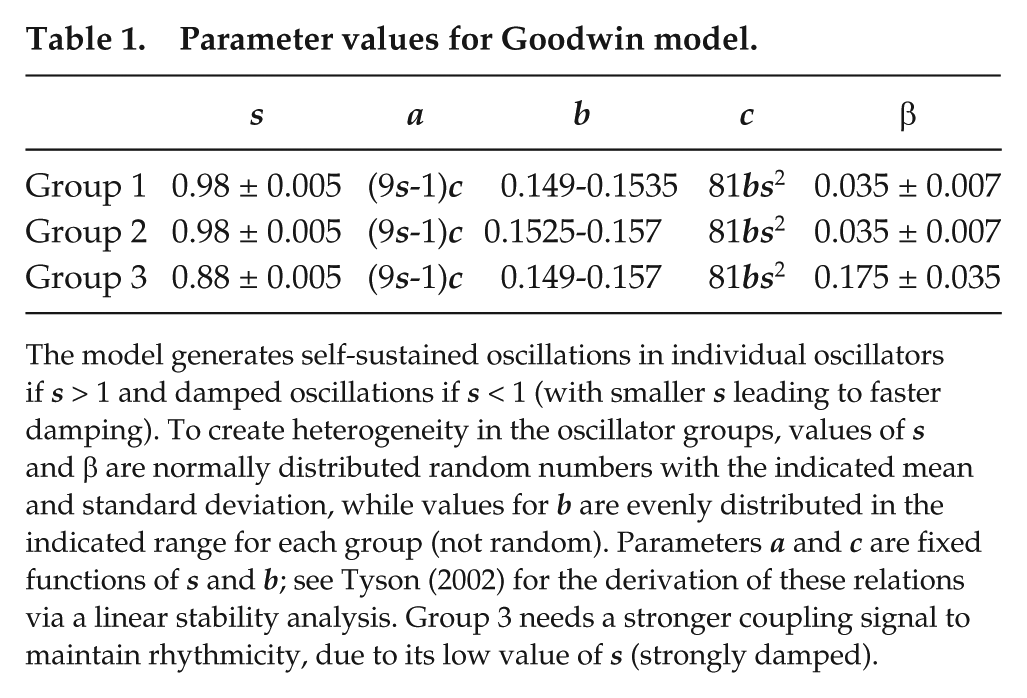
The model generates self-sustained oscillations in individual oscillators if s > 1 and damped oscillations if s < 1 (with smaller s leading to faster damping). To create heterogeneity in the oscillator groups, values of s and β are normally distributed random numbers with the indicated mean and standard deviation, while values for b are evenly distributed in the indicated range for each group (not random). Parameters a and c are fixed functions of s and b; see Tyson (2002) for the derivation of these relations via a linear stability analysis. Group 3 needs a stronger coupling signal to maintain rhythmicity, due to its low value of s (strongly damped).
Although the individual oscillators are damped, the coupled system described below generates sustained oscillations for β > 0.03 under constant conditions and also entrains to light-dark cycles. See Figures M1 through M4 in the Mathematical Modeling Supplement.
To explore the dynamic interactions of damped oscillators with different properties, we created a network of 60 Goodwin oscillators organized into 3 groups. Group 1 oscillators (10 total, numbers 1-10) are directly light responsive, are weakly damped, and send an activating coupling signal that effectively increases the transcription rate a of all oscillators when the Group 1 oscillators have X levels above the theoretical steady-state value
Light response is achieved through increasing the degradation rate parameter c in Equation 3. Both LD entrainment and response to light pulses can be effectively modeled through this mechanism. For example, a light pulse simulated by increasing c by 8% for Group 1 oscillators and by 16% for Group 2 oscillators for 4 h starting 3 h before the peak in mean X results in a large phase advance of nearly 9 h for the coupled system. LD entrainment can be simulated by increasing c by 0.4% for Group 1 oscillators and by 0.8% for Group 2 oscillators for the first 10 h of each 24-h day.
Coupling is achieved through modifying the transcription rate parameter a as indicated in Equation 1. Two complementary types are used for the modeling: kact increases transcriptional activation, whereas krep represses transcription in Equation 1:


All oscillators receive both types of coupling signals, but each group sends a single type of coupling signal. Note that in the alternate simulations where only 1 type of coupling is used, then all 3 groups send the indicated type of signal (activating or repressing). See the Mathematical Modeling Supplement for further details.
Results
Drosophila Circadian Neuronal Subgroups Exhibit Distinct Dynamic Signatures in Constant Darkness and in Response to a Phase-advancing Light Pulse
A longstanding goal in circadian biology has been to discern which aspects of circadian rhythm dynamics and light entrainment are due to the relative contributions of cell autonomous and network properties (Liu et al., 2007; Yan et al., 2007; Sheeba et al., 2008a; Wang et al., 2008). Real-time bioluminescence recordings have previously shown that oscillators in cultured XLG-Per-Luc whole-brain explants maintained in constant darkness exhibit a monotonic decrease in amplitude and synchrony (Fig. 1A, Suppl. Fig. S1) (Roberts et al., 2015). In contrast, perturbation of neuronal subgroups with a 12.57 W/m2 (2000 lux) 15-min phase-advancing white light pulse evokes transient loss of synchrony and amplitude with subsequent recovery of phase-shifted synchrony over time through the process of “phase retuning” (Fig. 1A). The heterogeneity of phase, period, amplitude, synchrony, and light response for each of the neuronal subgroups is qualitatively apparent in raster heat map plots based on bioluminescence reporting of period activity (Fig. 1B). However, questions remain concerning how such a heterogeneous system may arise and how it may be advantageous for circadian behavior and entrainment.
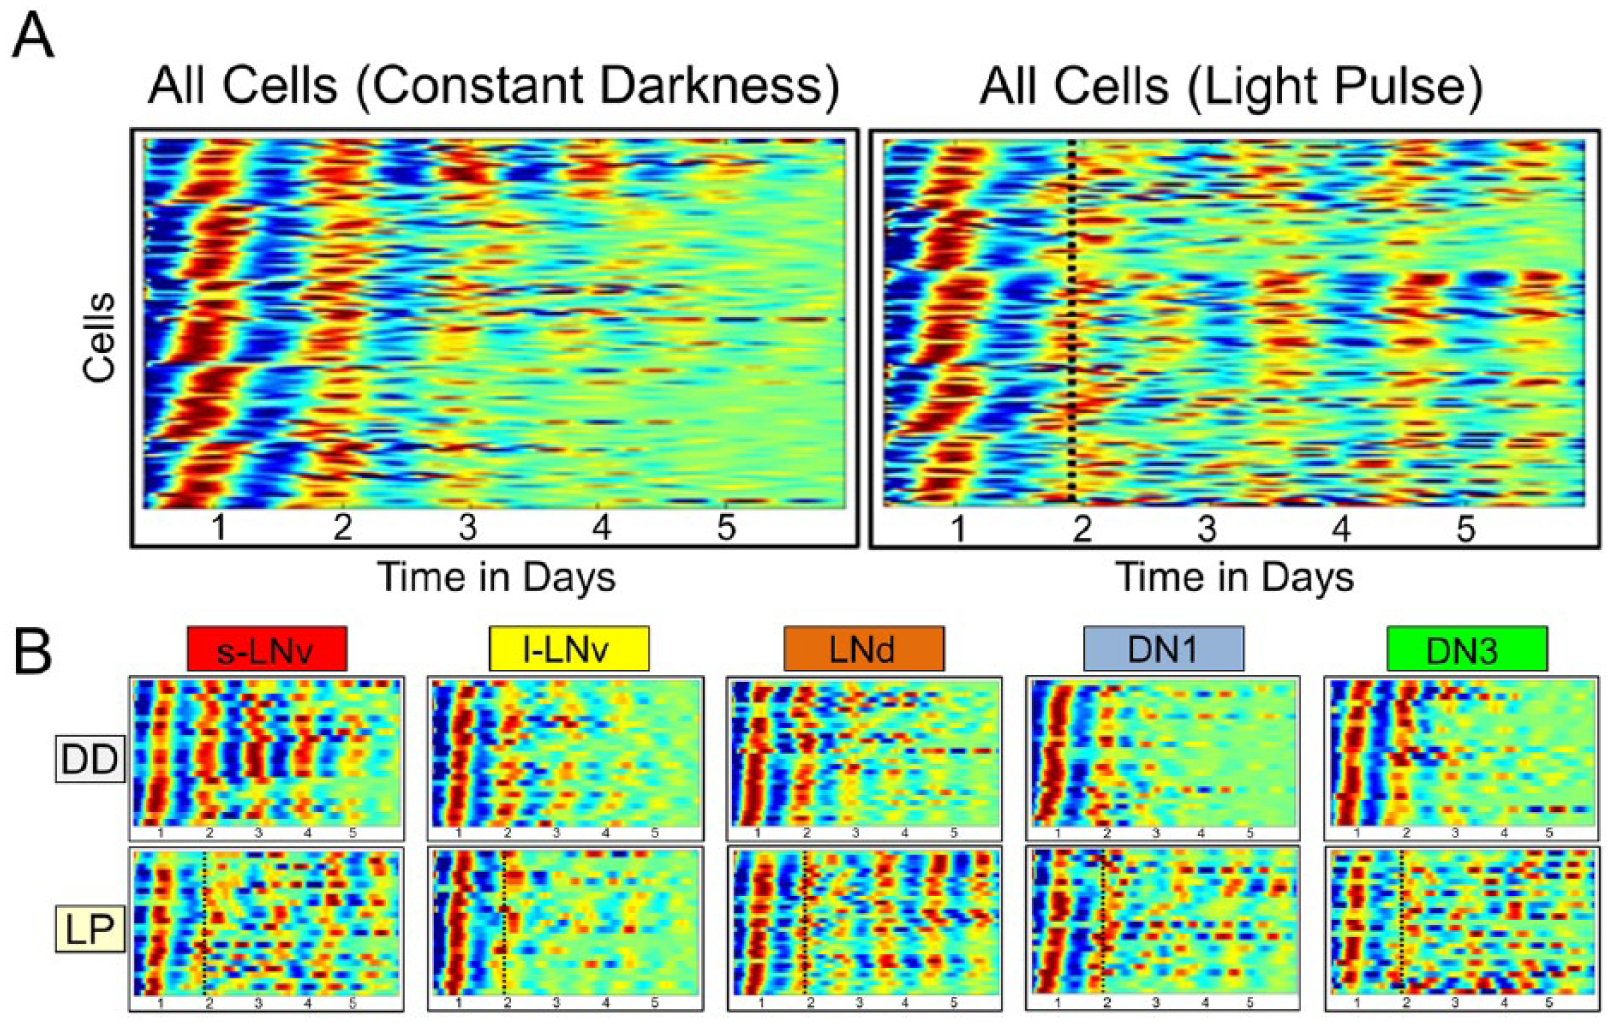
Circadian neurons of cultured whole-brain explants exhibit distinct dynamic signatures in constant darkness and when exposed to a phase-advancing light pulse. Pseudo-heat maps of individual oscillator XLG-Per-Luc expression over time are provided for (A) “all cells” (combined across 12 brains per condition) and (B) each neuronal subgroup. Warmer colors indicate higher amplitude, whereas cooler colors indicate lower amplitude of rhythmic Per expression. (A, left) Cells in DD (n = 122) exhibit a wide range of free-running phases with decreasing phase coherence over time. (A, right) Cells (n = 126) exposed to a 15-min 12.57 W/m2 white light pulse (LP) at CT 22 on the second day in DD (indicated by dotted black line) generally exhibit a transient reduction in phase coherence and amplitude followed by a phase shift and gradual recovery of phase coherence and amplitude over time. (B, Top) l-LNvs (n = 25), LNds (n = 28), DN1s (n = 26), and DN3s (n = 22) in DD generally exhibit a loss of phase coherence and amplitude over time to varying degrees, with the s-LNvs (n = 21) exhibiting the most consistent and robust phase coherence. (B, Bottom) S-LNvs (n = 24), l-LNvs (n = 25), DN1s (n = 26), and DN3s (n = 22) exposed to the LP exhibit distinct dynamic signatures of transient loss followed by delayed recovery of phase-shifted oscillator synchrony (phase retuning) and amplitude following the LP. Note that the LNds (n = 28) appear to exhibit relatively consistent phase coherence and amplitude following the LP, as well as the most rapid phase shift. Raster plots were generated using MATLAB scripts analyzing bioluminescence data reported previously (Roberts et al., 2015).
Drosophila Heterogeneous Circadian Neural Networks Are Robust but Flexible
Cellular circadian oscillators found in the Drosophila circadian network and the mammalian SCN are known to exhibit a wide range of periods, phases, amplitudes, and signaling properties (Peng et al., 2003; Quintero et al., 2003; Schaap et al., 2003; Yamaguchi et al., 2003). To increase our understanding of the roles played by different components of the circadian network, we examined how phase relationships are transiently altered during environmental adaptation. As a basis for comparison, we first observed phase relationships under constant conditions by performing quantified spatiotemporal mapping of single-oscillator phase dynamics using sine-fit phase estimates for cultured adult Drosophila whole-brain explants maintained in constant darkness (DD) for 6 days (Roberts et al., 2015). The results indicate that circadian networks consisting of oscillators with a wide range of intrinsic phases and periods are still capable of maintaining consistent mean network phase and robust phase synchrony as shown by the phase angle at or very close to CT 0 over time in the absence of perturbation by environmental cues (Fig. 2A, top row). This remarkably consistent network phase relationship is highly robust in the whole-brain preparation as shown by little deviation of the phase vector angle for all oscillators from CT 0 over multiple days. However, the circadian neural network is also capable of a strong response when stimulated with a 15-min phase-advancing light pulse (LP) at CT 22 of the second day in DD, which evokes transient phase dispersion followed by resynchronization of phase-shifted oscillators (Fig. 2A, bottom row).
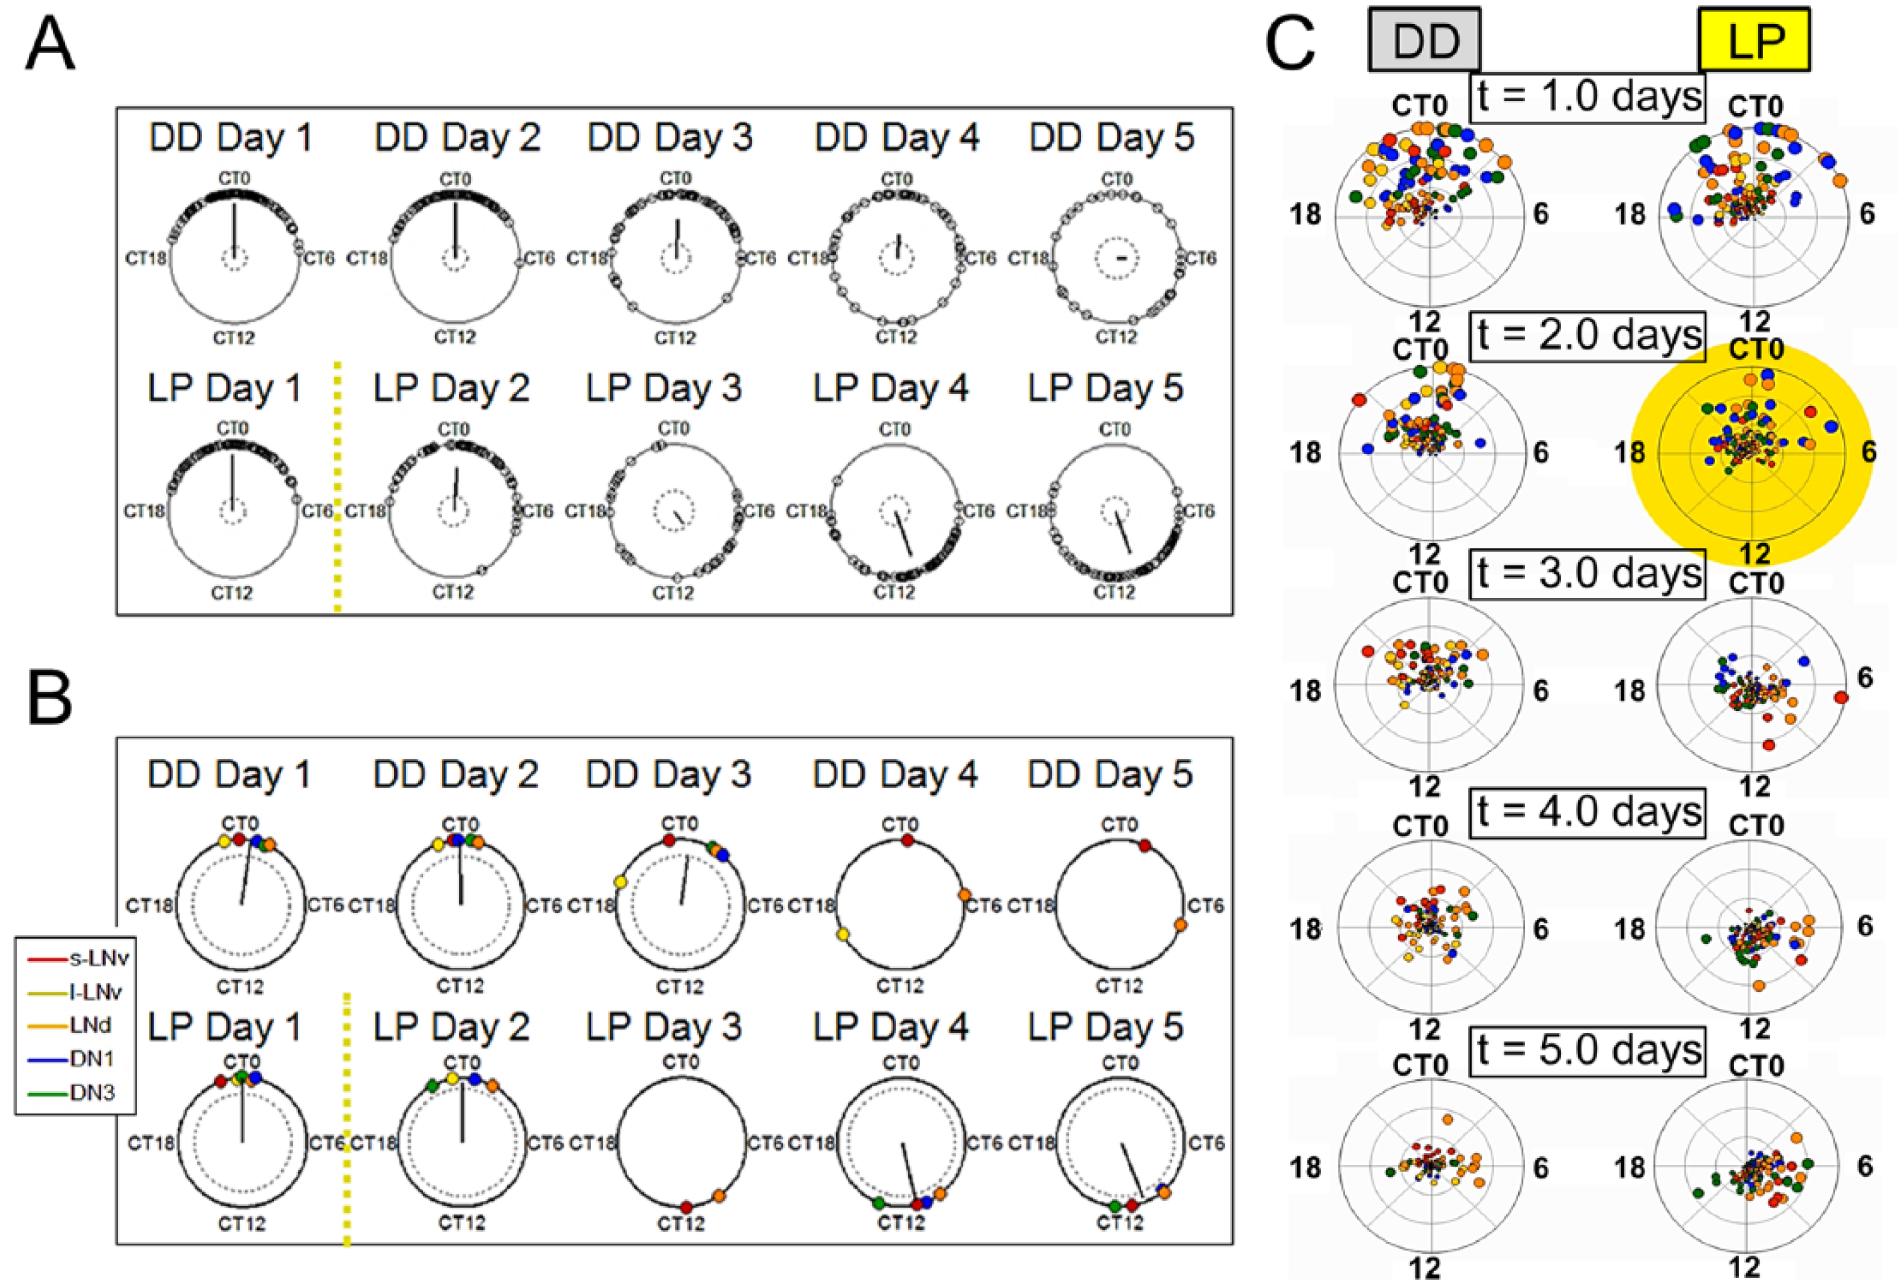
Drosophila circadian neural networks show significant differences in inter- and intrasubgroup dynamics in constant darkness and in response to a phase-advancing light pulse. Circular plots of sine-fit phase estimates using the midpoint of 2-day sliding windows are shown for (A) individual phases of “all cells” (combined across all neuronal subgroups from 12 brains) and (B) phases taken from the mean trace of each neuronal subgroup in (A, B top) constant darkness (DD) and (A, B bottom) following the phase-advancing light pulse (LP). The phase angles are shown for s-LNvs (red), l-LNvs (yellow), LNds (orange), DN1s (blue), and DN3s (green). A yellow dotted line divides the general time frames of pre-LP and post-LP exposure. If the resultant vectors end outside of the inner circles (representing the α = 0.05 threshold for each Rayleigh test; the test is not run if there are <4 rhythmic subgroups), then the phases are significantly concentrated around the mean phase. The null hypothesis is that the phases are uniformly distributed. In 2B, the mean phases for neuronal subgroups were excluded at certain time points if the subgroup (1) did not have any reliably rhythmic cells at that time point or (2) did not have sufficient phase coherence to provide a reliable mean phase estimate. (C) Snapshots of selected time points from Suppl. Movie 1 showing changes in single-oscillator phase and amplitude over time in DD (left) and in response to the LP (right). The LP is represented by a yellow highlight on Day 2. The disks representing each of the subgroups are colored the same as previous figures. The angle of the disks around the circle represents phase, and the distance of the disks from the center represents amplitude. Phase and amplitude were estimated using 2-dimensional embedding applied to wavelet detrended traces for each individual oscillator. Circular phase plots were generated using MATLAB scripts. See “Experimental Procedures” for details.
To examine the emergent roles of individual neuronal subgroups, we compared subgroups’ mean phases and amplitudes in Figure 2B. Neuronal subgroups as a whole are considered to have significant desynchrony or damped amplitude at any time point if the mean output phase cannot be measured. This is qualitatively apparent by the absence of a color-coded disk representing a subgroup’s mean phase, because no phase estimates can be reliably calculated as the phase coherence and/or amplitude is too low (Fig. 2B). In this study, we describe oscillators as “weak” or “strong” based on the robustness of their free-running activity in DD. As the s-LNvs and LNds are the only neuronal subgroups to exhibit robust phase coherence throughout recordings, they are considered stronger neuronal subgroups (Fig. 2B). Conversely, the DN3s, DN1s, and l-LNvs are considered weaker oscillators as they exhibit significant desynchrony and/or damped amplitude by the end of the recordings in DD. By comparing interneuronal subgroup dynamics, we observe that the s-LNvs are the only subgroup to maintain a robust and consistent mean phase near CT 0 throughout the recordings. Interestingly, the s-LNvs exhibit the most rapid phase dispersion and damped amplitude in response to the phase-advancing light pulse. Another pivotal subgroup is the LNds, the only subgroup to maintain phase coherence and exhibit a high-fidelity rapid phase shift of 2 h (Suppl. Fig. S2) by Day 3 after the LP. This analysis shows that the LNds did not just begin to shift on Day 3, which is observed to a lesser extent in the DN3s and s-LNvs, but immediately achieved the large final phase shift. This provides evidence that the LNds are not just first responders but likely have a more important role in pulling the network to the new phase state. Conversely, the amplitude and phase coherence of all other subgroups are transiently suppressed following the light pulse. Snapshots of animations of bioluminescence experimental data from Supplemental Movie 1 of single-oscillator phase ensembles over time are shown to demonstrate the complexity and diverse range of oscillator activities in DD and in response to the LP (Fig. 2C). To more clearly compare complex cell autonomous and whole network dynamics in DD and in response to a phase-advancing light pulse, we generated dynamic movie animations of oscillator phase ensembles based on quantified bioluminescence data at 3 degrees of resolution: single neuron (Suppl. Movie 1, disks color coded by neuronal subgroup), individual neuronal subgroup (Suppl. Movie 2, disks color coded by neuronal subgroup), and whole network average (Suppl. Movie 3). These movies convey the complexity of quantified circadian oscillators’ dynamics and allow for clearer simultaneous, longitudinal comparisons of circadian network activity. Movie 1, showing single-oscillator resolution, demonstrates how oscillator dynamics within and between subgroups would be practically impossible to discern using the standard static measures such as immunocytochemistry. These results motivated us to map the complex phase dynamics and explore their potential effects on endogenous rhythms and response to light cues.
Quantification of Neuron Subgroups’ Phases in Constant Darkness Reveals Complementary Intersubgroup Free-running Phase Dynamics
Studies suggest that dynamic changes in phase relationships and synchrony among autonomous oscillators distributed throughout a circadian circuit can generate distinct physiological outputs such as seasonal adaption (Inagaki et al., 2007; Stoleru et al., 2007; Coomans et al., 2015a; Coomans et al., 2015b). By quantifying individual oscillator phase and overall subgroup phase coherence, we mapped the distinct dynamic signatures of neuron subgroups in whole-brain explants maintained in constant darkness (Fig. 3). As previously described, most subgroups exhibit a monotonic decrease in rhythmic strength and phase coherence over time in DD (Roberts et al., 2015). We observe that the s-LNvs, which are considered the core pacemaker neurons (Yang and Sehgal, 2001; Shafer et al., 2002; Helfrich-Förster, 2003), appear to have the most strongly coherent and consistent phases in DD relative to other subgroups (Fig. 3). More importantly, the s-LNvs are the only subgroup that exhibits a robust and consistent mean phase, with a phase angle very close to CT 0 that approximates the overall network’s mean phase over time (compare Suppl. Movies 2 and 3). This indicates that the s-LNvs may have a predominant role in maintaining free-running rhythms over time in DD. Similarly, weaker oscillators such as the DN1s and DN3s exhibit relatively consistent mean phases with phase angles very close to CT 0 but relatively greater phase dispersion than the s-LNvs after 3 to 4 days in DD. Intriguingly, the l-LNvs and LNds exhibit coherent but nearly opposite phase relationships over time so that the mean network phase is still consistently maintained near CT 0. The consistency of the overall mean network phase remains robust in spite of the increased spread of single oscillators’ phases over time, suggesting that even free-running activity is not merely stochastic but remains measurably coordinated at the network level. The next step was to observe how these relationships might change following the application of a phase-advancing light pulse to Drosophila whole-brain explants.
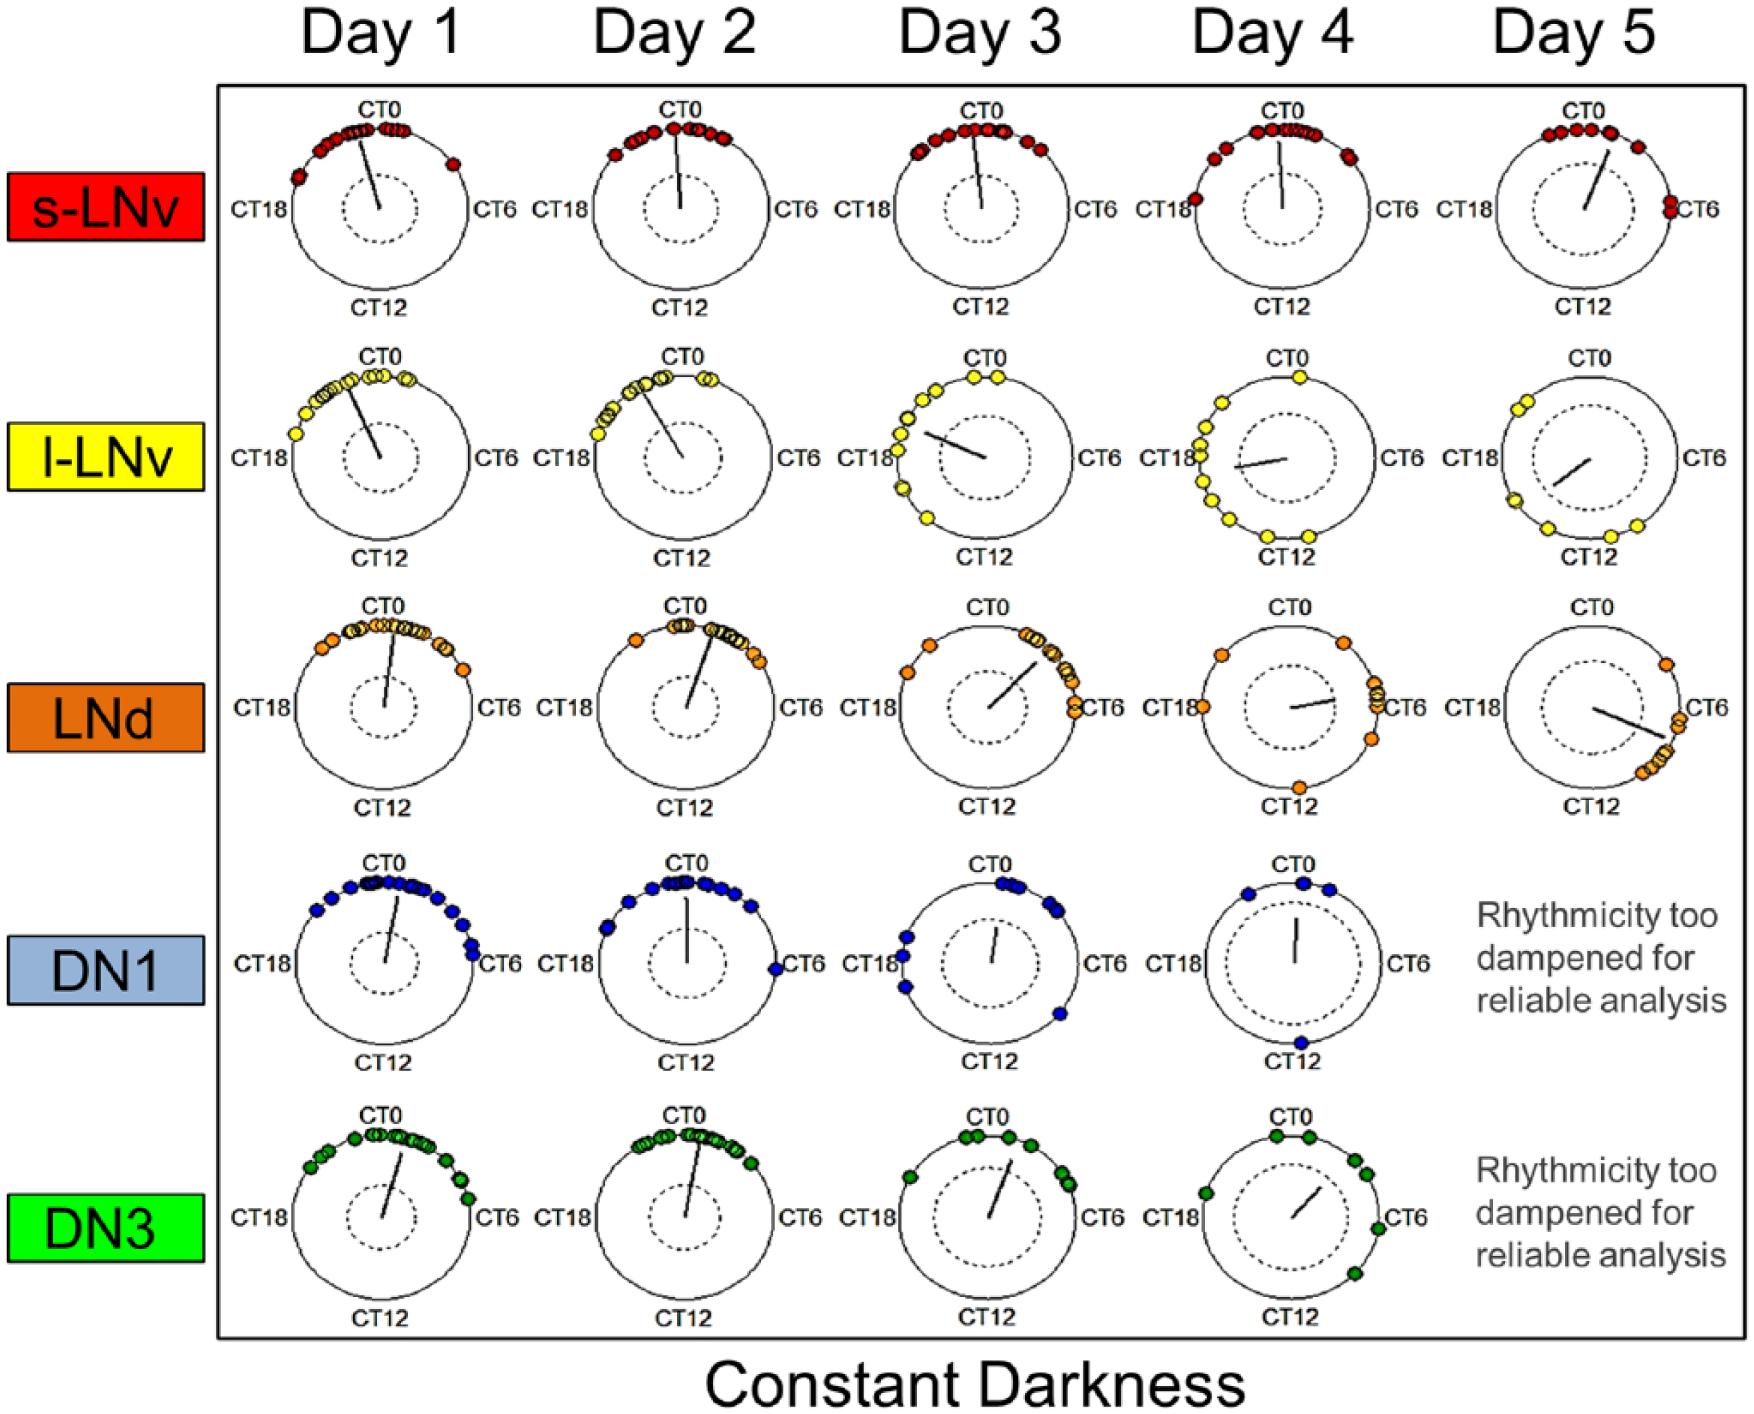
Quantification of neuron subgroups’ dynamics in constant darkness reveals distinct differences in phases, periods, and degrees of phase dispersion over time. Phases of individual oscillators categorized by neuronal subgroup are shown in circular plots based on sine-fit phase estimates using the midpoint of 2-day sliding windows. To compare relative phase shifts over time, phases were normalized such that overall mean phase for Day 1 for “all cells” is circadian time 0 (CT 0). Neuronal subgroups in DD reveal a wide range of phases and periods and generally exhibit gradual phase dispersion over time, with the notable exception of the s-LNvs. If the resultant vectors end outside the inner circles, then the phase distribution significantly differs from the uniform distribution. The absence of plots for certain time points indicates that rhythmicity for all oscillators was too damped for reliable sine-fit measures.
A Light-evoked Phase Shift Pushes Most Oscillators toward Quantitative Transient Desynchrony and Damped Amplitude before the Network Adopts a New State of Phase-shifted Synchrony
The physiological importance of robust, coordinated, and consistent circadian oscillations has long been recognized. However, recent studies and models have revealed that more complex dynamics of synchrony and single-oscillator activities may underlie circadian adaptations to events such as seasons, travel across time zones, and shift work (Schaap et al., 2003; Leise and Siegelmann, 2006; Stoleru et al., 2007; An et al., 2013; Muraro et al., 2013; Coomans et al., 2015b; Roberts et al., 2015). To examine the response of the circadian network to light more closely, we measured the intricate spatiotemporal phase dynamics of individual oscillator responses to a phase-advancing light pulse (Fig. 4). Intriguingly, the strong s-LNvs, which exhibit the most robust rhythms over time in DD, conversely exhibit the most rapid phase dispersion following the LP on Day 2 and do not recover significant phase coherence until Day 4. However, the mean phase shift achieved by the s-LNvs on Day 5 most closely approximates the final mean phase shift achieved by the overall network (compare Fig. 2A with Fig. 4). In contrast, oscillators that exhibit generally weaker free-running oscillations, such as the DN3s and DN1s, maintain relatively greater intrasubgroup phase coherence immediately following the light pulse on Day 2 but exhibit significant loss of phase coherence by Day 3. The DN3s do not express Cry and are thus not directly photosensitive. However, the DN3s exhibit a more immediate mean phase advance compared with the stronger s-LNvs. The small but immediate light-evoked phase shift observed in the “light blind” DN3s indicates that the neural connections in the organotypic whole-brain explants are still sufficiently intact for communication from the Cry-expressing circadian neurons. However, the DN3s also exhibit the smallest mean phase shift by the end of the recordings. As observed in DD, the l-LNvs and LNds exhibit a seemingly complementary relationship in which the l-LNvs show significant dampening of rhythmicity by Day 3 following the light pulse, whereas the LNds show an increase in phase coherence by Day 3 following the light pulse (Suppl. Figs. S2 and S3). The LNds are the first subgroup to complete the phase shift, achieving a large phase advance by Day 3 (Fig. 4, Suppl. Fig. S3).
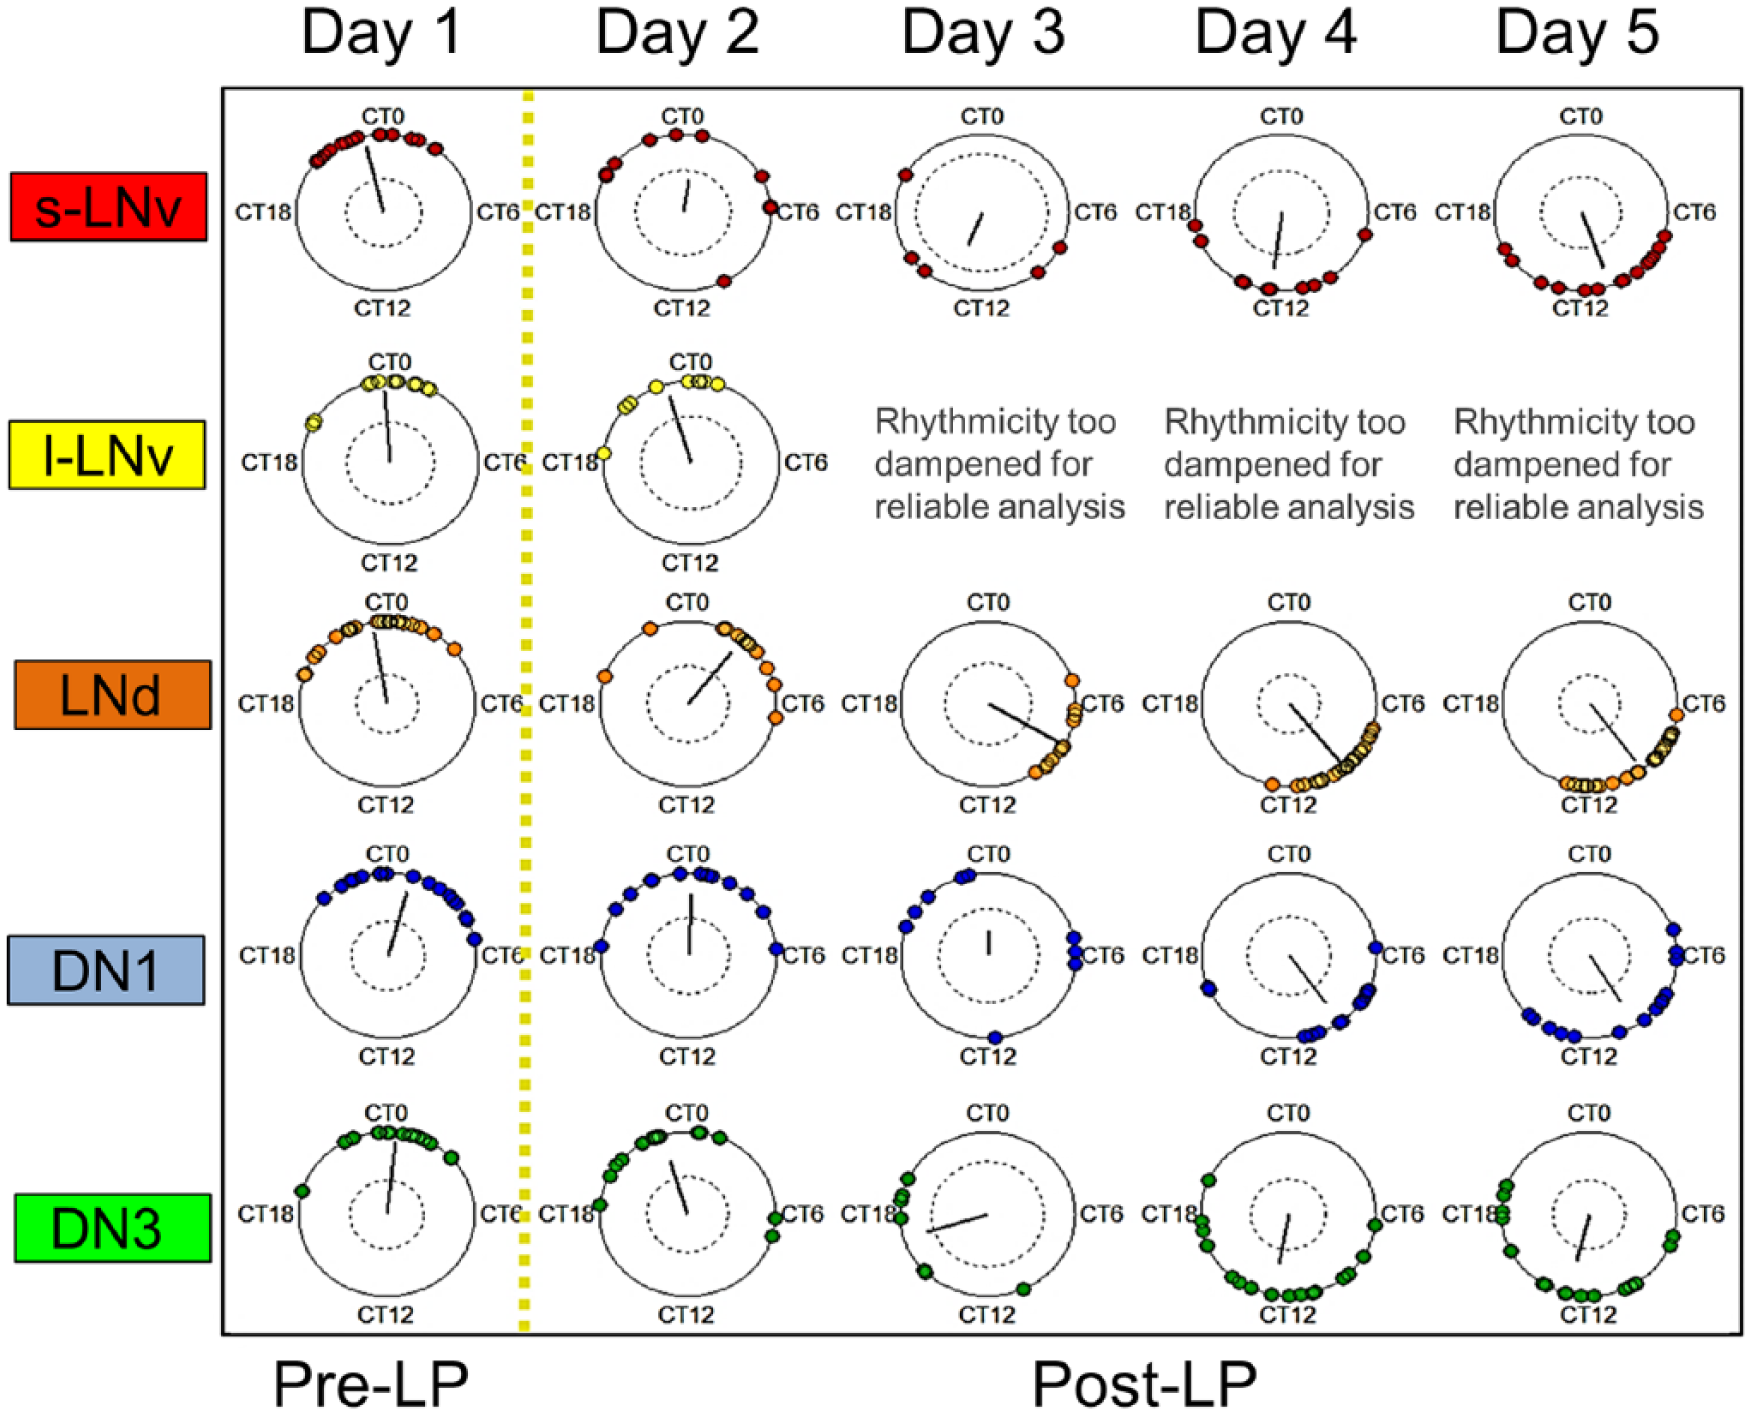
Neuronal subgroups exposed to a phase-advancing light pulse exhibit distinct dynamics of loss and recovery of phase-shifted synchronous oscillations. Circular phase plots reveal distinct neuronal subgroups’ dynamics of phase response to a light pulse (the yellow dotted line divides the general time frames of pre-LP and post-LP exposure). Neuronal subgroups generally exhibit significant phase dispersion following exposure to the LP, with the exception of the LNds and DN3s. Relative to corresponding subgroups in DD, neuronal subgroups also generally exhibit significantly greater phase coherence and a shift in mean phase 3 to 4 days after the light pulse. The inner circles represent the α = 0.05 threshold for each Rayleigh test, with the null hypothesis that phases are uniformly distributed.
To verify that single-oscillator phases were reliably extracted though sine-fit estimates of wavelet detrended time series, we also calculated oscillator phases in DD (Suppl. Figs. S4 and S5) and in response to the LP (Suppl. Fig. S6) using a 2-dimensional time delay embedding method (see supplementary material for details). The strong, positive correlation in phase estimates between the sine-fit and time-delay embedding phase methods confirms that quantified trends of dynamic oscillator activity in both light conditions and across all subgroups are reliable and consistent (Suppl. Table S1). The complex and distinct dynamics exhibited by these neuronal subgroups motivated us to use mathematical modeling to explore what network and oscillator properties may generate these dynamics and the potential benefits.
Mathematical Modeling of Circadian Network Dynamics Demonstrates Potential Benefits of Complementary Coupling and a Mix of Strong and Weak Oscillators
To study the key features leading to the complex emergent dynamics observed in the experimental oscillator relationships, we developed a relatively simple mathematical model of a coupled network of 60 oscillators based on a modified Goodwin model (Tyson, 2002). The oscillators are divided into 3 groups with differing light responses, inhibitory versus excitatory coupling signal, and oscillator damping rate. These features are based on our current ideas about qualitative features of the Drosophila circadian circuit guided by the literature (Collins et al., 2014; Dissel et al., 2014; Yao and Shafer, 2014) and our own experimental data. Group 1 oscillators (10 total) are moderately light responsive, are weakly damped, and send a phased coupling signal that effectively increases the transcription rate of all oscillators. Group 2 oscillators (10 total) are strongly light responsive, are weakly damped, and transmit a coupling signal that effectively decreases the transcription rate of all oscillators. The times of the activating and repressing coupling signals were chosen to be nearly antiphase to each other in order to promote synchronization. Group 3 oscillators (40 total) are not light responsive, are strongly damped, and send a repressing coupling signal similar to that of Group 2. See the Methods and the Mathematical Modeling Supplement for a complete description of the model. The model is not meant to directly represent particular neuronal subgroups or neurotransmitters, as we lack sufficient knowledge to create a detailed model at this time. The model simulations reproduce many of the general emergent patterns of free-running behavior and light response observed in our empirical data (Fig. 5A-C). In DD simulations, we observe a monotonic decrease in amplitude and synchrony for all groups, with the Group 1 oscillators maintaining relatively high-amplitude, synchronous oscillations in the absence of perturbations. In contrast, a simulated, phase-advancing light pulse transiently suppresses the amplitudes and scrambles the phases of oscillators in Groups 1 and 3, followed by a delayed recovery and strengthening of both amplitude and phase coherence relative to corresponding oscillators in the DD condition. Note that Group 2 oscillators display an immediate increase in amplitude and phase synchrony in response to the light pulse and push the network toward a new state of phase-shifted synchrony.
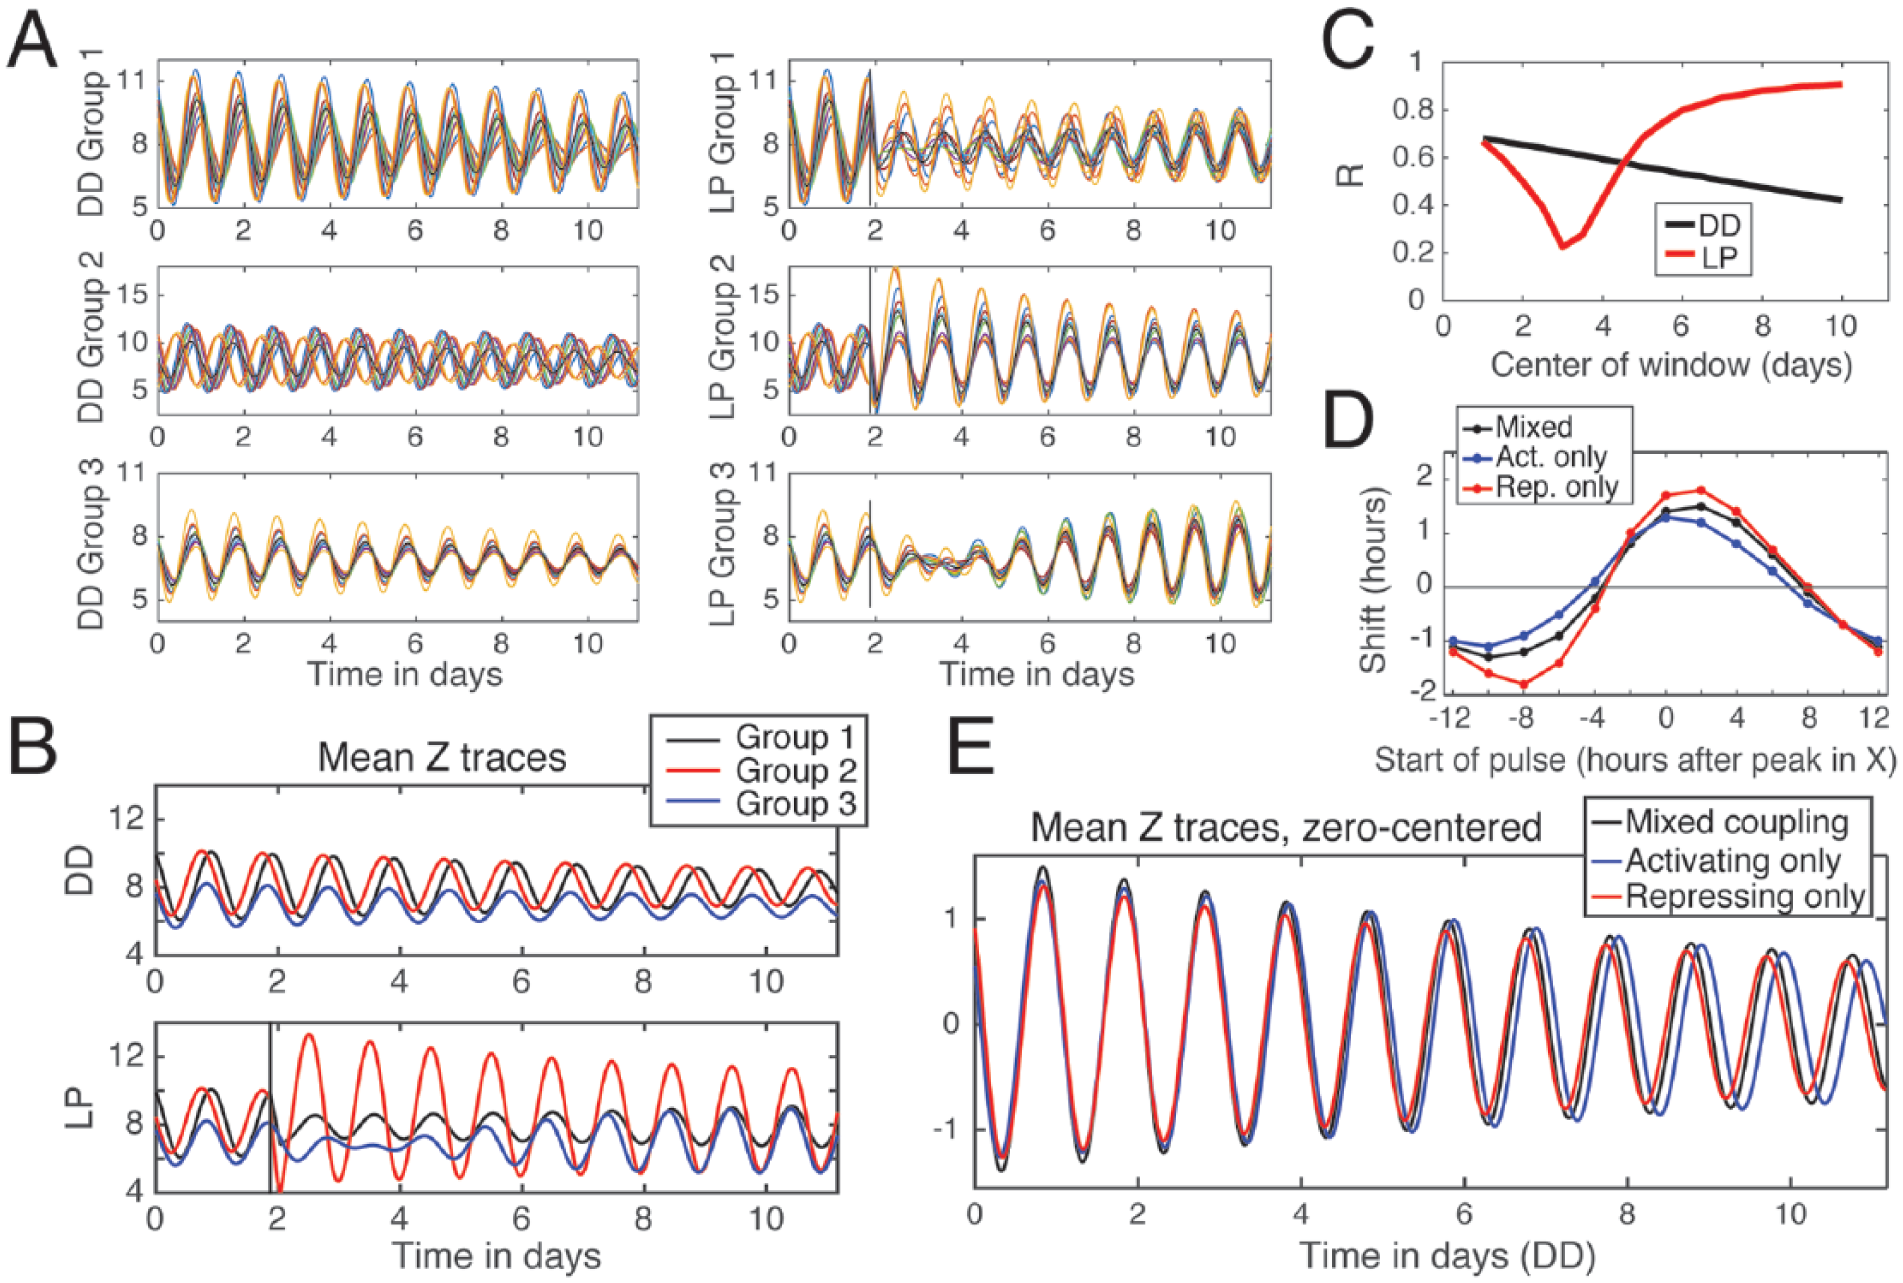
Mathematical modeling of circadian network dynamics indicates the importance of complementary coupling of strong and weak oscillators in synchronization and adaptation. The general dynamic signatures of oscillator synchrony and phase retuning by light are modeled using 3 oscillator groups coupled by complementary activating and repressing signals. (A) Three oscillator groups (60 oscillators total) are simulated either in constant darkness (A, left) or in response to a phase-advancing light pulse (A, right), using a modified version of the Goodwin model (Tyson, 2002). Traces of the Z variable are shown here. Rate parameters are set to generate damped circadian oscillations. Group 1 (10 oscillators) is light responsive and sends a signal that increases transcription rate. Group 2 (10 oscillators) is light responsive, has a shorter period, and sends a signal that decreases transcription rate. Group 3 (40 oscillators, but only 10 representative oscillators shown in figures for clarity) is not directly light responsive, is more strongly damped, and sends a signal that decreases transcription rate. (B) Mean traces of the Z variable from each of the 3 groups of oscillators show that Group 2 oscillators exhibit an increase in amplitude following the LP and are the first group to exhibit a phase advance. (C) As observed with bioluminescence data, the simulated oscillators exposed to a phase-advancing light pulse (red trace) exhibit a mean decrease in order parameter R, followed by a delayed increase in R relative to oscillators in DD (black trace). R varies between 0 and 1, with higher values indicating similarity in phase, period, and waveform. (D) Phase response curves of simulated systems, with all oscillators having only excitatory signals (activating only), only inhibitor signals (repressing only), or a complementary system with a mix of both signaling types. (E) Simulations in constant darkness show that the complementary system has an intermediate period length relative to activating-only and repressing-only systems. Simulations were generated using custom MATLAB scripts. See Materials and Methods for details.
To explore the potential benefits of complementary coupling, we also performed simulations with “activating-only” coupling, in which all oscillators send coupling signals that increase transcription, and “repressing-only” coupling, in which all oscillators send coupling signals that decrease transcription (Fig. 5D, 5E). The equations and parameters for these contrasting models are identical apart from the differences in coupling. Activating-only coupling results in a lower order parameter R and reduced magnitude of phase shifts as shown on the simulated phase response curve (Fig. 5D) and also a reduced phase advance in response to the 4-h light pulse (Figs. M5 and M6 in the Mathematical Modeling Supplement). Furthermore, these oscillators have a longer overall period of 24.3 h in DD compared with a period of 23.9 h in DD for the mixed coupling model (Fig. 5E). In contrast, repressing-only coupling results in a slightly shorter overall period of 23.7 h in DD and somewhat larger phase shifts (Fig. 5D, 5E; see also Fig. M3 in the Mathematical Modeling Supplement). Furthermore, the repressing-only coupling can be less stable in terms of greatly increased responses to light pulses if the coupling strength is decreased, compared with the cases of activating-only and mixed coupling (Figs. M9-M11 in the Mathematical Modeling Supplement). One benefit of the complementary coupling mechanisms is that increasing the coupling strength minimally effects the system’s period while greatly increasing the overall synchronization and amplitude, as shown in Figures M3 and M4. This allows for adaptive changes in phase coherence and amplitude with only slight changes to the period. The period itself may be adjusted by altering the balance between activating and repressing coupling, which tend to respectively lengthen and shorten the period.
As shown in Figures M12 through M15 in the Mathematical Modeling Supplement, the system exhibits a higher order parameter R when the system contains both weaker and stronger oscillators (indicating that the system is more easily synchronized), and the weaker oscillators are also necessary for the advancing light pulse to cause a transient dip in R followed by an overshoot. However, too great of a damping rate in the weaker oscillators will reduce the overall coherence of the system, as shown in Figure M16. Thus, the presence of both stronger and weaker oscillators appears to play a key role in the dynamics of the system.
Discussion
The present study combines ex vivo experimental bioluminescence data with in silico model simulations to provide evidence for how circadian networks with a mix of strong and weak oscillators and complementary coupling mechanisms may contribute to robust yet responsive oscillations. Due to an increasing awareness of the detrimental effects of chrono-disruption by common environmental events and features such as jet lag, shift work, and late-night screen viewing time, numerous investigators have examined the importance of consistent and synchronized rhythms (Colwell et al., 2003; Yamaguchi et al., 2003). However, recent studies have shown that desynchrony is not always pathological and even varies between seasons (Schaap et al., 2003; Herzog et al., 2004; Stoleru et al., 2007; An et al., 2013; Hastings et al., 2014; Coomans et al., 2015b; Roberts et al., 2015). Using custom analysis of real-time bioluminescence datasets, we show the first detailed spatiotemporal mapping of dynamic phase relationships within an entire circadian neural circuit, at single neuron resolution, both in DD and in response to a light pulse. The complexity of multiday single-oscillator phase dynamics revealed here underlines the difficulty in understanding biological clocks by cross-sectional methods such as immunocytochemistry or acute electrophysiology and shows the importance of longitudinal analysis of single-cell circadian rhythms by methods such as whole-brain bioluminescence imaging.
Accordingly, we endeavored to quantify and map the spatiotemporal dynamics of oscillators in whole Drosophila brain explants either maintained in constant darkness (DD) or exposed to a phase-advancing light pulse (LP). Although recent studies have further subdivided the Drosophila circadian circuit based on neuropeptide or genetic markers (Veleri et al., 2003; Gonze et al., 2005; Nitabach and Taghert, 2008; Zhang et al., 2010a; Zhang et al., 2010b; Collins et al., 2012), analysis in this study was limited to the classic anatomically recognized s-LNv, l-LNv, LNd, DN1, and DN3 subgroups. Future studies will functionally dissect further subdivisions of the circuit. Numerous studies have investigated how the intrinsic and heterogeneous activities of autonomous single-cell oscillators distributed throughout circadian circuits map to daily behavioral rhythms and entrainment. Subregions of the SCN have been shown to have a diverse range of periods, phases, and dynamics of light response (Evans et al., 2011; Foley et al., 2011). In this study, we confirm that even in the absence of perturbation by external cues, different components of the Drosophila circadian circuit display a wide range of intrinsic oscillator phases, periods, and phase coherence. Interestingly, the heterogeneous circadian oscillators have complementary activities in whole-brain explants maintained in DD so that the network as a whole still exhibits a remarkably robust and consistent overall mean phase over time despite the increased spread in the oscillators’ periods and phases over time. This indicates that the activity of these heterogeneous groups does not merely become stochastic in DD but that their phases remain coordinated to some extent. The stability and coherence of oscillator phases over time in DD also further support the robustness and utility of cultured XLG-Per-Luc whole-brain explants. We observe that the s-LNvs, which exhibit strongly consistent and coherent free-running rhythms, have a mean phase that most closely matches the overall network mean phase for all 6 days of recording. Although the weaker DN1s and DN3s also show a relatively consistent mean phase over time, they exhibit more rapid damping of amplitude and phase dispersion over time. The LNds and l-LNvs also exhibit coherent phases over time in DD but do not maintain a consistent mean phase near CT 0. This supports previous studies indicating that the s-LNvs have key roles as pacemaker neurons (Yang and Sehgal, 2001; Shafer et al., 2002; Helfrich-Förster, 2003). However, the mean phase of the circuit as a whole also appears to be generated by the complementary dynamics of the fast-paced (<24-h period) l-LNvs and slow-paced (>24-h period) LNds. Although these subgroups both exhibit significant and coherent phase drift in DD, the network mean phase is maintained due to the nearly exact mirroring of their opposite phase drifts over time. The complementary activities of the l-LNvs and LNds agree with previous findings of slow-paced and fast-paced oscillators (Dissel et al., 2014). This is intriguing, as these 2 subgroups also appear to have complementary responses to a phase-advancing light pulse, in which the LNds exhibit an immediate increase in amplitude and phase coherence whereas the l-LNvs show an immediate decrease in amplitude and phase coherence. The complementary activities of the LNds and l-LNvs in DD and in response to a phase-advancing light pulse suggest that the l-LNvs and LNds may play unique roles in circadian network responses to cues of different phases. We also emphasize the potential roles of the weaker DN1s and DN3s, which recover synchrony much more quickly than the stronger s-LNvs following exposure to the light pulse. This agrees with previous work indicating that weaker oscillators can adjust their phase more readily and enhance resynchrony (Webb et al., 2012). These findings suggest that certain cells may intrinsically maintain more stable phases for supporting robust free-running circadian rhythms, whereas more weakly circadian cells may have faster or slower intrinsic rhythms to enable more flexible adaptation to environmental changes.
The dual importance of the strength of circadian rhythms along with plasticity of circadian networks to enable adaptation to various environmental cues is a critical feature. By combining single-cell phase dynamic analysis of ex vivo whole-circuit bioluminescence experimental data with computational modeling of emergent network dynamics, we provide evidence that transiently desynchronizing and damping most oscillators in a neural network may actually be a key feature for facilitating entrainment by light for the whole circuit. We postulate that a phase-advancing light pulse at CT 22 scrambles most oscillators’ phases and suppresses amplitudes so that stronger oscillators such as the LNds, which exhibit an increase in phase coherence and amplitude, can lead the rest of the transiently weakened network toward a new state of phase-shifted synchrony. Although altering oscillators’ phase coherence or amplitudes may have different downstream consequences, we observe that dynamic changes in coherence and amplitude appear to coincide in response to the phase-advancing light pulse. This is also important for the mammalian SCN, for which the phase and amplitude of coupling for both damped and sustained oscillators have been shown to be critical for synchrony and entrainment (Ananthasubramaniam et al., 2014). Thus, there is precedent for this coupling paradigm in circadian models.
In both the DD and LP conditions, we observe that there is always at least one group of strong oscillators, such as the s-LNvs and LNds, which appear to contribute to maintaining robust network mean phase over time. We previously showed that the LNds have an unexplained increase in phase coherence by the end of the recording following a phase-advancing light pulse (Roberts et al., 2016). However, our new analysis here shows that the LNds exhibit an immediate increase in phase coherence and amplitude following the LP that coincides with their phase advance. Our mathematical modeling suggests that this increase in amplitude may be critical for shifting the rest of the network into a new advanced phase. Although the LNds exhibit the most immediate phase shift and increase in amplitude following the LP, we note that the phase shift achieved by the s-LNvs on Day 5 most closely approximates the mean network phase shift on Day 5. This suggests that although the LNds appear to lead the phase shift, the new state of phase-shifted network synchrony is not achieved for behavioral output until other circuit elements such as the s-LNvs contribute to the ensemble output. This indicates that both of these strong oscillator groups may have distinct contributions for the emergent behavioral output in response to the phase-advancing light pulse. Although the weaker DN1s and DN3s maintain relatively consistent, but less coherent mean phase in DD, a phase-advancing light pulse appears to transiently desynchronize and dampen their rhythms so that strong oscillators can drive the network toward the new state of phase-shifted synchrony. We observe that the DN3s, which are not directly light-sensitive, show a more immediate coherent phase shift than any other subgroup except the LNds. However, the DN3s subsequently exhibit the most gradual phase shift that does not reach the mean network phase shift by the end of the recordings. These findings support previous studies indicating that transiently weakening oscillator coupling and rhythmicity may enable circuits to more easily adapt to phase shifts, whereas networks that are too rigid and fixed may have reduced entrainment capacities (Tsumoto et al., 2011; Webb et al., 2012; An et al., 2013; Freeman et al., 2013; Yamaguchi et al., 2013; Hatori et al., 2014; Lamba et al., 2014; Roberts et al., 2015).
Our computational modeling allowed us to explore the potential roles of complementary coupling mechanisms in producing the key features of the distinct dynamic signatures observed in our experimental imaging. Although this is a relatively simple model derived from general circadian trends observed in previous literature and our own experimental data, previous studies have shown that varying just a few key parameters can reproduce experimentally observed circadian features (Tokuda et al., 2005). Our model simulations demonstrate how a complementary system of mixed signaling may enable robust but flexible period length, amplitude, synchrony, and capacity for large phase shifts. These simulations agree with previous experimental and modeling studies which showed that complementary excitatory and inhibitory interactions between faster-paced and slower-paced neuronal oscillators allow for fine-tuning of emergent period and phase (Sheeba et al., 2008b; Dissel et al., 2014; Yao and Shafer, 2014; DeWoskin et al., 2015). Our modeling also suggests that adjusting the balance between coupling types may enable either more robust rhythms or greater network adaptability to environmental cues.
By combining quantitative, single-oscillator phase dynamics analysis of ex vivo whole-circuit bioluminescence experimental data with mathematical modeling of complementary oscillator types, we provide evidence that stronger circadian neurons contribute to maintaining robust rhythms whereas weaker oscillators confer the flexibility to respond to environmental cues by large phase advances. However, it is still unclear how the complex phase relationships found among oscillators across and even within neuronal subgroups precisely map to circadian behavior and entrainment. Further research is also necessary to assess the precise interplay of neurochemical and/or gene signaling during a light-evoked phase shift that increases the amplitude of certain oscillators such as the LNds but may push other oscillators toward a transient state of desynchrony and damped amplitude. Future studies may incorporate pharmacological and genetic targeting of network coupling between stronger and weaker oscillators to explore how this dynamic process may be induced, amplified, and harnessed to treat conditions such as jet lag, shift work, and seasonal affective disorder.
Footnotes
Notes
References
Supplementary Material
Please find the following supplemental material available below.
For Open Access articles published under a Creative Commons License, all supplemental material carries the same license as the article it is associated with.
For non-Open Access articles published, all supplemental material carries a non-exclusive license, and permission requests for re-use of supplemental material or any part of supplemental material shall be sent directly to the copyright owner as specified in the copyright notice associated with the article.