
Abstract
A number of factors can contribute to a delayed sleep schedule. An important factor could be a daily profile of light exposure favoring a later circadian phase. This study aimed to compare light exposure between 14 young adults complaining of a delayed sleep schedule and 14 matched controls and to identify possible associations between habitual light exposure and circadian phase. Exposure to white and blue light was recorded with ambulatory monitors for 7 consecutive days. Participants also noted their daily use of light-emitting devices before bedtime. Endogenous circadian phase was estimated with the dim light melatonin onset (DLMO) in the laboratory. The amplitude of the light-dark cycle to which the subjects were exposed was smaller in delayed than in control subjects, and smaller amplitude was associated with a later DLMO. Smaller amplitude was due to both decreased exposure in the daytime and increased exposure at night. Total exposure to blue light, but not to white light, was lower in delayed subjects, possibly due to lower exposure to blue-rich outdoor light. Lower daily exposure to blue light was associated with a later DLMO. Timing of relative increases and decreases of light exposure in relation to endogenous circadian phase was also compared between the 2 groups. In delayed subjects, there was a relatively higher exposure to white and blue light 2 h after DLMO, a circadian time with maximal phase-delaying effect. Delayed participants also had higher exposure to light 8 to 10 h after DLMO, which occurred mostly during their sleep episode but may have some phase-advancing effects. Self-reported use of light-emitting devices before bedtime was higher in delayed than in control subjects and was associated with a later DLMO. This study suggests that individuals complaining of a delayed sleep schedule engage in light-related behaviors favoring a later circadian phase and a later bedtime.
Keywords
A late sleep schedule is common in young adults and is often associated with a delayed circadian phase of entrainment (Micic et al., 2016). Given that the main environmental synchronizer used by the central circadian clock to entrain to the 24-h day is the light-dark cycle (Duffy and Wright, 2005), daily light exposure may contribute to a delayed circadian phase in individuals complaining of a late sleep schedule.
Two aspects of habitual 24-h light exposure profiles need to be considered in ambulatory subjects: the amplitude of the light-dark cycle to which the individuals are exposed, and the timing of exposure to relatively higher intensities of light over the 24 h. The amplitude of the day-night contrast in light intensity defines the strength of the light-dark cycle as a circadian synchronizer (Roenneberg et al., 2003a). In individuals with an endogenous period longer than 24 h, which is the case for most humans (Duffy et al., 2011), theory of entrainment predicts that a smaller amplitude of the light-dark cycle leads to a later circadian phase (Roenneberg et al., 2003a). Indeed, previous studies have reported lower daily average of minutes spent outdoors in individuals with a later sleep schedule (Roenneberg et al., 2003b; Harada et al., 2002; Goulet et al., 2007; Scheuermaier et al., 2010), which may decrease their exposure to bright, blue-rich light and lower the amplitude of the light-dark cycle to which they are exposed.
In addition to day-night contrast, timing of light exposure is a crucial factor involved in circadian entrainment (Duffy and Wright, 2005). It has been proposed that increased light exposure in the evening or early night may delay circadian phase, thereby contributing to the difficulty in advancing bedtime and wake time in individuals complaining of a late sleep schedule (Auger et al., 2011; Chang et al., 2009; Joo et al., 2017). However, the effect of light exposure on circadian phase does not depend on the timing of light exposure in relation to sleep time but rather in relation to the individual’s endogenous circadian phase (Roenneberg et al., 2003a), which can be determined by the onset of melatonin production measured in dim light (the dim light melatonin onset, or DLMO) (Benloucif et al., 2008; Lewy et al., 1999). DLMO occurs on average about 2.5 h before habitual bedtime (Martin and Eastman, 2002; Mongrain et al., 2004) but was found to be much earlier in a significant proportion of late sleepers (Moderie et al., 2017, Mongrain et al., 2004, Murray et al., 2017). Therefore, describing the timing of light exposure in relation to habitual sleep time does not necessarily provide the same information as its distribution in relation to circadian phase. Moreover, the circadian system does not respond to specific light intensities but rather to the relative increases and decreases of light levels throughout the 24 h (Beersma et al., 2009; Duffy and Wright, 2005; Usui, 2000). Consequently, it is advised to assess the relative distribution of light exposure over the 24 h, rather than absolute light intensities, when interpreting the timing of light exposure in relation to circadian phase. Finally, even though the full spectrum of light contributes to circadian entrainment, the circadian system is most sensitive to short wavelengths in the range of 460 to 480 nm (blue light) (Lockley et al., 2003; Lucas et al., 2014). When characterizing the light-dark cycle in relation to circadian entrainment in late sleepers, it is therefore of interest to evaluate habitual exposure not only to white light but also specifically to blue light.
Light, and especially blue light, not only has circadian effects but also has stimulant properties (Chellappa et al., 2011; Vandewalle et al., 2016). Therefore, light exposure before bedtime can increase arousal levels and contribute to delaying sleep onset. Over the past decade, technologies using light-emitting diodes (LEDs) have become increasingly popular and are widespread in the screens of backlit devices such as computers, tablets, and cell phones (Tosini et al., 2016). Blue light from these devices has a relatively low intensity, but the peak of emission closely matches the peak of sensitivity of the circadian system (Cajochen et al., 2011; Gronli et al., 2016) and can therefore produce significant physiological effects. Some recent studies support the hypothesis that the use of light-emitting devices before bedtime contributes to delaying bedtime and circadian phase (Chang et al., 2015; Gradisar et al., 2013; Green et al., 2017). To date, habitual use of light-emitting devices before bedtime has not been examined in individuals complaining of a late sleep schedule.
The present study aims to characterize habitual exposure to both white and blue light in young adults complaining of a delayed sleep schedule compared with matched control subjects and to identify possible associations between habitual light exposure and circadian phase. It was hypothesized that compared with control subjects, individuals complaining of a delayed sleep schedule (1) are exposed to a light-dark cycle of a smaller amplitude, due to lower daytime exposure and/or higher nighttime exposure, (2) are exposed to relatively higher light intensities at circadian times producing phase delays, and (3) report a greater use of light-emitting devices in the 3 h before their habitual bedtime.
Materials and Methods
Subjects
Twenty-eight healthy young adults (18-28 years old) were recruited through advertisements displayed at universities and on the research center’s website. Fourteen subjects (8 women, 6 men, 21.3 ± 1.2 years old) were included in the “delayed group”; inclusion criteria were a habitual bedtime later than midnight with a complaint of a difficulty adapting their sleep timing to standard work/school schedules. They were compared with a control group composed of 14 matched subjects (8 women, 6 men, 22.1 ± 2.5 years old) who had no complaint about their sleep schedule and reported a habitual bedtime before midnight. Details on subjects’ selection can be found in Moderie et al. (2017), and subjects’ characteristics are presented in Table 1. Briefly, all subjects were nonsmokers and reported to be in good health. No participant had significant depressive symptoms (score >19) on the Center for Epidemiologic Studies Depression Scale (CES-D) (Morin et al., 2011), and none were using a medication known to affect sleep or light sensitivity. All subjects were examined by an optometrist to exclude retinopathy or abnormal color vision. The study was approved by the ethics committee of the Sacre-Coeur Hospital of Montreal (No. 2013-878). All participants signed the approved consent form and received financial compensation for their participation.
Characteristics of the participants and photoperiod during the study (mean ± SD).
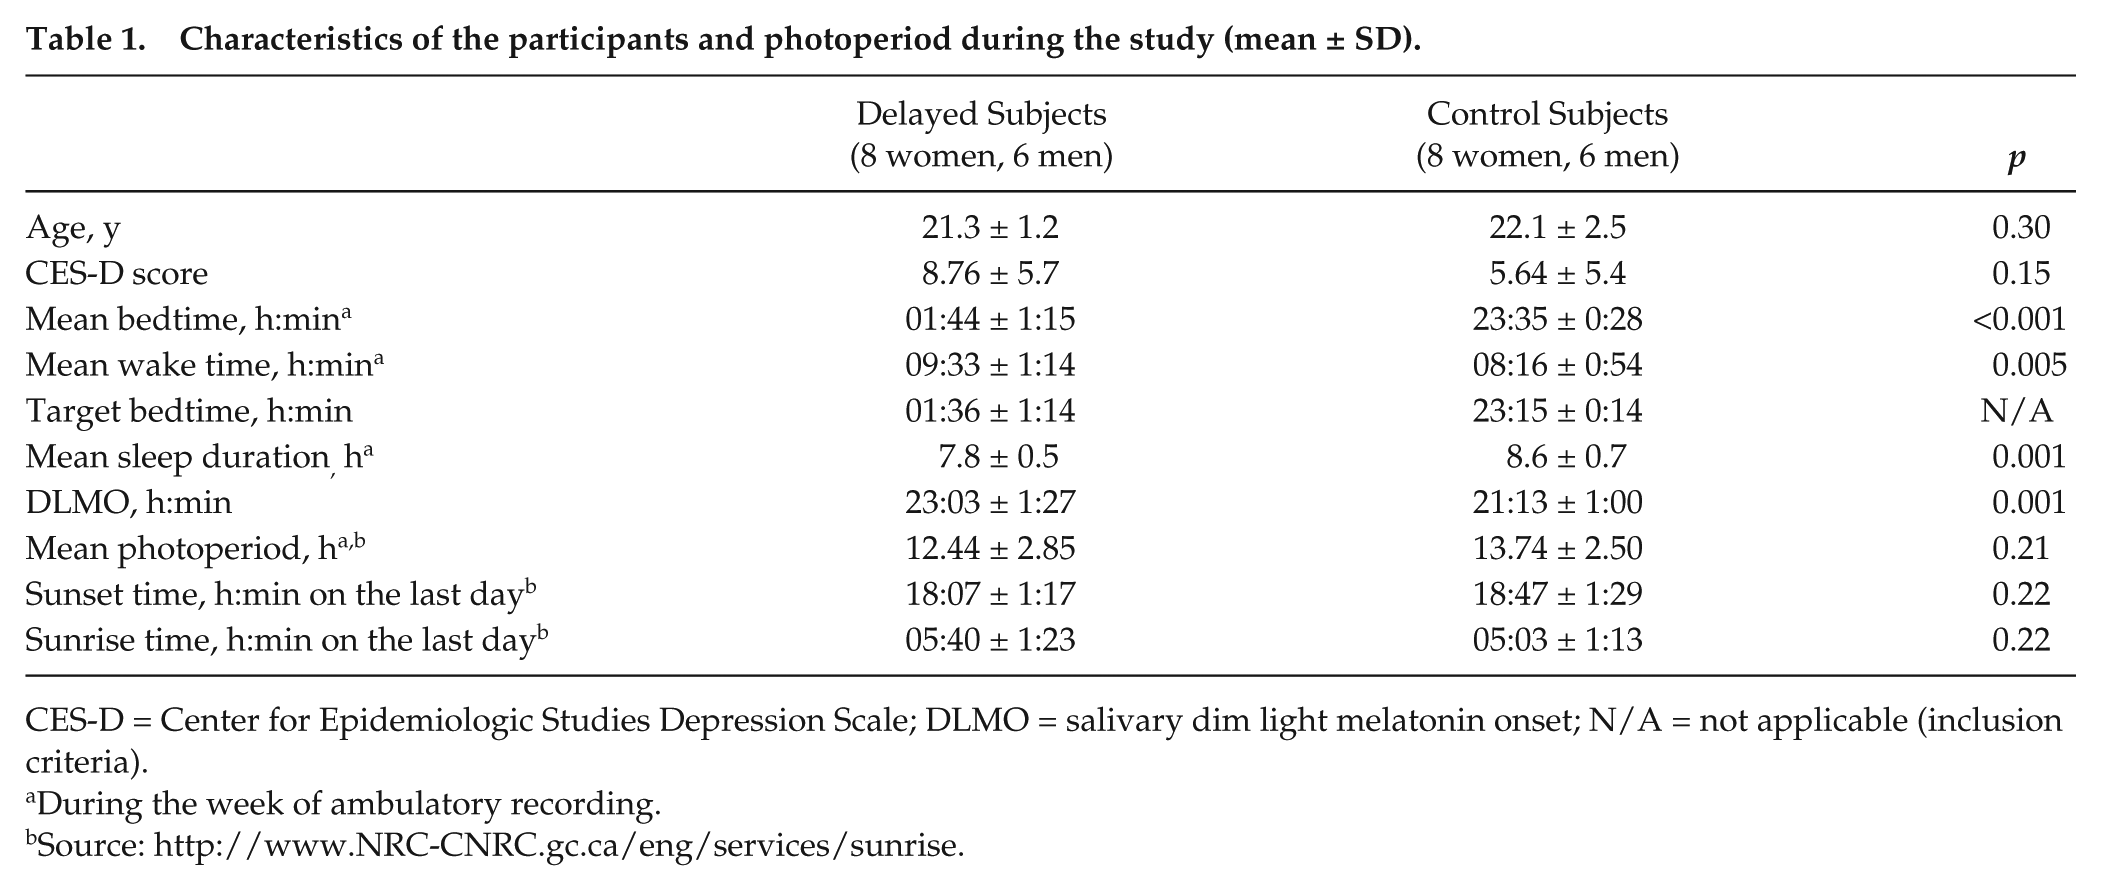
CES-D = Center for Epidemiologic Studies Depression Scale; DLMO = salivary dim light melatonin onset; N/A = not applicable (inclusion criteria).
During the week of ambulatory recording.
Procedures
The research protocol included 7 days of ambulatory recordings followed by an 8-h laboratory session during which circadian phase was estimated with salivary DLMO. The study was conducted year-round, but most participants were assessed in summer (10 control and 8 delayed subjects). Sunrise and sunset times during the week of ambulatory recordings, as well as photoperiod duration, were not significantly different between the 2 groups of subjects (see Table 1).
Sleep schedule and sleep diary
Participants completed a 1-week screening sleep diary prior to the study, while following their habitual sleep schedule. Based on the mean bedtime during the screening week and after discussion with the participants, a target bedtime reflecting their habitual bedtime was chosen. Target bedtime was on average 0136 h (±1:14) in the delayed group and 2315 h (±0:14) in the control group (Table 1). Participants kept their target bedtime (±1 h) for the 7 days of ambulatory recordings, as confirmed with 24-h wrist actigraphy (Actiwatch-2; Philips-Respironics, Andover, MA). Wake time was not restricted. Participants also had to fill out a sleep diary asking for their bedtime, wake time, and moments when ambulatory monitors were not worn. Bedtime and wake time during the week of ambulatory recordings were determined according to the best fit between sleep diary data and activity data collected with the wrist actigraph.
The sleep diary included a question regarding the evening use of light-emitting devices (cell phone, tablet, computer, TV, etc.). Participants were asked to report which device was used, at what time, and for how long. For each subject, the number of minutes of use during the 3 h prior to bedtime was averaged over the 7 days of recording.
Ambulatory light recording
Light exposure was measured with an ambulatory photometer (Actiwatch Spectrum; Philips-Respironics) equipped to record light exposure by 1-min epochs for white light and for 3 wavelength bands corresponding to blue (400-500 nm), green (500-600 nm), and red (600-700 nm) light. Wrist bands were removed and replaced by a secure clip allowing the subjects to pin the monitor over their clothes (including overcoats when outside) at shoulder height. Participants were instructed to wear the monitor at all times when awake and to place the monitor face up on their bedside table during nighttime sleep. They had to press the event marker when they removed the monitor at bedtime and again when they put it back on at wake time. Participants were also asked to note in their diary all periods longer than 30 min when they removed the device because of incompatible activities (e.g., swimming).
Four Spectrum monitors were used for the study. A calibration was conducted at the beginning of the study to standardize light intensities measured by the different monitors. Four calibration curves were calculated for each monitor: one for white light and, using narrow band-pass filters (Edmund Optics Inc, Barrington, NJ,) one for blue (480 nm), green (550 nm), and red (620 nm) light, respectively. Data recorded with the Spectrum monitors were compared with data obtained in the same conditions using a photometer (Lutron LX-1108; Duncan Instruments Canada Ltd, Weston, ON) for white light (in lux) and a radiometer (PM100D; Thorlabs, Newton, NJ) for blue, green, and red lights (in µW/cm2). Linear correction factors were then calculated and applied to the data recorded with each sensor of each monitor during the study.
As noted by Price et al. (2012), wavelengths around 480 nm are inadequately measured by the Spectrum monitors and attributed in part to the green sensor sensitivity range rather than the blue. Following the authors’ recommendation, a linear combination of the data from the blue and green sensors was calculated with a ratio of 5:1 to provide a better approximation of blue light exposure.
Circadian phase assessment
Circadian phase was estimated with the salivary DLMO measured in controlled conditions in the laboratory. Details of the procedure are provided in a previous publication (Moderie et al., 2017). Briefly, participants were admitted to the laboratory 5 h before their habitual bedtime and remained seated except for brief trips to the connecting bathroom. Twelve samples were collected at 30-min intervals in dim light (<5 lux at eye level), starting 30 min after admission. The use of light-emitting devices was not permitted. Melatonin concentration was determined with Bühlmann Direct Saliva Melatonin ELISA (ALPCO Diagnostics, Windham, NH). The time of DLMO was calculated by interpolation using the higher of 2 criteria: 3 pg/mL or the mean plus 2 SD of the first 3 samples. This threshold provided estimates of DLMO within 15 min of those estimated visually from the melatonin curves.
Data Analysis
Except for light data recorded during sleep time, data recorded when the subjects reported not wearing the monitor were removed from the data set, as well as data recorded during any period of more than 30 consecutive minutes of stable light exposure and no activity, suggesting that the monitor was not worn (Goulet et al., 2007). Light data were log-transformed to normalize the distribution. For each day of each subject, light data were averaged for each hour of the day. Only hours with a minimum of 30 min of valid data were kept for the analyses. Hourly data from each day were then averaged for each hour over the 7 days of recording. For each hour, averaged data of each subject included a minimum of 4 days of valid data. Amplitude of the exposure to the light-dark cycle was estimated for each participant with a regression model, fitting a cosine curve to hourly data of each subject, using the least squares method. The formula is the same as the one used for single-component cosinor analysis (Cornelissen, 2014): Y(t) = M + Acos(2πt/τ + φ) + e(t), where M is the mesor (a rhythm-adjusted mean), A is the amplitude (half the extent of predictable variation within a cycle), φ is the acrophase (time of highest values in the cycle), τ is the period (set at 24 h in our analyses), e(t) is the error term, and t is time. Amplitude of estimated curves was compared between groups with t tests, and Pearson correlations were computed between amplitude and DLMO.
Daily profiles of log-transformed light exposure data were compared between the 2 groups using Group by Time (2 × 24) repeated-measures analyses of variance (ANOVA). Huynh-Feldt correction was applied to repeated measures, but original degrees of freedom are reported. A significant interaction was followed by simple effect analyses to assess group differences at each hour of the day. For the analyses in relation to circadian phase, hourly data of white and blue light exposure were first transformed in percentage of the daily mean of each subject to obtain relative profiles of light exposure, independent from total light exposure. Data in percentage of the mean were then averaged for each hour before and after DLMO. Relative light exposure profiles were then compared between the 2 groups using 2 × 24 repeated-measures ANOVA.
Finally, minutes of reported use of light-emitting devices during the 3 h before bedtime, averaged over the 7 days of sleep diaries, were compared between the 2 groups using t tests. Associations between minutes of use of light-emitting devices before bedtime and circadian phase were assessed with Pearson correlations.
Analyses were performed using SPSS (version 24; IBM, Armonk, NY). Significance was set at p ≤ 0.05. The correction controlling for the false discovery rate (FDR) was applied to simple effect analyses to adjust significance levels for multiple comparisons (Benjamini and Hochberg, 1995). Data are presented as mean ± SD, except when specified otherwise.
Results
Sleep Schedule and Circadian Phase
Participants’ sleep schedules during the week of ambulatory recording, as well as the circadian phase estimated with the DLMO in the laboratory, were reported in a previous publication (Moderie et al., 2017) and are presented in Table 1. Real bedtime confirmed with actigraphy was close to target bedtime in both groups. Wake time was later and sleep duration shorter in the delayed compared with the control group. DLMO was about 2 h later in the delayed group than in the control group.
Amplitude of Daily Exposure to the Light-dark Cycle
Estimated amplitude of daily exposure to the light-dark cycle estimated with cosinor analyses was lower in the group of delayed participants compared with controls, for exposure to white light (p = 0.001) and to blue light (p = 0.02). A lower amplitude of exposure to the light-dark cycle was associated with a later DLMO for both white light (r = −0.61, p = 0.001) and blue light (r = −0.53, p = 0.004).
Hourly profiles of exposure to white and blue light are illustrated in Figure 1. For white light, there was no significant main effect of Group (F1,26 = 2.04; p = 0.17). A Group by Time interaction (F23,598 = 6.96; p < 0.001) revealed more exposure during the night in delayed than in control subjects but more exposure for control subjects in the morning. The association between averaged daily exposure to white light and DLMO was not significant (r = −0.29, p = 0.14).
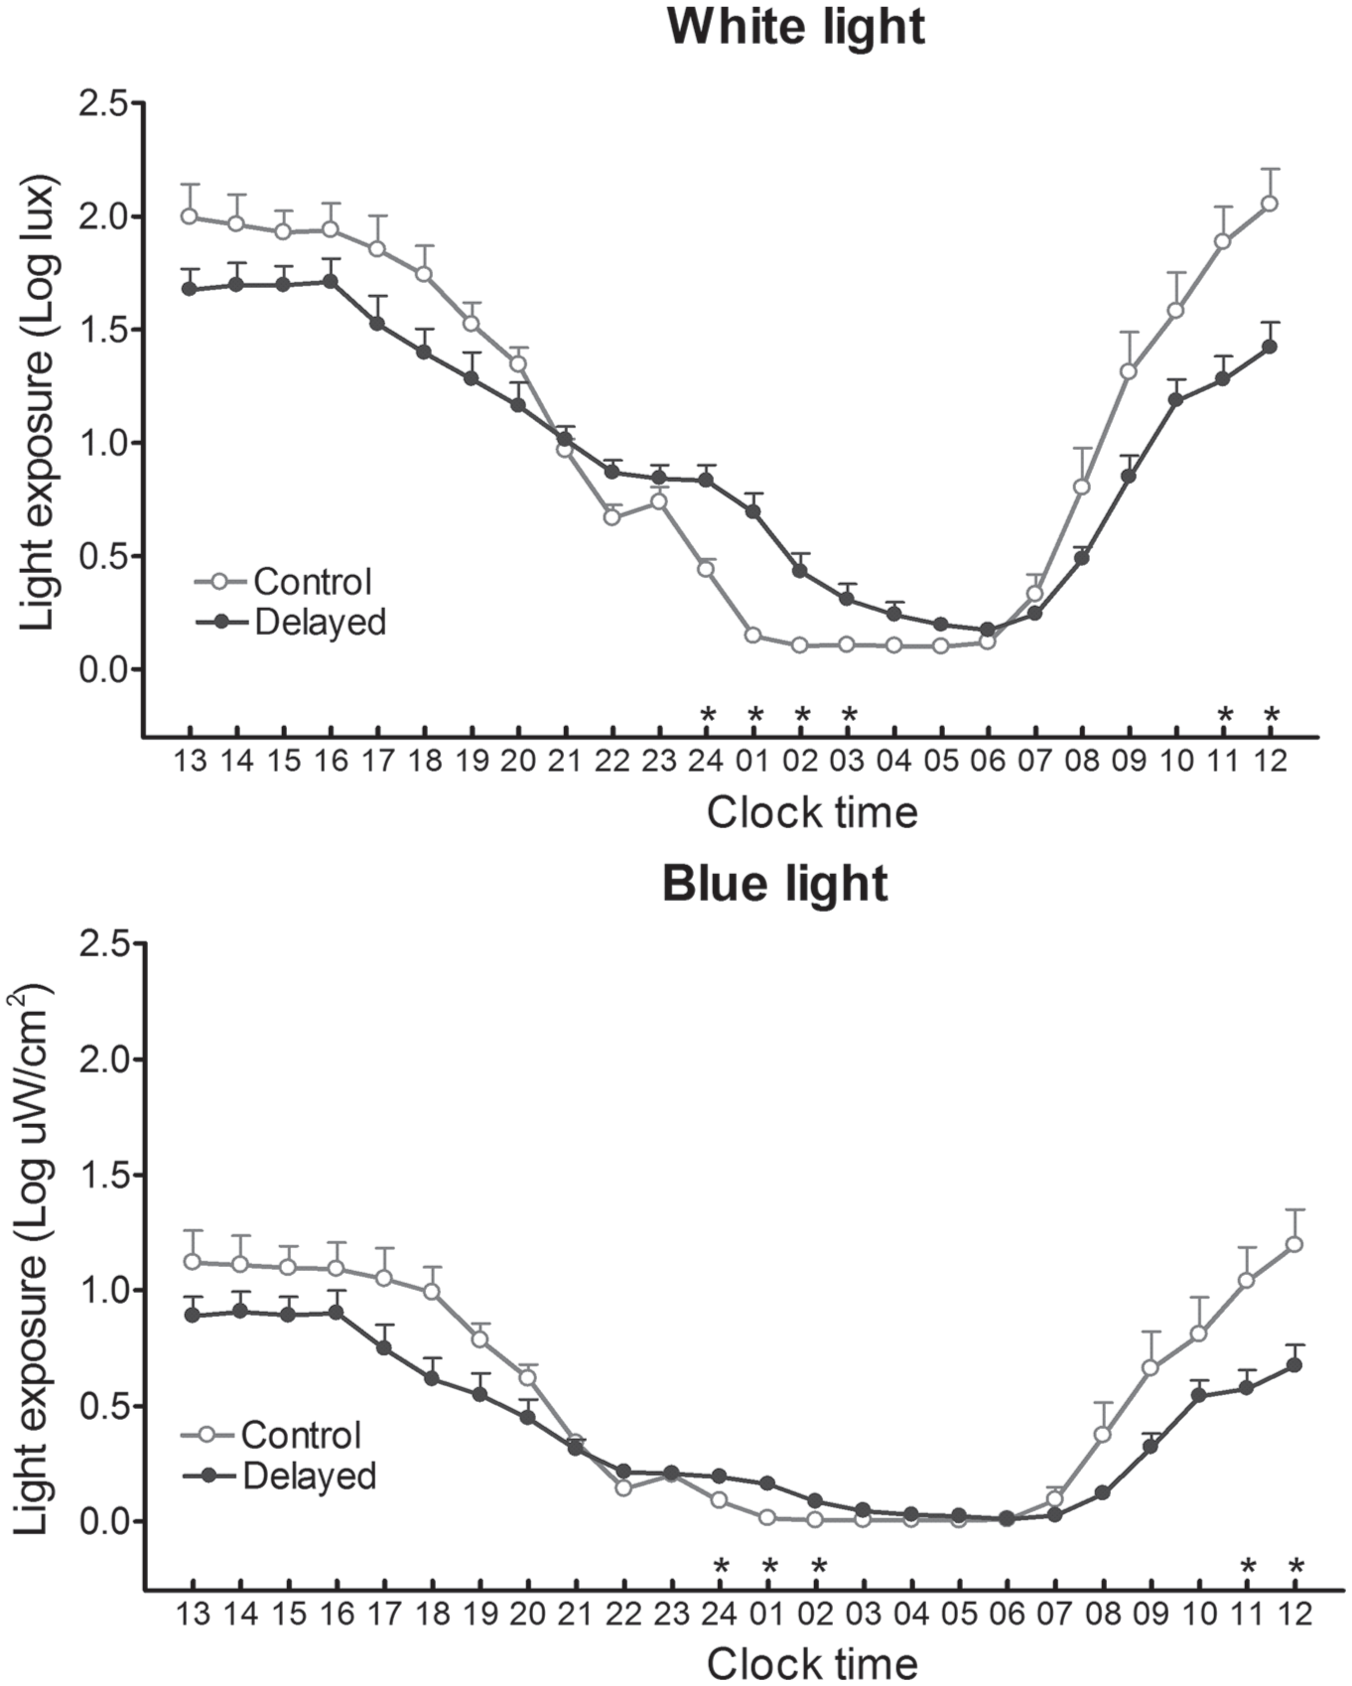
Light exposure (mean and SEM of log-transformed data) according to clock time, averaged for each hour over the week of ambulatory recording for the participants with a delayed sleep schedule (black circles) and for the control subjects (open circles). Upper panel: exposure to white light; lower panel: exposure to blue light. Each hour represents data of the prior 60 min. Asterisks indicate significant differences (p ≤ 0.05) between the 2 groups after FDR correction.
For exposure to blue light, the Group effect showed that the delayed subjects were less exposed to blue light over the 24 h compared with controls (F1,26 = 4.54; p = 0.04). The Group by Time interaction was also significant (F23,598 = 3.81; p = 0.008). As illustrated in Figure 1 (lower panel), delayed participants tended to be less exposed to blue light in the daytime and significantly so at 1100 and 1200 h. However, their exposure to blue light was significantly higher during the 2300 to 0200 h interval. Lower daily exposure to blue light was significantly associated with a later DLMO (r = −0.46, p = 0.01).
Relative Distribution of Light Exposure in Relation to Circadian Phase
Figure 2 shows the profiles of relative hourly distribution (in percentages of daily mean) of light exposure expressed in relation to DLMO. For white light, there was a significant Group by Time interaction (F23,598 = 5.76; p< 0.001) showing relatively higher exposure in the delayed group 2 h after DLMO, 5 h after DLMO, and during the interval covering 7 to 10 h after DLMO. Compared with delayed subjects, control subjects were relatively more exposed to white light in the interval 1 to 7 h before DLMO.
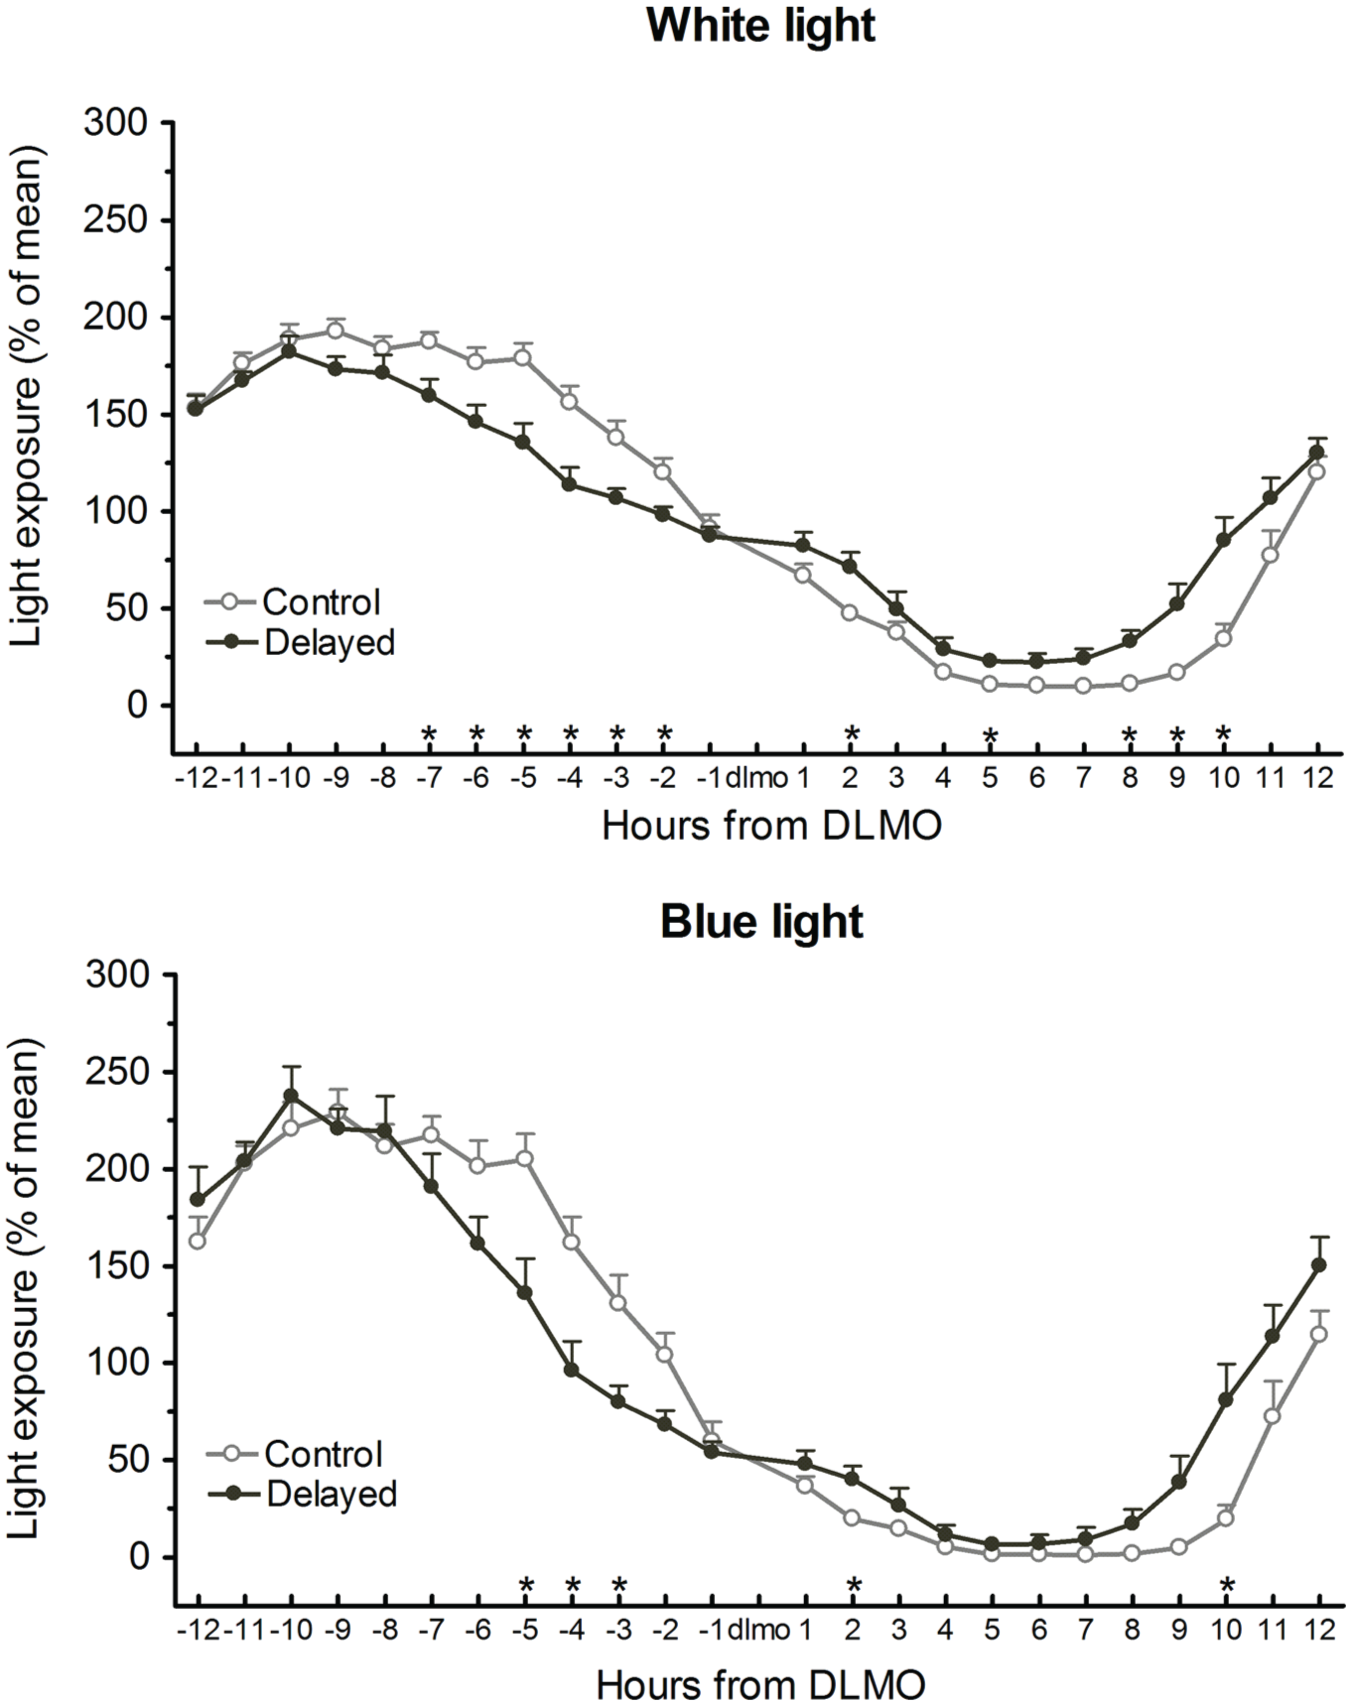
Relative light exposure (mean and SEM of percentage of daily mean) expressed in relation to salivary dim light melatonin onset (DLMO). Upper panel: exposure to white light; lower panel: exposure to blue light. –1 includes relative light exposure at DLMO and the prior 59 min, +1 includes the 60 min after DLMO. Asterisks indicate significant differences (p ≤ 0.05) between the 2 groups after FDR correction.
Relative blue light exposure in relation to DLMO showed similar group differences as with white light, but for shorter intervals: relative blue light exposure was higher in the delayed group 2 h after DLMO and again 9 to 10 h after DLMO (Group by Time interaction: F23,598 = 4.17; p < 0.001) but was higher in the control group 2 to 5 h before DLMO.
Use of Light-emitting Devices before Bedtime
Information was missing for 1 control participant. Participants with a delayed sleep schedule reported more time using light-emitting devices in the 3 h before bedtime compared with control subjects (101.9 ± 40.6 min vs. 59.9 ± 39.1 min, respectively, p = 0.01). As shown in Figure 3, this difference was largely due to the use of computers. This group difference was reflected in the positive correlation between mean minutes of use and habitual bedtime, both for all devices (r = 0.38, p = 0.05) and for the computer only (r = 0.40, p = 0.04). More minutes of use of light-emitting devices before bedtime was significantly correlated with a later DLMO, both for all devices (r = 0.39, p = 0.04) and for computer use only (r = 0.46, p = 0.02). The latter correlation is illustrated in Figure 4. When averaged over the week, the number of minutes of computer use in the 3 h before bedtime was associated with ambulatory light-exposure measures at that time, both for blue (r = 0.38, p = 0.05) and for white light (r = 0.50, p = 0.007).
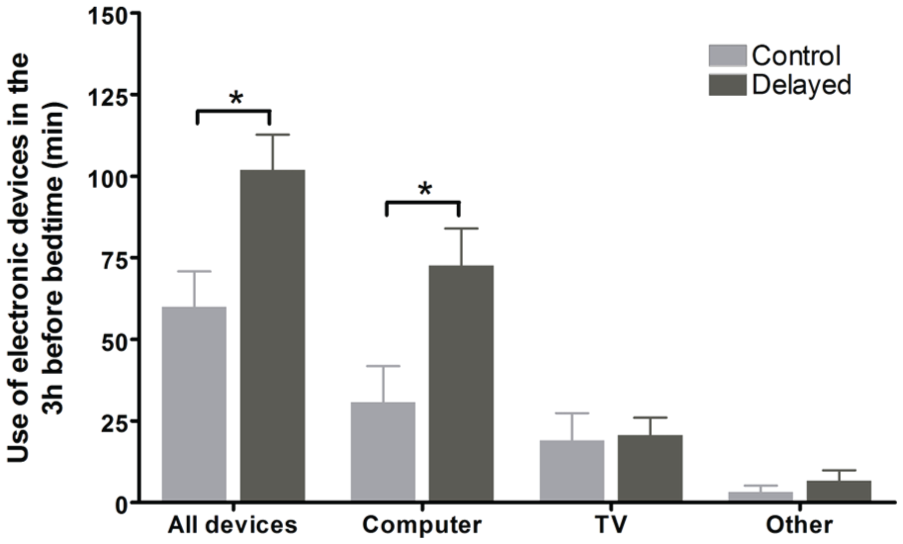
Self-reported minutes (mean and SEM) of use of light-emitting devices in the 3 h before bedtime for control subjects (gray bars) and for the subjects with a delayed sleep schedule (black bars), averaged over the week of ambulatory recording. The “other” category includes mostly the use of tablets and cell phones. Asterisks indicate significant differences (p ≤ 0.05) between the 2 groups.
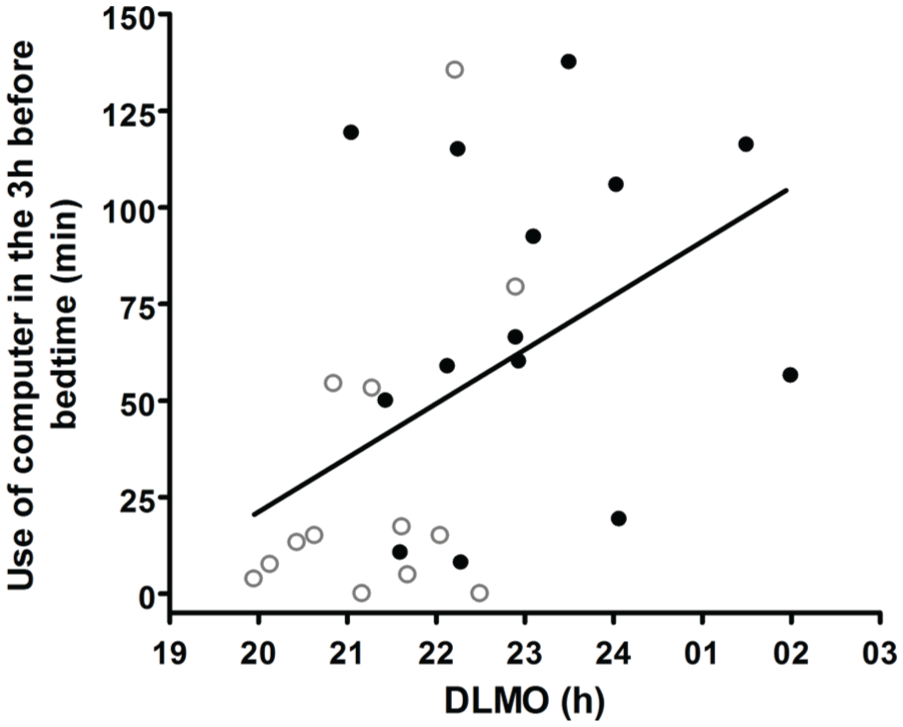
Correlation (r = 0.46, p = 0.02) between minutes of computer use in the 3 h before bedtime, averaged during the week of recording, and circadian phase assessed in the laboratory with the dim light melatonin onset (DLMO). Delayed subjects are identified with closed circles and controls with open circles.
Discussion
Amplitude of Daily Exposure to the Light-dark Cycle
The estimated amplitude of the light-dark cycle to which the subjects were exposed was significantly smaller in delayed than in control subjects, for both white and blue light. Such smaller amplitude seems to result from both higher nighttime exposure and lower daytime exposure in delayed participants (Fig. 1). This smaller amplitude may represent a smaller day-night contrast and thus a weaker synchronizing signal in the delayed group. As mentioned before, according to the entrainment theory, a weaker entrainment signal will set internal time at a later phase in individuals with an endogenous period longer than 24 h (Roenneberg et al., 2003a). Since late sleepers have a long circadian period (Duffy et al., 2001; Micic et al., 2013), a lower amplitude of 24-h light-dark exposure may contribute to delaying their circadian phase. This hypothesis is supported by the strong correlation found between a lower amplitude of 24-h light-dark exposure and a later DLMO in our participants, for both white and blue light exposure.
Hourly profiles of exposure to white light showed results similar to those previously reported in evening chronotypes (Goulet et al., 2007) and in patients with delayed sleep disorder (Auger et al., 2011; Joo et al., 2017), with less exposure in the morning and more exposure at night in delayed than in control participants. We also found the same pattern for blue light exposure. These results are consistent with group differences in wake times and bedtimes (Table 1) and therefore largely reflect the sleep schedule of the 2 groups of participants. However, delayed subjects also showed lower daytime exposure that cannot be explained by sleep timing. As illustrated in Figure 1, decreased light exposure in the daytime was a general trend in delayed subjects, statistically significant at 1100 and 1200 h, observed even when subjects of both groups were awake and when natural light was available. Individuals suffering from delayed sleep schedule often mention avoiding bright sunlight (unpublished observations). An association between a late sleep schedule and self-reported photophobia was also found in adult patients with attention-deficit/hyperactivity disorder who also suffer from delayed sleep (Kooij and Bijlenga, 2014; van Veen et al., 2010). Delayed individuals may therefore adopt a behavior that tends to shield them from natural bright light. This hypothesis will need more systematic assessments, but it is supported by laboratory results obtained in self-selected lighting condition showing that except for the first 2 h after wake time, late sleepers choose a lower light intensity than early chronotypes at all times of the day (Maierova et al., 2016).
Total light exposure did not differ between the 2 groups for white light, similar to the results reported in late sleepers in previous studies (Goulet et al., 2007; Joo et al., 2017). However, the delayed group was exposed to significantly less blue light over the 24 h, possibly because they were less exposed to bright, blue-rich outdoor light. Lower daily exposure to blue light showed a strong correlation with a later circadian phase, which supports the hypothesis that blue light exposure may play a specific role in circadian entrainment and suggests that the measure of blue light exposure in ambulatory subjects may provide unique information in addition to exposure to white light.
Relative Distribution of Light Exposure in Relation to Circadian Phase
The relative distribution over the 24 h revealed an increased exposure to both white and blue light during the 1- to 2-h interval after DLMO in the delayed compared with the control group (Fig. 2). According to the phase-response curve (PRC) to light, this increase occurs at the circadian time having the largest phase-delaying effect (Khalsa et al., 2003) and may therefore contribute to a later circadian phase. The 1- to 2-h interval after DLMO occurs before bedtime in most subjects, and blue light cannot come from natural light at that time. Then, increased white and blue light exposure during this interval may reflect the higher use of light-emitting devices reported by delayed participants in the 3 h before bedtime.
The relative distribution of white light exposure also showed higher exposure in the delayed group for the 7- to 10-h interval after DLMO, also significant for the 9- to 10-h interval for blue light. This observation may appear counterintuitive, as this interval is located in the phase-advancing portion of the PRC (Khalsa et al., 2003). Our group previously reported a similar observation in evening chronotypes, who, compared with morning chronotypes, showed increased exposure to white light 9 to 12 h after DLMO (Goulet et al., 2007). We thus propose the same interpretation that a phase-advancing light signal may help to maintain a stable phase of entrainment and prevent a further delay that could lead eventually to a non-24-h sleep-wake rhythm. The 7- to 10-h interval after DLMO corresponds to the last part of the sleep episode, during which the light monitor recorded bedroom illumination from the bedside table. Therefore, most subjects had their eyes closed during that time, but exposure to light through the eyelids may still have some phase-advancing effects (Terman and Terman, 2010). It is not possible to know whether this increased morning light exposure resulted from voluntary behavior, but the data suggest that the delayed subjects did not feel the need for dark curtains to sleep in the morning, thereby allowing light to reach their eyes in the advancing portion of the PRC.
Use of Light-emitting Devices before Bedtime
Sleep diary data on the use of light-emitting devices in the 3 h before bedtime showed that individuals with delayed sleep were greater users of electronic devices compared with controls. This difference was especially true for the use of computers (Fig. 3). The correlation between minutes of computer use and light exposure points to computers as a main source of increased light exposure before bedtime. That this relation was true not only for white light but also for blue light is consistent with the high content of blue light measured in LED-backlit computer screens (Cajochen et al., 2011). A causal relationship cannot be established from the significant association between minutes of use of light-emitting devices before bedtime and circadian phase, but given the phase-delaying (Rüger et al., 2013), melatonin-suppressing (West et al., 2011), and stimulating effects (Chellappa et al., 2011) of blue light at that time of day, this behavior is expected to make advancing bedtime even harder and may contribute to the complaint of a delayed sleep schedule.
Limitations and Conclusions
Ambulatory measures of blue light exposure are subject to many limitations. Ambulatory monitors have a limited precision, and even when they are worn at shoulder height, the amount of light that actually reaches the retina remains an approximation. However, ambulatory recordings appeared quite useful to compare profiles of light exposure between groups of subjects, and the correspondence between light exposure profiles and sleep-wake schedules, as well as the association between blue light exposure and timing of use of light-emitting devices, supports the validity of the data. Daily profiles of light exposure allow for an estimation of the day-night contrast, which provides relevant information in the context of the theory of entrainment. To our knowledge, there is no validated measure to quantify the day-night contrast in 24-h light exposure, a characteristic that was rarely investigated in ambulatory light recordings. Light exposure over the 24 h shows a sinusoidal distribution, and data from Figure 1 suggest a smaller amplitude of the daily variation in delayed than in control subjects. We believe that the fitting of cosine curves provided a useful approximation to quantify this difference. This analysis is often applied to estimate amplitude of biological rhythms (Cornelissen, 2014) and was previously used to assess ambulatory profiles of light exposure in infants (Tsai et al., 2011). However, development of more refined analytic tools would help better characterize this parameter of light exposure in future studies.
In conclusion, our results show that the differences in daily light exposure profiles between individuals complaining of a late sleep schedule and controls go beyond the expected differences due to their later sleep schedule within the natural photoperiod. Some differences seem behavior-related, especially the lower light exposure in the daytime and the increased exposure before bedtime associated with the use of light-emitting devices. To help individuals who complain of difficulties advancing their sleep schedule, our results provide support for interventions aimed at increasing morning light exposure (e.g., Münch et al., 2016) and day-night contrast in light intensity (e.g., Najjar et al., 2014) and for interventions aimed at decreasing light exposure, especially blue light, before bedtime (e.g., Esaki et al., 2016; van der Lely et al., 2015).
Footnotes
Acknowledgements
The research was supported by a research grant from the Natural Sciences and Engineering Research Council of Canada (NSERC) (Grant No. RGPIN/155406-2011) and by student fellowships from Université de Montréal, Fonds de la Recherche du Québec-Santé (FRQS), and NSERC.
Conflict of Interest Statement
The author(s) have no potential conflicts of interest with respect to the research, authorship, and/or publication of this article.