
Abstract
The circadian clock system has been linked to the onset and development of obesity and some accompanying comorbidities. Epigenetic mechanisms, such as DNA methylation, are putatively involved in the regulation of the circadian clock system. The aim of this study was to investigate the influence of a weight loss intervention based on an energy-controlled Mediterranean dietary pattern in the methylation levels of 3 clock genes, BMAL1, CLOCK, and NR1D1, and the association between the methylation levels and changes induced in the serum lipid profile with the weight loss treatment. The study sample enrolled 61 women (body mass index = 28.6 ± 3.4 kg/m2; age: 42.2 ± 11.4 years), who followed a nutritional program based on a Mediterranean dietary pattern. DNA was isolated from whole blood obtained at the beginning and end point. Methylation levels at different CpG sites of BMAL1, CLOCK, and NR1D1 were analyzed by Sequenom’s MassArray. The energy-restricted intervention modified the methylation levels of different CpG sites in BMAL1 (CpGs 5, 6, 7, 9, 11, and 18) and NR1D1 (CpGs 1, 10, 17, 18, 19, and 22). Changes in cytosine methylation in the CpG 5 to 9 region of BMAL1 with the intervention positively correlated with the eveningness profile (p = 0.019). The baseline methylation of the CpG 5 to 9 region in BMAL1 positively correlated with energy (p = 0.047) and carbohydrate (p = 0.017) intake and negatively correlated with the effect of the weight loss intervention on total cholesterol (p = 0.032) and low-density lipoprotein cholesterol (p = 0.005). Similar significant and positive correlations were found between changes in methylation levels in the CpG 5 to 9 region of BMAL1 due to the intervention and changes in serum lipids (p < 0.05). This research describes apparently for the first time an association between changes in the methylation of the BMAL1 gene with the intervention and the effects of a weight loss intervention on blood lipids levels.
The purpose of a weight loss intervention is not only to produce changes in weight per se but also to improve the health status of the subject. Thus, it is particularly relevant to achieve a healthy profile in the serum lipids of the patient, which has been related to metabolic risk (Ho et al., 2013). However, the effect of the dietary treatment on the metabolic risk factors may vary among individuals (Bouchard et al., 2010). One of the factors that could explain some of the interindividual variability is epigenetics, as a result of the interactions between the environmental factors (including the diet) and the genome (Campion et al., 2009). In this sense, the expression of circadian clock genes, which display cyclic oscillations, has been reported to be regulated by epigenetic mechanisms, including histone modification and cytosine methylation (Sahar and Sassone-Corsi, 2013). Some of these epigenetic modifications in clock genes have been associated with obesity and metabolic disturbances, since a different methylation status has been observed in specific obesity-related genes between normal-weight people, obese individuals, and successful weight loss maintainers (Huang et al., 2015), suggesting an association between peripheral blood mononuclear cell methylation and weight status. Also, our group previously demonstrated an association between the methylation pattern of several CpG sites located in clock genes (i.e., CLOCK) with metabolic syndrome (MetS), weight loss, and the development of obesity (Milagro et al., 2012).
The circadian clock system synchronizes biological functions to environmental stimuli, including daily rhythms of natural light, external temperature, and food intake (LeGates et al., 2014; Oike et al., 2014; Plikus et al., 2015). Many metabolic activities that exhibit circadian regulation, such as glucose homeostasis, lipid metabolism, bile acid synthesis, and fasting/feeding cycles, are regulated by the internal clock system (Feng and Lazar, 2012). These findings suggest that the circadian system might be implicated in the onset of obesity. Moreover, a different expression profile of clock genes has been reported in obese individuals compared to lean subjects, as well as relationships between genetic variants in these genes and obesity (Garaulet et al., 2014; Tahira et al., 2011). On the other hand, the circadian clock system has been implicated in the effectiveness of a weight loss program. For example, circadian rhythmicity of wrist temperature, considered a marker of the internal clock, has been presented as a predictor of weight loss effectiveness (Bandin et al., 2014), whereas the timing of food intake, considered an external synchronizer of peripheral clocks, may influence the success of a weight loss diet in humans (Garaulet et al., 2013).
The mammalian molecular clockwork regulation encompasses some transcription factors, such as CLOCK (circadian locomotor output cycles kaput) and BMAL1 (brain and muscle aryl hydrocarbon receptor nuclear translocator–like protein 1), which control the expression of negative regulators of the clock machinery, such as NR1D1 or REV-ERB-α (nuclear receptor subfamily 1 group D). In turn, NR1D1 inhibits the transcription of BMAL1 within a feedback mechanism (Preitner et al., 2002). Malfunction of these genes may lead to metabolic problems since Clock gene-mutant mice exhibit a disruption in lipid metabolism and develop atherosclerosis (Pan et al., 2013). However, although one study has linked the methylation levels of clock genes with weight loss (Milagro et al., 2012), until now, no studies have analyzed the involvement of clock gene methylation levels on the effects of weight loss interventions on serum lipid profile.
The aim of the present study was to investigate the influence of a weight loss nutritional intervention in the methylation pattern of BMAL1, CLOCK, and NR1D1 in whole blood. Moreover, this study analyzed the potential associations between the baseline methylation levels of these clock genes and both the baseline dietary habits and the effects of the weight loss intervention on serum total cholesterol and low-density lipoprotein cholesterol (LDL-C).
Materials and Methods
Subjects
The study sample consisted of 61 overweight/obese women (body mass index [BMI], mean = 28.6 ± 3.4 kg/m2) within an average age of 42.2 ± 11.4 years, who voluntarily attended 5 nutrition clinics in the city of Murcia, Spain. Those patients who were out of this range of age, under treatment with thermogenic or lipogenic drugs, on a special diet, or diagnosed with diabetes mellitus, chronic renal failure, hepatic diseases, or cancer were excluded from the study (9%). The volunteers provided signed informed consent prior to participating in the study, and the experimental protocol design was approved by the Ethics Committee of the Virgen de la Arrixaca Hospital (2011-01-26) as described previously by Milagro et al. (2012). All of the investigations performed in this study were conducted in accordance with the guidelines of the Declaration of Helsinki. Patient data were codified to guarantee anonymity.
Characteristics of the Treatment
The characteristics of the weight reduction program (Garaulet method) have been described elsewhere (Corbalan et al., 2009). Briefly, during the initial 4 months, subjects attended a weekly 60-min therapy session in support groups (n = 10), followed by a 5-month maintenance period. Sessions were conducted by a nutritionist. Treatment was based on the following issues:
Dietary treatment
Before starting the dietary intervention, total energy intake was 2079 ± 701 kcal/day (43% of energy was supplied by carbohydrate and 41% by fat). During weight loss management, the total energy intake was reduced to 1408 ± 297 kcal/day (45% of energy was supplied by carbohydrate and 33% by fat). Total energy intake and macronutrient composition were determined using Grunumur software (version 2.0; University of Murcia, Murcia, Spain) (Perez-Llamas et al., 2012), a nutritional evaluation program, in conjunction with Spanish food composition tables. Dietary individual energy requirements were assessed by calculating 1) resting energy expenditure (REE) according to the Harris-Benedict formula and 2) total energy expenditure (TEE) according to the type and duration of physical activity. Next, about 2.6 MJ/day was subtracted from the TEE. The final dietary energy content ranged from 1200 to 1800 kcal/day for women to induce an approximate loss of 0.5 to 1 kg/week. The recommendations were consistent with the Mediterranean dietary pattern (Corbalan et al., 2009), and the macronutrient distribution followed the recommendations of the Spanish Society of Community Nutrition (Serra-Majem et al., 2001).
Nutritional education
Nutritional education was given during group therapy sessions to help subjects plan their own menus and to educate subjects to adopt appropriate lifetime eating habits.
Physical activity
Physical activity emphasized individual goals of 15 to 30 min or more of moderate-intensity physical activity, at least 2 or 3 times a week. Patients were encouraged to use a pedometer to reach at least 10,000 steps per day.
Behavioral techniques
Behavioral techniques included stimulus control, self-monitoring, positive reinforcement, and cognitive behavioral therapy.
Anthropometric and Biochemical Measurements
Weight loss was evaluated weekly during the whole treatment. Biochemical parameters were determined in blood samples collected at the beginning and at the end of the nutritional intervention. Plasma and serum were separated by centrifugation (1400 × g, 15 min at 5 °C). Plasma glucose, cholesterol, triglycerides, and lipoprotein values were obtained by automated chemical analysis (Roche Diagnostics GmbH, Mannheim, Germany). Very low-density lipoprotein cholesterol (VLDL-C) was separated by ultracentrifugation (Havel et al., 1955). High-density cholesterol (HDL-C) was determined after precipitation of apolipoprotein B–containing lipoproteins with dextran sulfate and magnesium (Warnick et al., 1982). LDL-C was calculated using the Friedewald equation (Friedewald et al., 1972). Serum insulin was measured with a radioimmunoassay kit (DPC, Los Angeles, CA, USA). Insulin resistance was estimated with the homeostasis model assessment (HOMA-IR) as [fasting insulin (µU/mL) × fasting glucose (mM)] / 22.5.
Morningness-Eveningness Score
The Morningness-Eveningness score was developed using the Morning-Evening Questionnaire (MEQ) designed by Horne and Östberg (1976). The MEQ consists of 19 multiple-choice questions, which aims is to characterize subjects depending on individual differences of wake/sleep patterns and the time of the day people feel or perform best. The complete questionnaire methodology was previously described (Garaulet et al., 2012).
DNA Methylation Analysis
Whole blood was obtained before and after the treatment. The time of the day when the blood samples were obtained was 0830 h ± 10 (min) in all patients and in both conditions (before and after treatment) to avoid the potential effect of sampling time. DNA was isolated with the QIAamp DNA Mini KIT (Qiagen, Valencia, CA, USA), and its quality was evaluated with the PicoGreen dsDNA Quantification Reagent (Invitrogen, Carlsbad, CA, USA). Genomic DNA was sodium bisulfite converted by using the EpiTect Bisulfite Kit (Qiagen). Quantitative methylation analysis was performed by the MassArray Epityper (Bruker-Sequenom, San Diego, CA, USA). This method uses matrix-assisted laser desorption ionization time-of-flight (MALDI-TOF) mass spectrometry in combination with RNA base-specific cleavage (MassCLEAVE). Polymerase chain reaction (PCR) primers covering 14 CpG sites of the BMAL1 gene, 10 CpG sites of the CLOCK gene, and 22 CpG sites of the NR1D1 gene were designed using Epidesigner software (Bruker-Sequenom). The analyzed sequences are shown in Supplemental Figure S1. The primers used were as follows:
For BMAL1 (376 bp length): TGAGATTTTGGTAAATTAGGGATTTT (left) and ACTACTTTCCTACCACCAATCATTTAAC (right) For CLOCK (271 bp length): TTTTTTTAGGAGATGGGAGAAGATG (left) and CCTAAAAACTCTTTAACTTTCCCCC (right) For NR1D1 (477 bp length): AGAGTTTTTTGTTTTAGGGAAAGGT (left) and TTACCCCCTAAACACTAACTAAAAA (right)
The complete methodology was previously explained (Milagro et al., 2011). Mass spectra were assembled using a MassArray mass spectrometer (Bruker-Sequenom) and subsequently analyzed by means of proprietary peak picking and signal-to-noise calculations through Epityper software v1.0 (Bruker-Sequenom).
Bioinformatic Analyses of Transcription Factors
To study the putative transcription factor binding sites in the CpG 5 to 9 region of the BMAL1 gene, we performed a bioinformatic analysis using the free program PROMO (Farre et al., 2003; Messeguer et al., 2002). PROMO consists of the prediction of transcription factor binding sites using weight matrices derived from collections of known binding sites from the TRANSFAC database, which contains the largest available collection of DNA binding sites in eukaryotes (Farre et al., 2003). Transcription factors were predicted within a dissimilarity margin less than or equal to 15%.
Statistical Analysis
Paired Student t test was used to analyze anthropometric and biochemical differences between baseline and the end point of the nutritional intervention. The variable’s normality was performed considering the distribution of the differences (final – initial), determined through Kolmogorov-Smirnov and Shapiro-Wilk tests. Pearson’s correlation coefficient was used to calculate the association between the selected variables of study. The bivariate normality was studied through an omnibus test. The linear regression model was carried out to elucidate the association between methylation status and diet factors. The variables analyzed in current study were BMI, weight, insulin, glucose, total cholesterol, LDL-C, VLDL-C, HDL-C, and triglycerides; energy (kcal) and carbohydrate intake for nutritional factors; and the methylation values for all the CpGs of BMAL1, CLOCK, and NR1D1 genes. The variables LDL-C, VLDL-C, and ΔVLDL-C were normally distributed after natural log transformation.
A p value less than 0.05 was considered significant. Statistics were performed using SPSS v.15 (SPSS, Inc., an IBM Company, Chicago, IL, USA).
Results
The anthropometric and biochemical characteristics of the population, before and after the intervention, are reported in Table 1. As expected, body weight, BMI, HOMA-IR, and total cholesterol decreased significantly after the intervention.
Changes in anthropometric and Biochemical Characteristics of the Women (n = 61) at Baseline and after the Intervention.
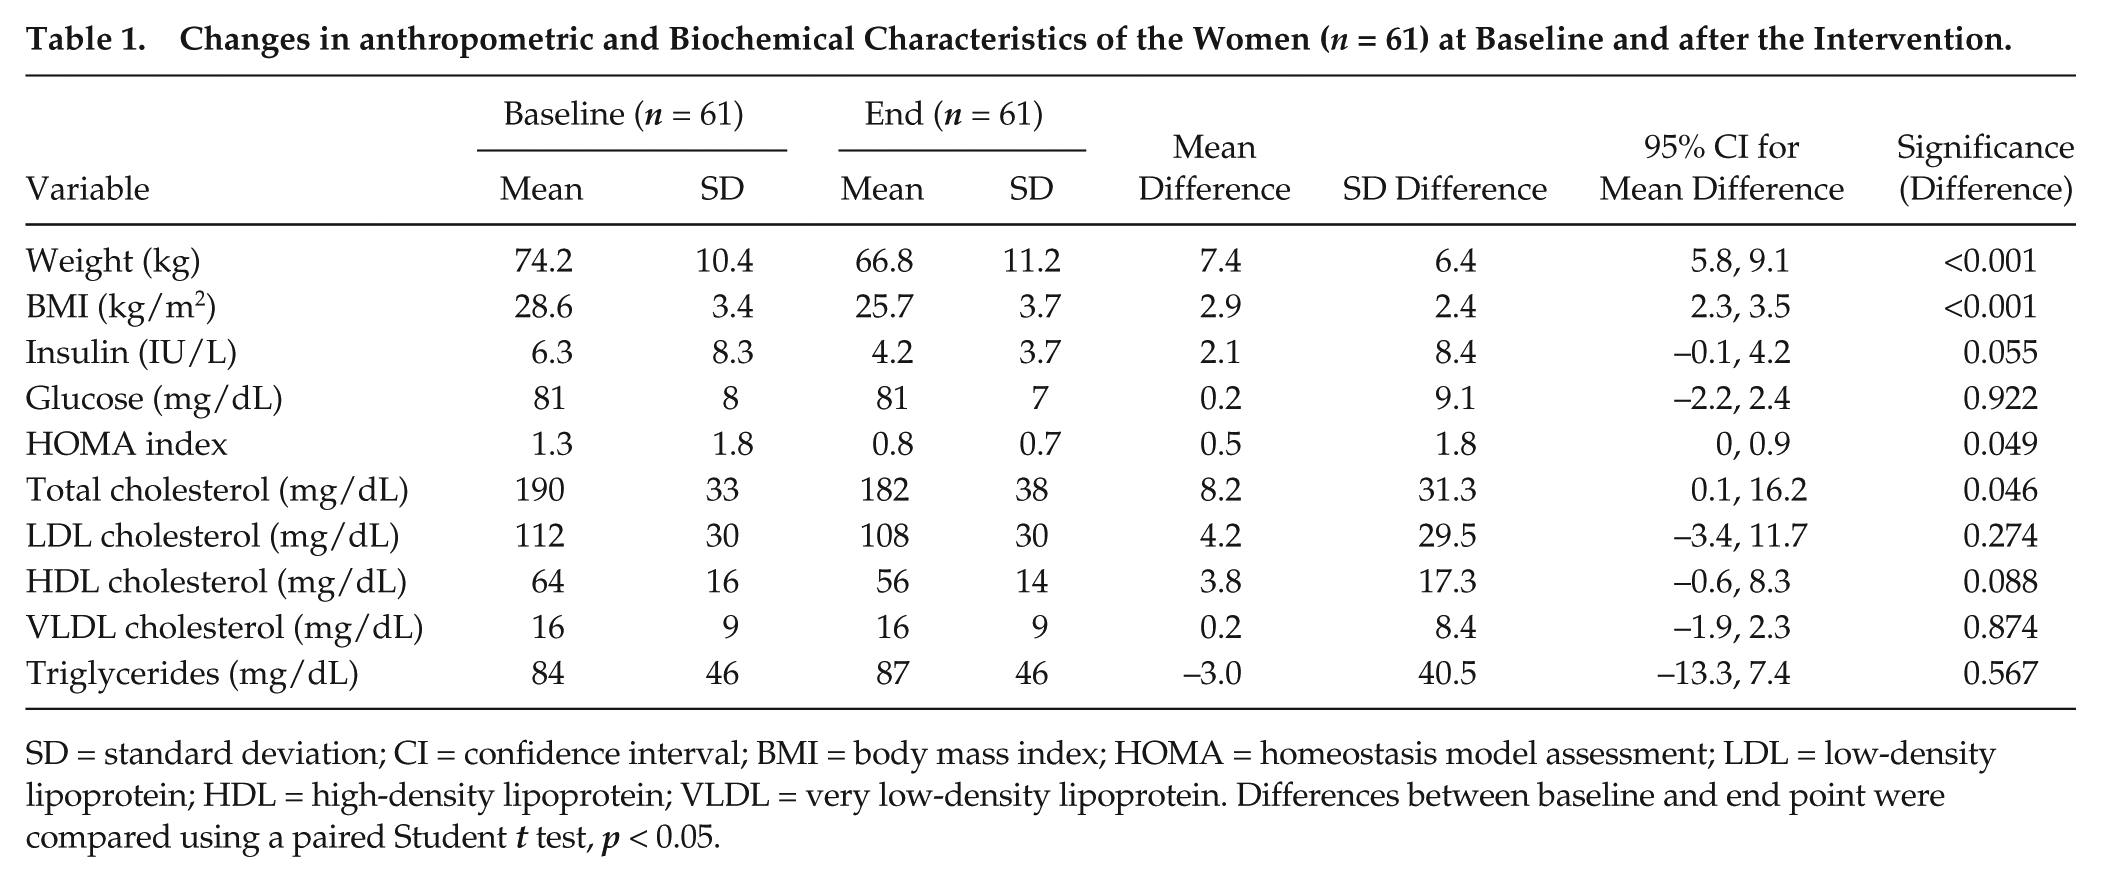
SD = standard deviation; CI = confidence interval; BMI = body mass index; HOMA = homeostasis model assessment; LDL = low-density lipoprotein; HDL = high-density lipoprotein; VLDL = very low-density lipoprotein. Differences between baseline and end point were compared using a paired Student t test, p < 0.05.
The methylation status of different CpGs of BMAL1 and NR1D1 was modified as a result of the intervention. In BMAL1, the methylation levels of CpG 5 (142%), CpG 6.7 (237%), and CpG9 (163%) were significantly (p < 0.01) increased with the intervention, compared with the methylation percentage at the beginning, whereas those of CpG 10.11 (16%) (p < 0.05) and CpG 18 (32%) (p < 0.01) were decreased (Figure 1). Similarly, in NR1D1, the methylation levels of CpG 10 (25%), CpG 17 (253%), CpG 18 (252%), and CpG 22 (88%) were significantly (p < 0.05) increased with the intervention, whereas those of CpG 1 (40%) and CpG 19 (12%) were decreased (p < 0.05). However, no relevant differences were found after the intervention in CLOCK methylation levels. Interestingly, a positive and significant association was found between changes in cytosine methylation in the CpG 5 to 9 region of BMAL1 (r = 0.361; p = 0.019) and the individual chronotype of the patients (MEQ), showing that more vespertine subjects presented more epigenetic modifications due to the weight loss intervention.
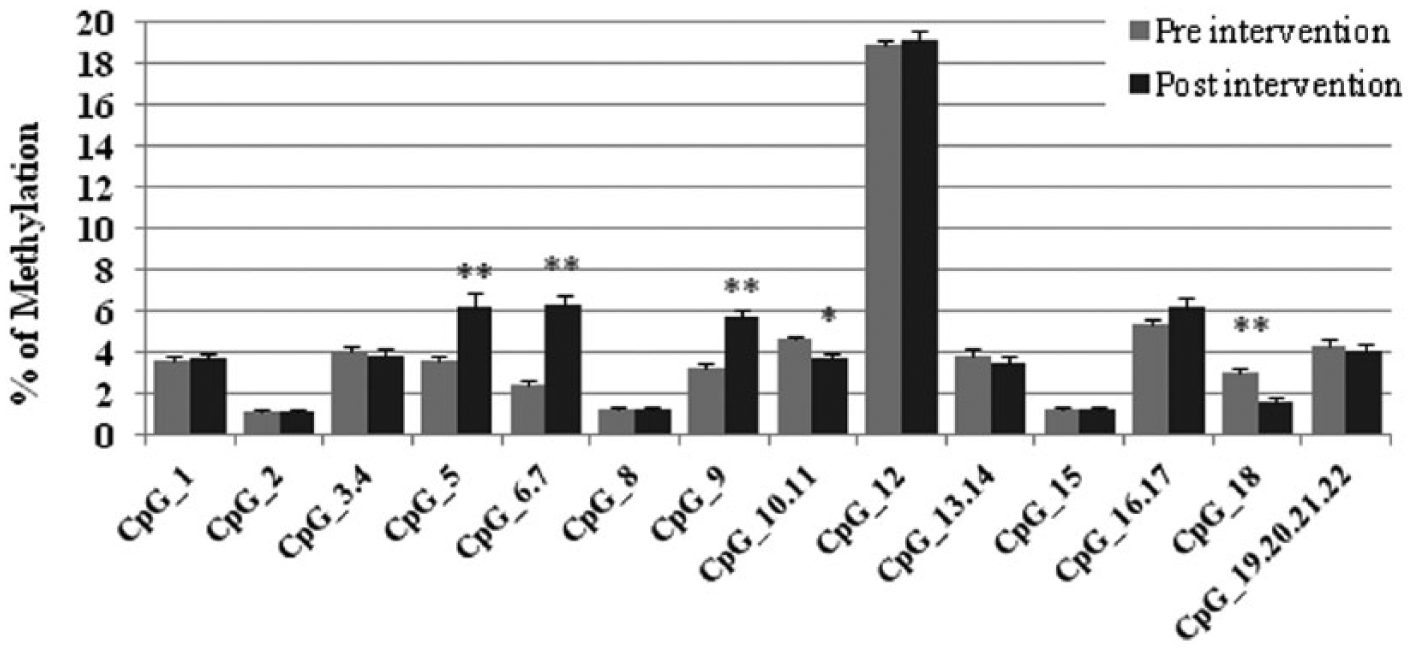
Cytosine methylation percentages of the CpGs of BMAL1 before and after the intervention, measured by MassArray. *p < 0.05, **p < 0.01, paired t test.
The statistical analyses showed associations between the baseline methylation patterns of BMAL1 and habitual dietary intake. The CpGs 5, 6, 7, 8, and 9 of BMAL1 were grouped in a unique parameter as they responded similarly to the intervention. At baseline, higher methylation of the BMAL1 5 to 9 region was associated with a higher energy and carbohydrate intake (Figure 2a,b). More important, the percentage of methylation of the CpG 5 to 9 region in BMAL1 at baseline negatively correlated with the effect of the weight loss intervention on serum lipids, including the percentage of change of total cholesterol and LDL-C (Figure 2c,d).
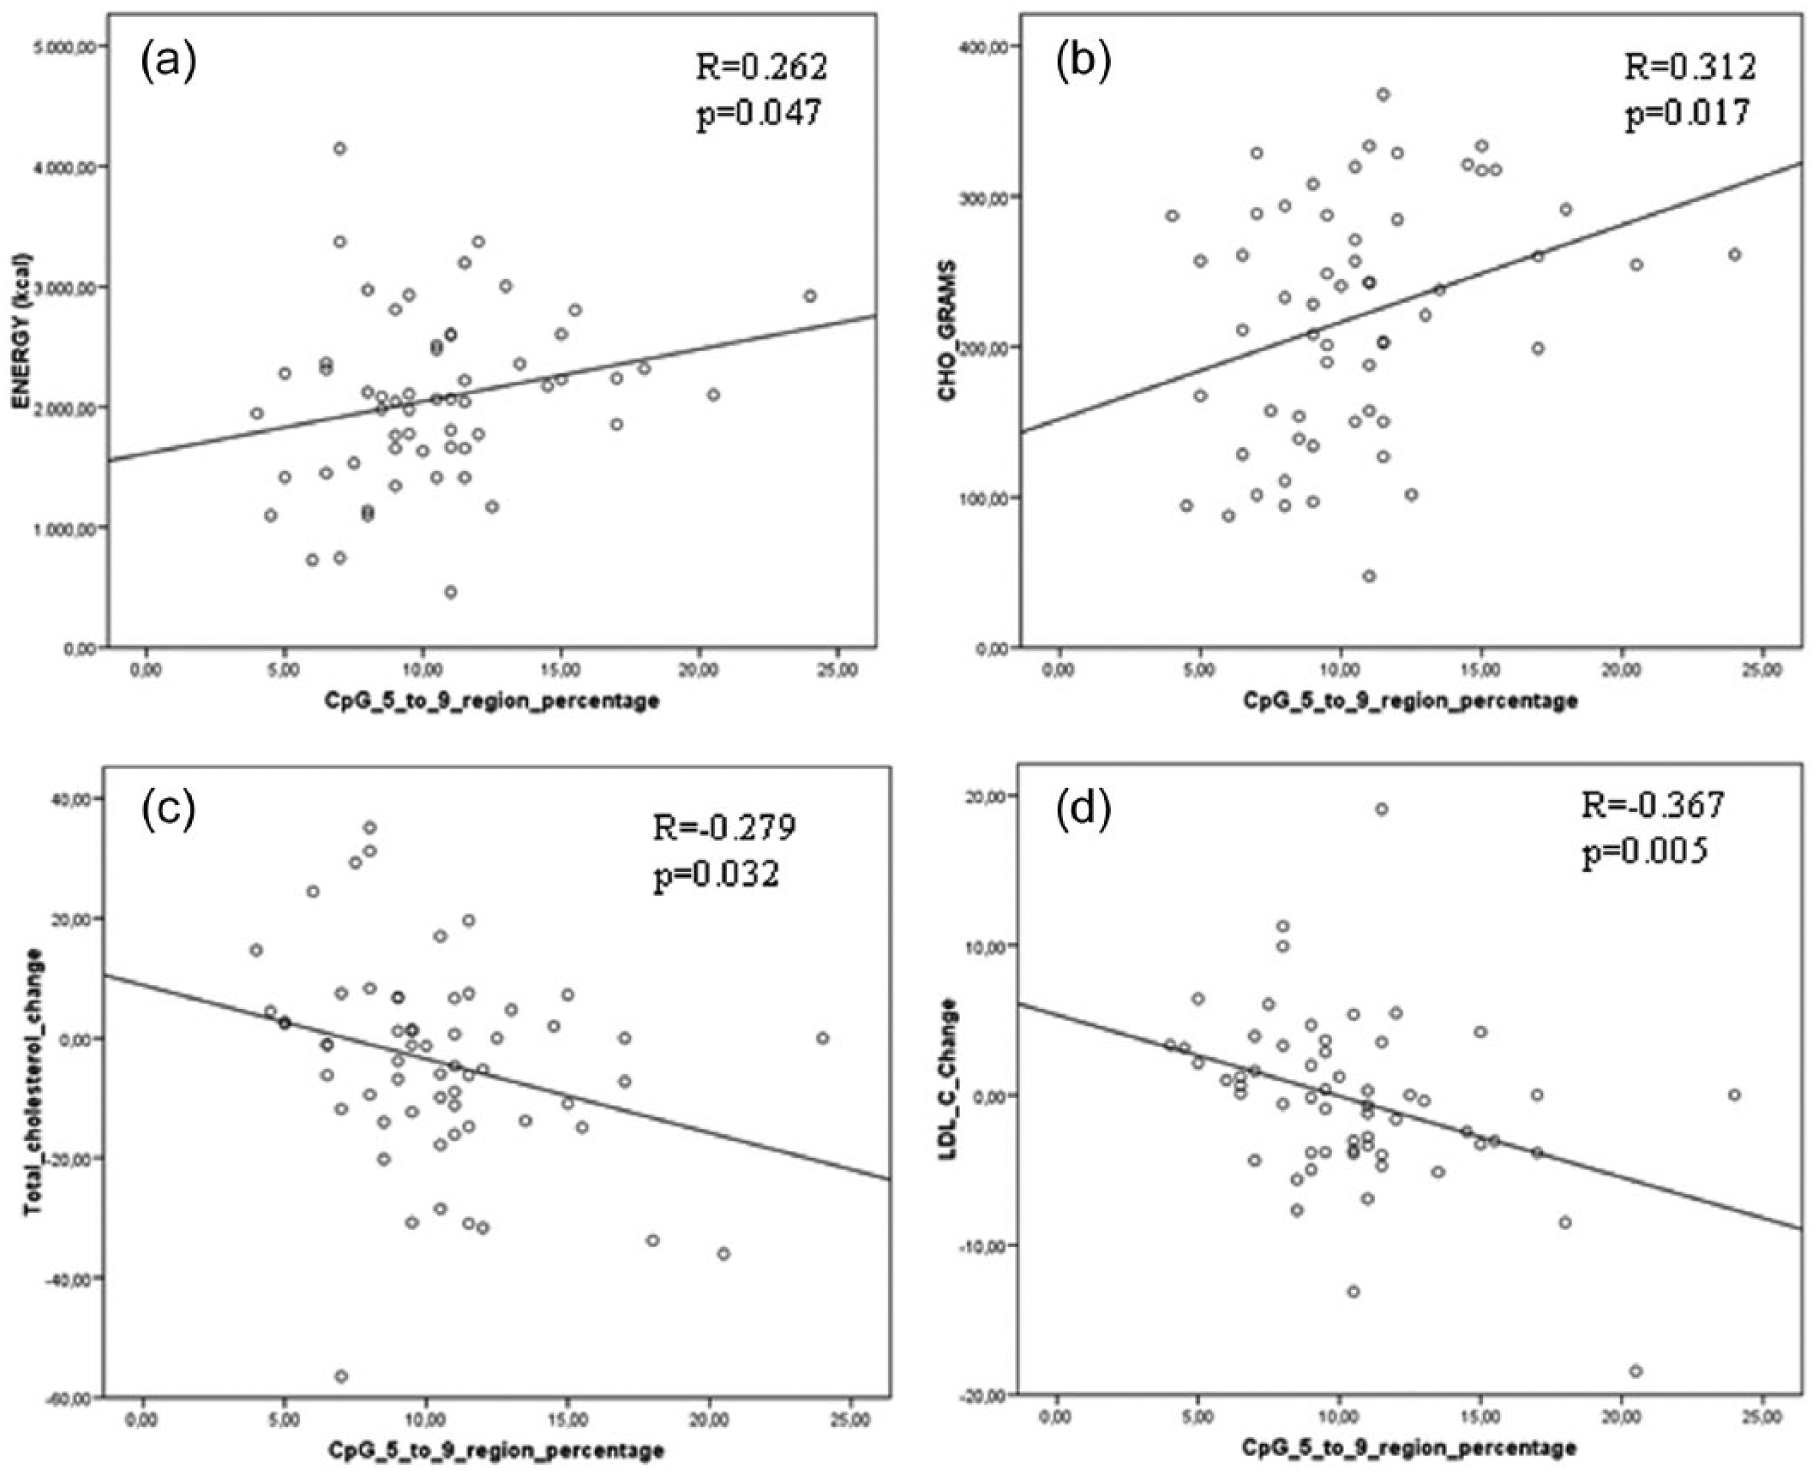
Correlations between the basal methylation of the CpG 5 to 9 region of BMAL1 with energy (a) and carbohydrate intake (b), and the percentages of change on serum lipids (cholesterol [c] and LDL-C [d]) adjusted for baseline energy intake (kcal). R = Pearson’s coefficient; p < 0.05. LDL-C = low-density lipoprotein cholesterol; kcal = kilocalorie; CHO = carbohydrates.
Of relevance, the intervention-induced changes in methylation levels at the CpG 5 to 9 region in BMAL1 were related to significant changes in serum lipids (Table 2). When adjusted for baseline methylation, the associations between methylation change and the changes in total and LDL-C levels were not nominally significant. In addition, in the case of NR1D1 and CLOCK, no statistically significant associations were found between baseline methylation levels and dietary intake or changes in biochemical parameters with the treatment.
Associations between the Change of Cytosine Methylation in the CpG 5 to 9 Region of the BMAL1 Gene and Changes in Anthropometric and Biochemical Features.
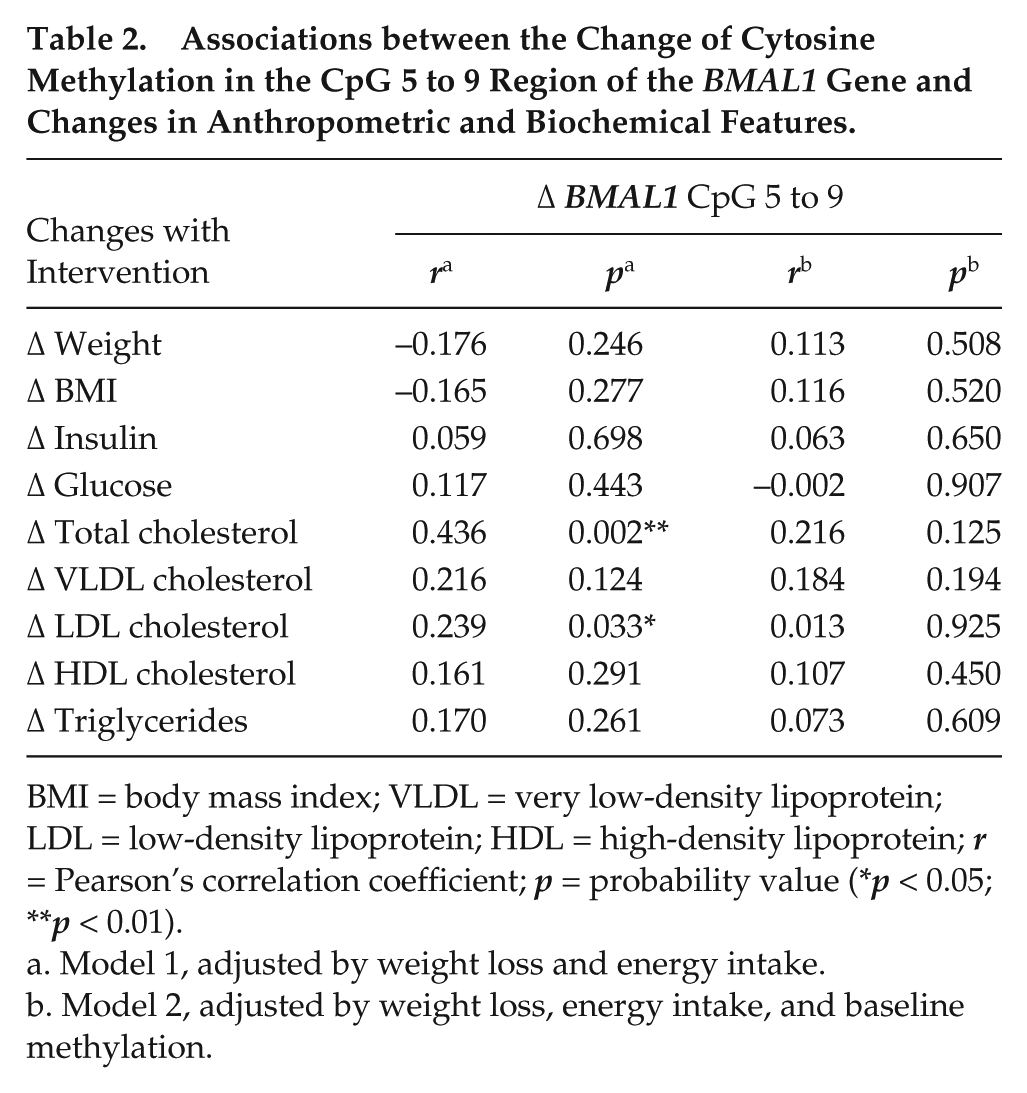
BMI = body mass index; VLDL = very low-density lipoprotein; LDL = low-density lipoprotein; HDL = high-density lipoprotein; r = Pearson’s correlation coefficient; p = probability value (*p < 0.05; **p < 0.01).
Model 1, adjusted by weight loss and energy intake.
Model 2, adjusted by weight loss, energy intake, and baseline methylation.
Multiple linear regression analysis was used to search for potential associations between changes in the methylation status and changes in lipids levels. Thus, variables were independently studied by univariable linear regression, and total cholesterol change (adjusted R2 = 10%; p = 0.009), baseline methylation within the CpG 5 to 9 region (R2 = 39.3%; p < 0.001), initial BMI (p = 0.942), energy intake (p = 0.211), and age (p = 0.720) were included in the model. When all the variables with potential predictive values were jointly fitted in a multiple linear regression analysis, the model explained 42.9% (adjusted R2 = 0.429; p model < 0.001) of the variability of methylation change of the CpG 5 to 9 region (Table 3).
Analysis of a Linear Regression Model of Association between Change in BMAL1 Gene Methylation Levels and Total Cholesterol Change, According to Baseline Methylation of the Gene.
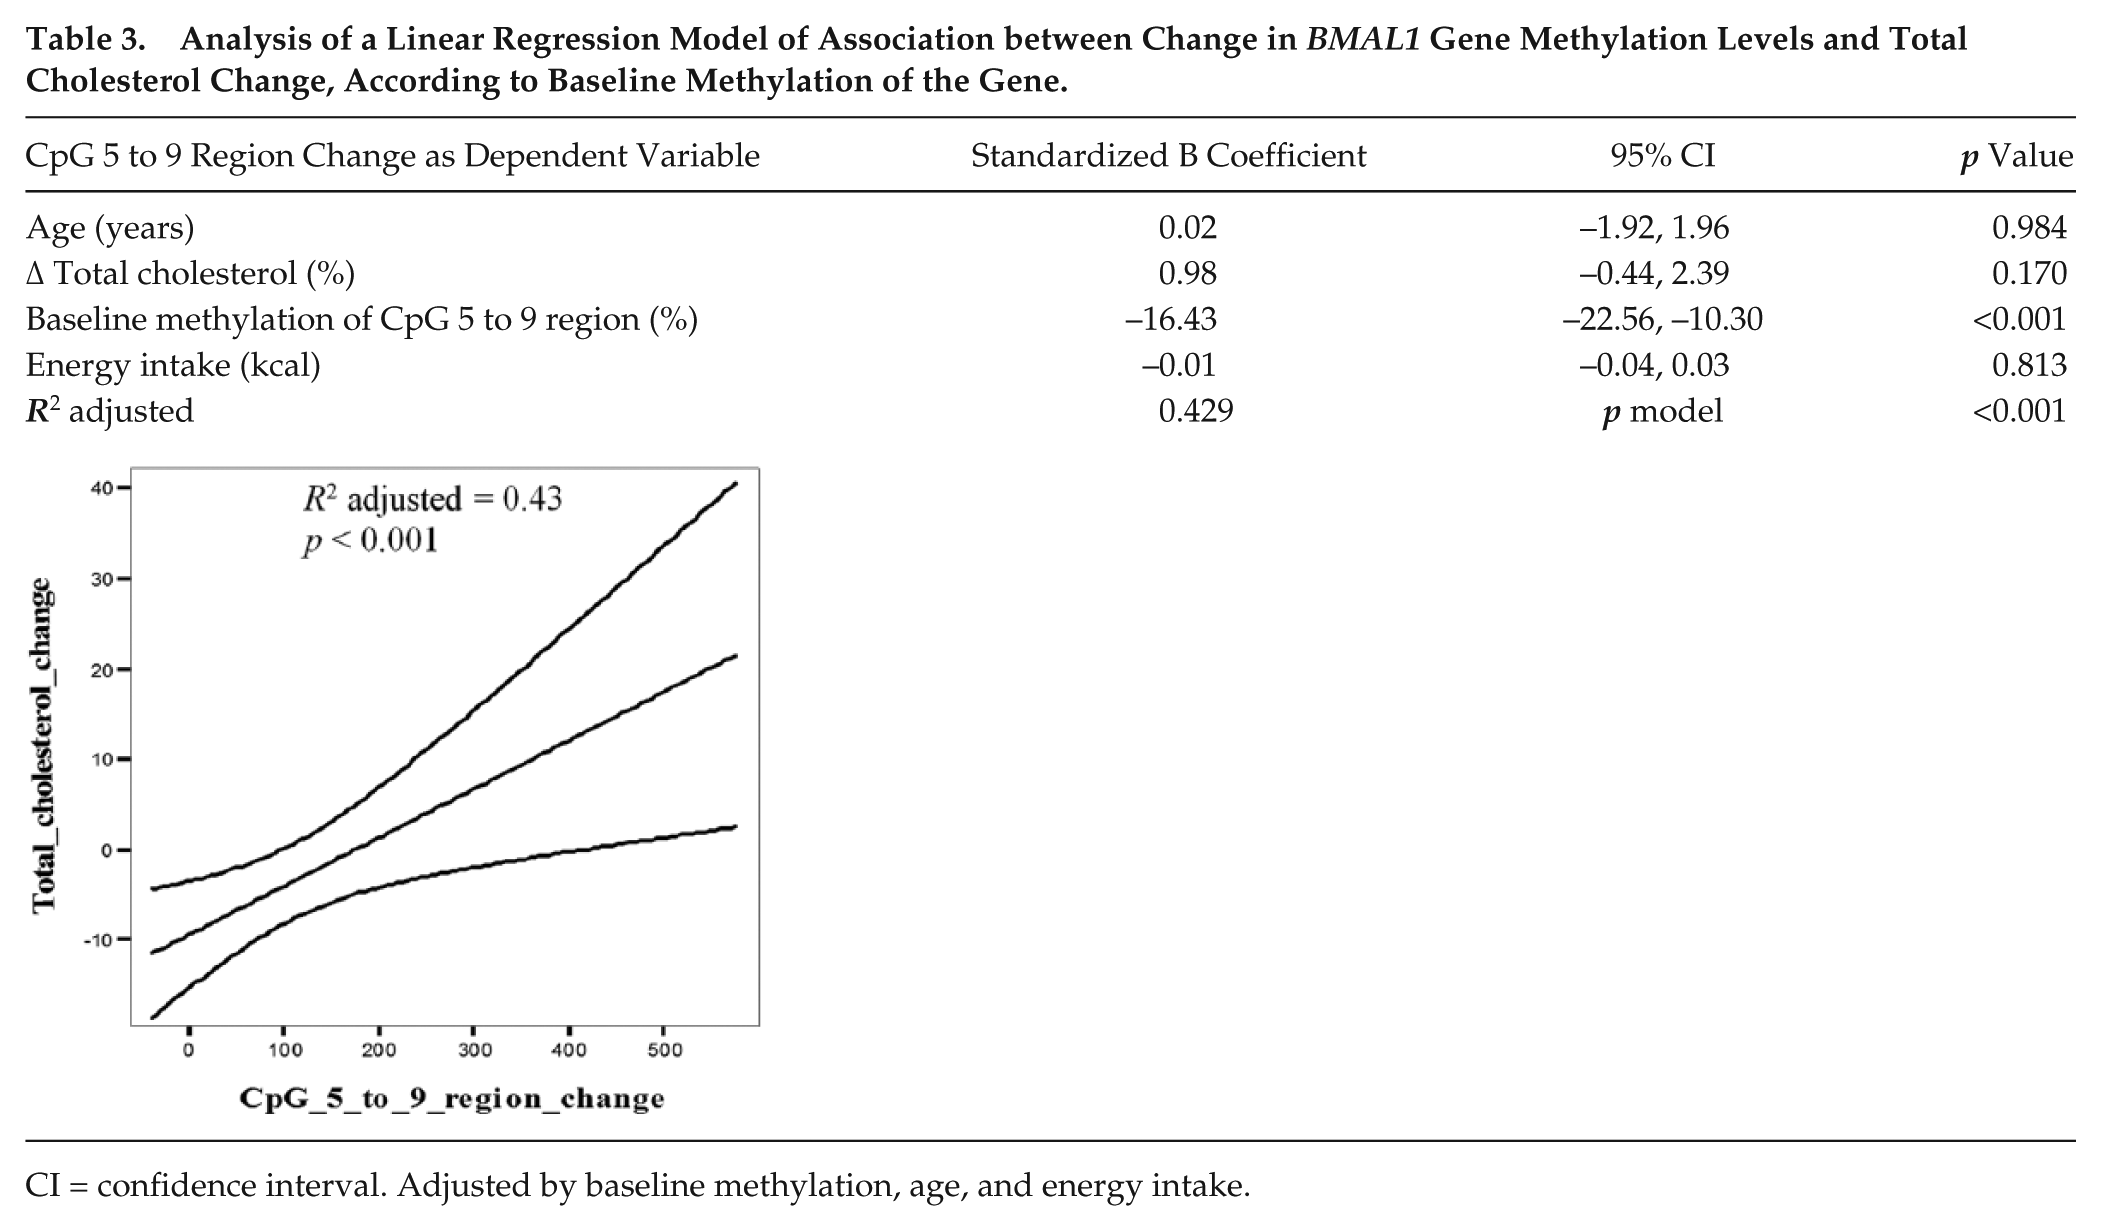
CI = confidence interval. Adjusted by baseline methylation, age, and energy intake.
Discussion
Our research poses the hypothesis that a weight loss nutritional intervention changes the methylation pattern of the mammalian biological clock genes BMAL1, CLOCK, and NR1D1 in whole blood. More important, these changes in the methylation levels of BMAL1 due to the intervention induced changes in metabolic risk parameters, such as the serum lipid profile.
This weight loss intervention is based on a Mediterranean dietary pattern, and previous studies have found that other Mediterranean diet–based interventions are able to modify the epigenetic marks in blood cells (Lopez-Legarrea et al., 2013). In fact, it is well established that many dietary factors can modify the epigenetic marks (Burdge and Lillycrop, 2014; Daniel and Tollefsbol, 2015; Martinez et al., 2014), including methyl donors (Cordero et al., 2013), fatty acids (do Amaral et al., 2014), and polyphenols such as epigallocatechin-3-gallate, genistein, or resveratrol (Daniel and Tollefsbol, 2015). On the other hand, the methylation levels of different genomic regions have been associated with higher or lower response to weight loss nutritional interventions in overweight and obese adolescents (Moleres et al., 2013) and adults (Milagro et al., 2011). Specifically, our group has previously reported an association between the methylation status of some clock genes (CLOCK and PER2) with obesity parameters and MetS, enabling the potential use of the methylation status of these clock genes as biomarkers of weight loss success (Milagro et al., 2012). In the current trial, women who consumed more energy and carbohydrates in their habitual intake before the intervention presented higher methylation levels in the CpG 5 to 9 region of BMAL1, suggesting a relationship between total intake and the methylation pattern of this clock gene. These associations support the important role of the circadian system in food intake and vice versa, through an epigenetic mechanism. The addition of one methyl group to the DNA, in regions where a cytosine nucleotide occurs next to a guanine nucleotide, modifies the chromatin structure by altering the binding site of some transcription factors and proteins (Lister et al., 2009). In a recent study performed in mice, the authors concluded that the suprachiasmatic nucleus uses DNA methylation as a mechanism to control circadian clock transcription (Azzi et al., 2014). As a consequence, DNA methylation is considered a regulatory mechanism of gene expression.
Concerning the relationship between clock genes, epigenetics, and energy homeostasis, our group previously reported an association between the methylation pattern of various clock genes with obesity, MetS, and weight loss (Milagro et al., 2012). In that study, statistically significant correlations were found between initial methylation of CpG 1 and CpG 5.6 of the CLOCK gene and BMI, body fat and waist circumference, and also weight loss percentage. In the current study, similar correlations were observed, although they did not reach statistical significance. This could be partly explained because the anthropometric and phenotypical features of both studies were different (i.e., initial weight, BMI, comorbidities). On the other hand, the present study did not find statistically significant changes in CLOCK methylation as a result of the weight loss treatment. As far as we know, this is the first study that analyzed the effect of weight loss on changes in clock gene methylation. In our previous study (Milagro et al., 2012), we did not have DNA at the end point, so we could not measure weight loss–induced changes in DNA methylation. Interestingly, the present experiment evidenced an association between the methylation levels of a clock gene (BMAL1) and energy and carbohydrate intakes. In relation to this finding, it has been hypothesized that the energy content and the type of macronutrients affect the synchronization between internal clock and biological functions. Thus, some researchers have demonstrated that nutrients such as carbohydrates, amino acids, sodium, or caffeine may alter the circadian rhythms by changing the expression of clock genes (Froy, 2007; Garaulet and Gomez-Abellan, 2014). In addition, the dietary intake of monounsaturated fatty acids (MUFAs) and saturated fatty acids (SFAs) could modulate the effects that some genetic variants of CLOCK have on insulin resistance and obesity (Garaulet et al., 2009).
An outstanding outcome of the current study was the association between the changes in the methylation pattern concerning BMAL1 due to the intervention and the changes in lipid markers. Taking into account this result, we might speculate about a possible causality between changes in methylation and changes in lipid markers. BMAL1 is a positive circadian transcription factor that forms a complex with CLOCK for creating CLOCK-BMAL1 heterodimers (Froy, 2007). This complex directly or indirectly activates the transcription of some clock-controlled genes, such as NR1D1. Various investigations had displayed the important function of this heterodimer in lipid homeostasis (Shimba et al., 2011). Clock total body knockout mice (Clock–/–) exhibit alterations in cholesterol metabolism and atherosclerosis (Debruyne et al., 2006). Furthermore, recent molecular studies have demonstrated the involvement of BMAL1 gene activity in the regulation of adipogenesis and lipid metabolism in mature adipocytes (Froy, 2012). Specifically, the overexpression of this gene led to an increase of lipid synthesis in adipocytes (Shimba et al., 2005). Moreover, BMAL1 is upregulated during hyperlipidemic and hyperglycemic periods in obese subjects (Tahira et al., 2011) and can regulate other transcription factors involved in the metabolic processes. Our bioinformatic analysis has identified the following transcription factor binding sites as putatively involved in regulation of the expression of BMAL1 by binding to the analyzed sequence: GR-α, p53, E2F-1, ENKTF-1, NFI/CTF, Sp1, TFII-I, EBF, ETF, Pax-5, NF-1, and MAZ. From these factors, one of the most interesting is GR-α. GR participates in the mobilization of fatty acids from adipose tissue to blood, increasing lipid concentration in plasma. We have previously described (Gomez-Abellan et al., 2012) the action of the glucocorticoid analogue dexamethasone on circadian gene expression in adipose tissue. Regarding BMAL1, a recent study has suggested that expression and activation of genes mediated by GR were blocked by the CLOCK/BMAL1 heterodimer (Han et al., 2014). Moreover, it has been demonstrated that glucocorticoids entrained BMAL1 (Cuesta et al., 2015). In this sense, the antagonism of GR may be a viable therapeutic strategy for the treatment of hyperlipidemia and MetS (Watts et al., 2005).
Other examples of transcription factors that might be putatively involved in the regulation of the expression of BMAL1, according to our bioinformatic analyses, is p53, which has also been described as a circadian clock regulator. It has been demonstrated that p53 repressed the BMAL1/CLOCK-mediated transcription of Per2 by binding to the Per2 promoter (Miki et al., 2013). Finally, the nuclear factor (NF) and Sp1 are other transcription factors that act as functional regulators of the transcription of the Bmal1 gene by binding to CCAAT/GC elements on the Bmal1 promoter (Xiao et al., 2013). All these findings point to an important role of BMAL1 in the regulation of lipid metabolism in MetS and obesity.
The epigenome may be altered by a number of environmental and behavioral factors such as inflammation, oxidative stress, smoke cigarette, physical activity, or stress (Campion et al., 2010). One of these environmental factors is diet, and our research displays that dietary components could be involved in the modification of the methylation pattern of clock genes, specifically BMAL1 and NR1D1.
Changes in methylation status were positively associated with variation in circulating lipid levels, such as those of total cholesterol and LDL-C. However, when adjusted for baseline methylation, the significance of the association was lost. In this context, the regression analysis also demonstrated that the baseline methylation might explain about 39% of methylation changes that resulted from the nutritional intervention, indicating that the initial methylation status was essential to understand the outcomes. Thus, lipid reduction was higher in those women who had higher baseline methylation of the BMAL1 gene promoter.
A very interesting result of this study was the positive correlation between the Morningness-Eveningness score and changes of the methylation levels of BMAL1, indicating that when a subject is vespertine presents more methylation changes in this clock gene. Previously, it has been found that evening-type subjects presented higher methylation levels than morning-type subjects in inflammation-related genes such as TNF-α (Bollati et al., 2010). The current study suggests that evening-type subjects obtained a major benefit from the intervention through decreasing the methylation levels of BMAL1 compared with morning-type subjects.
In summary, the energy-restricted intervention modified the methylation pattern of the BMAL1 gene promoter in whole blood and affected blood lipids levels. As a limitation, since we had no RNA from the same samples, we could not establish any relations between the methylation and the expression of the gene. However, our bioinformatic analysis showed different transcription factors that may be putatively affected by these methylation changes, as it is the case for the glucocorticoid receptor. These findings underline the importance of epigenetic mechanisms in circadian regulation. It is noteworthy that the current work provides evidence of an association between the methylation status of BMAL1 and the habitual intake of energy and carbohydrates, which, in the future and after validation in new experiments, could be used in the prevention and treatment of MetS. Finally, this is apparently the first study to report associations between changes in the methylation of BMAL1 with the intervention and the effects of a weight loss intervention on blood lipid levels, supporting the importance of the regulation of core clock proteins in blood lipid homeostasis. Indeed, the current data support that the baseline methylation levels of BMAL1 are important in the reduction of serum lipids.
Footnotes
Acknowledgements
We thank the volunteers of this study and the technical assistance of Enrique Buso (UCIM, University of Valencia) for the MassArray measurements. We acknowledge the financial support of MINECO (Government of Spain, CIBERobn and Nutrigenio project, reference AGL2013-45554-R), Spanish Government of Economy and Competitiveness (SAF2014-52480-R), and European Regional Development Fund (ERDF) to Marta Garaulet that have contributed to the funding of the current work.
Conflict of Interest Statement
The author(s) declared no potential conflicts of interest with respect to the research, authorship, and/or publication of this article.
Funding
The author(s) received no financial support for the research, authorship, and/or publication of this article.
Notes
References
Supplementary Material
Please find the following supplemental material available below.
For Open Access articles published under a Creative Commons License, all supplemental material carries the same license as the article it is associated with.
For non-Open Access articles published, all supplemental material carries a non-exclusive license, and permission requests for re-use of supplemental material or any part of supplemental material shall be sent directly to the copyright owner as specified in the copyright notice associated with the article.