
Abstract
With the exception of high latitudes, life has evolved under bright days and dark nights. Most organisms have developed endogenously driven circadian rhythms that are synchronized to this daily light/dark cycle. In recent years, humans have shifted away from the naturally occurring solar light cycle in favor of artificial and sometimes irregular light schedules produced by electric lighting. Exposure to unnatural light cycles is increasingly associated with obesity and metabolic syndrome; however, the means by which environmental lighting alters metabolism are poorly understood. Thus, we exposed mice to dim light at night and investigated changes in the circadian system and metabolism. Here we report that exposure to ecologically relevant levels of dim (5 lux) light at night altered core circadian clock rhythms in the hypothalamus at both the gene and protein level. Circadian rhythms in clock expression persisted during light at night; however, the amplitude of Per1 and Per2 rhythms was attenuated in the hypothalamus. Circadian oscillations were also altered in peripheral tissues critical for metabolic regulation. Exposure to dimly illuminated, as compared to dark, nights decreased the rhythmic expression in all but one of the core circadian clock genes assessed in the liver. Additionally, mice exposed to dim light at night attenuated Rev-Erb expression in the liver and adipose tissue. Changes in the circadian clock were associated with temporal alterations in feeding behavior and increased weight gain. These results are significant because they provide evidence that mild changes in environmental lighting can alter circadian and metabolic function. Detailed analysis of temporal changes induced by nighttime light exposure may provide insight into the onset and progression of obesity and metabolic syndrome, as well as other disorders involving sleep and circadian rhythm disruption.
For >3 billion years, life outside of the highest latitudes has evolved under bright days and dark nights. Many organisms have developed endogenous 24-h rhythms, called circadian rhythms, which are synchronized to this light/dark cycle. With the widespread adoption of electrical lighting ~150 years ago, humans began brightly illuminating their nocturnal environments. Exposure to light at night is now pervasive in modern society and typically considered a mild environmental perturbation. However, the use of light at night (LAN) began prior to a deep appreciation of the importance of circadian rhythms for normal biological functions (Fonken and Nelson, 2011; Gerstner, 2012).
Recent evidence suggests that exposure to unnatural light cycles increases the risk for cancer (Stevens, 2009), sleep disturbances (Kohyama, 2009), and mood disorders (Driesen et al., 2010). Furthermore, exposure to light at night is increasingly associated with changes in metabolism. Shift workers who experience sustained nighttime illumination are at increased risk for cardiovascular disease and elevated body mass index (van Amelsvoort et al., 1999; Parkes, 2002; Knutsson, 2003; Ha and Park, 2005). Increases in nighttime light exposure at home are associated with increased body mass, waist circumference and triglyceride levels, and poor cholesterol balance (Obayashi et al., 2013). Even brief exposure to altered light and food schedules can result in adverse metabolic and cardiovascular consequences (Scheer et al., 2009). Moreover, we have reported that mice chronically exposed to dimly illuminated, as opposed to dark, nights elevate body mass independently of changes in total daily activity or caloric intake (Fonken et al., 2010; Fonken et al., 2012). Mice exposed to dim light at night shift the timing of food intake toward the light phase, and restricting food access to the dark phase prevents body mass gain in mice exposed to dim light at night. Whereas mice exposed to constant light show changes in the circadian pattern of glucocorticoids and activity, mice exposed to dim light at night maintain intact glucocorticoid and activity rhythms (Fonken et al., 2010). The mechanism by which light at night induces these metabolic changes is not fully understood.
Here we propose that light at night may alter metabolic homeostasis in mammals by disrupting the circadian system. Light is the most potent synchronizing factor for the circadian system. Light information travels directly from intrinsically photosensitive ganglion cells in the retina to the master circadian clock located in the suprachiasmatic nuclei (SCN) of the hypothalamus (Chen et al., 2011). Pacemaker neurons within the SCN thereby drive the circadian clock with an autoregulatory transcriptional-translational feedback loop of transcription activators and repressors (Albrecht, 2002). Although the SCN are the primary pacemakers in mammals, most if not all central and peripheral tissues contain the molecular machinery necessary for self-sustaining circadian oscillation (Mohawk et al., 2012). The master clock converts external light/dark information to neural and endocrine signals that synchronize peripheral clocks (McNamara et al., 2001; Guo et al., 2005).
Exposure to a pulse of light during the night can phase advance or delay the circadian clock depending on the strength and time of the light signal (Miyake et al., 2000), and specifically timed nighttime light pulses can be used to ablate the circadian system (Ruby et al., 2008). Exposure to constant light can alter locomotor activity rhythms and ablate circadian rhythms in glucocorticoids, 2 principal outputs of the circadian system (Fonken et al., 2010; Coomans et al., 2013). Furthermore, hamsters exposed to dim light at night alter daily cortisol rhythms and clock proteins in the hypothalamus and hippocampus (Bedrosian et al., 2013). Because disruption in circadian clock genes is associated with significant changes in metabolism (Bechtold et al., 2008; Marcheva et al., 2010; Carvas et al., 2012; Delezie et al., 2012; Paschos et al., 2012; Salgado-Delgado et al., 2013), we hypothesized that exposure to light at night alters metabolism through disrupting the circadian system. To assess the effects of light at night on the circadian clock, we exposed mice to either total darkness or dim light (5 lux) during the night and then characterized the expression of several circadian clock genes in the hypothalamus, hippocampus, liver, and adipose tissue and clock protein expression in the SCN. Five lux of nighttime light exposure was selected because (1) it is approximately 5 times brighter than maximal moonlight, (2) it is comparable to levels of light pollution found in urban areas (Kloog et al., 2009) and sleeping environments (Obayashi et al., 2013), yet (3) it is highly distinct from daytime light levels. Nocturnal rodents were selected for this study to test the effects of nighttime light exposure on the circadian system independent of sleep disruptions (Borniger et al., 2013).
Materials and Methods
Animals
One hundred twenty male Swiss Webster mice (~8 weeks of age) were obtained from Charles River Laboratories for use in this study. Mice were individually housed in propylene cages (dimensions: 33 × 19 × 14 cm) at an ambient temperature of 23 ± 2 °C and provided with Harlan Teklad 8640 food (Madison, WI) and filtered tap water ad libitum. All mice were maintained in a standard light dark cycle (LD; 14:10 light [~150 lux]/dark [0 lux]) for 1 week following arrival. All experimental procedures were approved by The Ohio State University Institutional Animal Care and Use Committee, and animals were maintained in accordance with the recommendations of the National Institutes of Health (NIH) and the Guide for the Care and Use of Laboratory Animals.
After the 1-week acclimation period, mice were randomly assigned to a group and transferred to a cabinet with either LD or a light/dim light cycle (14:10 light [~150 lux]/dim light [5 lux]). Daytime lighting was provided with white LEDs on the walls of the cabinets, and dim light was administered with a flexible strip of cool white LEDs wrapped around the rack on which the mouse cages were placed. The lighting intensity was measured inside the home cage and was highly consistent between cages. Mice were also assigned to 1 of 6 tissue collection time points (zeitgeber time [ZT] 2, 6, 10, 14, 18, and 22). Mice were weighed at the start of the experimental light treatment and weekly throughout the study. After 3 weeks in lighting conditions, food was weighed twice daily for 4 days to determine the timing of food intake. Four weeks after placement in light conditions, blood and tissue were collected for either quantitative polymerase chain reaction (qPCR) or immunohistochemical analyses (n = 5 per group/use/time point).
qPCR
Mice were anesthetized with isofluorane vapors, a blood sample was collected from the retro-orbital sinus, and mice were rapidly decapitated. Peripheral tissue was then dissected out, immediately weighed on a fine balance, and flash frozen. Weighed tissues include liver, spleen, pancreas, white adipose tissue (WAT; epididymal and inguinal), brown adipose tissue (BAT), adrenals, heart, and skeletal muscle. Brains were collected and placed in RNAlater, and after >24 h, the hypothalamus and hippocampus were dissected out for PCR. Total RNA was extracted from liver, white adipose, hippocampal, and hypothalamic tissues using a homogenizer (Ultra-Turrax T8; IKAWorks, Wilmington, NC) and an RNeasy Mini Kit following the manufacturer’s protocol (Qiagen, Austin, TX). For fat extractions, an additional chloroform step was added following homogenization and prior to the use of the mini kit. RNA concentration and purity were measured on an ND-1000 spectrophotometer (Fisher Scientific, Pittsburgh, PA). RNA concentrations were equalized with RNase-free water, and RNA was reverse transcribed into cDNA with M-MLV Reverse Transcriptase enzyme (Invitrogen, Carlsbad, CA) according to the manufacturer’s protocol. Gene expression for Clock, Bmal1, Per1, Per2, Cry1, Cry2, and Rev-Erbα was determined using inventoried primer and probe assays (Applied Biosystems, Foster City, CA) on an ABI 7500 Fast Real Time PCR System using Taqman Universal PCR Master Mix. The universal 2-step RT-PCR cycling conditions used were as follows: 50°C for 2 min, 95 °C for 10 min, followed by 40 cycles of 95°C for 15 sec and 60 °C for 1 min. Relative gene expression of individual samples run in duplicate was calculated by comparison to a relative standard curve and standardized by comparison to the 18S rRNA signal.
Immunohistochemistry
Mice were anesthetized with isoflurane vapors, a retro-orbital blood sample was collected, and then mice were given a lethal dose of sodium pentobarbital and perfused transcardially with ice-cold 0.1M phosphate-buffered saline (PBS) followed by 4% paraformaldehyde. Brains were removed, postfixed overnight, cryoprotected in 30% sucrose, and frozen with dry ice. Brains were serially sectioned at 40 µm into cryoprotectant and stored at −20 °C. Sets of tissue collected at 240-µm intervals were used for immunohistochemical detection of BMAL, CLOCK, PER1, and PER2 using antibodies generously provided by David Weaver (LeSauter et al., 2012). One to 2 series per animal was stained with each antibody. Sections were rinsed in PBS, blocked for 1 h in 4% bovine serum albumin in 0.1M PBS + 0.3% TX, and then incubated overnight at room temperature with primary antibody at 1:5000. The following day, sections were rinsed and incubated for 1 h with biotinylated goat anti-rabbit at 1:1000 (Vector Laboratories, Burlingame, CA). Endogenous peroxidase activity was quenched with 3% H2O2 in methanol for 20 min, and then the signal was amplified with avidin-biotin complex (Vectastain Elite ABC kit; Vector Laboratories) and tissue was developed using DAB. Tissue was then mounted onto gel-coated slides, dehydrated through a series of graded ethanol washes, cleared with xylene, and coverslipped using Permount. Images of sections containing the SCN were captured at 20× using a Nikon E800 microscope. The number of immunoreactive cells in the SCN was counted in ImageJ (NIH) by a condition blind observer and averaged across section (generally 1-2 sections per animal) and sides of the bilateral structure to obtain 1 value per each mouse. Any section that appeared to include only a portion of the SCN was not included in the analyses.
Glucose and Corticosterone Assessment
Terminal blood samples were collected via the retro-orbital sinus. Blood glucose concentrations were immediately assessed using a Contour blood glucose monitoring system and corresponding test strips (Bayer HealthCare, Pittsburgh, PA). Remaining blood was centrifuged at 4 °C for 30 min at 3000 g and then serum was pulled off and stored at −80 °C. Total serum corticosterone concentrations for mice were determined in duplicate in an assay using a 125I double-antibody kit (ICN Diagnostics, Costa Mesa, CA). The high and low limits of detectability of the assay were 1200 and 3 ng/mL, respectively. The intra-assay coefficient of variation was 11.5.
Statistical Analyses
Body mass was analyzed using a repeated-measures analysis of variance (ANOVA) with time as the within-subject factor and lighting condition as the between-subject factor. Comparisons between lighting conditions with respect to weight gain, tissue masses, and percentage of daytime food intake were conducted using a 1-way ANOVA. Blood glucose concentrations, corticosterone concentrations, qPCR results, and immunohistochemistry (IHC) results were analyzed using a 2-way ANOVA with lighting condition and time as the between-subjects factors. Following a significant F score, multiple comparisons were conducted with Tukey’s HSD test. All statistical analyses were performed using StatView software (v.5.0.1; SAS Institute, Cary, NC). In all cases, differences between group means were considered statistically significant if p ≤ 0.05.
Results
Exposure to Dim Light at Night Increases Body Mass
Body mass increased among both groups over the course of the study (F3,354 = 304.187; p < 0.0001); however, mice exposed to dim light at night significantly elevated body mass compared with mice housed in dark nights (F3,354 = 15.820; p < 0.0001; Fig. 1A). Overall, mice exposed to dim light at night had a greater body mass gain at the conclusion of the study compared with mice exposed to dark nights (F1,118 = 15.476; p < 0.001; Fig. 1B). There were no differences in spleen, liver, pancreas, brown adipose tissue, adrenal, or heart masses between groups (p > 0.05 in all cases). Epididymal fat pad mass was elevated among mice exposed to dim light at night (F1,58 = 7.520; p < 0.01; Fig. 1C), suggesting increases in body mass may reflect increases in white adipose tissue.
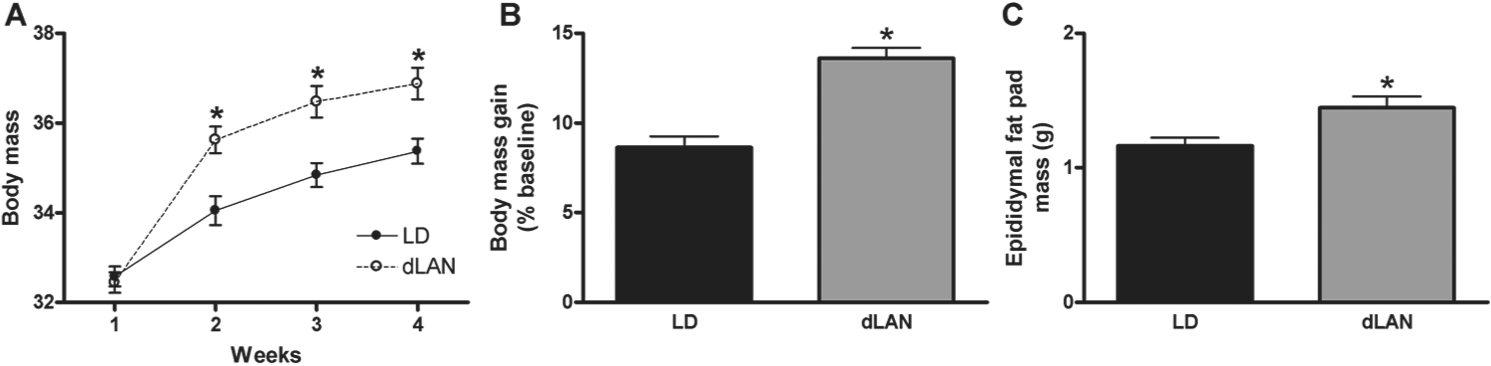
Mice exposed to dim light at night (dLAN) increased body mass compared with mice exposed to a standard light/dark cycle (LD). (A) Body mass in mice exposed to dimly lit and dark nights. (B) At the conclusion of the study, body mass gain was increased among mice exposed to dim light at night as compared with dark nights. (C) Epididymal fat pad mass, an index of overall adiposity, was also increased in mice exposed to light at night. All data are presented as mean ± SEM. *p < 0.05 dLAN differs from LD.
Light at Night Attenuates Nocturnal Feeding Behavior
Despite increases in body mass among mice exposed to dim light at night, there were no differences in total daily food intake between groups (p > 0.05; Fig. 2A). In agreement with previous results (Fonken et al., 2010; Fonken et al., 2012), exposure to light at night increased the percentage of food consumed during the light phase (F1,118 = 16.595; p < 0.0001; Fig. 2B). Mice displayed a diurnal variation in blood glucose levels (F5,106 = 14.023; p < 0.0001; Fig. 2C) with no differences between lighting conditions (p > 0.05). In agreement with previous findings (Fonken et al., 2010), mice exposed to dim light at night did not alter the diurnal pattern or total daily concentration of corticosterone (Fig. 2D).
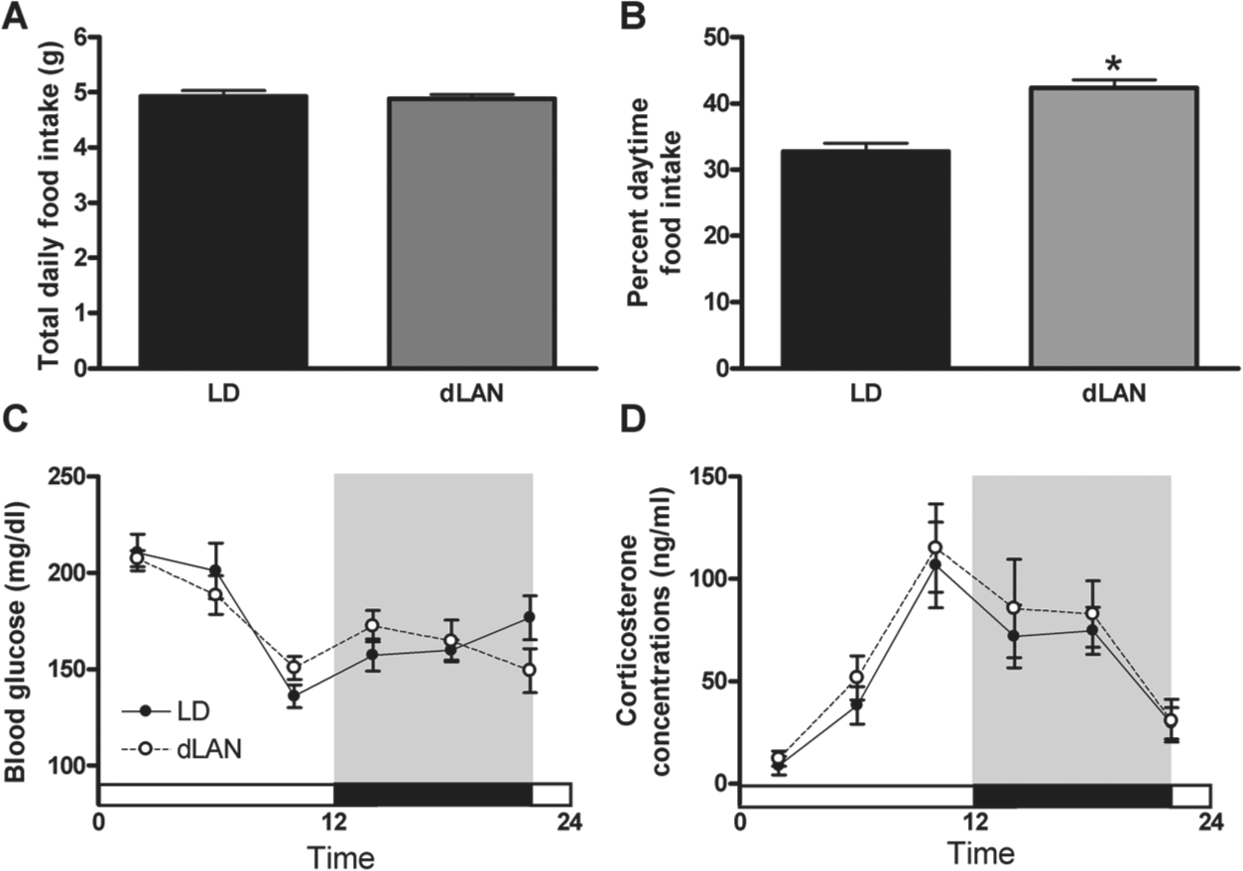
Timing of food intake is altered in mice exposed to dim light at night. (A) There were no differences in total daily food intake between mice exposed to dim light at night and dark nights, however. (B) Mice exposed to dim light at night altered timing of food intake, consuming more during the light phase. There were no differences in (C) blood glucose rhythms or (D) corticosterone rhythms between lighting conditions. All data are presented as mean ± SEM. *p < 0.05 dLAN differs from LD.
Clock Gene Expression Is Disrupted by Nighttime Light Exposure
To test the hypothesis that nighttime light exposure affects core clock gene expression, we analyzed the diurnal expression of transcripts encoding Clock, Bmal1, Per1, Per2, Cry1, and Cry2 in the hypothalamus, hippocampus, fat, and liver every 4 h after 4 weeks of exposure to dim or dark nights. There was a main effect of time for all core clock genes assessed in the hypothalamus, indicating all of the genes displayed diurnal variation (Clock: F5,45 = 3.843, Bmal1: F5,45 = 8.807, Per1: F5,45 = 6.159, Per2: F5,45 = 5.544, Cry1: F5,45 = 4.316, and Cry2: F5,44 = 3.674, p < 0.01; Fig. 3A). Expression of Clock, Bmal, and Cry1 was unaffected by lighting conditions (p > 0.05); however, rhythmic expression of Per1 and Cry2 was attenuated by exposure to dim light as compared with dark nights in the hypothalamus (main effect of light; Per1: F1,45 = 6.629, Cry2: F1,44 = 4.303; p < 0.05; Fig. 3A). More specifically, gene expression of Cry2 was significantly reduced at ZT18 (Cry2: t7 = 2.444; p < 0.05), 6 h after lights off, in mice exposed to dimly lit nights. Per1 and Per2 expression was both reduced at ZT14 (Per1: t8 = 2.804, Per2: t8 = 2.701; p < 0.05), and Per1 expression was also reduced at ZT6 in mice exposed to dim light at night (t8 = 3.345; p < 0.05).
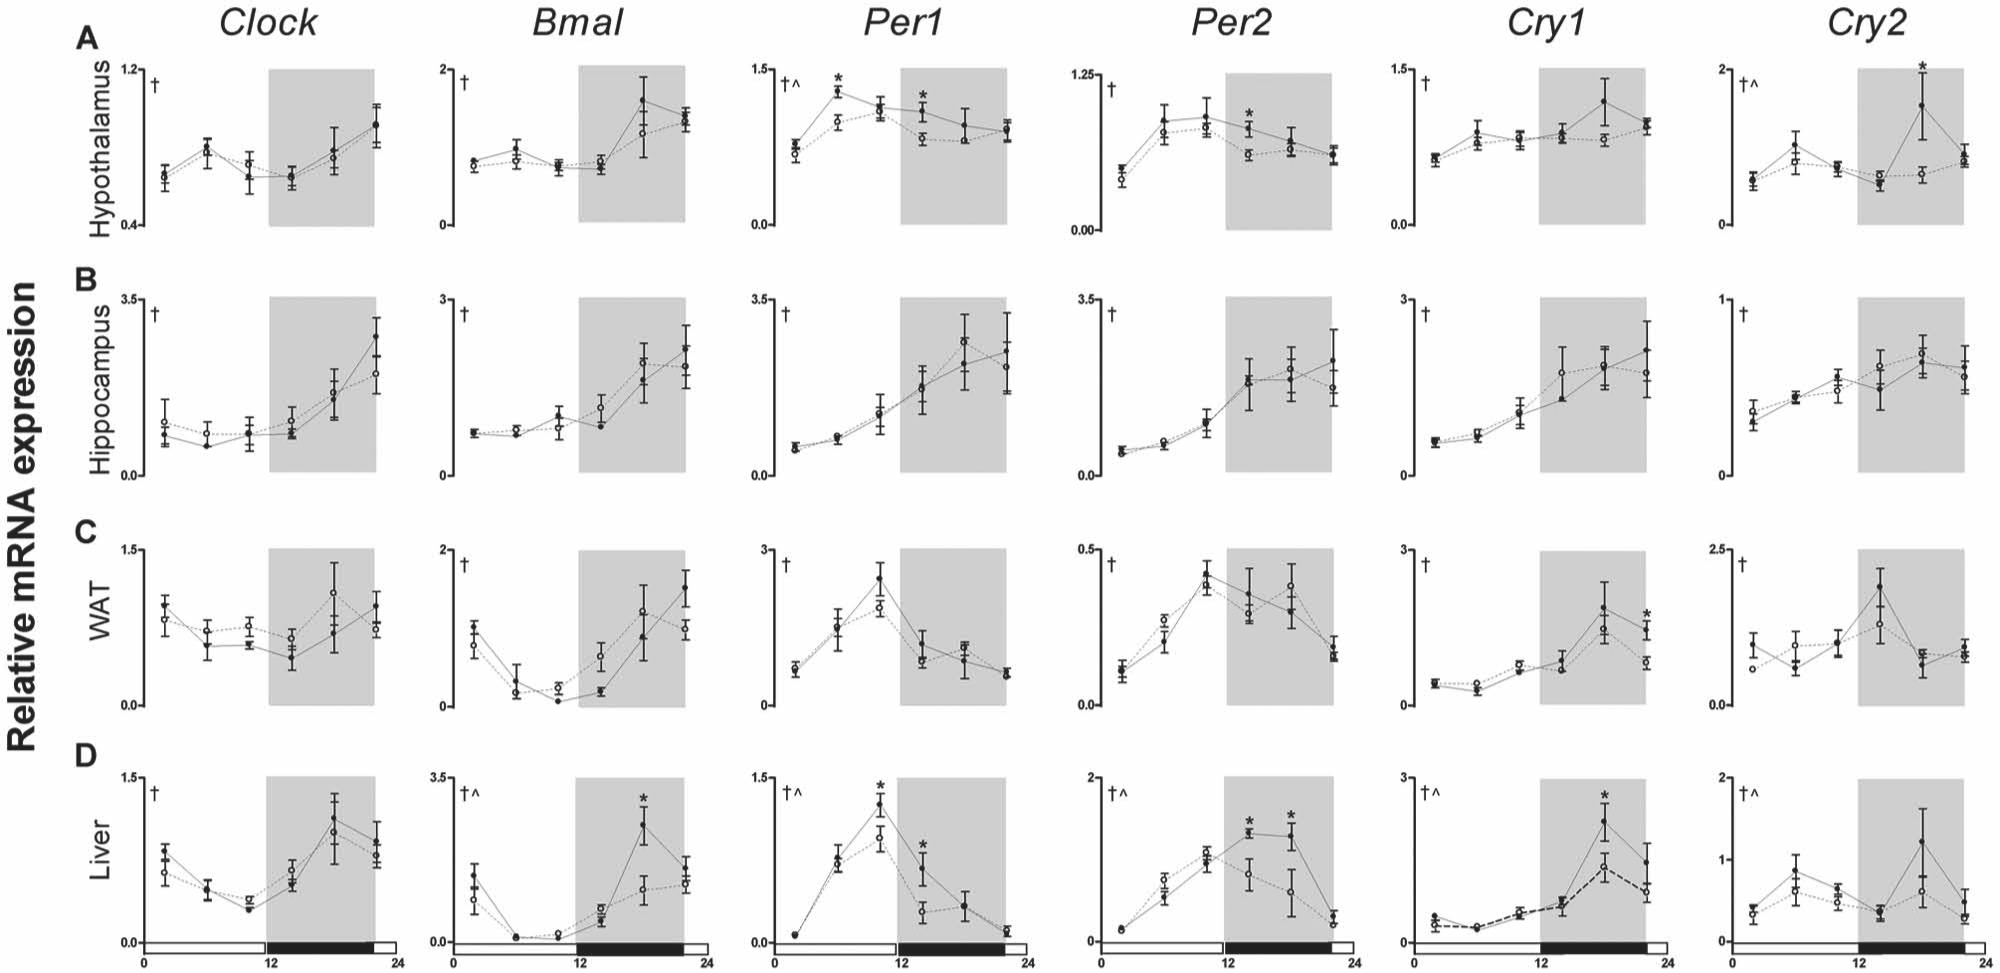
Dim light at night attenuates the amplitude of clock gene expression in the hypothalamus and liver. Transcripts of the core circadian clock genes Clock, Bmal1, Per1, Per2, Cry1, and Cry2 were analyzed by quantitative PCR in the (A) hypothalamus, (B) hippocampus, (C) white adipose tissue (WAT), and (D) liver. Tissues were collected every 4 h from mice exposed to either dark (black lines) or dimly lit (dotted lines) nights for 4 weeks. Values are expressed as relative abundance (mean ± SEM) after normalization to 18S. †p < 0.05 main effect of time, ^p < 0.05 main effect of lighting condition, *p < 0.05 time point difference between lighting conditions.
To determine whether the effects of nighttime light exposure in the brain are specific to the hypothalamus, we examined core clock gene expression in the hippocampus, a brain region known to show robust circadian oscillations. There was clear cycling of Clock, Bmal1, Per1, Per2, Cry1, and Cry2 in the hippocampus (main effect of time: Clock: F5,44 = 4.690, Bmal1: F5,44 = 8.838, Per1: F5,44 = 9.558, Per2: F5,44 = 10.016, Cry1: F5,43 = 8, and Cry2: F5,44 = 5.246; p < 0.005; Fig. 3B). Overall, lighting condition had no effect on hippocampal clock gene expression (p > 0.05). This suggests that within the brain, changes in clock gene expression provoked by exposure to light at night may be regionally specific.
Recent work has demonstrated the importance of tissue-specific clocks in regulating metabolism (e.g., Marcheva et al., 2010). For example, rats that undergo a shift work paradigm show desynchrony of liver genes and changes in metabolism (Salgado-Delgado et al., 2013). Thus, we investigated the effects of nighttime light exposure on core clock gene expression in peripheral white adipose and liver tissues. All of the clock genes analyzed except for Clock displayed rhythmic variation in white adipose tissue (main effect of time: Bmal1: F5,45 = 8.081, Per1: F5,45 = 13.822, Per2: F5,44 = 9.686, Cry1: F5,45 = 10.997, and Cry2: F5,44 = 4.438; p < 0.005; Fig. 3C), and there was no effect of nighttime light exposure on mRNA expression levels (p > 0.05; Fig. 3C). Rhythmic expression of Clock, Bmal1, Per1, Per2, Cry1, and Cry2 was also apparent in the liver (main effect of time: Clock: F5,45 = 8.336, Bmal1: F5,45 = 23.127, Per1: F5,45 = 34.993, Per2: F5,45 = 34.953, Cry1: F5,45 = 18.806, and Cry2: F5,45 = 4.736; p < 0.005; Fig. 3D). However, expression of 5 out of the 6 genes assessed in the liver was attenuated by exposure to dim light at night (main effect of light: Bmal1: F1,45 = 7.129, Per1: F1,45 = 4.544, Per2: F1,45 = 8.565, Cry1: F1,45 = 4.474, and Cry2: F1,45 = 4.851; p < 0.05; Fig. 3D). Single time point comparisons revealed that Bmal1 expression was reduced at ZT18 (t7 = 2.603), Per1 expression was reduced at ZT10 and ZT14 (t8 = 2.433 and 2.411, respectively), Per2 expression was reduced ZT14 and ZT18 (t8 = 2.792 and t7 =2.725, respectively), and Cry1 expression was reduced as ZT18 (t7 = 2.484; p < 0.05 in all cases). Taken together, these results reveal that exposure to low levels of light at night produce both tissue- and gene-specific changes in the expression levels of several core circadian clock genes.
To further explore the effects of light at night on clock transcriptional networks, we studied the 24-h pattern of expression of Rev-Erbα mRNA in hypothalamic, hippocampal, white adipose, and liver tissues. Rev-Erbα is a nuclear receptor that has prominent functions for both circadian oscillations and metabolic homeostasis (reviewed in Ripperger and Albrecht, 2012). Diurnal rhythmicity in Rev-Erbα expression was observed in all tissues evaluated (main effect of time: hypothalamus: F5,44 = 3.676, hippocampus: F5,45 = 2.687, WAT: F5,43 = 16.820, liver: F5,45 = 70.349, p < 0.05; Fig. 4). There was a main effect of nighttime light exposure on Rev-erb expression in the liver (F5,45 = 13.920; p < 0.0005) such that Rev-Erbα was attenuated during the light phase (ZT6: t7 = 2.523 and ZT10: t8 = 2.613; p < 0.05). Furthermore, exposure to dim light at night reduced Rev-Erbα expression levels at ZT10 in WAT (t8 = 2.521; p < 0.05). Decreased Rev-Erbα expression was specific to the periphery as there were no changes in hypothalamic or hippocampal Rev-Erbα mRNA levels.
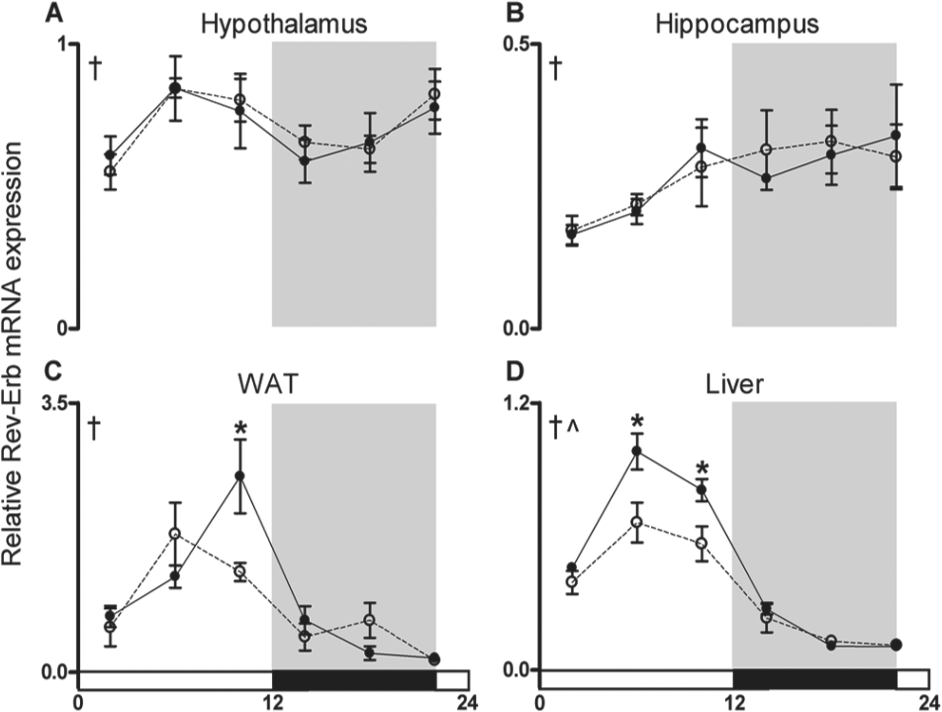
Dim light at night suppresses the amplitude of Rev-Erb mRNA expression in peripheral tissue. Rev-Erb gene expression was quantified in the (A) hypothalamus (B) hippocampus, (C) white adipose tissue (WAT), and (D) liver. Values are expressed as relative abundance (mean ± SEM) after normalization to 18S. †p < 0.05 main effect of time, ^p < 0.05 main effect of lighting condition, *p < 0.05 time point difference between lighting conditions.
Core Clock Protein Expression in the Suprachiasmatic Nucleus
To fully characterize changes in circadian clock function within the SCN after nighttime light exposure, we evaluated clock protein expression every 4 h in mice housed under dark or dimly lit nights for 4 weeks. Rhythmic CLOCK and BMAL protein expression was observed within the SCN (main effect of time: CLOCK: F5,39 = 6.599 and BMAL: F5,34 = 5.146; p < 0.05) with no effect of nighttime light exposure (p > 0.05; Fig. 5A,B). Expression levels of both PER1 and PER2 were altered by exposure to dim light as compared with dark nights (p < 0.05; Fig. 5C,D). There was a main effect of time on PER1 expression (F5,34 = 5.636; p < 0.001) and an interaction between light and time on PER1 expression (F5,34 = 2.846; p < 0.05). Whereas mice exposed to dark nights had rhythmic expression of PER1, mice exposed to dim light at night did not display diurnal variation in PER1. Specifically, the peak in PER1 expression at ZT10 was abolished by exposure to dim light at night (t6 = 2.640; p < 0.05). PER2 expression was rhythmic (main effect of time: F5,33 = 8.915; p < 0.0001) and also affected by exposure to light at night. Mice exposed to dim light at night reduced PER2 expression at ZT14 (t6 = 2.815; p < 0.05). These results confirm gene expression findings demonstrating dim light at night affects hypothalamic Per1 and Per2.
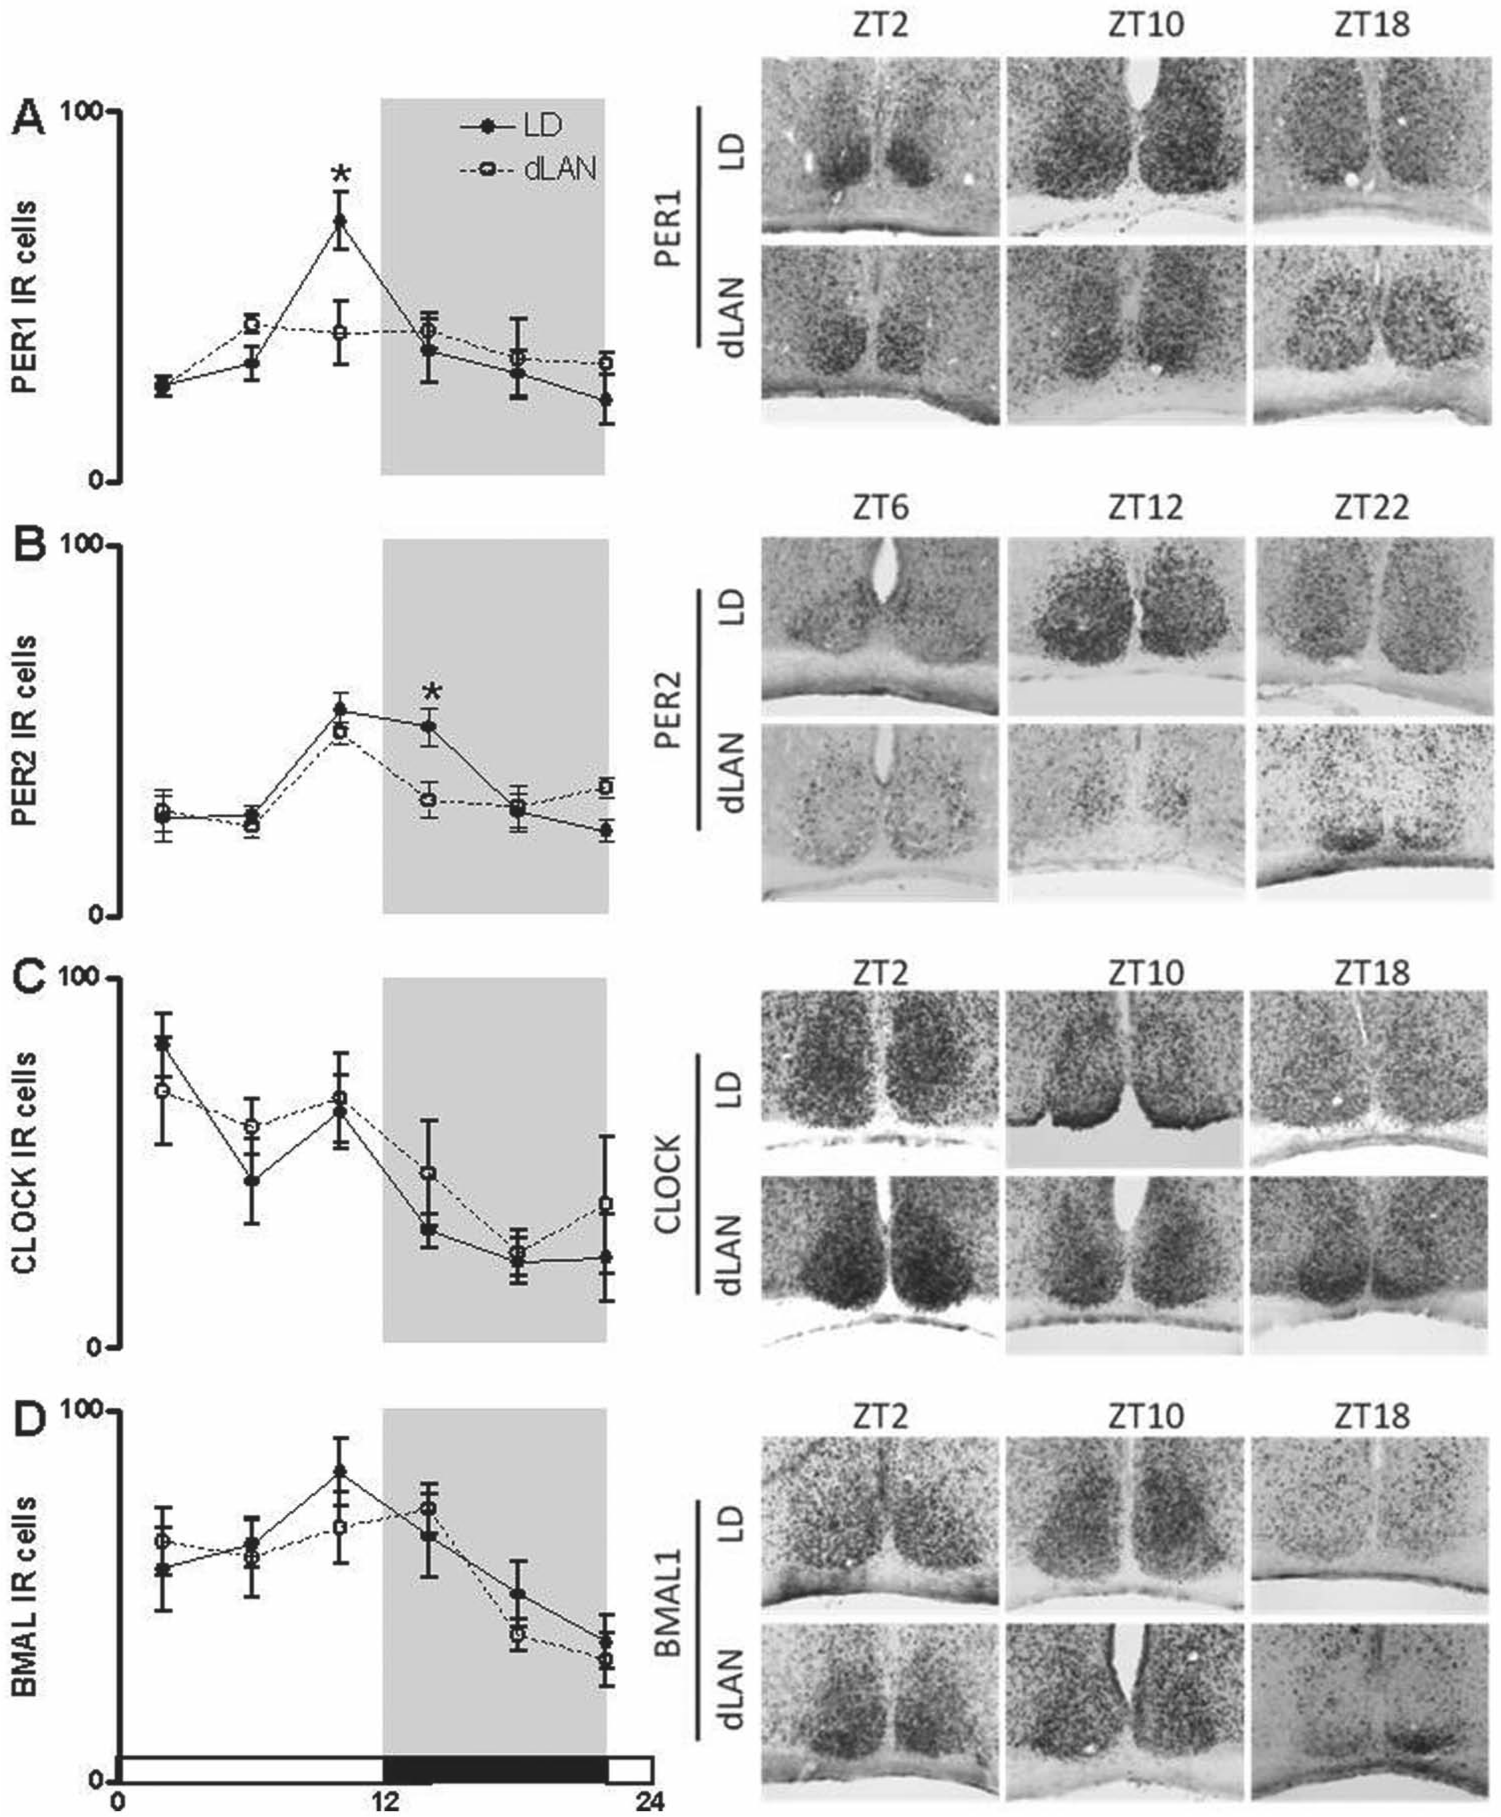
PER1 and PER2 protein expression is reduced in the suprachiasmatic nucleus of the hypothalamus of mice exposed to dimly lit as compared with dark nights. CLOCK, BMAL, PER1, and PER2 immunoreactivity was analyzed in hypothalamic tissue collected every 4 h from mice exposed to either dark (black lines) or dimly lit (dotted lines) nights for 4 weeks. Images of sections containing the SCN were captured at 20×, and the number of immunoreactive cells was counted and averaged across section and sides of the bilateral structure. Data are presented as mean ± SEM. *p < 0.05 time point difference between lighting conditions.
Discussion
Exposure to electrical light at night can lead to disruptions in metabolic energy homeostasis in rodents and humans (van Amelsvoort et al., 1999; Parkes, 2002; Knutsson, 2003; Ha and Park, 2005; Obayashi et al., 2013). However, it remains unclear how environmental lighting affects metabolism. Because previous research suggests changes in the circadian system can lead to metabolic disruption (reviewed in Froy, 2010), we characterized the effects of exposure to light at night on the circadian system. Here we establish that exposure to ecologically relevant levels of dim light during the night attenuate circadian clock gene and protein rhythms, change feeding behavior, and lead to weight gain. These observations indicate that exposure to dim light at night, a commonplace and innocuous-seeming environmental manipulation, can influence the circadian system and metabolism.
Mice exposed to dim light at night showed rapid and sustained body mass elevations. Increases in body mass may reflect increases in white adipose tissue as the epididymal fat pad mass was elevated among mice exposed to dimly lit nights. Although total daily caloric intake was comparable between groups, mice exposed to light at night consumed more food during the light period and less during the dark period than mice housed in dark nights. Disorganization in the feeding rhythm may contribute to increased body weight. Altered timing of food intake can cause weight gain, and restricting feeding to specific hours prevents the development of obesity (Arble et al., 2009; Bray et al., 2010; Hatori et al., 2012; Sherman et al., 2012). For example, restricting food intake to the active phase prevents obesity and circadian desynchrony in a rodent model of night shift work (Salgado-Delgado et al., 2010). Furthermore, mice fed a high fat diet disrupt daily feeding patterns and attenuate circadian clock gene rhythms in peripheral tissue (Kohsaka et al., 2007).
Genetic models indicate a close association between the molecular events underlying metabolism and those involved in the generation of circadian rhythms. For example, Clock mutant mice become overweight on a high-fat diet and develop symptoms characteristic of metabolic syndrome (Turek et al., 2005). Mice with mutations in other clock genes, including Bmal1, Per1, Per2, Vipr2, and Rev-Erbα, display similar metabolic outcomes (Bechtold et al., 2008; Marcheva et al., 2010; Carvas et al., 2012; Delezie et al., 2012). These studies indicate that alterations in core clock transcription factors within both the central clock and peripheral tissues alter metabolism. Importantly, our results suggest that changes in the circadian clock genes can be induced with exposure to ecologically relevant levels of dim light at night. Mice exposed to dim light at night suppress Per1 and Per2 gene expression in the hypothalamus and protein expression within the SCN of the hypothalamus. Importantly, there were no differences in clock gene expression in the hippocampus, suggesting that changes in central nervous system clock gene expression provoked by exposure to light at night are regionally specific.
Recent work highlights the importance of peripheral clocks in regulating metabolism as single tissue clock gene deletions in the liver or fat can result in metabolic disturbances (Lamia et al., 2008; Marcheva et al., 2010; Paschos et al., 2012). Here we show that in addition to altering clock gene expression in the hypothalamus, exposure to dimly illuminated, as opposed to dark, nights attenuated the rhythmic expression of all but one of the core circadian clock genes assessed in the liver. These results suggest that changes in circadian regulation in the liver may be more extensive than changes in the hypothalamus with exposure to light at night. Changes in the liver are also not necessarily dependent on changes in the SCN. For example, peripheral clocks are entrained by neural and endocrine signaling from the SCN (McNamara et al., 2001; Guo et al., 2005), as well as by local factors such as nutritional signals (Vollmers et al., 2009). One limitation to this work is that it does not establish whether changes in the timing of food intake precede changes in liver clock gene expression. It is possible that (1) disruption in peripheral clock gene expression leads to changes in nutritional signaling, thereby affecting timing of food intake (e.g., see Paschos et al., 2012), or, alternatively, (2) changes in timing of food intake may lead to alterations in peripheral clock gene expression (e.g., Bray et al., 2013; Salgado-Delgado et al., 2013).
In addition to disruption in core clock mechanisms, mice exposed to dim light at night attenuated Rev-Erbα expression in the liver and adipose tissue. Although previously considered an accessory feedback loop, REV-ERBs are increasingly demonstrated to be essential for circadian clock function and regulation of rhythmic metabolism. Mice deficient in both isoforms of REV-ERB show circadian rhythm adjustments and pronounced changes in metabolically related functions (Bugge et al., 2012; Cho et al., 2012).
Here we provide an extensive characterization of the expression of circadian clock genes and proteins in both the master circadian oscillator in the brain and tissue-specific clocks in mice exposed to light at night. Overall, our findings indicate that exposure to light at night attenuates core circadian clock mechanisms in the hypothalamus at both the gene and protein level. Moreover, circadian clock function is disrupted in metabolically relevant peripheral tissue (i.e., white adipose tissue and liver) by nighttime light exposure. These changes in circadian clock function are associated with alterations in feeding behavior and increased weight gain. These findings are significant because they provide evidence for how mild changes in environmental lighting can alter circadian and metabolic function. Exposure to light at night is pervasive in modern society and typically considered a harmless environmental perturbation; however, our results demonstrate nighttime light exposure alters homeostatic functions. Detailed analysis of temporal changes induced by nighttime light exposure may provide insight into the onset and progression of obesity and metabolic syndrome and other disorders involving sleep and circadian disruption.
Footnotes
Acknowledgements
The authors thank Dr. David Weaver for generously providing antibodies and Tracy Bedrosian, Joseph Ferraro, and Zachary McHenry for technical assistance. This research was supported by NSF grant IOS-11-18792 to RJN. LKF was supported by an American Heart Association Predoctoral Fellowship.
Conflict of Interest Statement
The author(s) declared no potential conflicts of interest with respect to the research, authorship, and/or publication of this article.