
Abstract
Obesity during pregnancy causes numerous maternal and fetal health complications, but the underlying mechanisms remain unclear. Adipose tissue dysfunction in obesity has previously been linked to disruption of the intrinsic adipose clock gene network that is crucial for normal metabolic function. This adipose clock also undergoes major change as part of the maternal metabolic adaptation to pregnancy, but whether this is affected by maternal obesity is unknown. Consequently, in this study we tested the hypothesis that obesity disturbs rhythmic gene expression in maternal adipose tissue across pregnancy. A rat model of maternal obesity was established by cafeteria (CAF) feeding, and adipose expression of clock genes and associated nuclear receptors (Ppars and Pgc1α) was measured across days 15-16 and 21-22 of gestation (term = 23 days). CAF feeding suppressed the mesor and/or amplitude of adipose tissue clock genes (most notably Bmal1, Per2, and Rev-erbα) relative to chow-fed controls (CON) across both days of gestation. On day 15, the CAF diet also induced adipose Pparα, Pparδ, and Pgc1α rhythmicity but repressed that of Pparγ, while expression of Pparα, Pparδ, and Pgc1α was reduced at select time points. CAF mothers were hyperleptinemic at both stages of gestation, and at day 21 this effect was time-of-day dependent. Fetal plasma leptin exhibited clear rhythmicity, albeit with low amplitude, but interestingly these levels were unaffected by CAF feeding. Our data show that maternal obesity disrupts rhythmic expression of clock and metabolic genes in maternal adipose tissue and leads to maternal but not fetal hyperleptinemia.
Obesity during pregnancy leads to immediate and long-term complications for maternal and fetal health. Obese women are more likely to develop pregnancy disorders such as pre-eclampsia and gestational diabetes (Leddy et al., 2008; Marchi et al., 2015), while offspring born to obese mothers often experience altered growth trajectories and cardiometabolic aberrations in later life (Drake and Reynolds, 2010). Although these adverse outcomes of obese pregnancy are widely recognized, the mechanisms underlying them remain obscure.
Adipose tissue dysfunction and altered lipid metabolism are cornerstones of obesity-related pathologies in both non-pregnant (Hajer et al., 2008) and pregnant individuals (Lappas, 2014; Scifres et al., 2014). As such, disturbances to adipose tissue biology could mediate certain negative outcomes of obese pregnancy, and a growing body of evidence suggests that altered circadian biology may be crucial in this regard. Indeed, because the timing of metabolic processes is essential for energy homeostasis, the metabolic system and circadian clock are intricately related (Froy, 2010; Bailey et al., 2014). Accordingly, healthy adipose tissue displays highly rhythmic functions driven by adipocyte expression of clock genes, the molecular regulators of the circadian system (Shimba et al., 2005; Zvonic et al., 2006). The clock gene network (consisting of Clock, Bmal1, Per1-3, Cry1-2, Rev-erbα, and Rorα) influences the expression of many downstream genes, among which the peroxisome-proliferator activated receptors (Pparα, Pparγ, Pparδ) and the related Pgc1α are particularly important for integrating the circadian clock with metabolic function (Yang et al., 2006; Chen and Yang, 2014).
The circadian regulation of adipose tissue function is also likely to be important during pregnancy. Maternal adipose tissue lipid metabolism undergoes vital adaptations across pregnancy to meet maternal energy requirements and provide adequate substrate supply to the rapidly growing fetus (Herrera and Ortega-Senovilla, 2010). Importantly, recent evidence suggests that these adaptations occur in a circadian-dependent manner, since the onset and progression of pregnancy leads to major changes in maternal circadian biology (Wharfe et al., 2016a; Wharfe et al., 2016b; Wharfe et al., 2016c). Moreover, circadian disruption during pregnancy (via exposure to altered light cycles) disturbs maternal and fetal metabolism, alters rhythmic maternal leptin secretion, and programs metabolic dysfunction in offspring (Varcoe et al., 2011; Varcoe et al., 2013). As such, a functional circadian system appears to be essential for successful pregnancy outcomes.
Despite evidence that obesity alters adipose tissue clock gene expression in non-pregnant humans (Gomez-Abellan et al., 2007; Vieira et al., 2014) and animals (Kohsaka et al., 2007; Hsieh et al., 2009), the impact of obesity on the maternal circadian biology of adipose tissue during pregnancy is unknown. Accordingly, this study tested the hypothesis that maternal obesity, induced by cafeteria (CAF) feeding in rats, disrupts the rhythmic expression profiles of adipose tissue clock genes, associated Ppar genes, and maternal and fetal leptin levels.
Materials and Methods
Animals and Diets
All animal procedures were approved by the Animal Ethics Committee of The University of Western Australia. Nulliparous albino Wistar rats were obtained at weaning age from the Animal Resources Centre (Murdoch, WA, Australia) and housed at the Preclinical Facility at The University of Western Australia. Animals were maintained at an ambient temperature of 22 °C under a constant 12:12 h light-dark cycle (lights-on at 0700 h, lights-off at 1900 h), with free access to water and standard rodent chow (14 KJ/g total energy; 12% of energy as fat, 23% protein, and 65% carbohydrate; Specialty Feeds, Glen Forrest, WA, Australia). Following 1 week of acclimatization, animals were separated into control (CON) and cafeteria (CAF) groups; both groups had ad libitum access to standard chow, but CAF animals were also offered 4 human snack food items each day, which were given in excess and were rotated daily to maintain novelty. CAF items were changed at approximately zeitgeber time (ZT) 11-12 each day, and CON cages were opened and similarly disturbed at this time. The overall average total energy density of the CAF diet was 16.4 KJ/g (47% of energy as fat, 8% as protein, and 44% as carbohydrate); further dietary details have been previously reported (Crew et al., 2016b).
Animals were maintained on their respective diets for 8 weeks, after which they were mated overnight following determination of proestrus by an estrous cycle monitor (EC40; Fine Science Tools, Vancouver, BC, Canada). Day 1 of pregnancy was confirmed when spermatozoa were present in a vaginal smear the following morning. Animals were housed individually and maintained on their respective diets throughout pregnancy.
Tissue Collection
The time of each tissue collection was expressed relative to zeitgeber time zero (ZT0), which was defined as 0700 h (when lights turned on in the animal facility). Adipose tissue and plasma samples were collected at 4 h intervals (ZT1, 0800 h; ZT5, 1200 h; ZT9, 1600 h; ZT13, 2000 h; ZT17, 2400 h; and ZT21, 0400 h) across each of days 15-16 and days 21-22 of gestation (term is 23 days).
At the appropriate time, animals were anesthetized using isoflurane/nitrous oxide (n = 7 or 8 per diet group at each time point). The maternal abdominal cavity was surgically opened, and a sample of retroperitoneal adipose tissue was taken from each mother, immediately frozen in liquid nitrogen, and stored at –80 °C. Maternal blood was collected from the descending aorta. For day 21 collections, fetuses were removed via caesarean section, sex was determined by anogenital distance (Faber and Hughes, 1992), and fetal trunk blood was collected by decapitation. All blood samples were mixed with 10:1 (vol:vol) 0.6 M EDTA and centrifuged at 13,000 × g for 6 min to obtain plasma, which was then frozen in liquid nitrogen and stored at –80 °C until subsequent analysis.
RNA and cDNA Sample Preparation
Total RNA was extracted from maternal adipose tissue using an RNeasy Lipid Tissue Kit (Qiagen, Hilden, Germany) according to the manufacturer’s instructions. RNA was assessed for concentration and purity using the Nanodrop ND-1000 spectrophotometer (Thermo Scientific, Wilmington, DE), and 1 µg of total RNA was reversed transcribed to cDNA using the Moloney Murine Leukemia Virus Reverse Transcriptase RNase H Point Mutant with random hexamers (Promega, Sydney, Australia), as previously described (Hewitt et al., 2006). The resultant cDNA was purified using the UltraClean PCR Cleanup Kit, according to the manufacturer’s instructions (MoBio Laboratories, Carlsbad, CA).
Quantitative PCR
The relative mRNA expression of clock genes (Clock, Bmal1, Per1, Per2, Per3, Cry1, Cry2, Rev-erbα, and Rorα) and several nuclear receptors involved in lipid metabolism (Pparα, Pparγ, Pparδ, and Pgc1α) was quantitated via RT-qPCR on the Rotorgene Q (Qiagen, Hilden, Germany). All primer pairs (see Table 1) were designed using Primer-BLAST (Rozen and Skaletsky, 2000) and were positioned to span an intron to prevent genomic DNA amplification.
Primer details and PCR conditions for genes measured in adipose tissue.
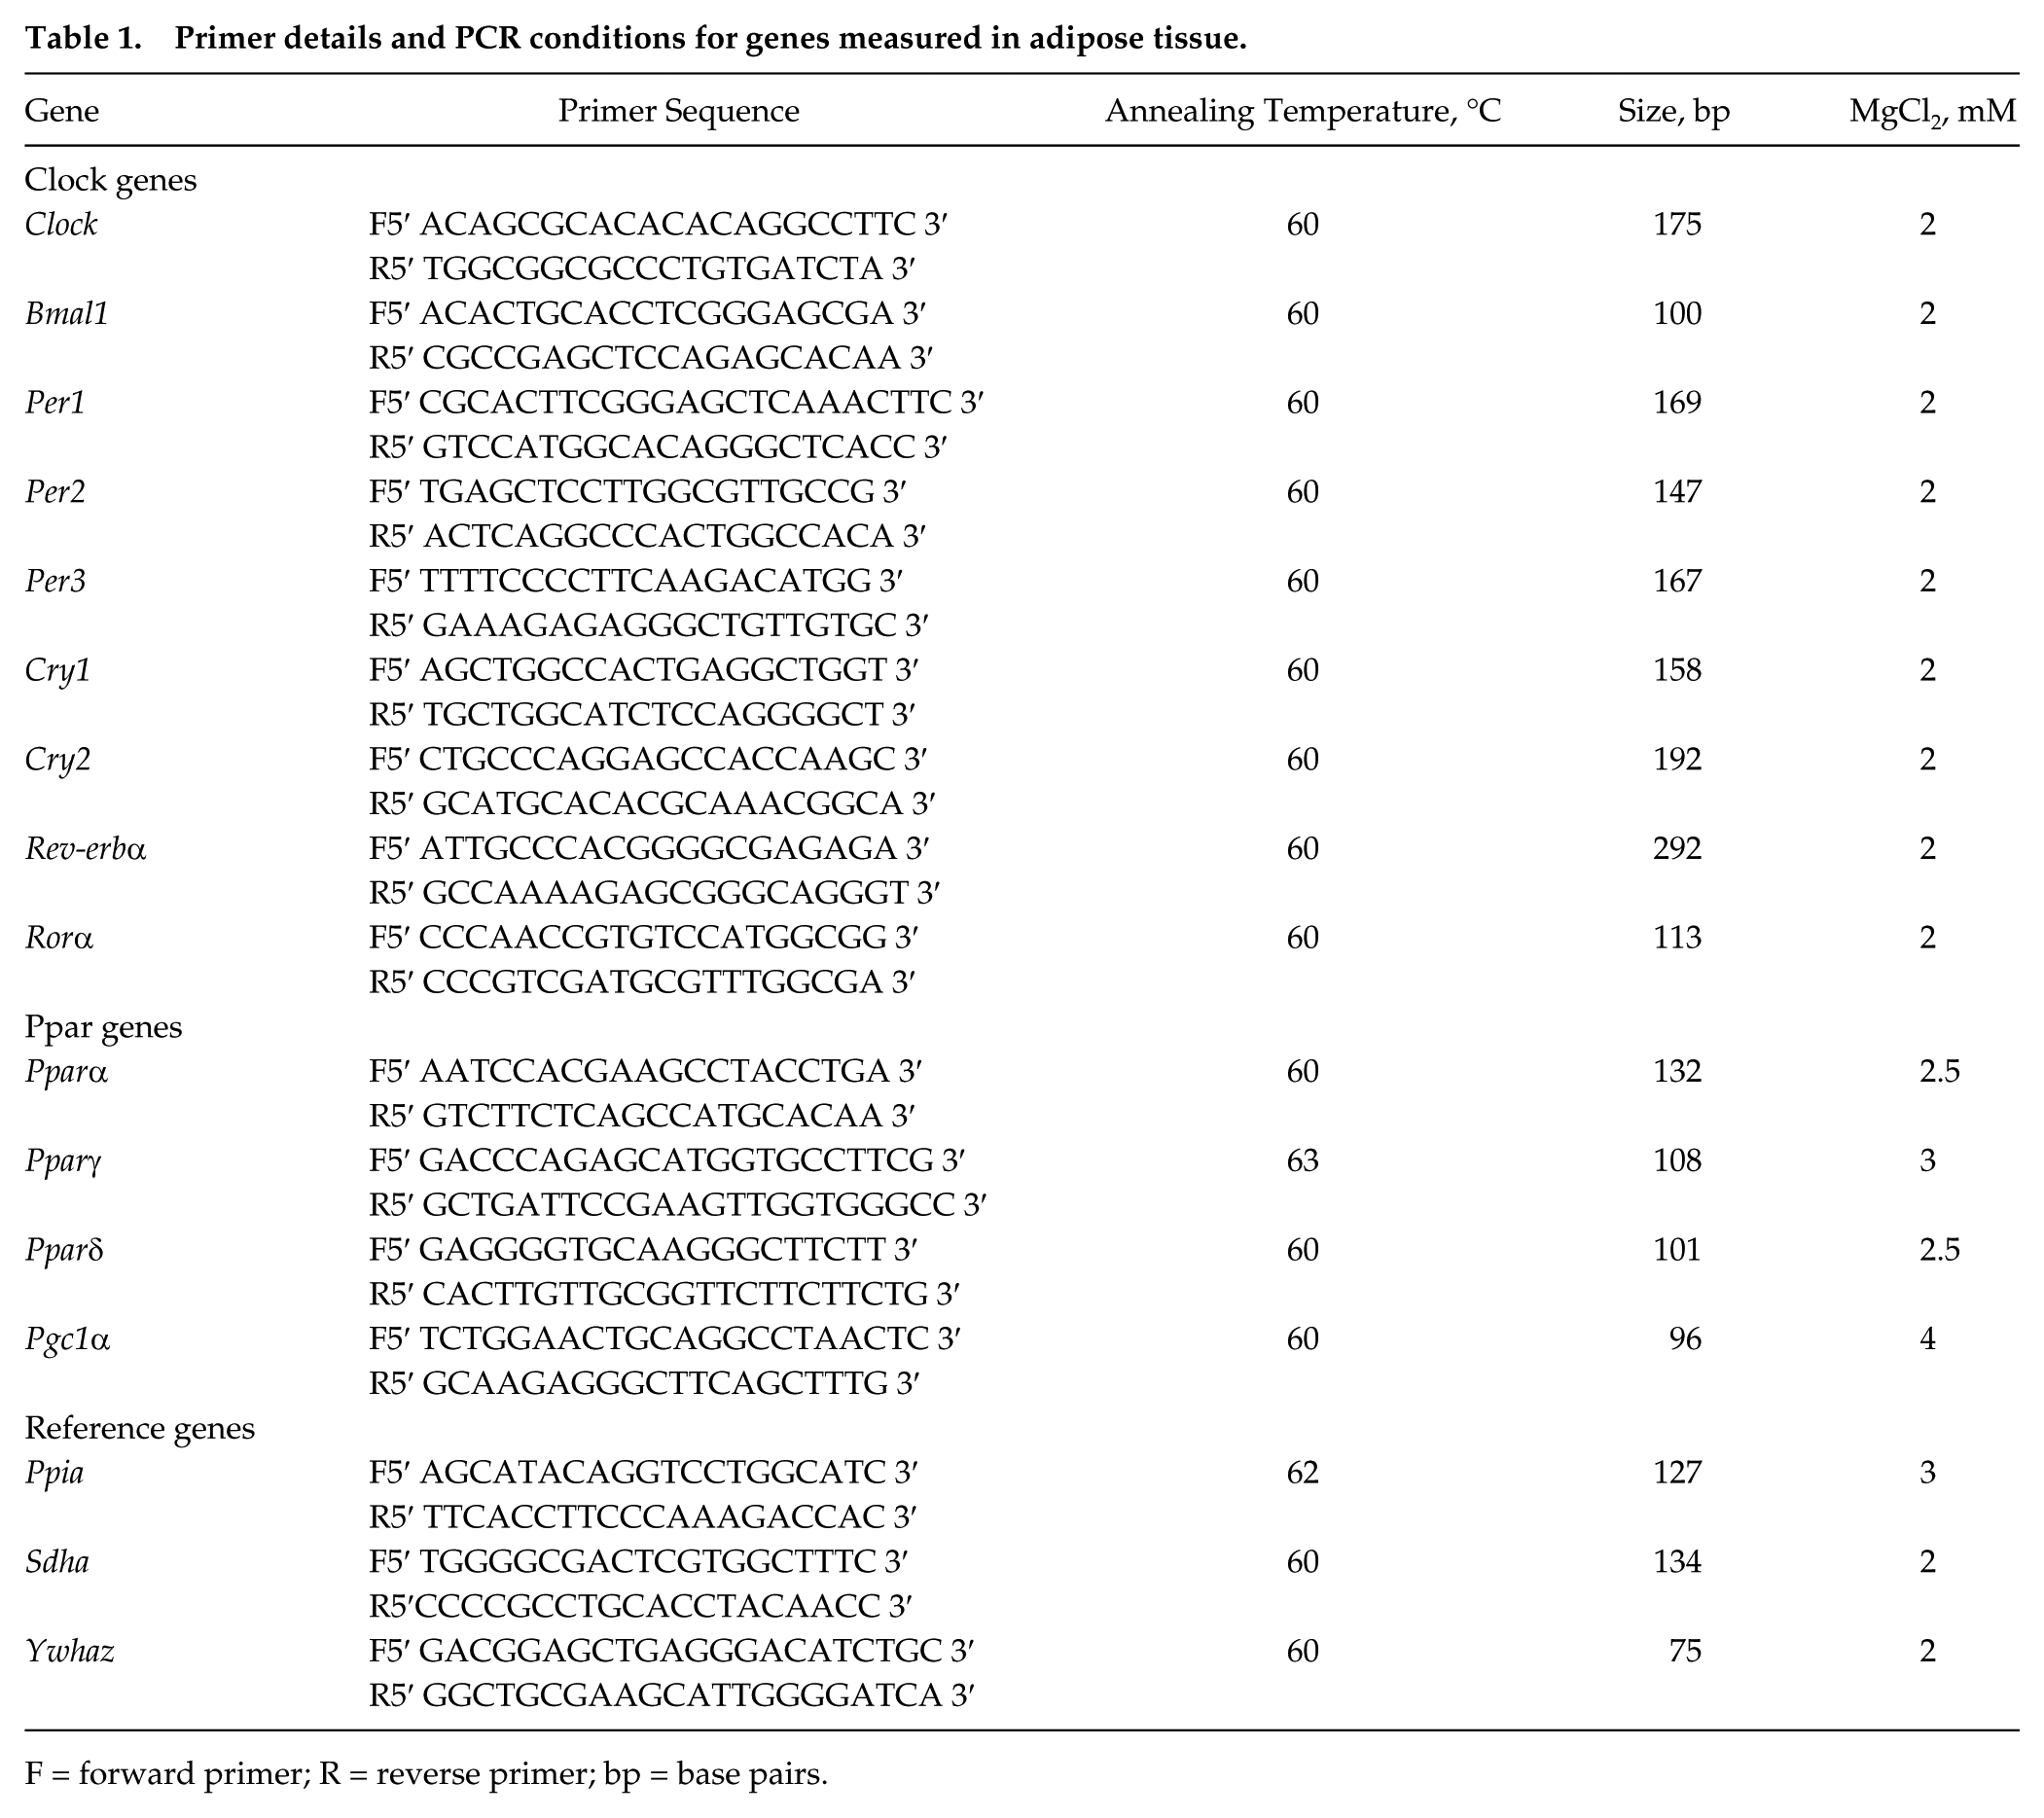
F = forward primer; R = reverse primer; bp = base pairs.
Each PCR reaction consisted of 1 µL of 10× Immolase buffer, 0.2 µL of 10 mM dNTPs, 0.5 µL of SYBR green dye (Molecular Probes, Eugene, OR) at a 1/2000 dilution in DMSO, 0.05 µL of Immolase DNA Polymerase (Bioline, Alexandria, NSW, Australia), and primer-specific concentrations (summarized in Table 1) of MgCl2 and forward and reverse primer. Reactions were then made up to 9 µL with ddH2O, after which 1 µL of cDNA was added to give a total reaction volume of 10 µL. The PCR reaction cycle consisted of an initial denaturing stage at 95 °C for 10 min, followed by 45 cycles each consisting of 95 °C for 1 sec, a primer-specific annealing temperature (see Table 1) for 15 sec, and a 72 °C extension period for 5 sec.
Standard curves were generated from 10-fold serial dilutions of gel-extracted PCR product and used to calculate relative mRNA concentrations with Rotorgene Q series software. All mRNA expression values were standardized against the reference genes Ppia, Sdha, and Ywhaz using the GeNorm algorithm (Vandesompele et al., 2002).
Plasma Leptin Measurement
Leptin was measured in maternal and day 21 female fetal plasma using a Milliplex MAP Rat Adipokine Magnetic Bead Panel (Cat. No. RECYTMAG-65K; EMD Millipore Corporation, Billerica, MA), according to the manufacturer’s instructions. The plate was read on a Luminex Magpix (Luminex Corporation, Austin, TX), and data were analyzed with Magpix 4.2 Software. The intra-assay coefficient of variation was 1.6%.
Statistical Analysis
All values are expressed as the mean ± SEM. Daily gene expression and leptin profiles were assessed for rhythmicity by cosinor regression analysis in Genstat 9.0 software (Hemel Hempstead, UK). This generated the characteristic rhythm features of mesor (the rhythm-adjusted mean), amplitude (the difference between the rhythm peak and the mesor), and acrophase (the time at which the rhythm peak occurs) for each daily profile. This cosine regression analysis uses data from all animals within each group to generate one mean ± SEM value for each parameter (mesor, amplitude, and acrophase) per group (with 4 groups in total: CON d15, n = 45; CAF d15, n = 42; CON d21, n = 44; CAF d21, n = 44). The influence of diet and stage of pregnancy on these features was assessed by 2-way ANOVA and by subsequent t tests if interactions were observed (GraphPad Prism version 6.00, La Jolla, CA). Profiles were considered “rhythmic” when their fit to the cosine function was significant (p < 0.05). When profiles were non-significant, data were assessed by ANOVA using GenStat 9.0 software, with variation apportioned to diet, time of day, and stage of pregnancy. When significant (p < 0.05) interactions were observed, subsequent comparisons were performed by 2-way ANOVA or t test, as appropriate. When the F test reached statistical significance (p < 0.05), specific group comparisons were made by LSD tests.
Results
Maternal caloric intake, weight gain, and body composition data for this cohort of animals have been previously reported (Crew et al., 2016a). Briefly, CAF mothers consumed an average of 73% more calories and exhibited a 25% increase in body weight after 8 weeks of prepregnancy CAF feeding. Analysis of body composition at day 21 of gestation showed a 56% increase in total percentage adiposity in CAF mothers. Individual fetal and placental weights were reduced in the CAF group across both days, but total fetal and placental mass did not differ between diet groups due to slightly increased litter size in the CAF group.
Clock Gene Expression in Maternal Adipose Tissue
The majority of adipose clock gene expression profiles showed significant cosinor rhythmicity in CON mothers (see Table 2), the only exception being Clock at day 15. In contrast, the CAF diet abolished rhythmicity of Cry2, Rorα, and Clock at day 21, but all other genes remained rhythmic (Table 2). Maternal obesity also suppressed overall expression of adipose clock genes; specifically, the CAF diet reduced the mesor of Per1, Per2, and Rev-erbα at day 15 and those of Bmal1, Per2, and Cry1 at day 21 (all p < 0.05) (see Fig. 1 and Table 3). The amplitudes of the Bmal1 and Rev-erbα rhythms were reduced in CAF animals across both days of gestation, while reduced amplitudes were also evident for Per3 at day 15 and Per2 at day 21 (p < 0.05) (Fig. 1, Table 3). The CAF diet delayed the acrophase of the Cry2 and Rorα rhythms at day 15 (p < 0.05) (Fig. 1 and Table 3) and of Bmal1 at day 21 (p < 0.05) (Fig. 1 and Table 3).
Cosine fit (r2 and associated p values) for gene expression profiles in maternal adipose tissue.
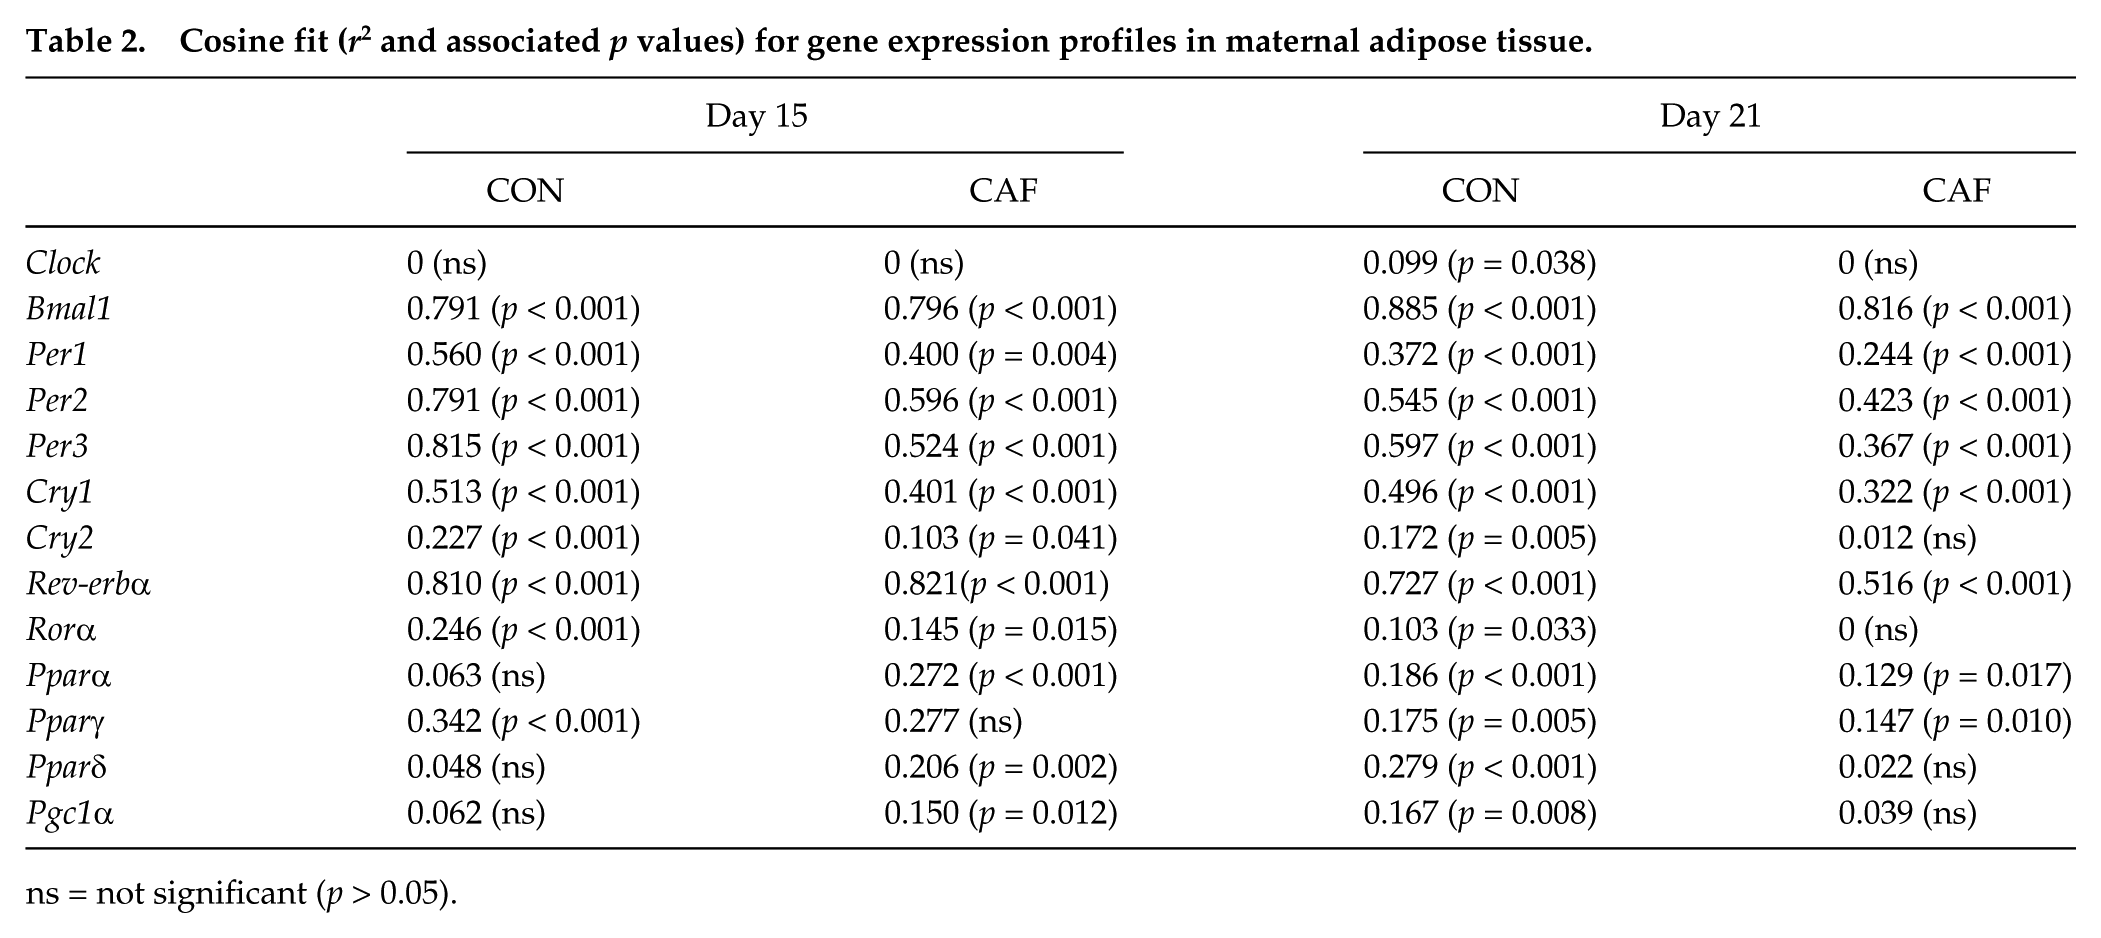
ns = not significant (p > 0.05).
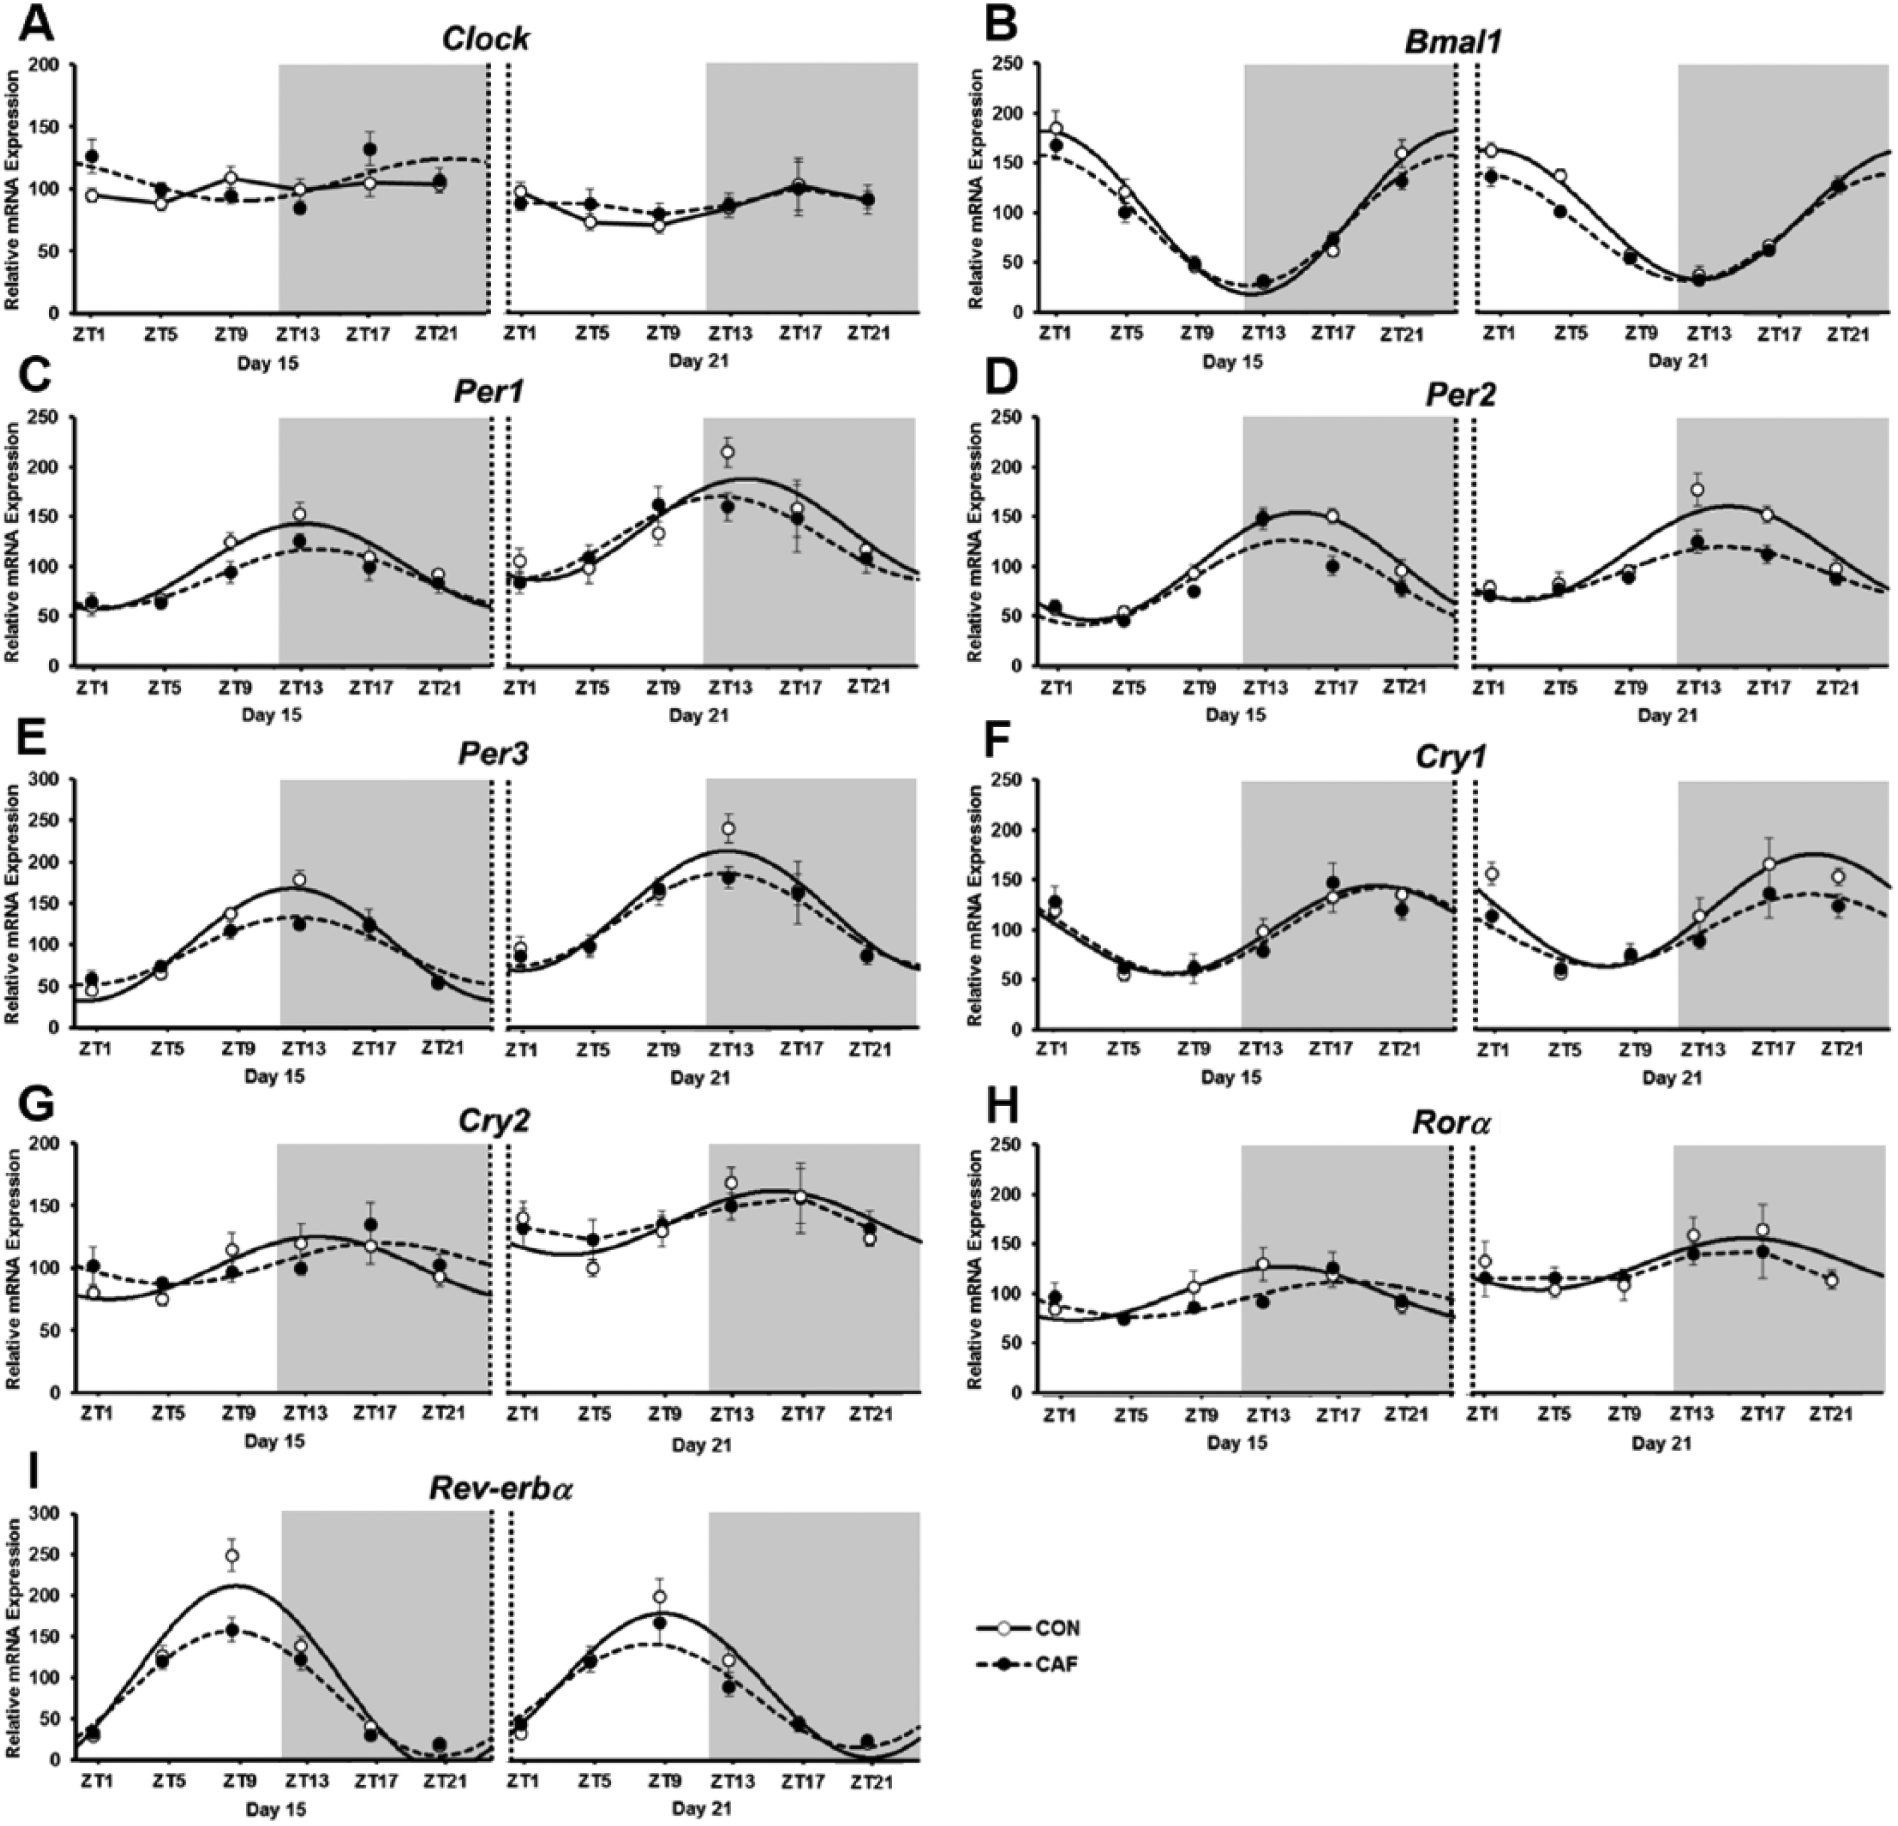
Daily expression profiles of clock genes in maternal adipose tissue of control (CON) and cafeteria (CAF) diet groups at days 15 and 21 of gestation. Shaded areas represent the dark period. Values are the mean ± SEM (n = 7 or 8 per diet group at each ZT). Cosinor curves are shown only for those genes that had significant cosinor rhythmicity. Statistical differences for cosine curve features are summarized in Table 3.
Mesor, amplitude, and acrophase of rhythmic (cosinor) gene expression profiles in maternal adipose tissue.
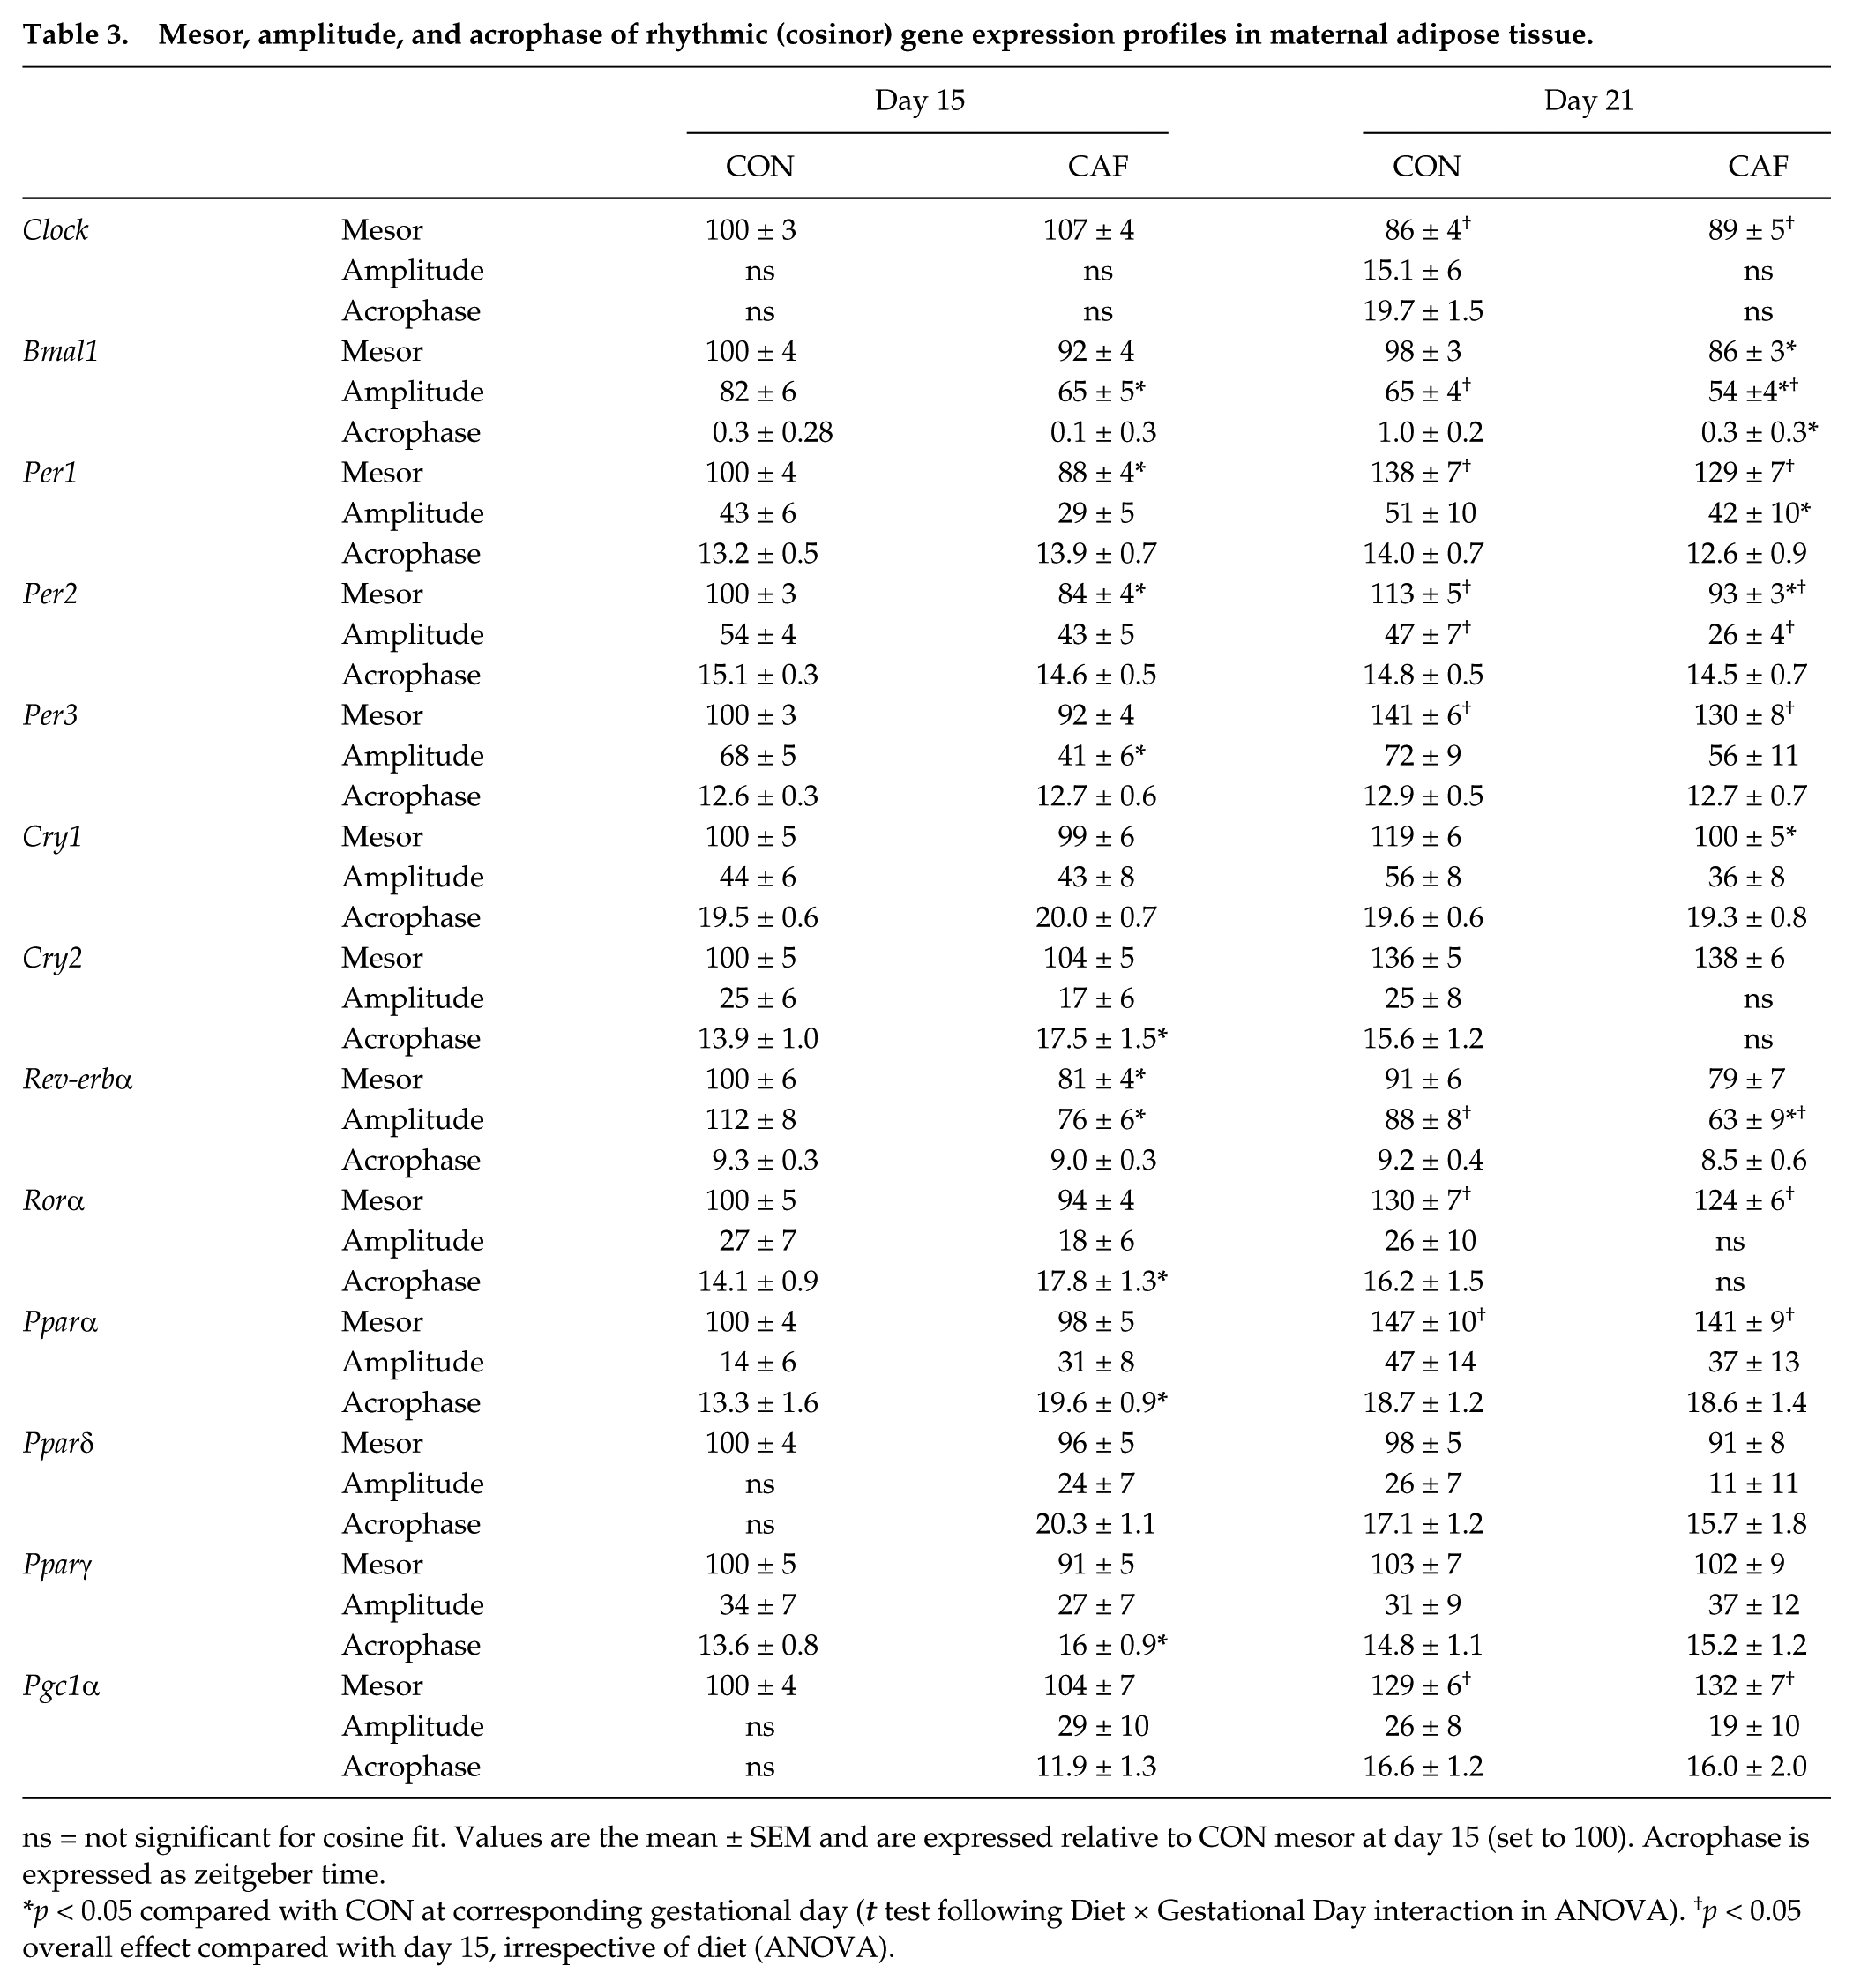
ns = not significant for cosine fit. Values are the mean ± SEM and are expressed relative to CON mesor at day 15 (set to 100). Acrophase is expressed as zeitgeber time.
p < 0.05 compared with CON at corresponding gestational day (t test following Diet × Gestational Day interaction in ANOVA). †p < 0.05 overall effect compared with day 15, irrespective of diet (ANOVA).
The rhythmic features of several clock genes also varied with gestational age; specifically, the mesors of Per1, Per2, Per3, and Rorα increased between days 15 and 21, whereas the Clock mesor was reduced (p < 0.01) (Fig. 1 and Table 3). The amplitude of Bmal1, Per2, and Rev-erbα rhythms fell over this same period (p < 0.001) (Fig. 1 and Table 3), while the acrophase of each clock gene rhythm remained unchanged with advancing gestation.
Rhythmic Expression of PPARs in Adipose Tissue
Because the PPAR nuclear receptors (Pparα, Pparγ, Pparδ) and their co-regulator Pgc1α are linked to both the molecular clock and lipid metabolism (Chen and Yang, 2014), we also investigated the impact of obesity on their expression in adipose tissue. While cosinor analysis showed that adipose expression profiles for Pparα, Pparδ, and Pgc1α were arrhythmic in CON animals at day 15, rhythmicity was induced by the CAF diet for each of these genes (see Table 2 and Fig. 2). Conversely, Pparγ expression was rhythmic in CON mothers at day 15, but this was abolished by the CAF diet. By day 21 of gestation, all Ppar genes were rhythmic in both CON and CAF mothers, with the exception of Pparδ, which was rhythmic only in the CON group (Table 2 and Fig. 2).
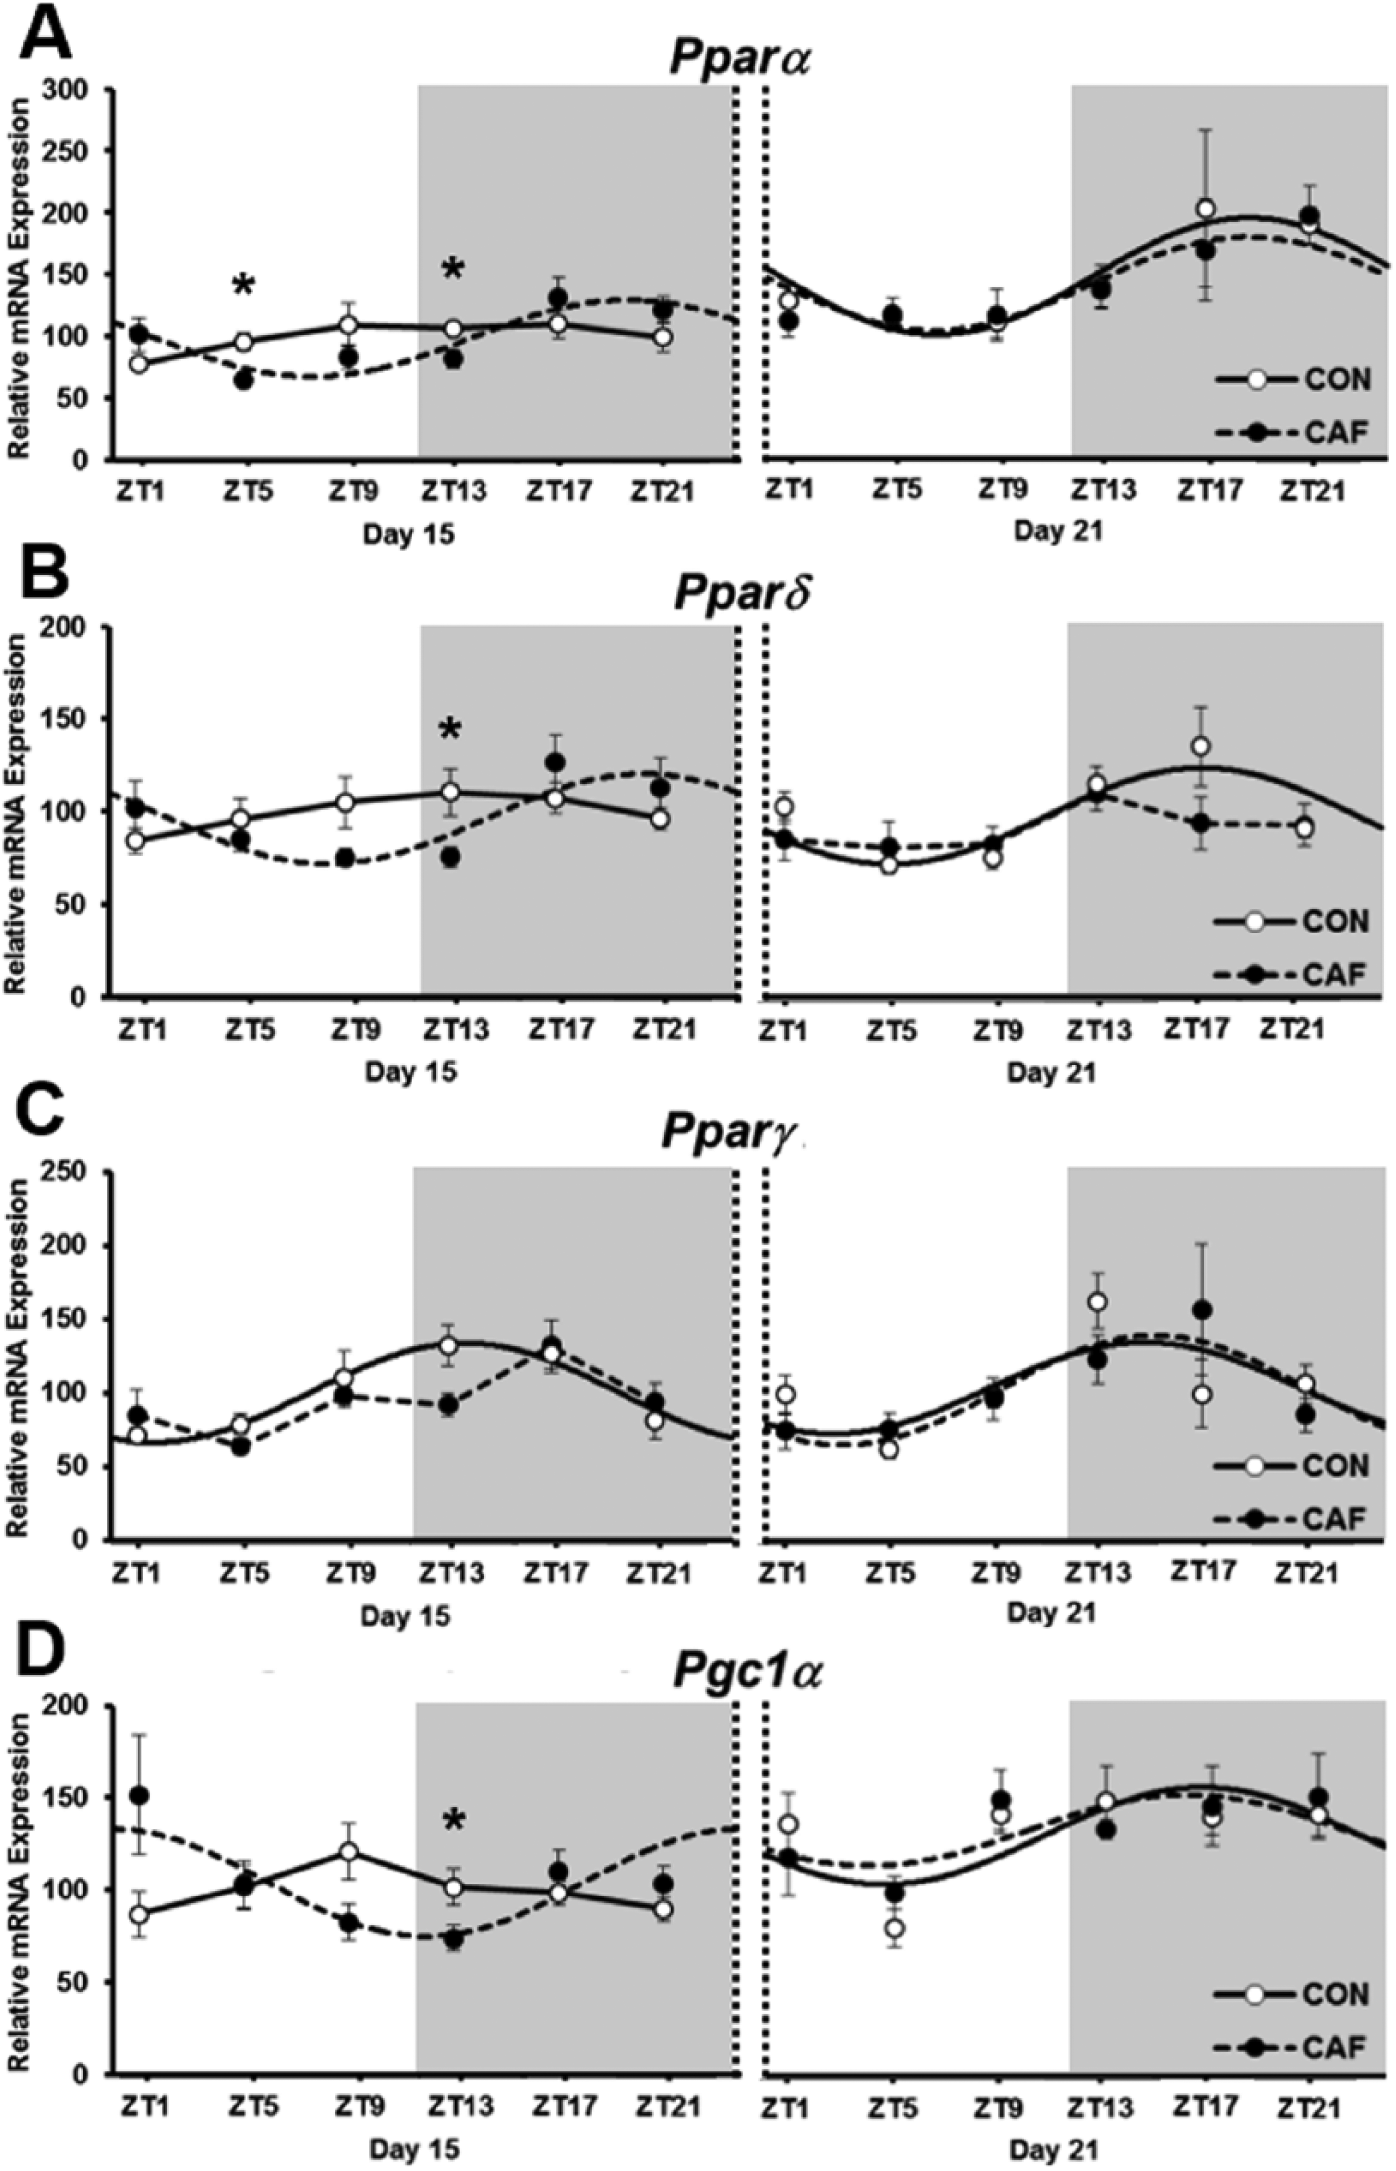
Daily expression profiles of Ppar genes in maternal adipose tissue of control (CON) and cafeteria (CAF) diet groups at days 15 and 21 of gestation. Shaded areas represent the dark period. Values are the mean ± SEM (n = 7 or 8 per diet group at each ZT). *p < 0.05 compared with CON (t test following Diet × Time of Day interaction in 2-way ANOVA). Cosinor curves are shown only for those genes that had significant cosinor rhythmicity. Statistical differences for cosine curve features are summarized in Table 3.
Since most Ppar expression profiles were ar-rhythmic at day 15, these data were also assessed by conventional ANOVA (with diet, time of day, and gestational age as sources of variation). At day 15, there was a significant Diet × Time of Day interaction in the expression of Pparα, Pparδ, and Pgc1α. Specifically, expression of these genes was suppressed in the CAF group at select times of the day, particularly the ZT13 time point (p < 0.05) (Fig. 2). Interestingly, however, this effect did not persist as gestation progressed; by day 21, there were no diet-related differences in Ppar gene expression (Fig. 2). The expression of Pparα and Pgc1α also increased with gestational age (p < 0.05) (Fig. 2) irrespective of maternal diet.
Maternal and Fetal Leptin Profiles
Maternal hyperleptinemia was clearly evident in CAF mothers at both days of gestation (p < 0.001) (Fig. 3), consistent with their increased adiposity (Crew et al., 2016a). Whereas plasma leptin was elevated in CAF mothers at each time point across day 15 (p < 0.001) (Fig. 3), by day 21 there was a significant Diet × Time of Day interaction (p < 0.001). Specifically, leptin levels in late gestation were higher (p < 0.05, t test) in CAF compared with CON mothers at ZT5, ZT13, ZT17, and ZT21 but not at ZT1 or ZT9 (Fig. 3). Interestingly, unlike maternal leptin profiles, fetal leptin showed significant cosinor rhythmicity (r2 = 0.187 [p = 0.004] for CON; r2 = 0.161 [p = 0.007] for CAF), albeit with low amplitude, but the characteristics of these rhythms (mesor, amplitude, and acrophase) were unaffected by diet (Fig. 3).
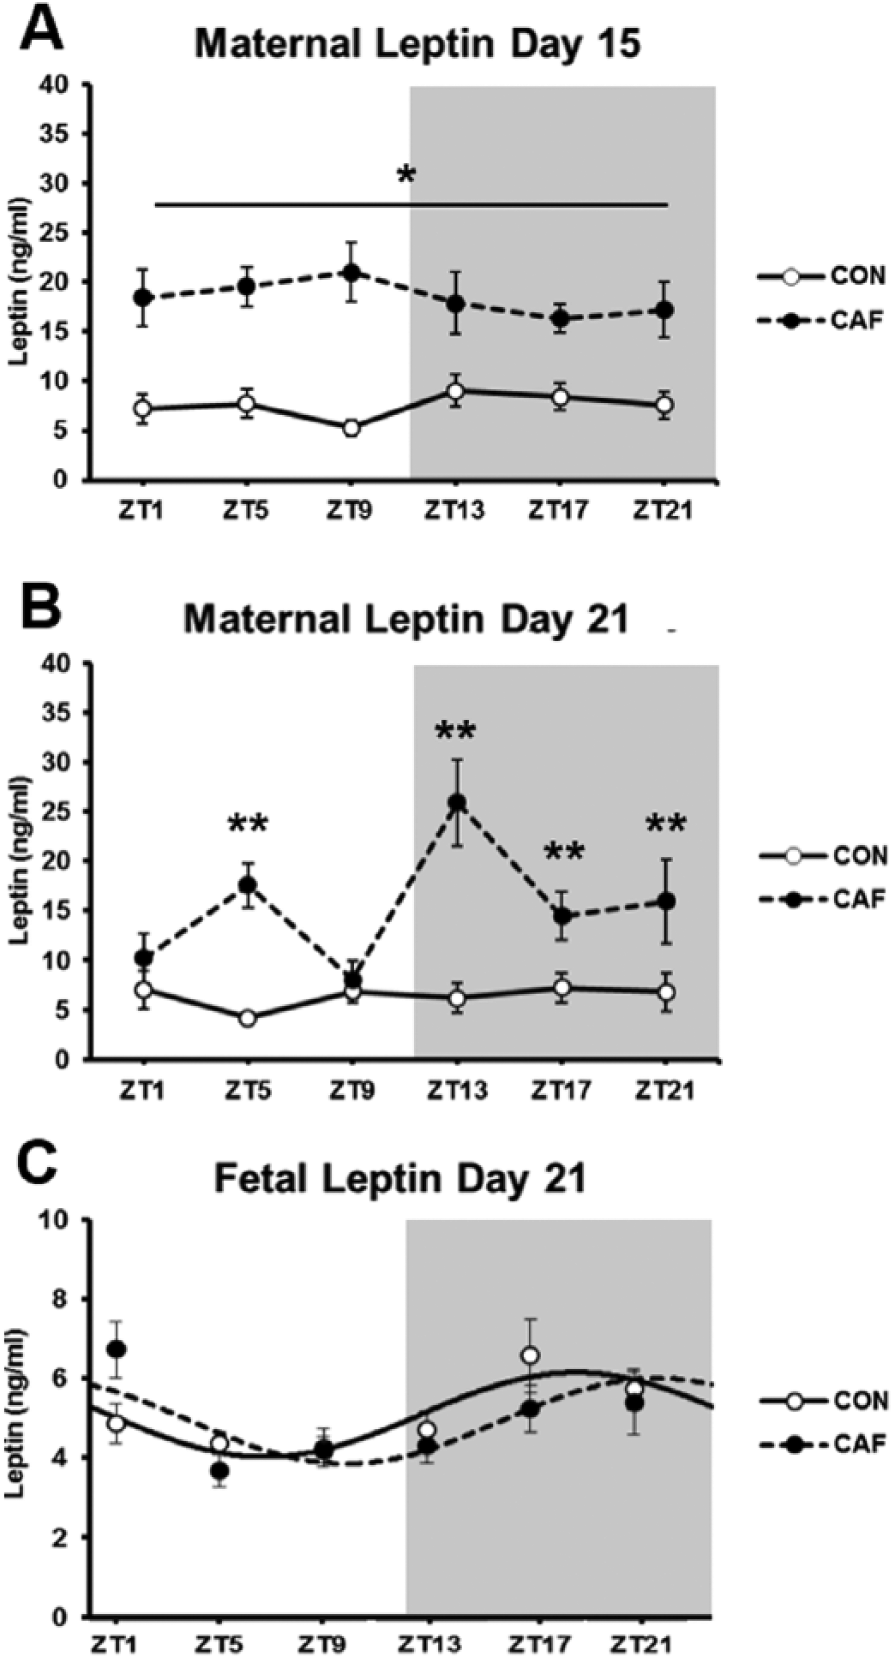
Daily leptin profiles in (A) maternal plasma at day 15, (B) maternal plasma at day 21, and (C) fetal plasma day 21 in control (CON) and cafeteria (CAF) diet groups. Shaded areas represent the dark period. Values are the mean ± SEM (n = 7 or 8 per diet group at each ZT). *p < 0.001 CON vs. CAF (overall diet effect in 2-way ANOVA). **p < 0.05 compared with CON (t test following Diet × Time of Day interaction in 2-way ANOVA).
Discussion
This study has established that obesity disturbs the rhythmic expression of clock genes and Ppars in maternal adipose tissue during rat pregnancy. Obesity reduced the mesor and amplitude of several clock gene rhythms and delayed the acrophase of Cry2, Rorα, and Bmal1. Maternal obesity also reduced adipose expression of the nuclear receptors Pparα, Pparδ, and Pgc1α, although this effect was dependent on gestational age. Maternal plasma leptin levels were elevated in obese mothers but remained arrhythmic regardless of diet. In contrast, while fetal plasma leptin levels were unaffected by obesity, they showed clear time-of-day variation suggestive of circadian changes in either fetal leptin production or transplacental leptin passage.
Our results extend previous observations showing that obesity suppresses adipose tissue clock gene expression in non-pregnant rodents (Kohsaka et al., 2007; Prasai et al., 2013) and humans (Gomez-Abellan et al., 2007). Similarly, adipose tissue clock gene expression is suppressed in genetic obesity models (e.g., the leptin-resistant ob/ob mouse) (Ando et al., 2011; Yamaoka et al., 2014), and interestingly, this suppressive effect in ob/ob mice precedes obesity development, which potentially implicates clock gene disturbances in the onset of the obese phenotype. Moreover, leptin treatment in ob/ob mice largely restores the clock gene profiles (Ando et al., 2011), suggesting that a deficiency in leptin signaling disrupts clock gene expression. Therefore, given that CAF mothers were hyperleptinemic and thus likely to have been leptin resistant (Sáinz et al., 2015), the observed disturbances in clock gene expression may well reflect reduced leptin action in adipose tissue.
The adipose clock genes predominantly affected by CAF diet (Bmal1, Per2, and Rev-erbα) each displayed reduced mesor or amplitude at both stages of gestation. Importantly, these 3 genes are thought to be the most influential in maintaining rhythmic oscillations of central and peripheral clocks. Specifically, Bmal1 displays the most robust rhythmicity among the core clock genes, and in particular its oscillations are far greater than those of Clock, the other primary driver of overall rhythmicity (Dunlap, 1999; Yamamoto et al., 2004). Similarly, among the downstream clock genes, Per2 appears to have the greatest feedback influence on Bmal1 and Clock transcription within the transcriptional-translational loop; indeed, Per3 has relatively little effect on rhythmicity, while Per1 largely functions to moderate Per2 expression through post-transcriptional modifications (Bae et al., 2001; Zheng et al., 2001). The expression of Rev-erbα, which also shows robust rhythmicity, represses Bmal1 transcription, and thus their expression profiles are inversely correlated (Preitner et al., 2002). In this context it is noteworthy that Rev-erbα also plays important roles in regulating lipid metabolism (Duez and Staels, 2008) and adipogenesis (Fontaine et al., 2003; Kumar et al., 2010). Given the fundamental importance of Bmal1, Per2, and Rev-erbα within the adipose tissue clock, the observation that their expression was most affected by maternal obesity increases the likelihood that circadian variation in adipose function is also disrupted in CAF mothers.
Interestingly, while we have previously reported a phase advance of approximately 1.5 h in the hepatic expression of several clock genes and Pparδ in CAF mothers (Crew et al., 2018), these phase changes clearly do not extend to adipose tissue expression in the current study. This indicates that the circadian system exhibits tissue-specific responses to obesity. Since the hepatic clock is highly sensitive to food intake (Oike et al., 2011; Eckel-Mahan et al., 2013), the 1.5 h phase advance in the liver may correspond to altered feeding times in CAF mothers. While food intake patterns were not measured in the current study, CAF food items were changed approximately 1 to 2 h before lights-off; thus, CAF animals are likely to have commenced eating slightly earlier given the novelty of the offered items. The lack of a corresponding phase advance in maternal adipose tissue suggests that adipose tissue clocks do not exhibit such an immediate response to food intake cues but may be more responsive to other obesity-related factors, such as altered leptin levels. As such, it is likely that both dietary and adiposity-related parameters contribute to the circadian dysfunction observed in obese individuals.
Maternal obesity reduced adipose expression of Pparα, Pparδ, and Pgc1α at day 15 of pregnancy, but this effect was no longer evident at day 21. Suppression of all 3 PPAR isoforms in adipose tissue of obese pregnant women at term has been reported (Lappas, 2014), but our data are the first to show the comprehensive rhythmic expression profiles of these nuclear receptors in obese pregnancy. Previously, non-pregnant rodents fed a high-fat diet have been shown to lose daily rhythmicity in adipose Pparγ expression (Kohsaka et al., 2007), similar to our observations at day 15 of pregnancy. Interestingly, however, this CAF-induced loss of rhythmicity in Pparγ was no longer evident at day 21, possibly related to the major shifts in sex steroid profiles during late gestation. Indeed, previous studies suggest that normal clock gene profiles (Wharfe et al., 2016a) and their response to a high-fat diet (Yanagihara et al., 2006) are influenced by sex steroids. In any event, obesity-induced changes in adipose PPARs may be central to the function of the adipose tissue clock given their dual roles in regulating lipid metabolism and clock genes (Chen and Yang, 2014). Specifically, these nuclear receptors exhibit rhythmic expression profiles in metabolic tissues (Yang et al., 2006), and Pparα, Pparγ, and Pgc1α all regulate Bmal1 and Rev-erbα transcription (Fontaine et al., 2003; Canaple et al., 2006; Liu et al., 2007). Interestingly, our results indicate that the obesity-induced suppression of the Ppar genes was most consistently observed at ZT13, possibly related to the proximity of this sampling time to provision of novel food items to CAF mothers. This further suggests that consumption of the CAF items could have an immediate effect on adipose tissue lipid metabolism mediated via Ppar gene expression changes. Because hyperlipidemia in the CAF mothers was evident only during the nocturnal period (Crew et al., 2016a), the adipose clock gene disruptions observed in the current study further implicate the circadian clock in the regulation of these metabolic disturbances.
The apparent correction of obesity-induced disturbances in adipose Ppar gene profiles between days 15 and 21 is consistent with recent human (Straughen et al., 2013; Forbes et al., 2015) and animal (King et al., 2013; Pedroni et al., 2014) studies showing that disturbances in the maternal metabolic phenotype are less severe late in obese pregnancy. For example, Forbes et al. (2015) demonstrated that insulin resistance and elevated triglyceride levels are evident during the first half of pregnancy in obese women but not near term. Similarly, while the inflammatory status of obese women (Friis et al., 2013) and mice (Ingvorsen et al., 2014; Pedroni et al., 2014) is elevated early in gestation, this effect is no longer evident at term.
Maternal leptin profiles were arrhythmic in both diet groups, but absolute levels were elevated in obese mothers at each gestational age. While it is well-recognized that obese pregnant women are hyperleptinemic (Misra and Trudeau, 2011; Briffa et al., 2015), the present study is the first to report circadian profiles of maternal leptin in obese pregnancy. Leptin normally exhibits a rhythmic daily secretion pattern in the nonpregnant state, peaking nocturnally in both humans (Saad et al., 1998; Yildiz et al., 2004) and rodents (Kalsbeek et al., 2001; Ando et al., 2005; Cano et al., 2009). Previous studies on leptin rhythmicity in human obesity are inconsistent; one study reported maintenance of rhythmicity and an elevated peak in obese males (Yildiz et al., 2004), whereas another showed that obesity increased overall leptin levels but abolished rhythmicity (Saad et al., 1998). Similarly, leptin rhythmicity was lost in rats after high-fat feeding (Cano et al., 2009). Interestingly, despite the absence of a cosinor leptin rhythm in our study, maternal leptin exhibited marked time of day variation across day 21 in CAF mothers, such that they were only hyperleptinemic at select time points. In this context it is noteworthy that the central (hypothalamic) circadian clock regulates leptin rhythmicity independently of food intake and that chronodisruption disturbs rhythmic leptin profiles (Kalsbeek et al., 2001; Varcoe et al., 2013; Kettner et al., 2015); as such, our data suggest that obesity may disturb the central circadian regulation of leptin function in pregnancy.
In contrast to the observed maternal hyperleptinemia in the CAF group, fetal leptin levels were unaffected. Fetal leptin is largely maternally derived in rodents, and both placental leptin receptor expression and transplacental leptin passage increase markedly over late gestation in rats (Smith and Waddell, 2003) in association with increased labyrinth zone expression of Lepra, the truncated form of the leptin receptor involved in leptin transport (Smith and Waddell, 2002). Moreover, both placental leptin transport and expression of the leptin receptor (Leprb) are reduced by glucocorticoid treatment (Smith and Waddell, 2003), suggesting that insults during pregnancy may alter fetal leptin levels via effects on placental transport mechanisms. Accordingly, Farley et al. (2010) reported that placental leptin receptor expression was reduced in obese human pregnancy and that maternal hyperleptinemia was not accompanied by fetal hyperleptinemia. Potentially, lower placental leptin receptor expression could compromise placental amino acid transport, since leptin is known to increase System A amino acid transporter activity in cultured human placental tissue (Jansson et al., 2003; von Versen-Höynck et al., 2009). Indeed, decreased placental amino acid transport has been observed in high-fat-fed mice (Lager et al., 2014), which could contribute to the fetal growth restriction that occurs in subsets of obese pregnancies (Gardosi and Francis, 2009; Radulescu et al., 2013). We have previously reported CAF-induced fetal growth restriction in this model (Crew et al., 2016a; Crew et al., 2016b), so it would be of interest to explore whether placental nutrient transfer capacity is limited in CAF mothers and whether this is linked to reduced leptin action in the placenta.
Unlike maternal leptin profiles, fetal leptin exhibited significant cosinor rhythmicity irrespective of diet. This rhythmic profile of fetal leptin has not previously been documented and indeed is somewhat surprising given the absence of comparable variation in the mother. Given the mostly maternal origin of fetal leptin in rodents (Smith and Waddell, 2003), the rhythmic profiles of fetal leptin may reflect circadian variation in its transplacental passage. Moreover, despite the increased capacity for placental transport of leptin near term (described above), the presence of maternal, but not fetal, hyperleptinemia in obese pregnancy suggests that the placenta still limits leptin transfer to the fetus.
In conclusion, our data show that obesity disrupts adipose expression of clock and Ppar genes during the final third of rat pregnancy. Maternal leptin profiles were increased by obesity but remained arrhythmic, whereas fetal leptin profiles showed cosinor rhythmicity but were unaffected by obesity. We propose that disruption of the adipose tissue clock by diet-induced obesity may adversely affect the maternal metabolic adaptation to pregnancy and thereby compromise fetal growth and development.
Footnotes
Acknowledgements
The authors acknowledge Dr. Hugh Barrett and Dr. Linc Schmitt (The University of Western Australia) for statistical advice regarding cosinor analysis.
Conflict of Interest Statement
The author(s) have no potential conflicts of interest with respect to the research, authorship, and/or publication of this article.