
Abstract
The molecular circadian clock is a self-regulating transcription/translation cycle of positive (Bmal1, Clock/Npas2) and negative (Per1,2,3, Cry1,2) regulatory components. While the molecular clock has been well characterized in the body’s master circadian pacemaker, the hypothalamic suprachiasmatic nucleus (SCN), only a few studies have examined both the positive and negative clock components in extra-SCN brain tissue. Furthermore, there has yet to be a direct comparison of male and female clock gene expression in the brain. This comparison is warranted, as there are sex differences in circadian functioning and disorders associated with disrupted clock gene expression. This study examined basal clock gene expression (Per1, Per2, Bmal1 mRNA) in the SCN, prefrontal cortex (PFC), rostral agranular insula, hypothalamic paraventricular nucleus (PVN), amygdala, and hippocampus of male and female rats at 4-h intervals throughout a 12:12 h light:dark cycle. There was a significant rhythm of Per1, Per2, and Bmal1 in the SCN, PFC, insula, PVN, subregions of the hippocampus, and amygdala with a 24-h period, suggesting the importance of an oscillating molecular clock in extra-SCN brain regions. There were 3 distinct clock gene expression profiles across the brain regions, indicative of diversity among brain clocks. Although, generally, the clock gene expression profiles were similar between male and female rats, there were some sex differences in the robustness of clock gene expression (e.g., females had fewer robust rhythms in the medial PFC, more robust rhythms in the hippocampus, and a greater mesor in the medial amygdala). Furthermore, females with a regular estrous cycle had attenuated aggregate rhythms in clock gene expression in the PFC compared with noncycling females. This suggests that gonadal hormones may modulate the expression of the molecular clock.
Keywords
The existence and characteristics of intrinsic molecular circadian clocks in brain regions outside of the body’s master circadian pacemaker, the suprachiasmatic nucleus (SCN) of the hypothalamus (SCN), require further exploration, as these intrinsic clocks, if operational, may contribute to the normal functioning of these extra-SCN brain regions. Furthermore, there are sex differences in circadian rhythms (Bailey and Silver, 2014), yet there has been virtually no direct comparison of basal clock gene expression at the mRNA level in the brains of male and female subjects. The approximately 24-h rhythmic expression of clock genes in the SCN comprises a molecular clock that is necessary for the expression of circadian rhythms throughout the body (Reppert and Weaver, 2002; Takahashi et al., 2008). This molecular clock consists of counterregulatory and oscillatory transcription/translation interactions between positive (Bmal1, Clock, or Npas2) and negative (Per1, Per2, Per3, Cry1, Cry2) clock gene encoded transcription regulators (Darlington et al., 1998; Dunlap, 1999; Gekakis, 1998; Reppert & Weaver, 2002). Expression of both the positive and negative clock gene components is thought to comprise a functional molecular clock, as genetic knockdown of either the positive or negative components results in behavioral arrhythmicity in rodents (Bae et al., 2001; Bunger et al., 2000).
The SCN exhibits rhythmic expression of Bmal1, Per1, Per2, Cry1, and Cry2 mRNA with a genetically determined period that approximates 24 h (Bae et al., 2001). These genes have been found to be rhythmically expressed in many other mammalian brain and peripheral tissues, raising the prospect that extra-SCN clock gene expression may directly contribute to neural function throughout the brain (Abe et al., 2002; Sakamoto et al., 1998). In rodents, rhythmic clock gene expression has been found in a variety of peripheral tissues, and their rhythmic expression contributes to the optimal functioning of these tissues (Balsalobre, 2000; Hastings et al., 2007; Marcheva et al., 2013; T. Yamamoto et al., 2004; Yamazaki et al., 2000). Rhythmic clock gene expression has also been observed in some extra-SCN brain regions (Amir et al., 2004; Ángeles-Castellanos et al., 2007; Feillet et al., 2008; Girotti et al., 2009; Guilding & Piggins, 2007; Harbour et al., 2013, 2014; Lamont et al., 2005; Masubuchi et al., 2000; Perrin et al., 2006; Rath et al., 2013, 2014; Reick, 2001; Yamamoto et al., 2004; but see Abe et al., 2002). Most reports of clock gene expression in the brain have provided limited insight into the nature of extra-SCN clocks because those reports focused on only one or a few clock genes and brain regions (Guilding and Piggins, 2007). Only more recently have both the positive (Bmal1) and negative (Per1/Per2) components of the molecular clock been well examined within a few extra-SCN brain regions (paraventricular nucleus [PVN], central amygdala, hippocampus, neocortex, and cerebellum; Girotti et al., 2009; Harbour et al., 2014; Jilg et al., 2010; Rath et al., 2013). Thus, it is not possible to discern from the extant literature whether there is evidence for oscillatory expression of positive and negative regulatory clock components within most brain regions, whether intrinsic clock gene expression is ubiquitous throughout the brain, and whether the expression rhythms (phase relationships and amplitude) are similar across brain regions.
Normal clock gene expression has been implicated in overall mental health (Bunney et al., 2015; Bunney & Bunney, 2000; Etain et al., 2011; Johansson et al., 2002; Lamont et al., 2009; Li et al., 2013; McCarthy & Welsh, 2012; McClung, 2007; Partonen et al., 2007). In mice, mutation or knockdown of Clock or Per1/Per2 are associated with manic-like behavior and increased anxiety (Dzirasa et al., 2011; Mukherjee et al., 2010; Spencer et al., 2012). The prevalence of mood disorders associated with clock gene disruption (e.g., depression, anxiety, and posttraumatic stress disorder) is greater in women compared with men. There also appears to be a role for gonadal hormones in circadian function (Bailey and Silver, 2014; Morin, 1980; Thomas and Armstrong, 1989) and clock gene expression in female rodents (He et al., 2007; Nakamura et al., 2001, 2005, 2010; Perrin et al., 2006; Smith et al., 2010). However, there has yet to be a study to directly compare in males and females the expression of positive and negative clock genes.
Consequently, the objective of our first experiment was to examine in male and female rats clock gene expression of both the positive (Bmal1) and negative (Per1, Per2) components of the molecular clock in brain regions important in the regulation of emotion, mood, and stress responsivity (prefrontal cortex [PFC], rostral agranular insula, amygdala, and hippocampus). In a follow-up experiment, we examined whether clock gene expression profiles varied in female rats depending on their estrous cycle parameters (presence or absence of cyclicity). For comparison purposes, we also examined clock gene mRNA expression in the SCN and PVN, brain regions we previously demonstrated have robust rhythmic expression of each of these clock genes (Girotti et al., 2009). The dysfunction of the medial PFC (mPFC), hippocampus, and amygdala is implicated in the same mood and anxiety disorders associated with disrupted clock gene expression (Adhikari, 2014; Del Casale et al., 2013; Drevets et al., 2008; Koenigs and Grafman, 2009; Mayberg et al., 2005). The mPFC, amygdala, and hippocampus are also critical components of fear conditioning and extinction of fear conditioning, both of which exhibit diurnal fluctuations in behavioral expression (Chaudhury and Colwell, 2002; Eckel-Mahan et al., 2008; Smarr et al., 2014; Valentinuzzi et al., 2001; Woodruff et al., 2015). Characterization of basal clock gene expression in these brain regions may contribute to a better understanding of circadian function in mental health.
Materials and Methods
Animals
Sprague Dawley rats (Harlan, Indianapolis, IN), aged approximately 2.5 mo, were used in both experiments. Rats were allowed 2 wk to acclimate to the facility, cage mates, and light:dark cycle. Half of the rats were maintained on a normal 12:12 h light:dark cycle (lights-on at 0500 h or 0530 h), and the other half were maintained on a reverse 12:12 h light:dark cycle (lights-on at 1700 h or 1730 h). Rats were divided evenly between 4 individual rooms that were temperature and humidity controlled. Rats were pair housed and had free access to food and water. Procedures for the ethical treatment of the animals were conducted in accordance to the guidelines found within the Guide for the Care and Use of Laboratory Animals (DHHS Publication No. [NIH] 80-23, revised 2010 eighth edition) and were approved by the University of Colorado’s Institutional Animal Care and Use Committee.
Experiment 1: Basal Clock Gene Expression throughout the Brain of Male and Female Rats
To assess basal clock gene expression, 2 cohorts of rats were used, with sex counterbalanced across cohorts (total of 48 males and 49 females; 8–9 rats of each sex at each time point). Females and males were age-matched and housed in separate rooms. Female estrous cycle was not tracked for this first experiment. Thus, all female data from this experiment were pooled and compiled regardless of estrous cycle stage.
Experiment 2: Basal Clock Gene Expression throughout the Brain of Normally Cycling versus Noncycling Female Rats
Seventy-four female rats were used (12–13 rats at each time point). Estrous cycle phase was assessed by daily vaginal lavage for 2 wk. The rats on the reverse light:dark schedule were lavaged daily at zeitgeber time 1 (ZT1; ZT refers to the number of hours after the light phase onset), and the rats on the normal light:dark schedule were lavaged daily at ZT8. Lavages began 2 d after arrival and after the light:dark schedule was set. For lavage, a blunt tip glass eye dropper filled with ~0.5 mL of sterile saline was inserted into the vagina. The saline was expelled into the vagina 2 to 3 times before being taken back up by the eye dropper in order to gently wash off vaginal cells. A drop of the sample was placed on a microscope slide and immediately examined under 40× light microscopy to assess estrous cycle stage. Rats were considered cyclers if they had at least 3 different estrous cycle stages within the past 5 d before sacrifice (Goldman et al., 2007; Marcondes et al., 2002).
Tissue Collection
For both experiments, rats were removed from their home cage and immediately decapitated at 6 evenly spaced times across the 24-h day (ZT0, 4, 8, 12, 16, 20). Procedures were performed under red light conditions for rats killed during the dark phase (ZT12, 16, 20). Trunk blood was collected into EDTA-coated tubes and centrifuged at 4000 rpms for 10 min at 4 °C. Plasma was then aliquoted and stored at −70 °C until subsequent use. Brains were extracted and flash frozen in −25 ± 5 °C isopentane chilled with dry ice. Brains were then cut (12-µm-thick coronal sections) with a cryostat (Leica CM 1850) at the level of the mPFC (Bregma ~2.2 to 3.2 mm anterior to Bregma), SCN (Bregma ~1.3 to 1.4 mm posterior to Bregma), PVN (Bregma ~1.8 to 1.88 mm posterior to Bregma), and hippocampus/amygdala (Bregma ~2.5 to 2.8 mm posterior to Bregma) according to Paxinos and Watson (fourth edition, 1998). Brain slices were thaw mounted onto Colorfrost Plus microscope slides and stored at −70 °C until subsequent use.
Corticosterone (CORT) Hormone Assays
Plasma samples were assayed in duplicate using an enzyme-linked immunosorbent assay kit according to the manufacturer’s instructions (cat No. ADI-901-097, Enzo Life Sciences, Plymouth Meeting, PA, or cat No. K014-H1, Arbor Assays, Ann Arbor, MI). Sensitivity for CORT was 18.6 pg/mL (Enzo Life Sciences) or 27.0 pg/mL (Arbor Assays) according to the manufacturer. Plasma was diluted 1:50 in assay buffer and heat inactivated for 60 min at 65 °C to denature corticosteroid-binding globulin. The intra-assay coefficient of variation averaged 8.9%, and the interassay coefficient of variation was 12.8%.
In Situ Hybridization
In situ hybridization for Per1, Per2, and Bmal1 mRNA was performed as previously described (Ginsberg et al., 2003; Girotti et al., 2009) with slight modifications as follows. Hybridization was performed in a 50% formamide humidified atmosphere at 54 °C for 16 to 18 h. Slides were then treated with RNase A (cat No. R5503; Sigma, St. Louis, MO) at 37 °C for 1 h, washed in decreasing concentrations of standard saline citrate solution (SSC), incubated in 0.1X SSC at 65 °C for 1 h, then dehydrated through a series of ethanol washes. Dried slides were then exposed to x-ray film for 2 to 4 wk, after which films were digitized by use of Northern Light lightbox model B95 (Imaging Res Inc., St. Catharines, Ontario, Canada) and a Sony CCD video camera model XC-ST70 fitted with a Navitar 7000 zoom lens (Rochester, NY) connected to an LG3-01 frame grabber (Scion Corp., Frederick, MD) inside a Dell Dimension 500, and captured with Scion Image beta rel. 4.0.2.
Densitometry
Digitized brain images were analyzed using ImageJ64 (NIH) to quantify the mean optical density (OD) of regions of interest (ROIs). ROIs were hand drawn using visible anatomical landmarks with aid of the Paxinos and Watson Brain Atlas (1998). An experimenter blind to the treatment group assignments generated ROIs for both hemispheres. PFC and rostral agranular insula (insula) measures were based on 6 coronal slices per brain, and all other measures were based on 4 coronal slices per brain. The mean gray values of all ROIs were converted into uncalibrated ODs using ImageJ (NIH). Densitometry was performed on films in which the gray-level signal fell within the linear range of the gray level to OD relationship. These ODs were then averaged to get the mean OD for each animal. The mean OD for each rat was normalized by converting the mean OD values to a percentage of mean value for the male ZT0 group in experiment 1 or a percentage of the mean value for the overall ZT0 group for experiment 2.
Statistical Analysis
Data were analyzed by 2-way analysis of variance (ANOVA) in order to assess clock gene variation across time of day and sex in experiment 1 or clock gene variation across time of day and estrous cyclicity in experiment 2. Rats in experiment 2 were divided into noncyclers or cyclers, rather than stage of estrous cycle, to increase power of analysis due to a limited number of subjects in each estrous stage at each ZT. For significant main effects or interactions, Fischer’s least significant difference (FLSD) post hoc test was used to assess significant sex or cyclicity differences at a specific time of day. p values <.05 were considered to indicate significant differences between groups. The Statistical Package for Social Sciences (SPSS, Mac version 21, 2012) was used for ANOVA and post hoc analysis. For most clock gene measures in most brain regions, there was minimal, but occasional, missing data due to the absence within that assay of tissue sections for a particular brain that included the appropriate ROI. Those missing data are reflected in the small variations in denominator degrees of freedom for the ANOVA analyses. Because of technical difficulties, there were not enough tissue sections to measure Per2 gene expression for the first cohort of rats in experiment 1 at the level of the SCN. Consequently, that measure is based on group sizes of 4 to 5 rats. All line graphs showing relative clock gene expression over the course of the day have double-plotted ZT0/ZT24 data for aid in visualization of the underlying rhythm.
Data with a significant time of day effect were further analyzed using the least-squares rhythmometry method with ChronoLab 3.0.3 (Mojón et al., 1992) and separated out by male or female (experiment 1) and by cycling versus noncycling (experiment 2). Data were tested for fit to a cosine curve constrained to a 24-h period and considered to have a significant 24-h period if the p value was <0.05. In cases in which there was a significant 24-h period, estimates of amplitude and acrophase, along with their corresponding 95% confidence intervals (CIs), were generated. Amplitude refers to the distance from the mesor (rhythm-adjusted mean) to the peak of the rhythm and is reported in units of normalized percentage OD values in each experiment. Acrophase, the phase angle at which the peak of the fitted curve falls, was converted to ZT time.
Results
Experiment 1: Basal Clock Gene Expression throughout the Brain of Male and Female Rats
CORT Hormone Levels
There was a robust diurnal rhythm of basal CORT levels, with an acrophase centered on the onset of the dark phase (male acrophase = 12.7 ± 0.9, 95% CI; female acrophase = 13.8 ± 1.5, 95% CI; Suppl. Fig. 1). Two-way ANOVA found significant main effects of ZT and sex. Post hoc tests (FLSD) revealed that females had greater levels of CORT compared with males at ZT8–20 (i.e., during all times except the diurnal nadir; Table 1; Suppl. Fig. 1).
Experiment 1: Statistical analysis of basal Per1, Per2, and Bmal1 mRNA throughout the brain.
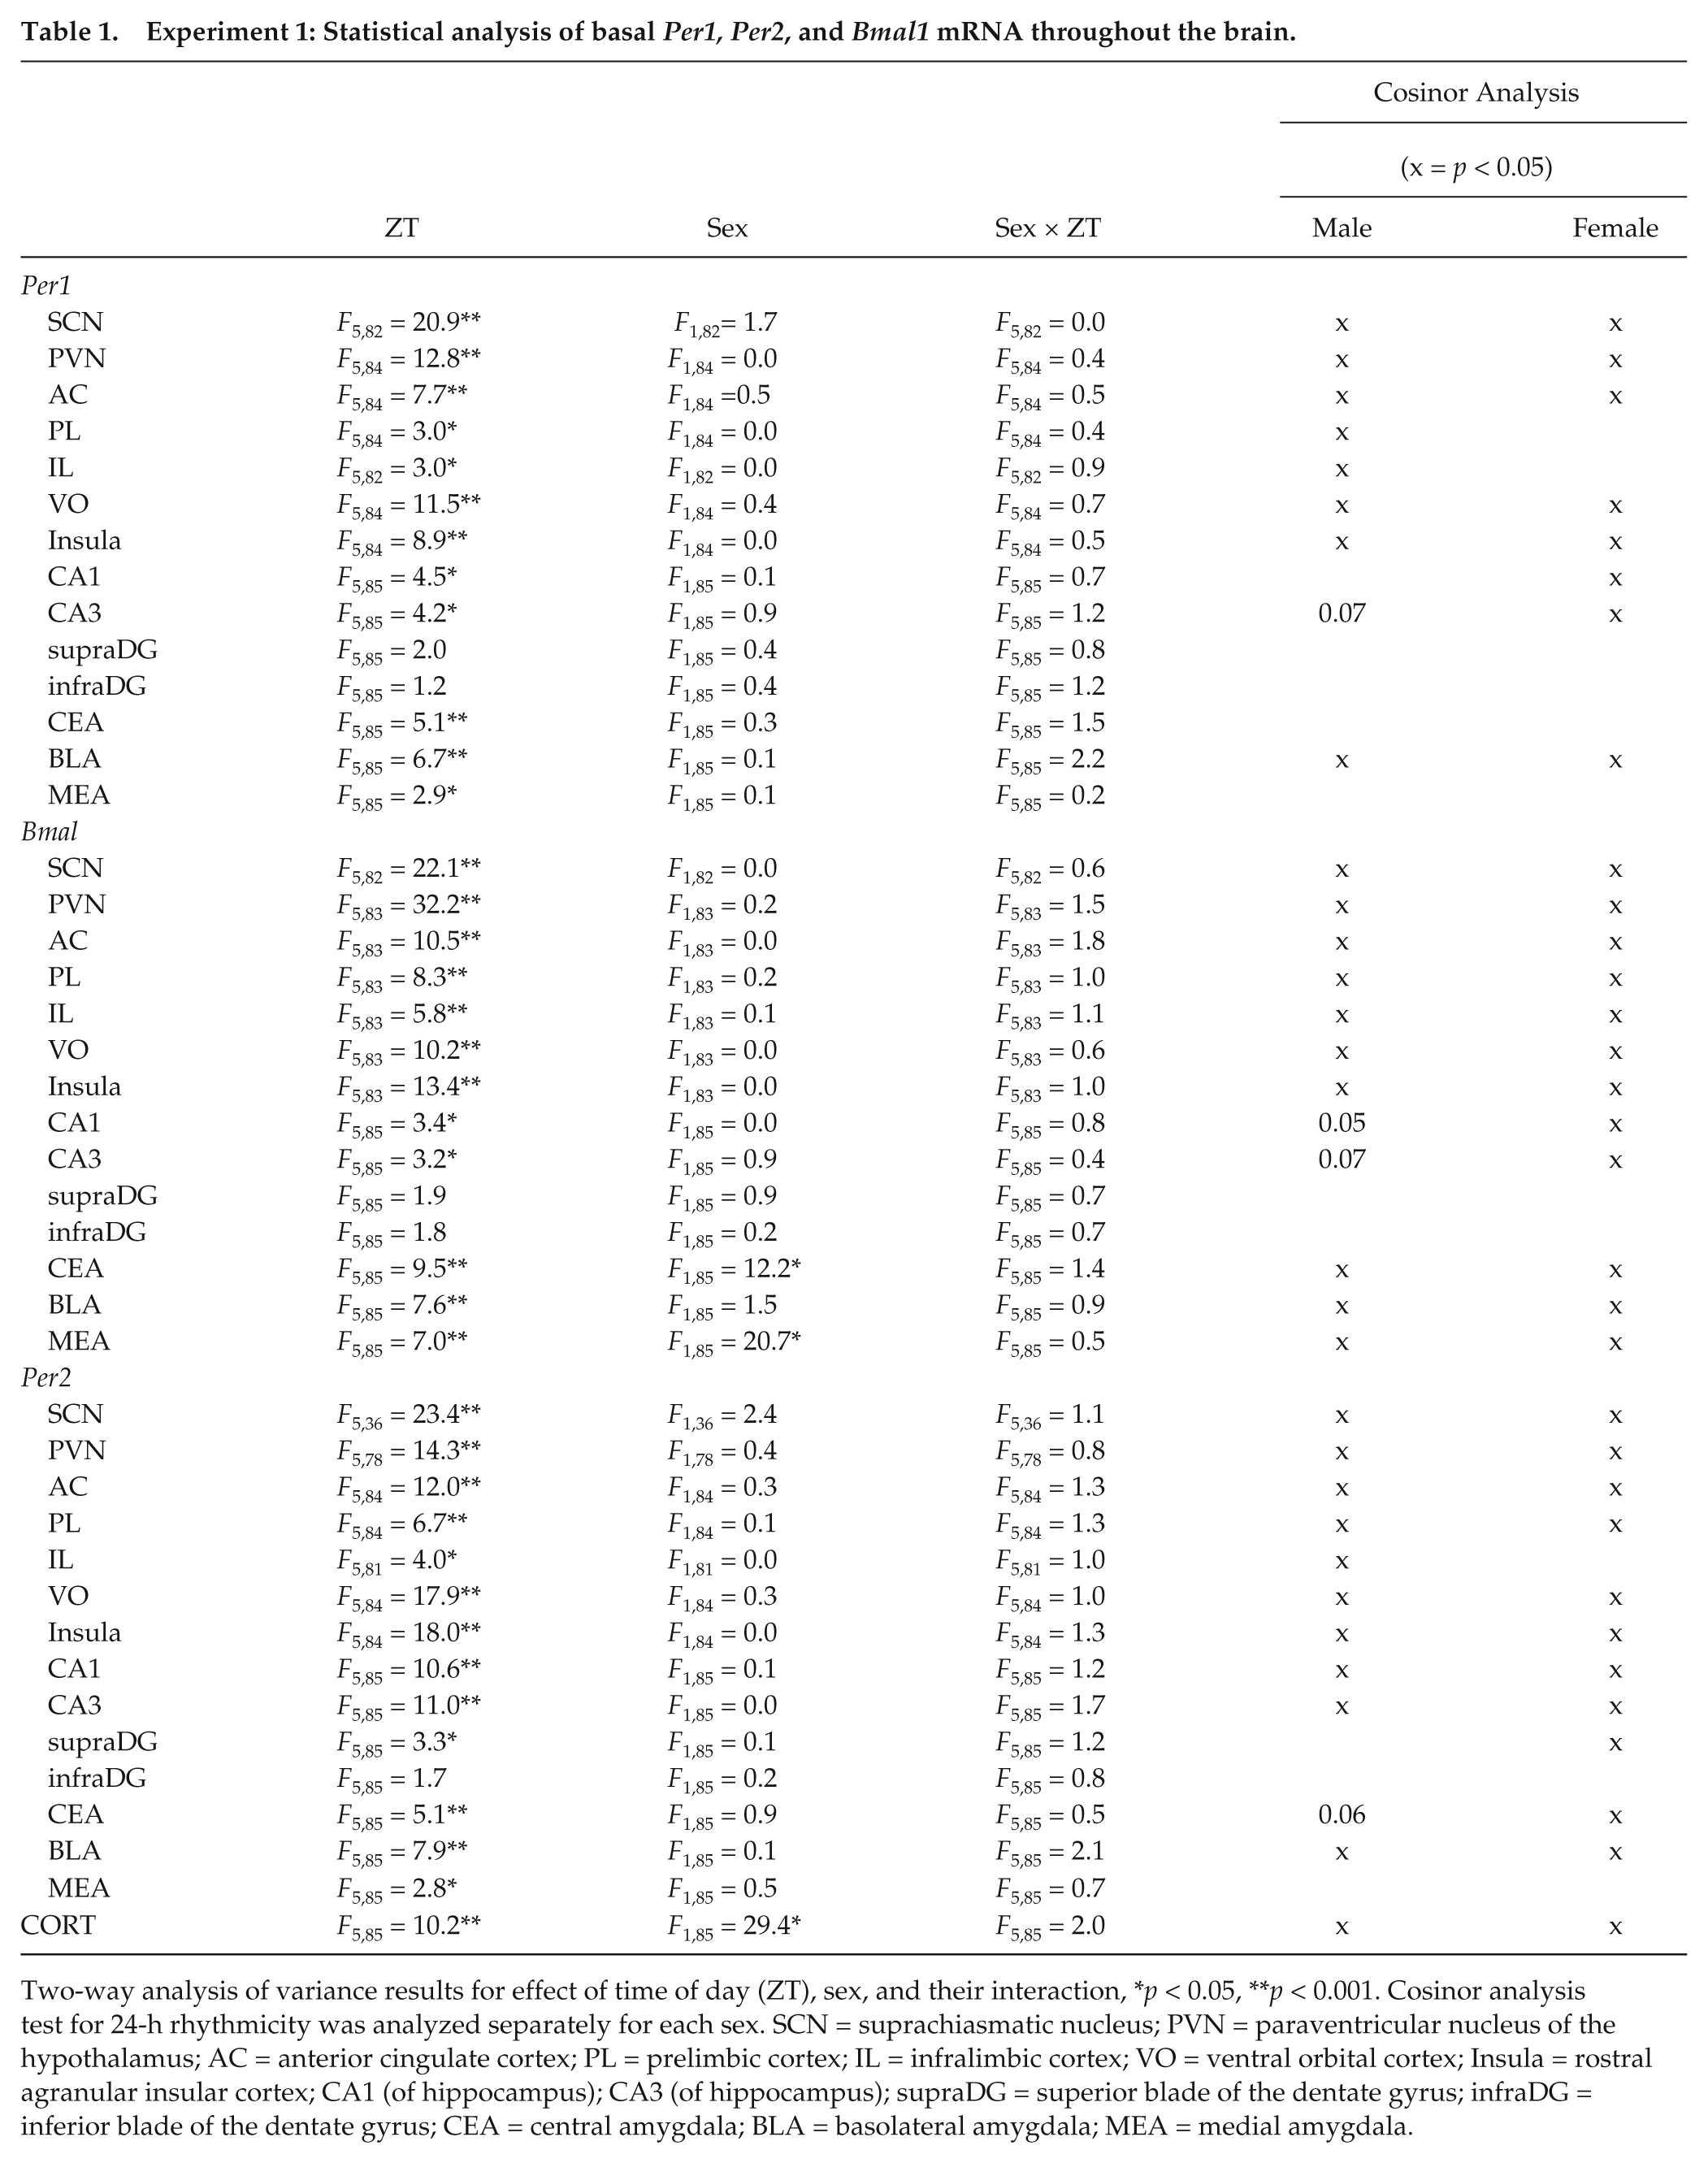
Two-way analysis of variance results for effect of time of day (ZT), sex, and their interaction, *p < 0.05, **p < 0.001. Cosinor analysis test for 24-h rhythmicity was analyzed separately for each sex. SCN = suprachiasmatic nucleus; PVN = paraventricular nucleus of the hypothalamus; AC = anterior cingulate cortex; PL = prelimbic cortex; IL = infralimbic cortex; VO = ventral orbital cortex; Insula = rostral agranular insular cortex; CA1 (of hippocampus); CA3 (of hippocampus); supraDG = superior blade of the dentate gyrus; infraDG = inferior blade of the dentate gyrus; CEA = central amygdala; BLA = basolateral amygdala; MEA = medial amygdala.
As expected, the SCN had robust, 24-h rhythmic Per1, Per2, and Bmal1 mRNA expression (significant main effect of ZT; significant cosinor analysis; Table 1; Fig. 1). There was no main effect of sex or sex by ZT interaction for Per1, Per2, or Bmal1 mRNA in the SCN. There were also no sex differences in acrophase or amplitude for all clock genes examined (cosinor analysis). This general profile of 24-h rhythmic expression of each of the clock genes in both male and female rats was observed in many of the other brain ROIs. Thus, there was also robust 24-h rhythmic Per1, Per2, and Bmal1 mRNA expression for both sexes in the PVN, anterior cingulate cortex (AC), ventral orbital cortex (VO), rostral agranular insula (insula), and basal lateral amygdala (BLA; Table 1; Fig. 1 -4; Suppl. Fig. 2). Although there was not a significant sex by ZT interaction for clock gene expression in any of the brain regions examined, cosinor analysis indicated that males but not females had a robust 24-h rhythm of Per1 (prelimbic and infralimbic cortex) and Per2 (infralimbic cortex) mRNA in subregions of the medial prefrontal cortex (Table 1). On the other hand, females but not males had a robust 24-h rhythm of Per1 (CA1 and CA3), Bmal1 (CA1 and CA3), and Per2 (supra blade of the dentate gyrus) mRNA in subregions of the hippocampus and a more robust 24-h rhythm of Per2 mRNA in the central nucleus of the amygdala (CEA; Table 1). The only main effect of sex observed was for Bmal1 mRNA expression in the CEA and medial amygdala (MEA; Table 1). Post hoc analysis revealed that this sex effect is due to greater Bmal1 mRNA expression in females compared with males at ZT0 and ZT20 in the CEA (greater peak levels in females) and at ZT0, ZT8, and ZT20 in the MEA (greater peak and trough levels in females).
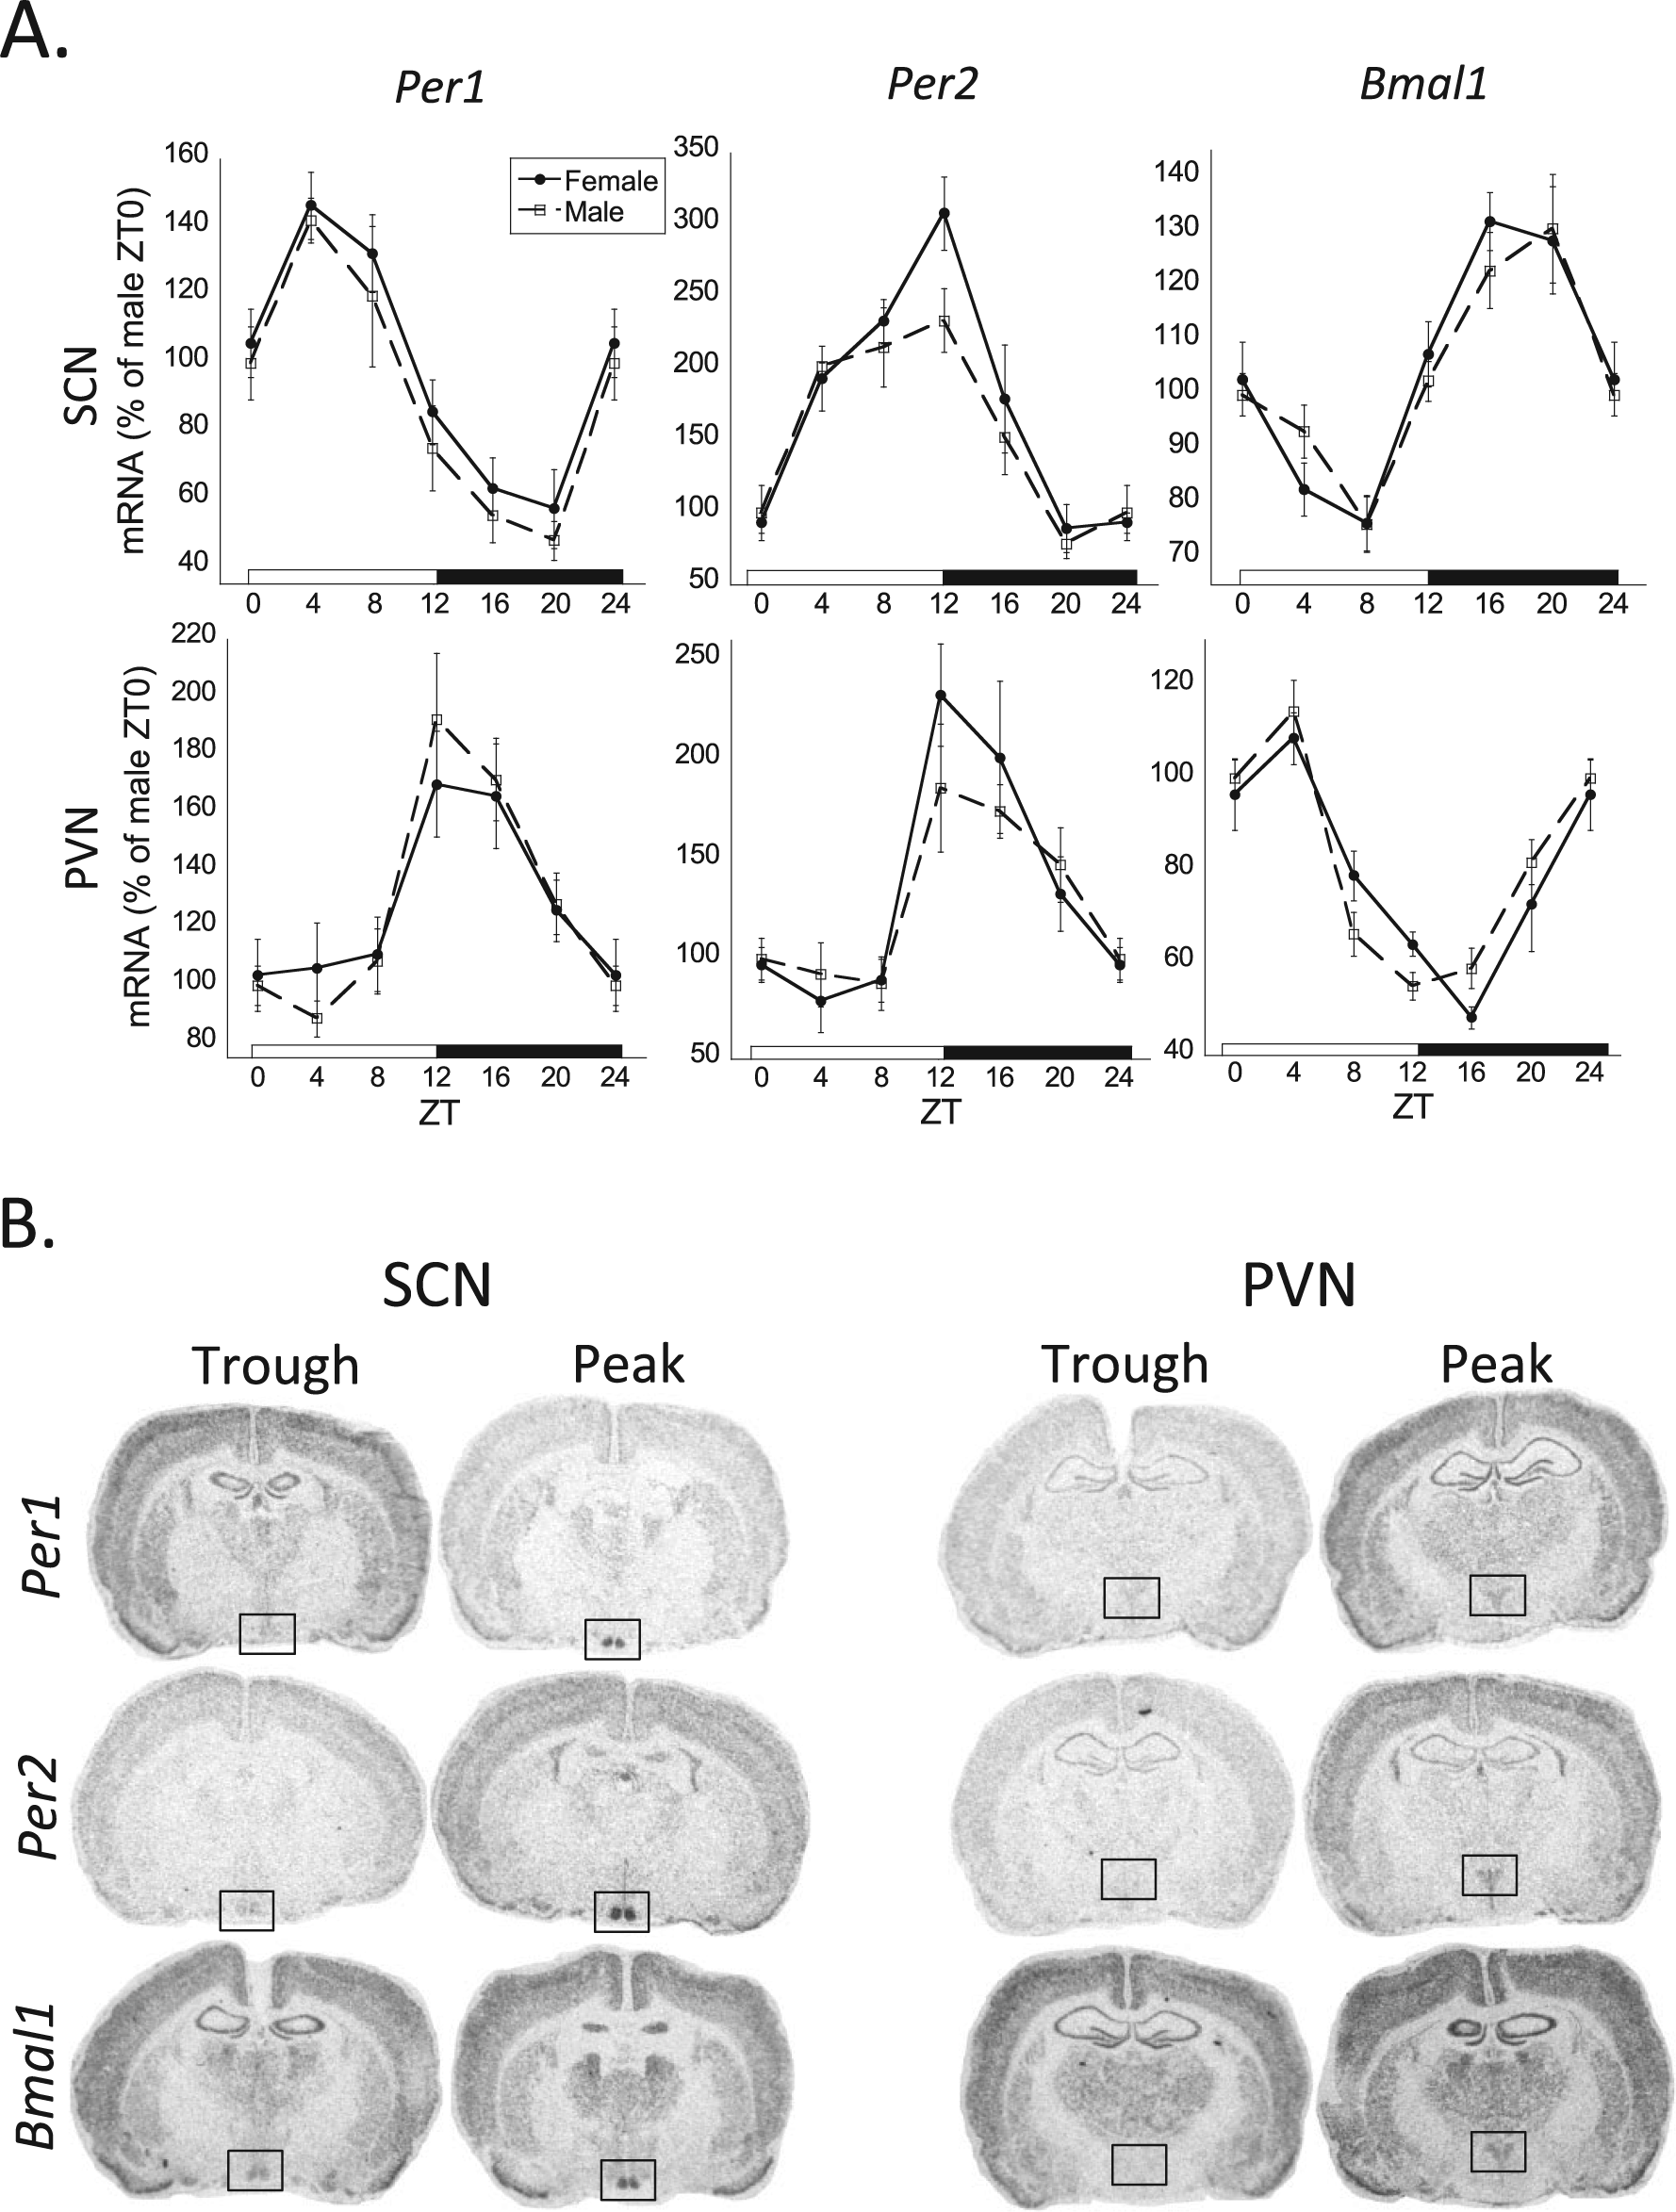
(A) The 24-h rhythmic expression of Per1, Per2, and Bmal1 mRNA in the suprachiasmatic nucleus (SCN) and paraventricular nucleus (PVN). There was an overall significant zeitgeber time (ZT) effect (2-way analysis of variance, p < 0.05) and 24-h rhythm (cosinor analysis, p < 0.05) for all clock genes in both the SCN and PVN of both males and females (n = 8 for each sex and ZT time, except n = 4 for SCN Per2 mRNA). Female profiles are denoted by filled circles connected by a solid line; male profiles are denoted by open squares connected by a dashed line. (B) Representative autoradiographic images were taken from the diurnal peak and trough of each clock gene’s rhythmic expression in the SCN and PVN (brain regions of interest denoted within black rectangle).
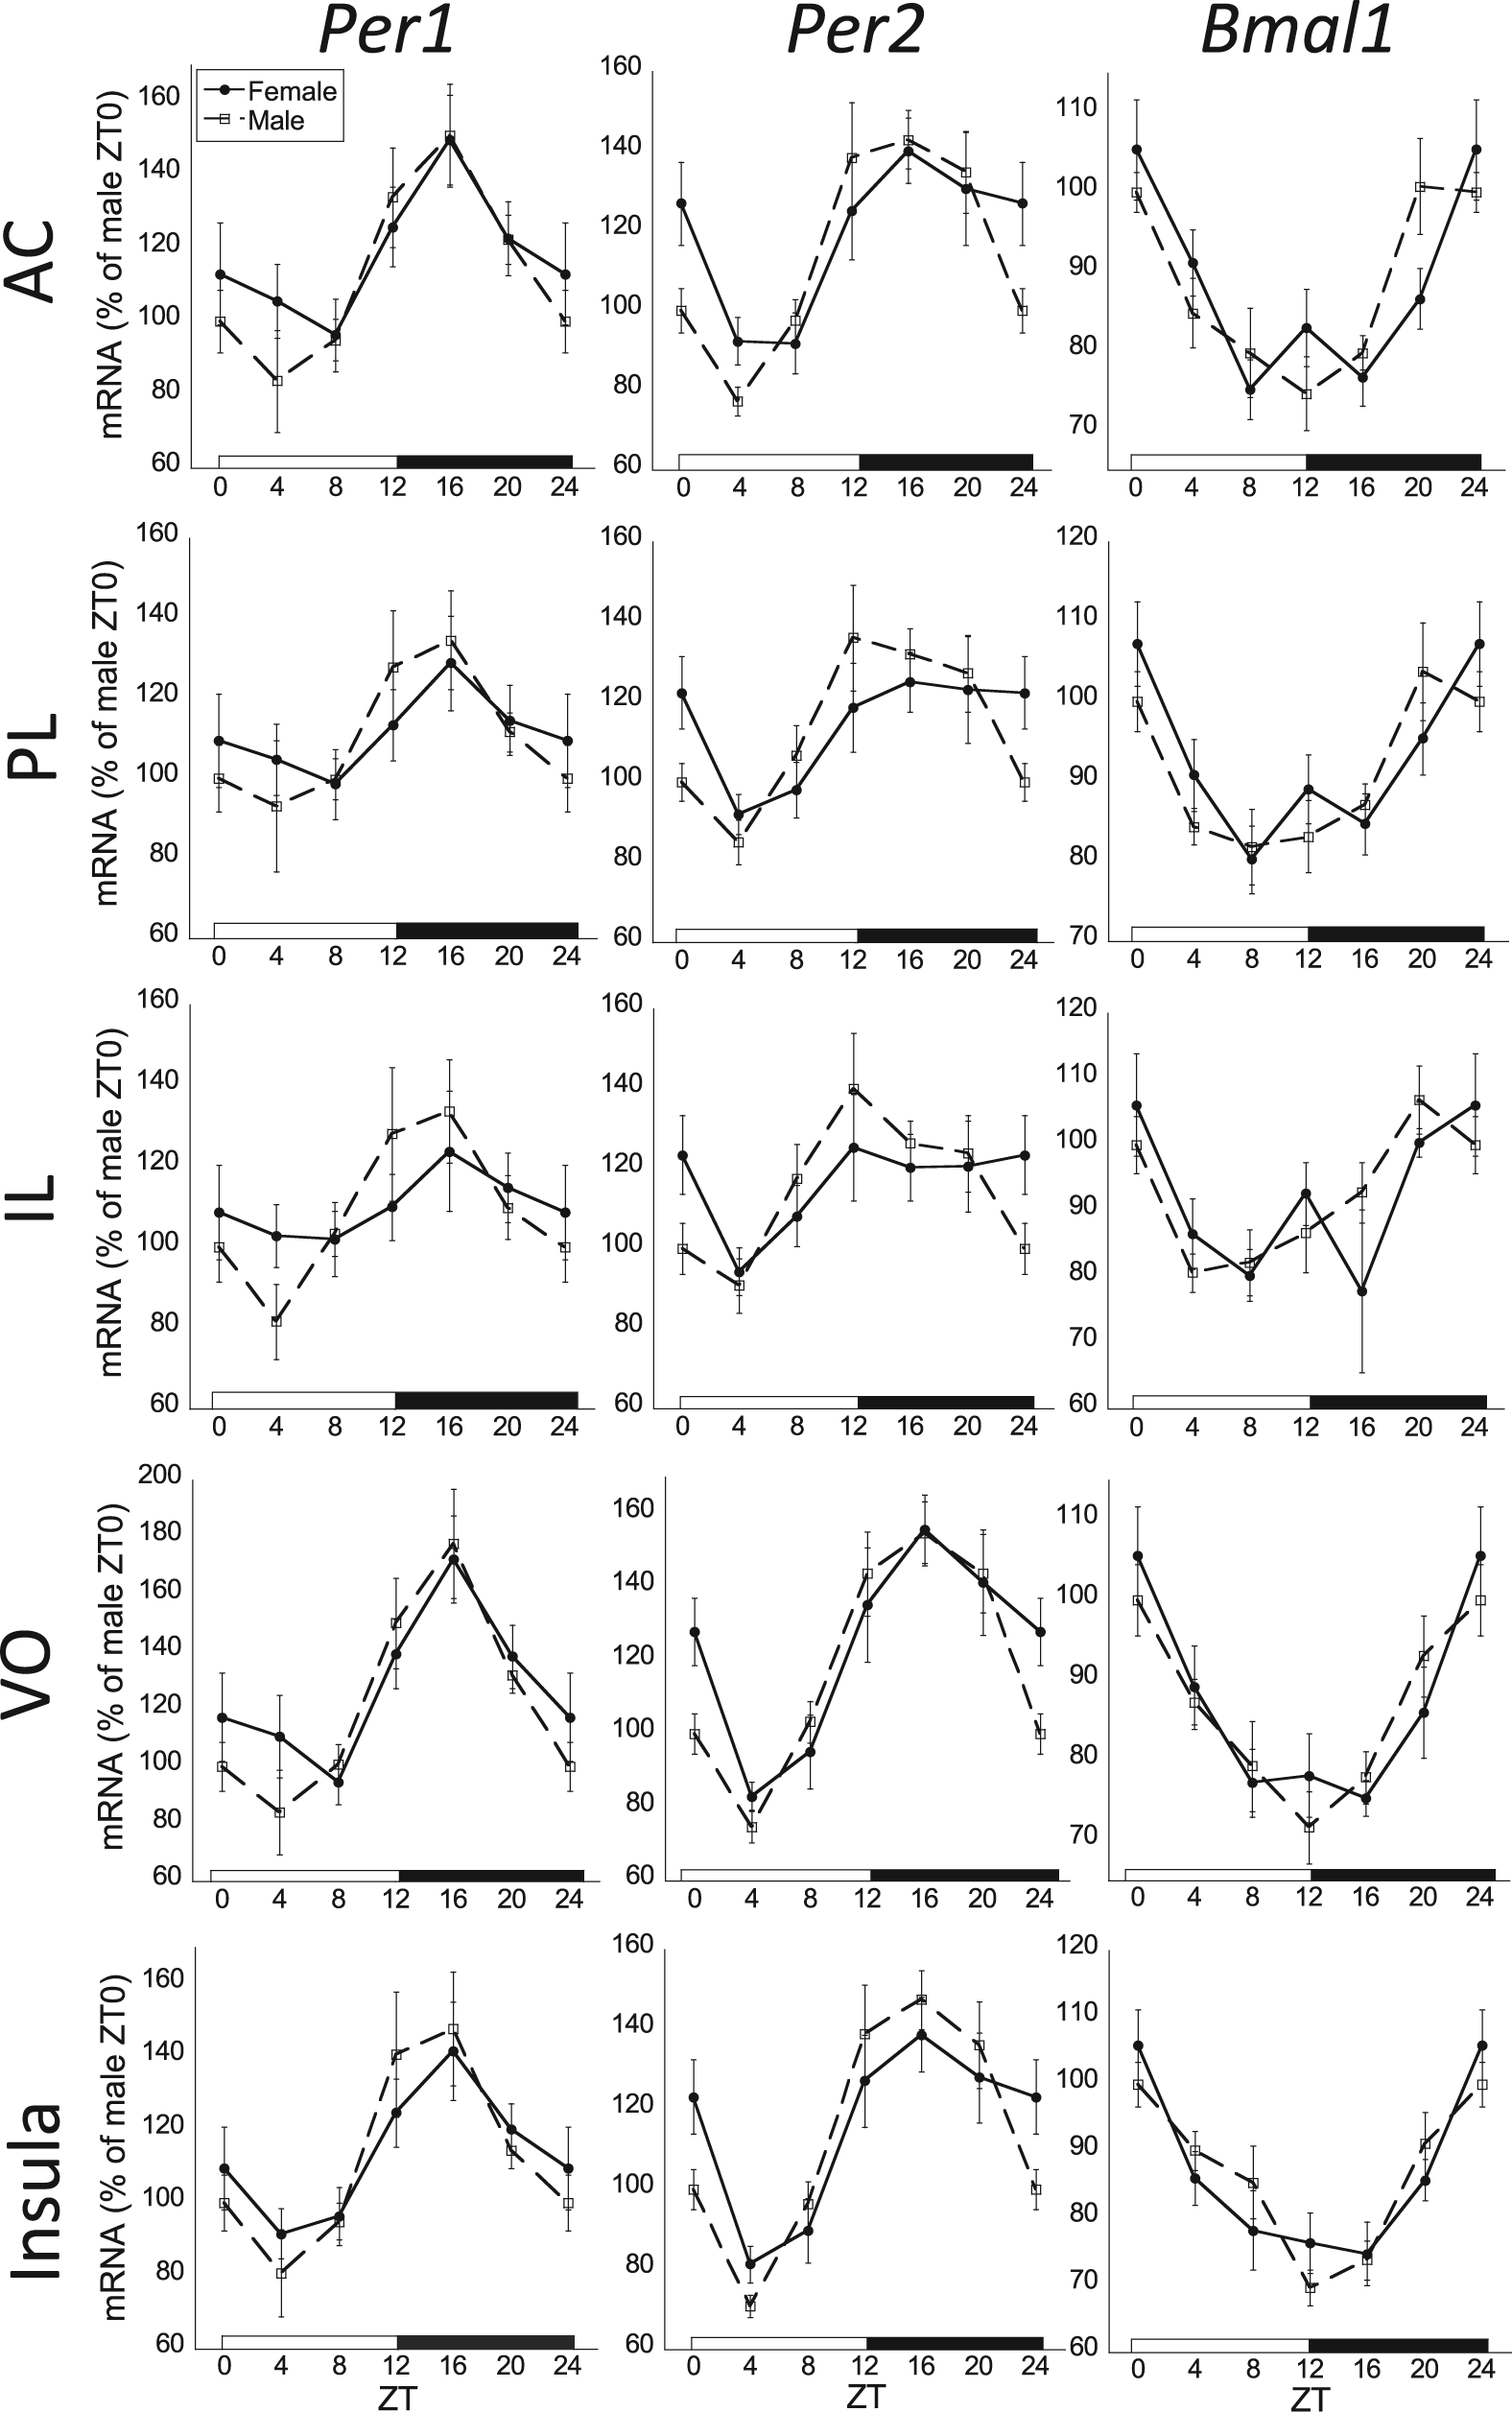
The 24-h rhythmic expression of Per1, Per2, and Bmal1 mRNA in the anterior cingulate (AC), prelimbic (PL), infralimbic (IL), and ventral orbital (VO) subregions of the prefrontal cortex, as well as the rostral agranular insula. There was an overall significant zeitgeber time (ZT) effect for all clock genes across all subregions of the prefrontal cortex and insula (2-way analysis of variance, p < 0.05; n = 8 for each sex and ZT time). Although there was a significant 24-h rhythm of each clock gene for males in all brain regions (cosinor analysis, p < 0.05), females failed to have a significant rhythm for Per1 in the PL and IL subregions and for Per2 in the IL. Female profiles are denoted by filled circles connected by a solid line; male profiles are denoted by open squares connected by a dashed line.
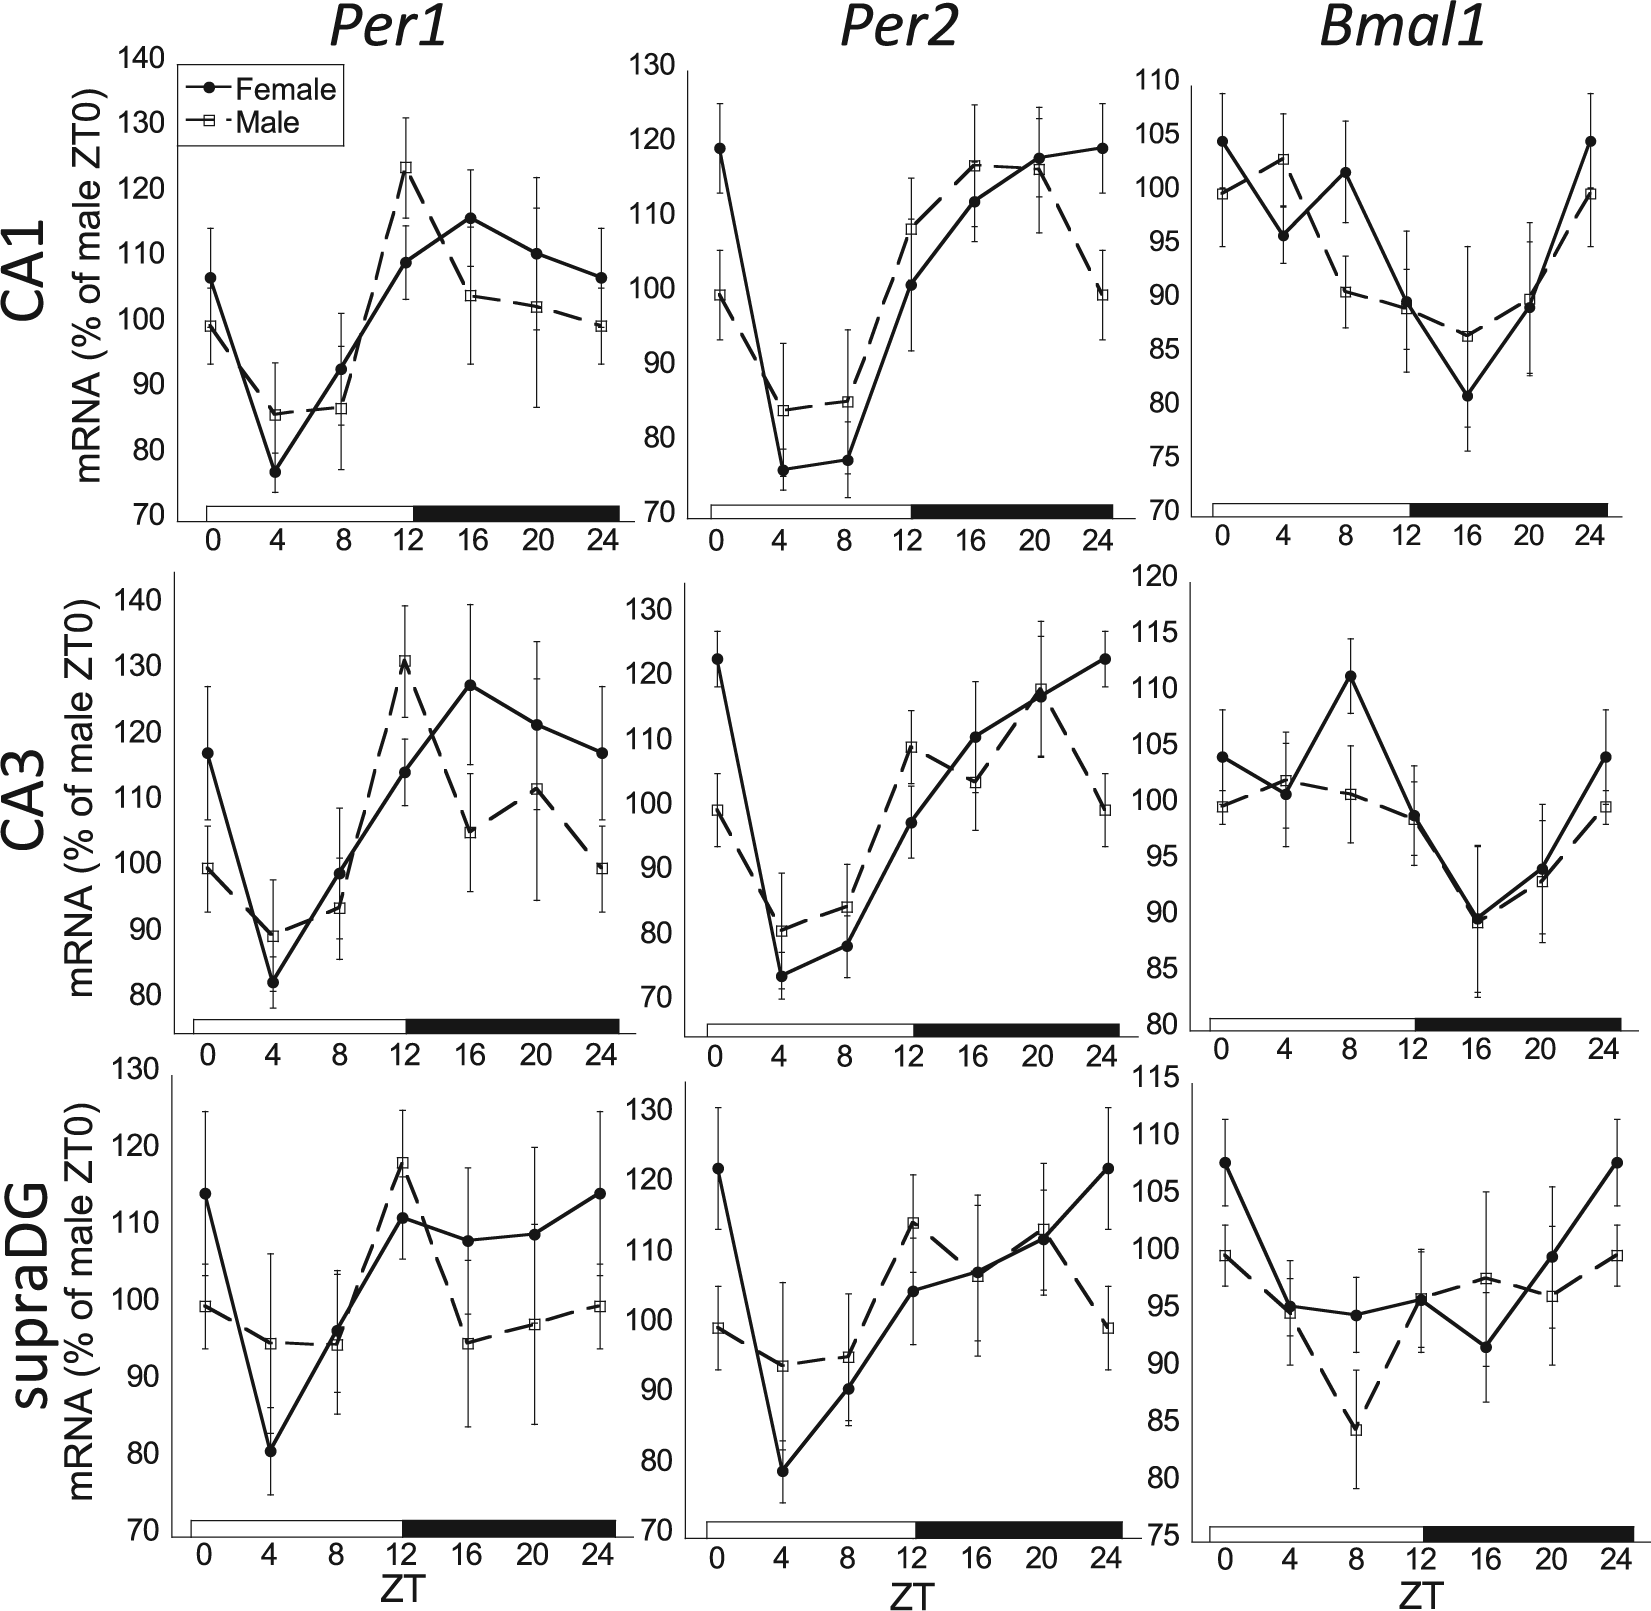
The 24-h rhythmic expression of Per1, Per2, and Bmal1 mRNA in the CA1 and CA3 subregions of the hippocampus in male and female rats. There was an overall significant zeitgeber time (ZT) effect for all clock genes in the CA1 and CA3 (2-way analysis of variance [ANOVA], p < 0.05; n = 8 for each sex and ZT time). Whereas females had significant rhythmic expression of each clock gene in both CA1 and CA3 (cosinor analysis, p < 0.05), males failed to have significant rhythmic Per1 and Bmal1 mRNA expression in the CA1 and CA3. All clock genes failed to exhibit rhythmic expression in the inferior (not pictured) and superior blades of the dentate gyrus (ZT effect, 2-way ANOVA, p > 0.05); however, Per2 mRNA expression was rhythmic in the superior blade of the dentate gyrus for females (cosinor analysis, p < 0.05). Female profiles are denoted by filled circles connected by a solid line; male profiles are denoted by open squares connected by a dashed line.
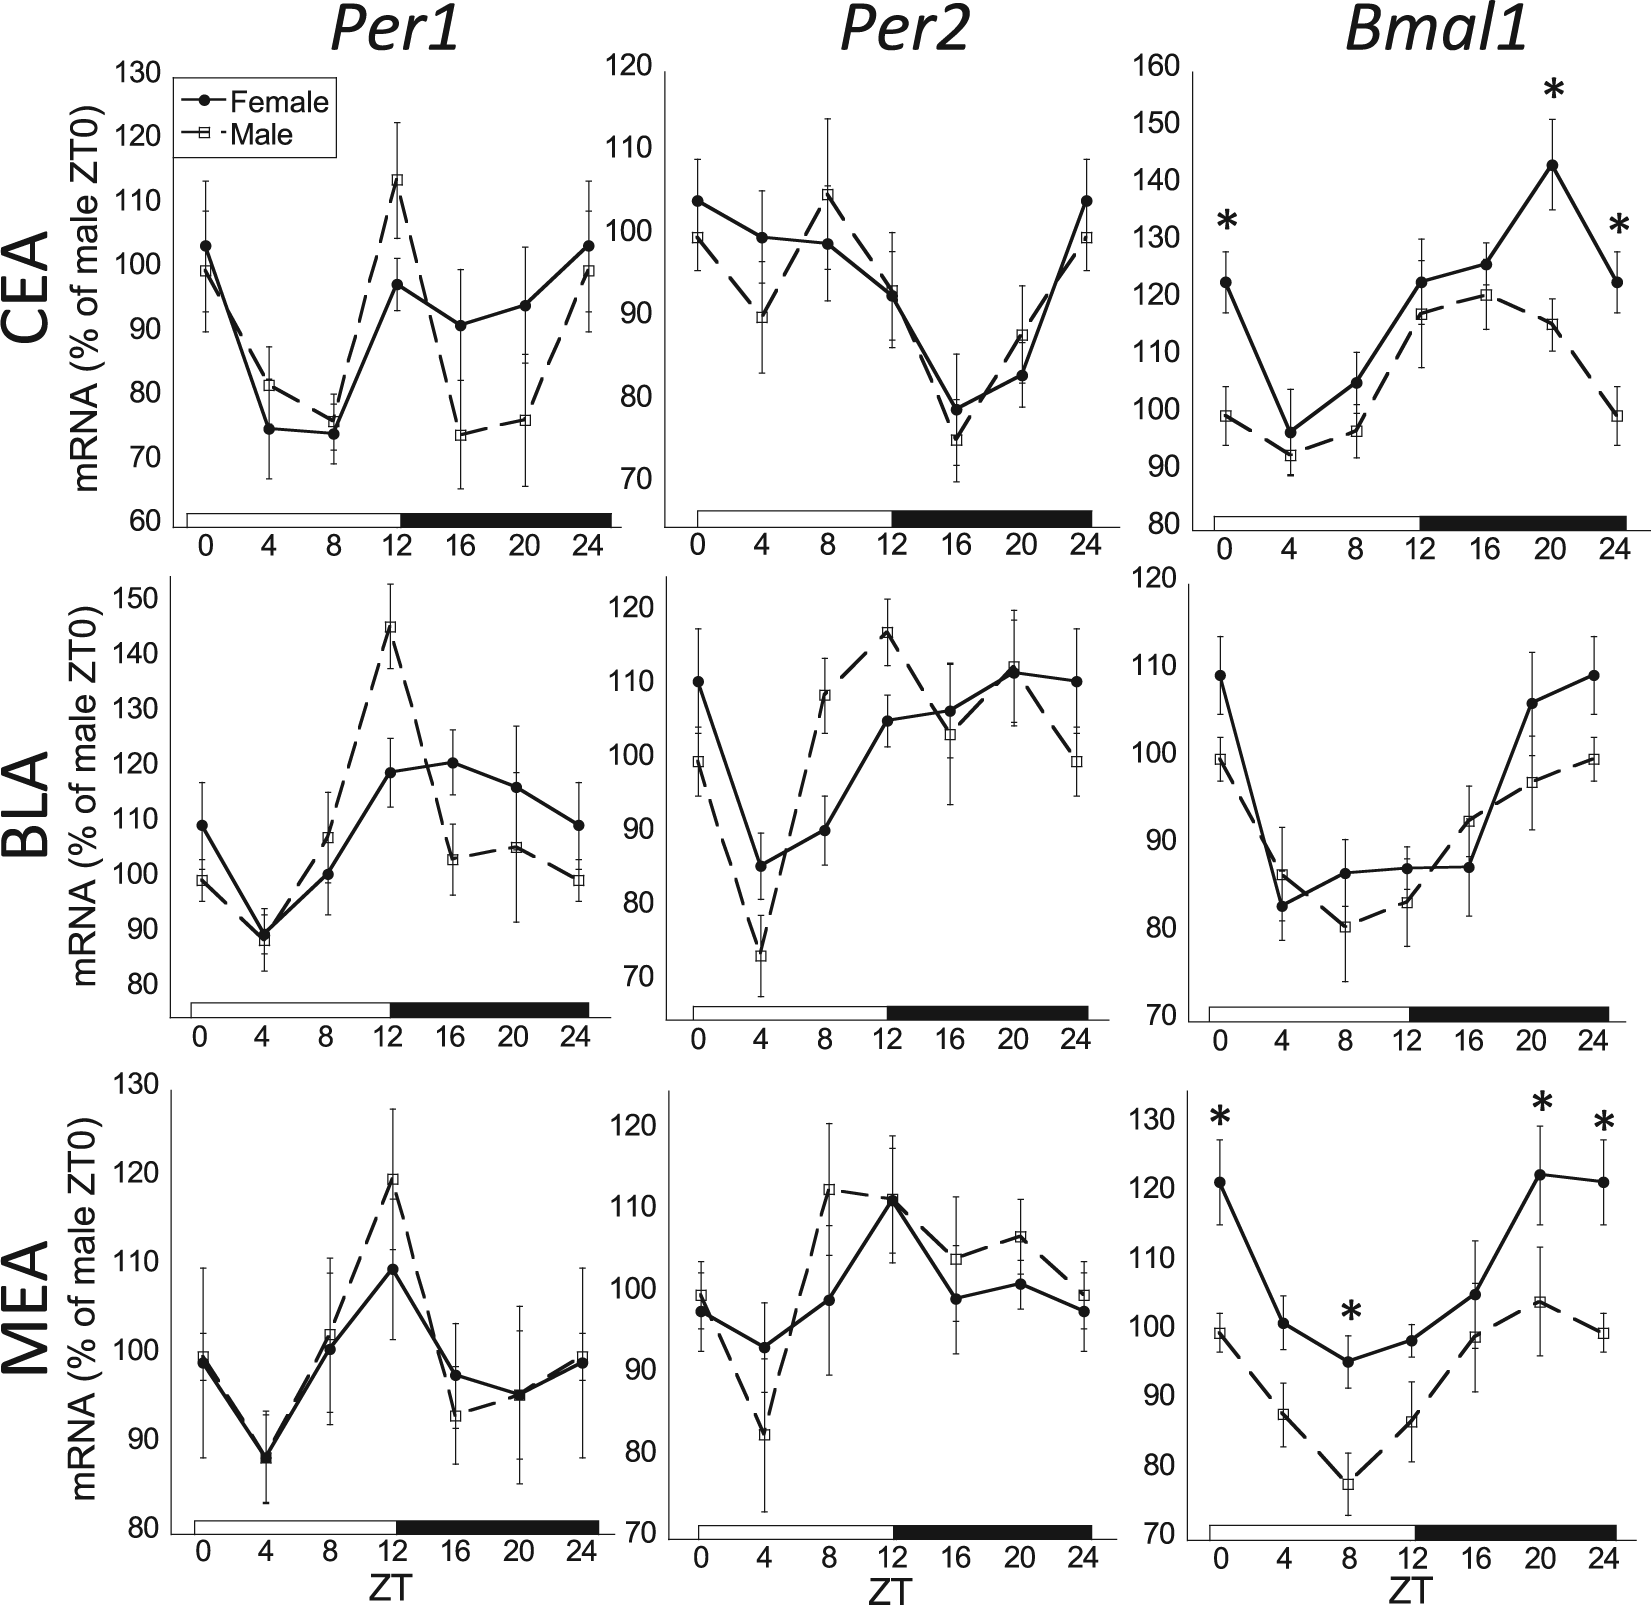
The 24-h rhythmic expression of Per1, Per2, and Bmal1 mRNA in the amygdala. There was an overall significant zeitgeber (ZT) effect for all clock genes in the basolateral amygdala (BLA), medial amygdala (MEA), and central nucleus of the amygdala (CEA; 2-way analysis of variance [ANOVA], p < 0.05; n = 8 for each sex and ZT time). There was also a significant sex effect for Bmal1 mRNA in the CEA and MEA (2-way ANOVA, p < 0.05; *p < 0.05, Fischer’s least significant difference). Cosinor analysis found all clock genes to be rhythmic in the BLA for both males and females (p < 0.05). In the CEA, cosinor analysis found Bmal1 mRNA rhythmic for both males and females (p < 0.05) and Per2 mRNA rhythmic in females (p < 0.05) with males trending toward rhythmic expression (p = 0.06). In the MEA, only Bmal1 mRNA was rhythmic for both males and females (p < 0.05). Female profiles are denoted by filled circles connected by a solid line; male profiles are denoted by open squares connected by a dashed line.
Some brain regions examined lacked a significant 24-h rhythm of clock gene expression for either sex (Table 1). Specifically, there was an absence of rhythmic Per1 and Bmal1 mRNA in the dentate gyrus (DG). Although there was a significant ZT effect for Per1 mRNA in all 3 amygdala subdivisions, only in the BLA did that expression have a significant 24-h rhythm. Similarly, there was a significant ZT effect for Per1 and Per2 mRNA in the MEA, but that expression did not have a significant 24-h rhythm.
Clock Gene Analysis: Acrophase Comparison within and across Brain Regions
The 24-h rhythmic expression of Bmal1, Per1, and Per2 mRNA in the brain regions examined revealed 3 distinct composite profiles, suggesting that the molecular clock varies in its overall phase relationship between different brain regions. The 3 main clock profiles are (1) Bmal1 mRNA acrophase in the dark phase with Per1/Per2 mRNA antiphasic to Bmal1 mRNA, (2) Bmal1 mRNA acrophase in the light phase with Per1/Per2 mRNA antiphasic to Bmal1 mRNA, and (3) Bmal1 mRNA acrophase around the transition from dark to light phase with Per1/Per2 mRNA acrophase in the early/mid-dark phase (Fig. 5).
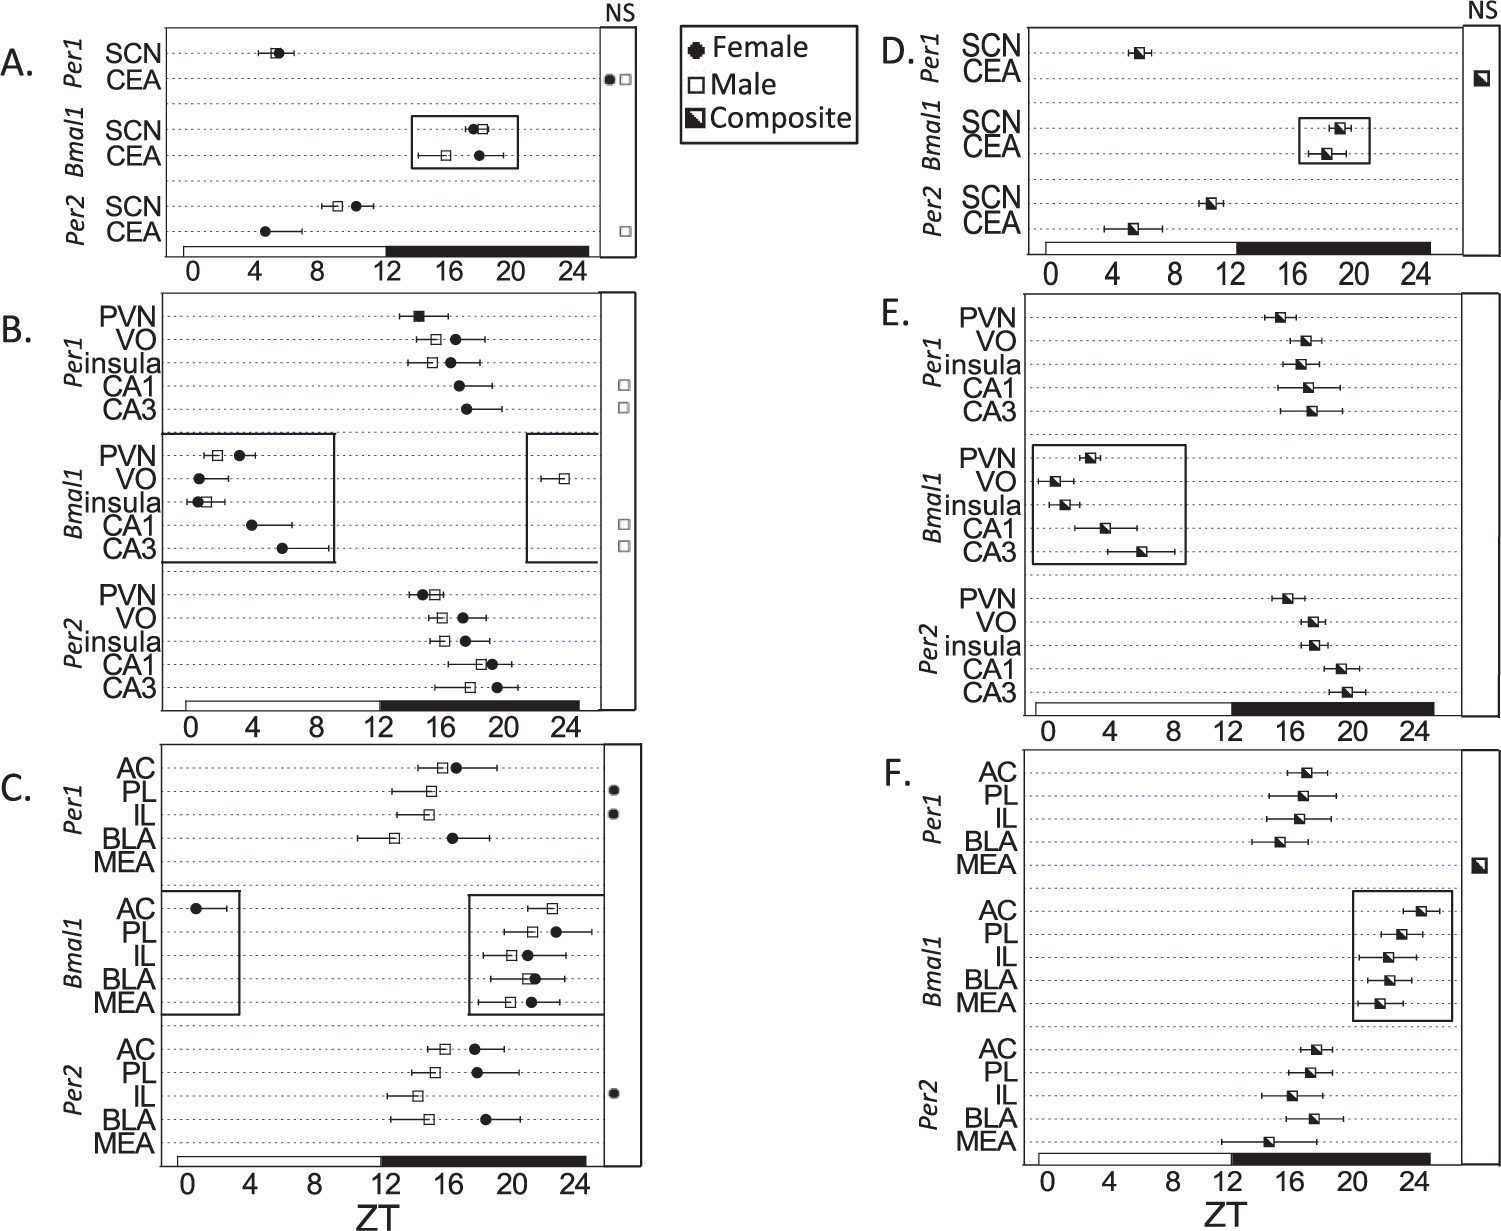
Plot of acrophases (±95% confidence interval) for Per1, Bmal1, and Per2 mRNA in all brain regions examined in males and females separately (A-C) and males and females combined (D-F). There were 3 distinct molecular clock profiles: (1) Bmal1 mRNA acrophase in the dark phase with Per1/Per2 mRNA antiphasic to Bmal1 mRNA (A, D), (2) Bmal1 mRNA acrophase in the light phase with Per1/Per2 mRNA antiphasic to Bmal1 mRNA (B, E), and (3) Bmal1 mRNA acrophase around the transition from dark to light phase with Per1/Per2 mRNA acrophase in the early/mid-dark phase (C, F). The Bmal1 mRNA acrophase clusters for each of the 3 distinct profiles are highlighted within black rectangles. Acrophase estimates are for rhythms with a significant 24-h period, p < 0.05; cosinor analysis (NS = not significant).
Bmal1 mRNA acrophase in the dark phase with Per1/Per2 mRNA antiphasic to Bmal1 mRNA. Both the SCN and the CEA had Bmal1 mRNA acrophase at ~ZT18. In the SCN, the acrophase of Per1 mRNA was antiphasic to Bmal1 mRNA and occurred at ~ZT5 (Fig. 5). The acrophase of Per2 mRNA expression occurred at ~ZT9, between that of Per1 and Bmal1 mRNA. This is the only brain region examined in which the acrophase of Per2 mRNA was significantly different from that of Per1 mRNA (no overlap of 95% CIs). In the CEA, Per1 mRNA failed to be rhythmic, but Per2 mRNA was rhythmic and antiphasic (acrophase ~ZT4) to Bmal1 mRNA expression. Considered together, both the SCN and CEA had a Bmal1 mRNA acrophase in the dark phase and an antiphasic acrophase of a negative component of the molecular clock (either Per1 or Per2 mRNA).
Bmal1 mRNA acrophase in the light phase with Per1/Per2 mRNA antiphasic to Bmal1 mRNA. The PVN, insula, VO, and the CA1 and CA3 subregions of the hippocampus had a Bmal1 mRNA acrophase in the beginning of the light phase (Fig. 5). In these brain areas, both Per1 and Per2 mRNA expression had an acrophase (~ZT13-18) that was approximately antiphasic to the Bmal1 mRNA acrophase (~ZT0-5). It is noteworthy that the acrophases for Bmal1 and Per1 mRNA in these brain areas were also antiphasic to their respective acrophases in the SCN, demonstrating distinct patterns of rhythmicity between the 2 hypothalamic nuclei. In these brain regions, the acrophases for Per1 and Per2 mRNA were similar to each other.
Bmal1 mRNA acrophase at the transition from dark to light with Per1/Per2 mRNA acrophase during the early to mid-dark phase. Subregions of the medial PFC (AC, PL, IL), the BLA, and the MEA had an acrophase of Bmal1 mRNA around the late dark phase (ZT20-24) and an acrophase of Per1 and Per2 mRNA during the early to mid-dark phase (ZT11-16; Fig. 5). The acrophases of Per1 and Per2 mRNA of these brain regions were similar to the Per1 and Per2 mRNA acrophases seen in the PVN, insula, VO, and the CA1 and CA3 subregions of the hippocampus. The exception is the MEA, which lacked 24-h rhythmic expression of both Per1 and Per2.
Throughout nearly all brain regions examined, there was a distinct trend for the acrophase of each of the 3 clock genes to be slightly phase delayed in females compared with males, although within any one brain region, this sex difference was not statistically significant (Fig. 5).
Rhythmic Clock Gene Amplitude Comparison across Brain Regions
There was robust Per1, Per2, and Bmal1 mRNA expression in the SCN and PVN, with relatively large amplitudes for each 24-h rhythm (Fig. 6). Consistent with other reports (Harbour et al., 2013, 2014; Girotti et al., 2009), in these 2 brain regions there was a larger amplitude of Per1 and Per2 mRNA 24-h rhythms than there was for Bmal1 mRNA. Notably, the amplitudes of the 24-h rhythms of Bmal1 and Per2 mRNA were lower in all other brain regions examined. The amplitude of Per1 mRNA 24-h rhythm was somewhat lower in the PFC subregions and insula compared with the SCN and PVN and was distinctly lower in the hippocampus and amygdala.
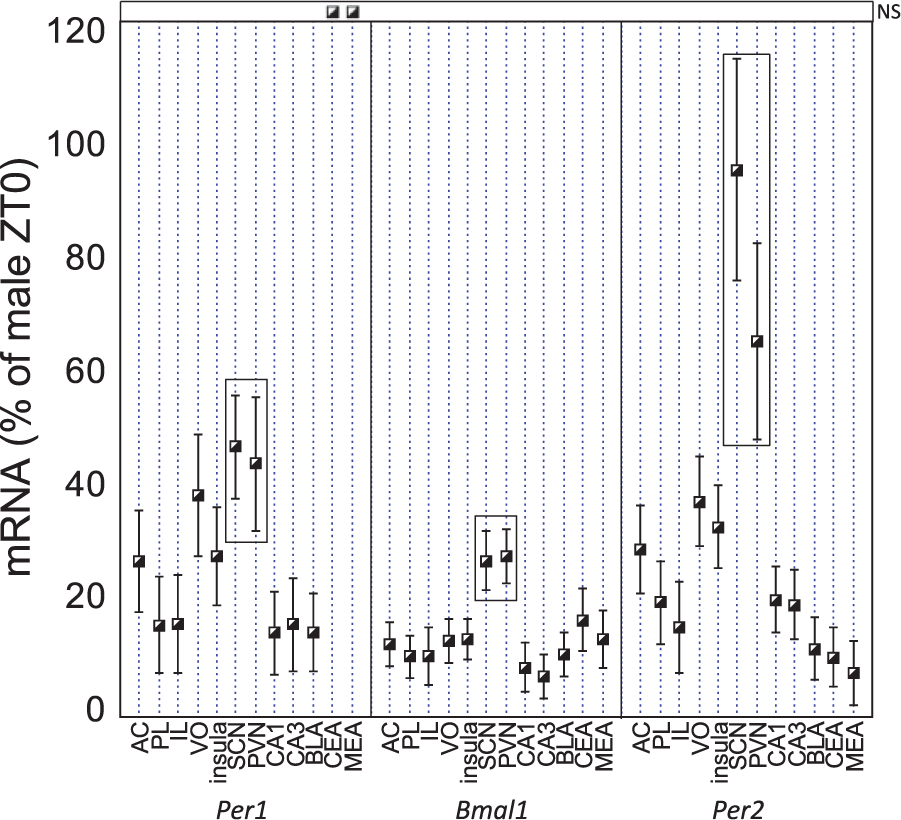
Plot of amplitudes (±95% confidence interval) for the rhythmic expression of Per1, Bmal1, and Per2 mRNA in all brain regions examined in males and females combined. The suprachiasmatic nucleus and paraventricular nucleus had the greatest amplitudes for Per1, Bmal1, and Per2 mRNA rhythmic expression compared with all other brain regions examined. In all cases where there was a significant 24-h rhythm for both sexes (Table 1; Fig. 5), there was no significant sex difference in amplitude. Brain regions of interest are arranged in rostral to caudal order on the x-axis. Instances in which there was not a significant rhythm have been marked as not significant (NS).
Experiment 2: Basal Clock Gene Expression throughout the Brain of Normally Cycling versus Noncycling Female Rats
Estrous Cyclicity and CORT Levels
A large percentage of female rats (43%) in this experiment were considered noncyclers. This lack of cycling could be due to some cases of vaginal lavage–induced pseudopregnancy (Becker et al., 2005) but perhaps largely due to the Lee-Boot effect, as females were pair housed and in rooms with only females (Van der Lee & Boot, 1955, 1956). Similar to experiment 1, females had a large diurnal rhythm in basal plasma CORT levels (2-way ANOVA and cosinor analysis, p < 0.05) with an acrophase of 11.2 ± 1.7 95% CI. There was no effect of cyclicity or ZT by cyclicity interaction.
Clock Gene Expression
Two-way ANOVA and cosinor analysis found similar acrophases and amplitudes for 24-h rhythms of Bmal1 and Per2 mRNA expression as in experiment 1 (Table 2; Suppl. Table 1). Per1 mRNA failed to have a significant main effect of ZT, with the SCN and PVN as the exceptions. Similar to the profile for females in experiment 1, Per1 and Per2 expression in the prelimbic cortex (PL) and infralimbic cortex (IL) failed to be rhythmic, suggestive of an attenuated amplitude in females compared with males. There was a significant cyclicity × ZT interaction for Bmal1 mRNA expression in the AC, F5,62 = 2.8, p = 0.02; PL, F5,62 = 2.8, p = 0.02; IL, F5,62 = 2.6, p = 0.03; and VO, F5,62 = 2.6, p = 0.03, where noncyclers had more robust 24-h Bmal1 expression compared with cyclers (Fig. 7). Bmal1 mRNA expression in the subregions of the PFC were the only instances where there was a significant cyclicity by ZT interaction (Table 2). Examination of cosinor analysis revealed that while both noncyclers and cyclers had rhythmic Bmal1 mRNA expression in the PFC, cyclers had a blunted rhythm (smaller amplitude) compared with noncyclers. In addition to a blunted amplitude, cyclers also had a significant difference (cosinor analysis) in acrophase of Bmal1 mRNA rhythm in the PL and IL subregions.
Experiment 2: Statistical analysis of basal Per1, Per2, and Bmal1 mRNA throughout the brain.
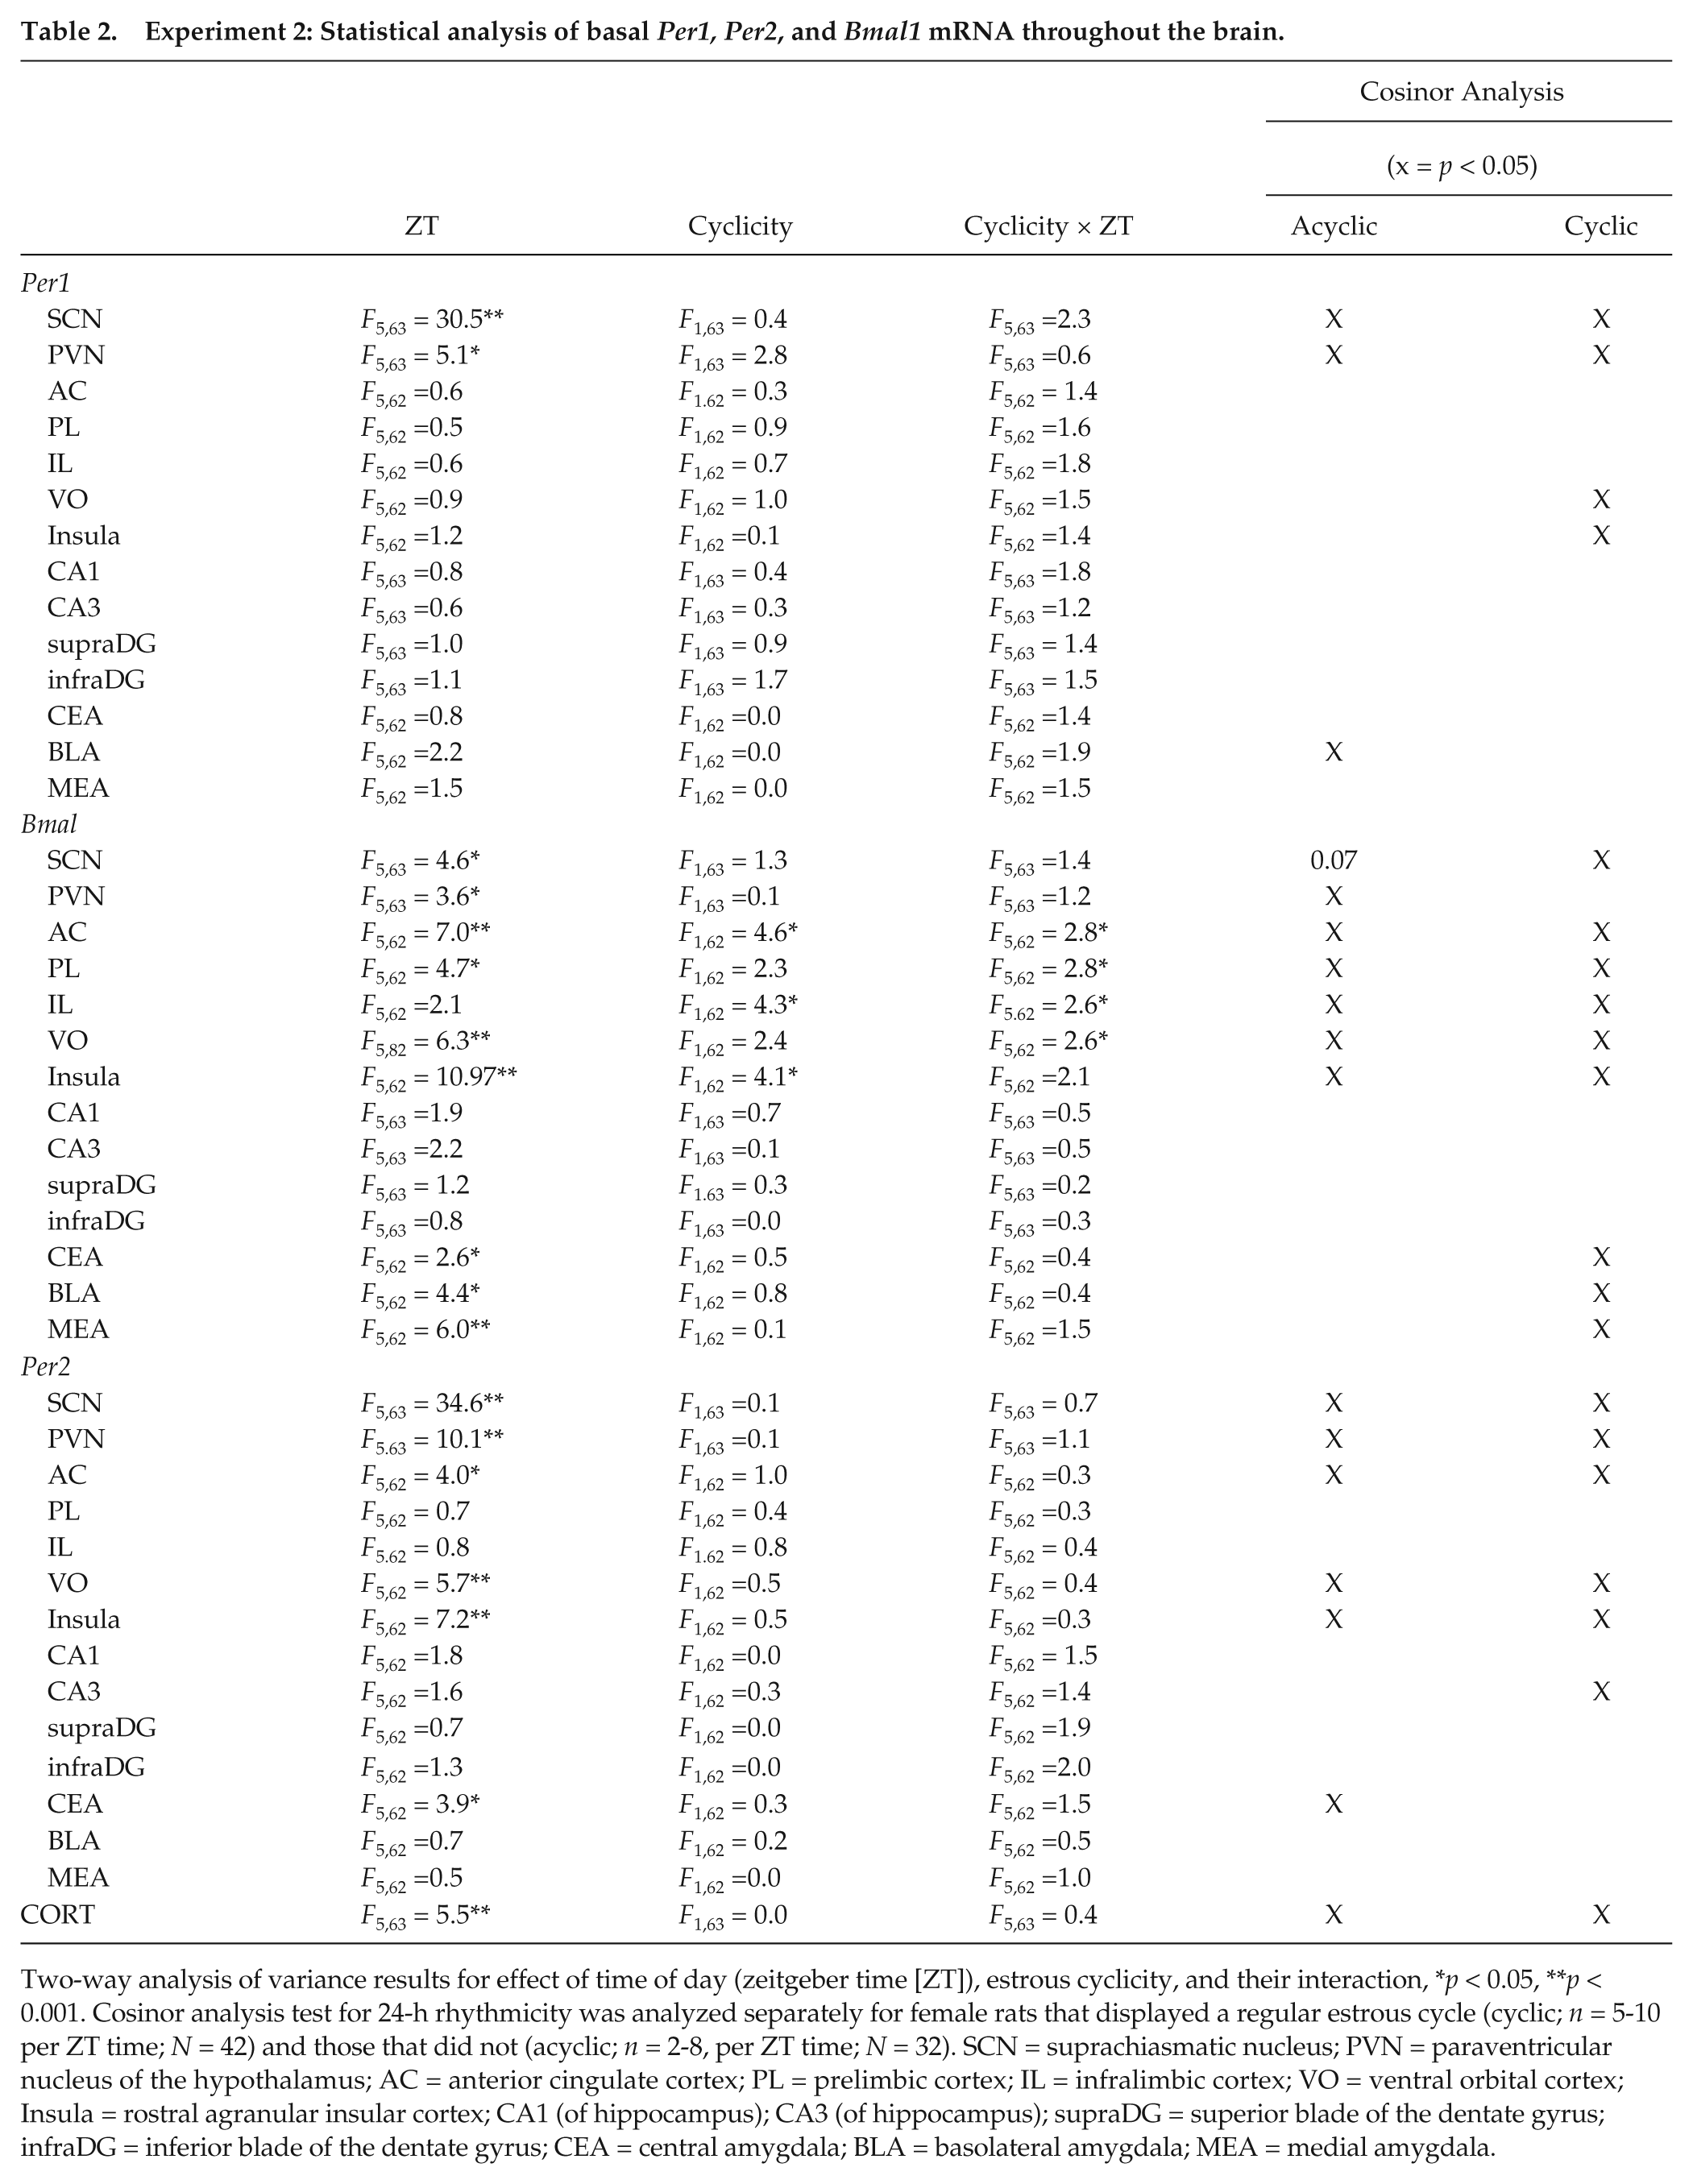
Two-way analysis of variance results for effect of time of day (zeitgeber time [ZT]), estrous cyclicity, and their interaction, *p < 0.05, **p < 0.001. Cosinor analysis test for 24-h rhythmicity was analyzed separately for female rats that displayed a regular estrous cycle (cyclic; n = 5-10 per ZT time; N = 42) and those that did not (acyclic; n = 2-8, per ZT time; N = 32). SCN = suprachiasmatic nucleus; PVN = paraventricular nucleus of the hypothalamus; AC = anterior cingulate cortex; PL = prelimbic cortex; IL = infralimbic cortex; VO = ventral orbital cortex; Insula = rostral agranular insular cortex; CA1 (of hippocampus); CA3 (of hippocampus); supraDG = superior blade of the dentate gyrus; infraDG = inferior blade of the dentate gyrus; CEA = central amygdala; BLA = basolateral amygdala; MEA = medial amygdala.
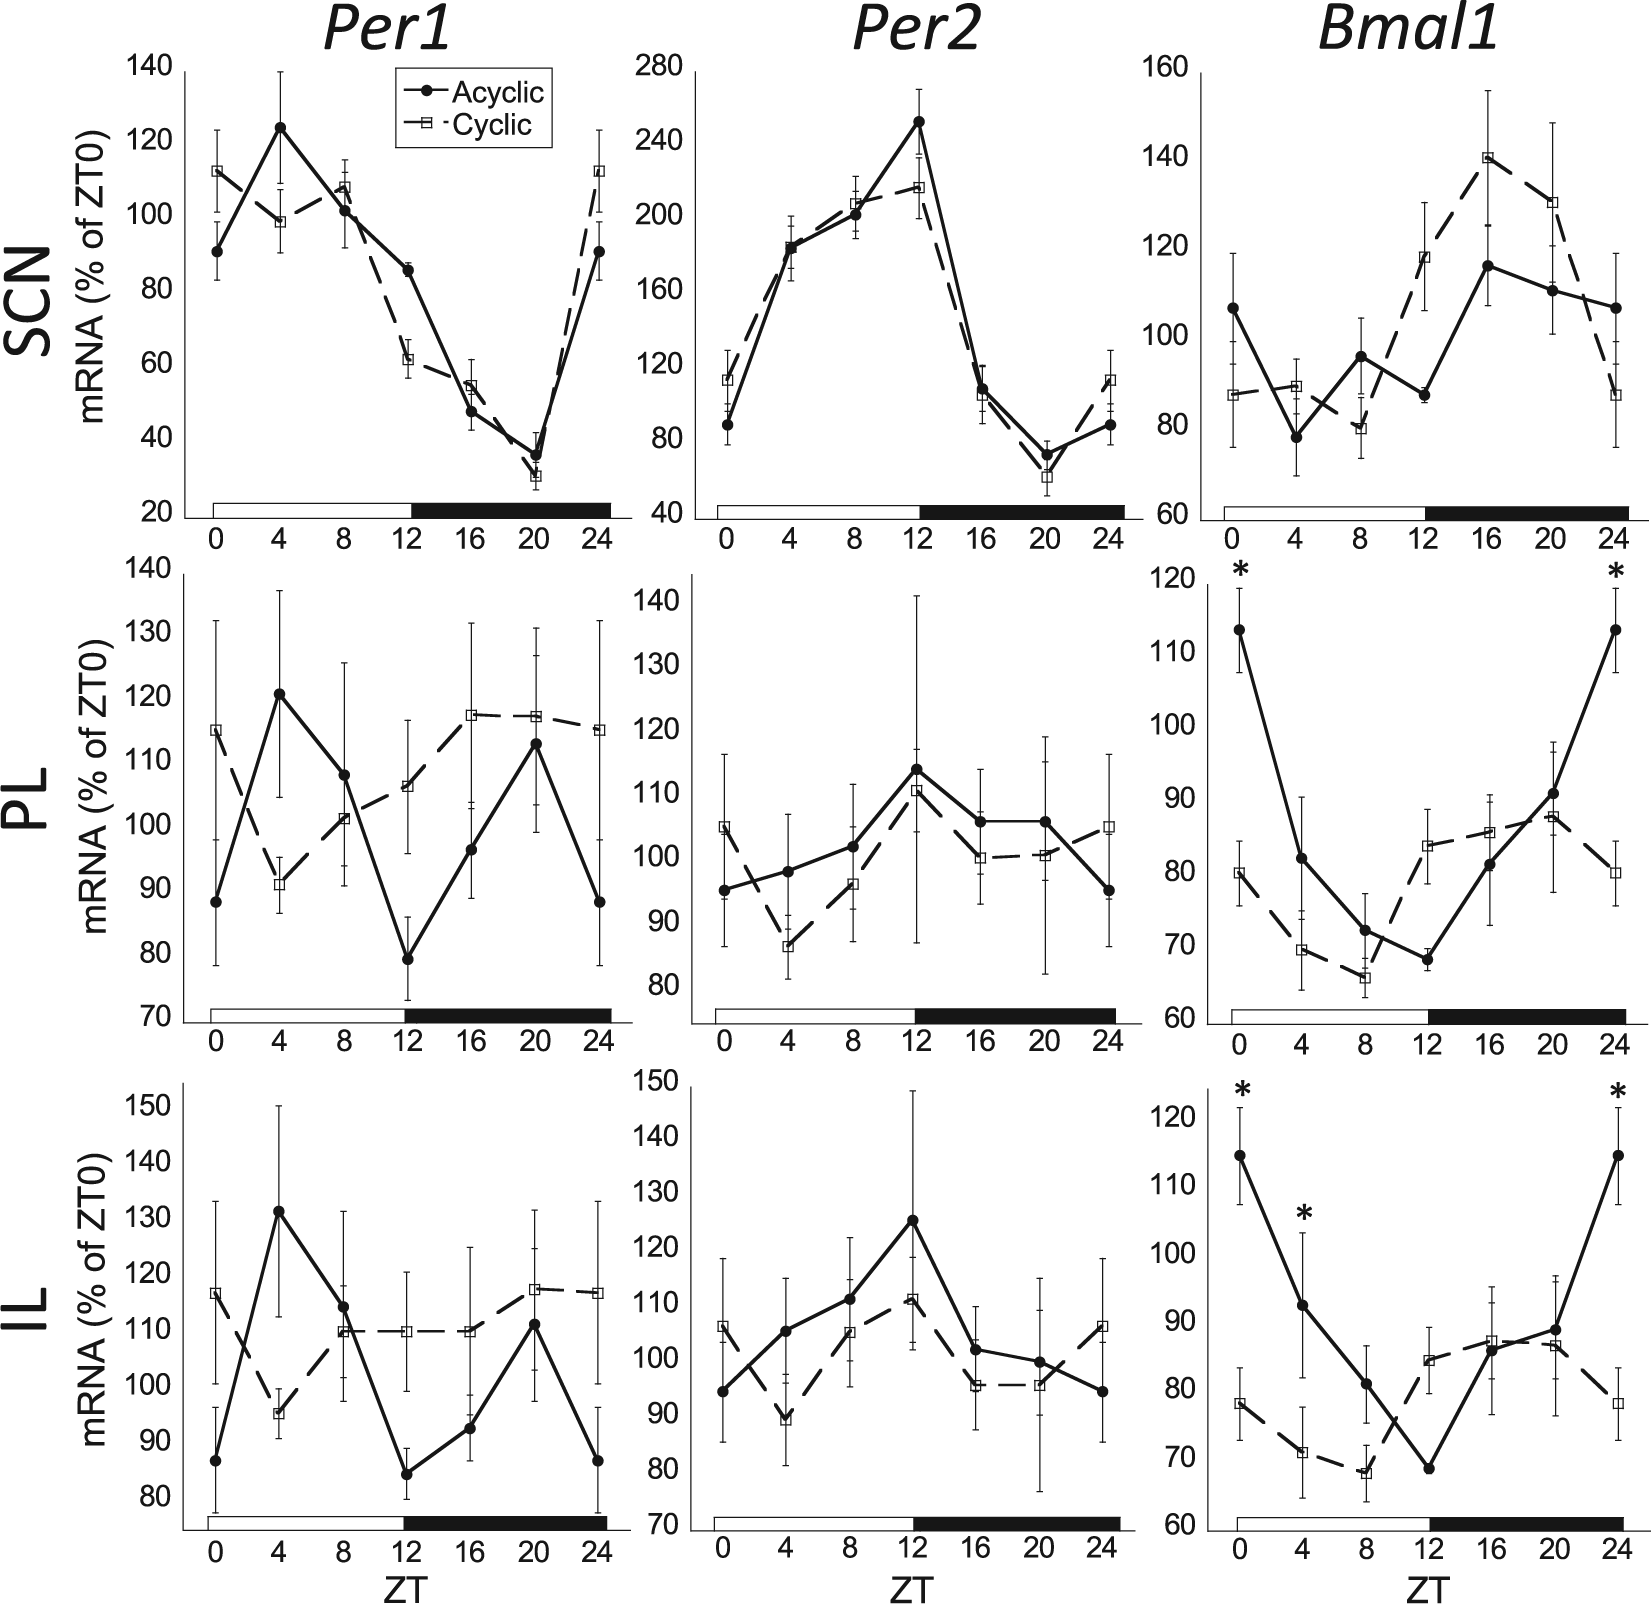
Comparison of Per1, Per2, and Bmal1 mRNA in the suprachiasmatic nucleus (SCN), prelimbic cortex (PL), and infralimbic cortex (IL) of female rats separated according to estrous cyclicity status. Note that there was a blunted rhythm and significant phase advance for Bmal1 mRNA in the PL and IL, but not SCN, of female rats that had regular estrous cycles (cyclic; n = 5-10 per ZT time; N = 42) compared with female rats with less regular estrous cycles (acyclic; n = 2-8 per zeitgeber time [ZT] time; N = 32; significant cyclicity status by ZT interaction, 2-way analysis of variance [ANOVA], p < 0.05). There were also significant differences of cyclicity status on Bmal1 mRNA at ZT0 (PL, IL) and ZT4 (IL; Fischer’s least significant difference, *p < 0.05). Cyclicity status had no significant effect on clock gene expression in the SCN. Per1 and Per2 mRNA were not rhythmic in the PL and IL (p > 0.05). Acyclic profiles are denoted by filled circles connected by a solid line; cyclic profiles are denoted by open squares connected by a dashed line.
Discussion
We found a 24-h rhythmic expression profile for both positive (Bmal1) and negative (Per1, Per2) regulatory clock genes across a range of brain structures that are important for emotion-related learning and control. The phase relationship between the expression of these clock genes varied within and between brain regions, with 3 distinct profiles evident. Overall, these rhythms were similar between male and female rats. However, in female rats, the acrophase of all clock genes in nearly all brain regions examined was slightly phase delayed compared with male rats. There were also some brain region–specific sex differences in the robustness of rhythmic clock gene expression. In addition, the PFC had less robust rhythmic clock gene expression in the composite data of female rats at various phases of the estrous cycle compared with females that were not cycling.
Three Distinct Molecular Clock Profiles
The molecular clock in the SCN represents one of the distinct molecular clocks found in this study: Bmal1 mRNA acrophase in the dark phase with antiphasic expression of Per1/Per2 mRNA. These acrophases matched that of previous studies seen in the SCN (Dunlap, 1999; Girotti et al., 2009, Harbour et al., 2014). This was the only tissue examined in which there was a significant difference in the acrophase of Per1 and Per2 mRNA with a ~4-h phase-delay of Per2 mRNA relative to Per1 mRNA, as previously reported in several different rodent species (Albrecht et al., 1997; Vosko et al., 2009). The CEA was the only extra-SCN brain region examined in this study that had a phase relationship for the positive and negative clock gene components similar to the SCN. Per2 mRNA was rhythmic in the CEA, and its acrophase was antiphasic to the acrophase of Bmal1 mRNA. Our results are consistent with the previous finding that PER2 protein diurnal expression in the CEA has a similar, although somewhat advanced, phase relationship with PER2 protein expression in the SCN, which differs from other brain regions (BLA, DG; Harbour et al., 2013; Lamont et al., 2005). Our results are also in close agreement with the recent finding that Bmal1 and Per2 mRNA in the CEA and SCN have similar phase relationships, with acrophase estimates very close to ours (Harbour et al., 2014). The CEA integrates neural input to produce expression or inhibition of fear (LeDoux et al., 1988; Wilensky et al., 2006). Circadian variations have been observed in conditioned fear expression and conditioned fear extinction memory (Chaudhury & Colwell, 2002; Eckel-Mahan et al., 2008; Valentinuzzi et al., 2001; Woodruff et al., 2015; Pace-Schott et al., 2013). Whether the shared phase relationship of clock gene expression between the SCN and CEA has a functional significance for circadian modulation of conditioned fear remains to be determined. The SCN and CEA are comprised predominantly of GABAergic neurons (Sun & Cassell, 1993; Sun et al., 1994; Wagner et al., 1997), which may contribute to the somewhat unique circadian clock relationship of those 2 brain regions.
The second distinct molecular clock observed was characterized by a Bmal1 mRNA acrophase during the light phase with antiphasic expression of Per1/Per2 mRNA. This was evident in the PVN, the CA1 and CA3 subregions of the hippocampus, the VO, and the rostral insula. In the PVN, there were no sex differences in acrophase or amplitude of any of the clock genes despite a robust sex difference seen in the amplitude of diurnal CORT levels. In the hippocampal DG, the only significant clock gene expression rhythm that we observed was in female rats (Per2 mRNA), consistent with the more robust CA1 and CA3 rhythms evident in female rats compared with males (Figs. 3 and 5). Despite the overall lack of statistical significance, the general diurnal expression profile for each clock gene in the DG was similar to that seen in the CA1 and CA3 (Fig. 3). Previous studies have shown rhythmic clock gene expression in rodent DG (Feillet et al., 2008; Harbour et al., 2014; Lamont et al., 2005; Gilhooley et al., 2011), whereas others failed to see rhythmic Per1 or Per2 mRNA in DG or whole hippocampus of rodents (Shieh et al., 2005). Wang et al. (2009) observed rhythmic but blunted amplitude of Per2 mRNA and PER2 protein in the DG compared with CA1, CA2, and CA3 of mouse hippocampus. Consequently, there may be some rhythmic clock gene expression in the DG, with an expression profile similar, but less robust, to the profile in the CA1 and CA3. Performance on hippocampal-dependent learning and memory tasks has been shown to have diurnal differences (Eckel-Mahan et al., 2008; Smarr et al., 2014), possibly reflecting rhythmic clock gene expression in the hippocampus.
The third distinct molecular clock observed had an acrophase of Bmal1 mRNA that occurred at the transition from the dark to the light phase and acrophases of Per1 and Per2 mRNA that occurred during the early to mid-dark phase. Subregions of the medial PFC (AC, PL, IL) and BLA shared this molecular clock. This is the first study to show rhythmic expression of these clock genes throughout the mPFC. A key feature of this third molecular clock profile is the lack of fully antiphasic rhythms between Bmal1 and Per1/Per2 mRNA due to the distinct acrophase of Bmal1 compared with other brain regions. This lack of antiphasic expression may be due to phenotypic variations in clock gene mRNA or protein half-lives, resulting in an antiphasic molecular clock evident primarily at the protein level. In addition, CRY in these tissues may play a bigger role in the negative regulation of Bmal1 mRNA expression than PER1 or PER2 (Shearman, 2000). It should also be noted that in the SCN, only the rhythmic expression of Per1 mRNA, not Per2 mRNA, is fully antiphasic to Bmal1 mRNA.
Possible Factors Contributing to Tissue Differences in the Molecular Clock
The 24-h rhythmic expression of Per1 and Per2 mRNA in the brain regions examined had 2 distinct acrophases: in the mid-light phase or in the early to mid-dark phase. The timing/entrainment of these rhythms may be related to the presence of a glucocorticoid response element (GRE) and cAMP response element in the promoter region of both genes (Colwell, 2011; So et al., 2009; T. Yamamoto et al., 2005). In the SCN, light increases the activation of cAMP response element binding protein (CREB), which results in a rapid increase of Per1 and somewhat delayed Per2 transcription (Miyake et al., 2000; Shearman, 2000; Takumi et al., 1998; Tischkau, 2002; Zylka et al., 1998). Thus, it may be expected that the acrophase of Per1 and Per2 expression occurs during the light phase in the SCN. In all other brain regions examined except the CEA, the acrophase of Per1 and Per2 mRNA occurred during the first half of the dark phase. The increased nocturnal physical activity and general arousal during the dark phase are associated with increased neural activation, which could increase Per1 and Per2 expression via CREB activation. Interestingly, in humans and a diurnal rodent (degu), Per1/2 gene expression in extra-SCN brain regions has been found to have an acrophase during the light phase (Li et al., 2013; Vosko et al., 2009).
Glucocorticoids have been shown to rapidly induce Per1 mRNA in fibroblasts, liver, and hippocampus and Per2 mRNA in mesenchymal stem cells, likely via the GRE associated with these genes’ promoter region (Balsalobre, 2000; Conway-Campbell et al., 2010; So et al., 2009; T. Yamamoto et al., 2005). Peak Per1 and Per2 mRNA levels seen during the early dark phase in extra-SCN brain regions could be influenced by the daily peak in circulating CORT levels present at the onset of the dark phase. The diurnal CORT peak may contribute to daily GRE-mediated induction of Per1 and Per2 mRNA expression and act as an entrainment factor for extra-SCN clocks (Balsalobre, 2000; Pezük et al., 2012; Segall et al. 2006, 2009). There is very little GR expression in the rodent SCN (Balsalobre et al., 2000; Rosenfeld et al., 1988, 1992). Thus, Per1 and Per2 mRNA expression in the SCN would not be subject to this daily entraining influence.
While there were 2 distinct acrophases for Per1 and Per2 mRNA evident in the brain regions examined, there were 3 distinct acrophases for Bmal1 mRNA. This suggests that the phase relationship of rhythmic Bmal1 mRNA is not solely determined by Per1/Per2 mRNA profiles. Retinoid-related orphan receptor (ROR) is a protein that positively induces Bmal1 transcription (Sato et al., 2004). There are tissue variations in the expressed isoforms of ROR that may differentially modulate the oscillatory relationship between Bmal1 gene expression and the other molecular clock elements (Emery & Reppert, 2004).
Tissue Comparison of the Molecular Clock Amplitude
Overall, there was a robust amplitude of rhythmic Per1
Gonadal Steroid Modulation of the Molecular Clock
There were small sex differences in the robustness of rhythmic clock gene expression in certain extra-SCN brain regions. In females, there were less robust Per1 and Per2 rhythms in the PL and IL, brain areas important in stress adaptation, fear extinction, and emotional control (Dalley et al., 2004; Jones et al., 2011; Quirk et al., 2006). This may reflect individual rat variations in rhythm parameters due to fluctuating gonadal hormone levels, as data for female rats in experiment 1 were pooled regardless of estrous cycle status. Perrin et al. (2006) demonstrated that PER2 protein amplitude changes depending on estrous cycle stage in the CEA and oval nucleus of the bed nucleus of the stria terminalis. There are sex differences in mPFC-modulated behaviors that rely on gonadal hormone status (Farrell et al., 2013; Fenton et al., 2014; Sutcliffe et al., 2007), and diurnal variations in performance of these tasks has also been shown in male rodents (Chaudhury and Colwell, 2002; Eckel-Mahan et al., 2008; Smarr et al., 2014; Woodruff et al., 2015). In contrast to the PFC, female rats exhibited more robust rhythmic Per1 and Bmal1 mRNA in the CA1 and CA3 hippocampal subregions compared with males, which in this brain region may be related to the greater amplitude of diurnal CORT levels in females (Suppl. Fig. 1; Atkinson & Waddell, 1997; Goel et al., 2014; Viau, 2002).
There was a distinct trend for the acrophase of female rats to be slightly phase delayed compared with males for all clock genes in nearly all brain regions (Fig. 5), which may be due to the influence of gonadal hormones. Previous studies have found that administration of estradiol or progesterone to ovariectomized rats, whether acute or chronic, alters the acrophase of clock gene expression in some peripheral tissues and the SCN (He et al., 2007; Nakamura et al., 2001, 2005, 2010; Smith et al., 2010). In addition, ovariectomy has been found to increase Per1 transcriptional synchrony between cells in the SCN and decrease synchrony in some peripheral tissues (Murphy et al., 2013). We also observed significant sex differences in Bmal1 mRNA expression within the CEA and MEA. Females had greater peak Bmal1 mRNA expression in the CEA and overall greater Bmal1 mRNA levels (mesor) in the MEA compared to males. The MEA has high concentrations of gonadal hormone receptors (Gray and Bingaman, 1996; Li et al., 1993; Merchenthaler et al., 2004; Simerly et al., 1990), and gonadal hormones may regulate overall Bmal1 mRNA expression levels in the amygdala subregions.
There was a trend for blunted aggregate clock gene rhythmic expression in females that have robust cycling of the estrous cycle compared with noncyclers. This difference was predominantly evident for Bmal1 mRNA expression in the PFC, where, in addition to a blunted amplitude, cycling females also had a slightly phase-advanced acrophase of Bmal1 mRNA compared with noncycling females (Fig. 7). This influence of an active estrous cycle may indicate that fluctuating gonadal hormone levels in female rats contribute to varying clock gene expression, resulting in blunted amplitude at the composite level. Our results are consistent with a study that found robust diurnal rhythm of PER2 protein in the CEA and the oval nucleus of the bed nucleus of the stria terminalis of ovariectomized female rats, whereas in nonovariectomized rats, the amplitude of PER2 protein rhythm varied with estrous cycle phase (Perrin et al., 2006).
Concluding Summary
We found 24-h rhythmic expression of both positive and negative regulatory clock genes within a network of brain regions important for emotional regulation in male and female rats. However, there was diversity in the acrophase of these molecular clocks that varied depending on brain region. In addition, females had a consistent and distinct trend to have acrophases slightly phase delayed compared with males. There were also small differences in the robustness of rhythmic clock gene expression that depended on sex and estrous cycle status, which may be due to activational effects of gonadal hormones. Further research is necessary to determine the basis and functional significance of the brain region variations in molecular clock phase relationships and how gonadal hormones may influence these molecular clocks. This knowledge may lead to a better understanding of the neurobiological basis of sex differences in risk for certain psychological disorders.
Footnotes
Acknowledgements
This work was supported by the National Institutes of Health (RO1 NIH MH75968).
References
Supplementary Material
Please find the following supplemental material available below.
For Open Access articles published under a Creative Commons License, all supplemental material carries the same license as the article it is associated with.
For non-Open Access articles published, all supplemental material carries a non-exclusive license, and permission requests for re-use of supplemental material or any part of supplemental material shall be sent directly to the copyright owner as specified in the copyright notice associated with the article.