
Abstract
Social jetlag represents the discrepancy between circadian and social clocks, which is measured as the difference in hours in midpoint of sleep between work days and free days. Previous studies have shown social jetlag to be associated with body mass index (BMI), glycated hemoglobin levels, heart rate, depressive symptoms, smoking, mental distress and alcohol use. The objective of our current study was to investigate, in a group of 145 apparently healthy participants (67 men and 78 women, aged 18-55 years, BMI 18-35 kg/m2), the prevalence of social jetlag and its association with adverse endocrine, behavioral and cardiovascular risk profiles as measured in vivo. participants with ≥2 h social jetlag had higher 5-h cortisol levels, slept less during the week, were more often physically inactive and had an increased resting heart rate, compared with participants who had ≤1 h social jetlag. We therefore concluded that social jetlag is associated with an adverse endocrine, behavioral and cardiovascular risk profile in apparently healthy participants. These adverse profiles put healthy participants at risk for development of metabolic diseases and mental disorders, including diabetes and depression, in the near future.
The endogenous circadian timing system optimally regulates our physiology and behavior relative to the 24-h day-and-night cycle of the earth. This internal clock is synchronized (entrained) by environmental factors: light and temperature. Shift work and time zone travel are well-known disruptors of the circadian rhythm, as they entail light and activity during the circadian night and sleep during the circadian day (Roden et al., 1993). Recent studies have identified disturbance of the circadian rhythm as a risk factor for metabolic diseases as well as mental disorders, including diabetes and depression (Scheer et al., 2009; Gonnissen et al., 2012; Hasler et al., 2012; Vyas et al., 2012; Caciari et al., 2013; Leproult et al., 2014). Shift work is a well-known form of circadian disruption and about 15% of the world’s adult population works shifts. A less known and even more prevalent type of disruption is social jetlag; in recent Internet-based studies, 69% of all participants reported at least 1 h social jetlag (Wittmann et al., 2006; Roenneberg and Merrow, 2007).
Social jetlag represents the discrepancy between circadian and social clocks; people often use alarm clocks and/or medication to align their sleep and wake times with social obligations (e.g., work and school schedules) rather than their internally regulated sleep-wake times (Wittmann et al., 2006; Roenneberg et al., 2012). Previous studies show a strong association between social jetlag and chronotype, with a later chronotype being associated with more social jetlag (Zavada et al., 2005; Roenneberg et al., 2012). Presumably, social jetlag is caused by chronotype differences; people with a naturally late chronotype (“evening people”) have to adjust to early social hours (work and school), leading to increased sleep debt during the workweek, which is compensated for during free days (Wittmann et al., 2006; Roenneberg et al., 2012). Negative effects of late chronotype, including associations with increased body mass index (BMI), fat intake and resting heart rate (Garaulet et al., 2010; Lucassen et al., 2013), might be explained by social jetlag.
Previous studies have shown that social jetlag is associated with BMI in an overweight population (Roenneberg et al., 2012), glycated hemoglobin levels in diabetes patients (Reutrakul et al., 2013), heart rate (Kantermann et al., 2013), depressive symptoms (Levandovski et al., 2011), smoking, mental distress, and alcohol use (Wittmann et al., 2006; Wittmann et al., 2010). However, most studies were questionnaire-based and included only shift-workers or patients. Up until now, it has been unknown to what extent social jetlag is present in a healthy population and whether it is associated with adverse endocrine, behavioral, and cardiovascular risk profiles as measured in vivo. We believe that this risk profile includes disturbances of the hypothalamic-pituitary-adrenal (HPA) axis, physical inactivity, increased heart rate and blood pressure, based on previous observations in shift workers as well as experimental studies (Scheer et al., 2009; Gonnissen et al., 2012; Kantermann et al., 2013). In the current study, we assess in a group of apparently healthy participants the prevalence of social jetlag and its association with in vivo–measured endocrine, behavioral and cardiovascular risk profiles.
Methods
Participants and Protocol
The Medical Ethical Committee of Maastricht University approved the study and written consent was obtained from all participants. We recruited apparently healthy, medication-free, nonsmoking Caucasian men (n = 68) and women (n = 79) with a limited alcohol intake (<10 units per week), aged between 18 and 55 years and with a BMI between 18 and 35 kg/m2. Participants were students and employees from Maastricht University recruited through posters and flyers. A medical history was obtained from each participant before entry into the study; exclusion criteria were chronic illness, depression, a history of eating disorders, severe sleeping problems and performing shift work. We excluded 2 participants who performed shift work.
We obtained the following information from each participant on weekdays (Monday-Wednesday).
Social Jetlag Status
Social jetlag status was determined using an adapted version of the Munich ChronoType Questionnaire (Roenneberg et al., 2003), which questions typical bedtimes and wake times on weekdays and on weekends or free days (Reutrakul et al., 2013). Social jetlag was measured as the difference in hours in midpoint of sleep between weekdays and weekends/free days (Wittmann et al., 2006). For example, when a person sleeps from 2200 h until 0600 h on weekdays, the midpoint is 0200 h, and when a person sleeps from 2400 h until 1000 h on weekends or free days, the midpoint is 0500 h, which results in a 3-h social jetlag.
Endocrine Profile
Participants came to the laboratory after an overnight fast. At 0800 h, an intravenous catheter for blood sampling was inserted into the forearm vein. Directly after insertion of the catheter the first blood sample (9 mL) was drawn (0 min) and after 15 min the participants received their breakfast (20% of the participants’ daily energy requirement). The daily energy requirements were calculated by multiplying the basal metabolic rate (BMR) by an activity index of 1.75. The BMR (MJ/day) was calculated according to the equations of Harris-Benedict (Lejeune et al., 2006). At 45, 90, and 210 min, the second, third and fourth blood samples were drawn. At 225 min, the participants received their lunch (30% of the participants’ daily energy requirement) and at 255 and 300 min the fifth and sixth blood samples were drawn. During the test, participants were able to drink water ad libitum.
Serum cortisol concentrations were measured using a radioimmunoassay (Buhlmann Laboratories) with an intra-assay coefficient variation of <6%. To measure endogenous cortisol exposure, we determined the participants’ 5-h cortisol levels by calculating the area under the curve (AUC) (0-300 min) (Rutters et al., 2009).
Behavioral Profile
Sleep quantity (hours) was calculated as the difference between sleep onset time and wake time. Chronotype was estimated using the mid-sleep time on weekends or free days, corrected for oversleep on weekends or free days: thus, chronotype = midpoint sleep on weekends or free days – (average sleep duration on weekends or free days – average sleep duration on weekdays/2) (Roenneberg et al., 2003; Roenneberg et al., 2012). General sleep quality, expressed as times awake during the night, was determined using the Pittsburgh sleep quality index (Buysse et al., 1989). Physical activity was determined using the Baecke questionnaire. The Baecke questionnaire, which has been validated against doubly labelled water, estimates activity from 3 components of activity: work, sport, and leisure activity (Philippaerts et al., 1999). For each component, a combination score is calculated based on type of activity × intensity × frequency. The total Baecke score is the sum of the 3 component scores and ranged in our population from 3.50 to 15.02.
Cardiovascular Risk Profile
Weight and height were measured with participants wearing light clothes only and BMI was calculated as weight/height squared (kg/m2). Waist circumference was measured according to a standardized procedure (Seidell et al., 1988). Blood pressure (mm Hg) and resting heart rate were measured with participants sitting after a 5-min rest, at the end of the test day, at approximately 1300 h. Both were determined twice on the right arm using a random-zero sphygmomanometer (WelchAllyn OSZ 5 Easy, Hechingen, Germany). The average of the 2 measurements was used for analyses.
Statistical Analysis
Descriptive values are expressed as mean ± standard deviation. There was no linear association between social jetlag and BMI, fasting cortisol, or 5-h cortisol levels (main outcome parameters), participants were categorized according to approximate tertiles of social jetlag: those with ≤1 h social jetlag (≤1 h), those with 1 h social jetlag (>1 h and <2 h) and those with ≥2 h social jetlag (≥2 h). Three models were used to study differences in endocrine, behavioral, and cardiovascular risk profiles between the social jetlag groups: linear and logistic regression models that were adjusted for age and sex (model 1); age, sex and average sleep duration (model 2); and age, sex, average sleep duration and chronotype (model 3). We observed no interaction for age or sex. Statistical analyses were performed with SPSS version 20.0 (SPSS Inc., Chicago, IL) and p ≤ 0.05 was considered to be statistically significant.
Results and Discussion
In the current study, we assessed in a group of apparently healthy participants (67 men and 78 women, aged 18-55 years, BMI 18-35 kg/m2) the prevalence of social jetlag and its association with in vivo–measured endocrine, behavioral and cardiovascular risk profiles. Table 1 describes the participant characteristics, stratified for men and women. On average, the men had lower cortisol levels, higher waist circumference, and higher systolic blood pressure compared with the women. No differences were observed in age, sleep duration, sleep quality, chronotype, physical activity, BMI, or heart rate.
Characteristics of male and female participants (N = 145).
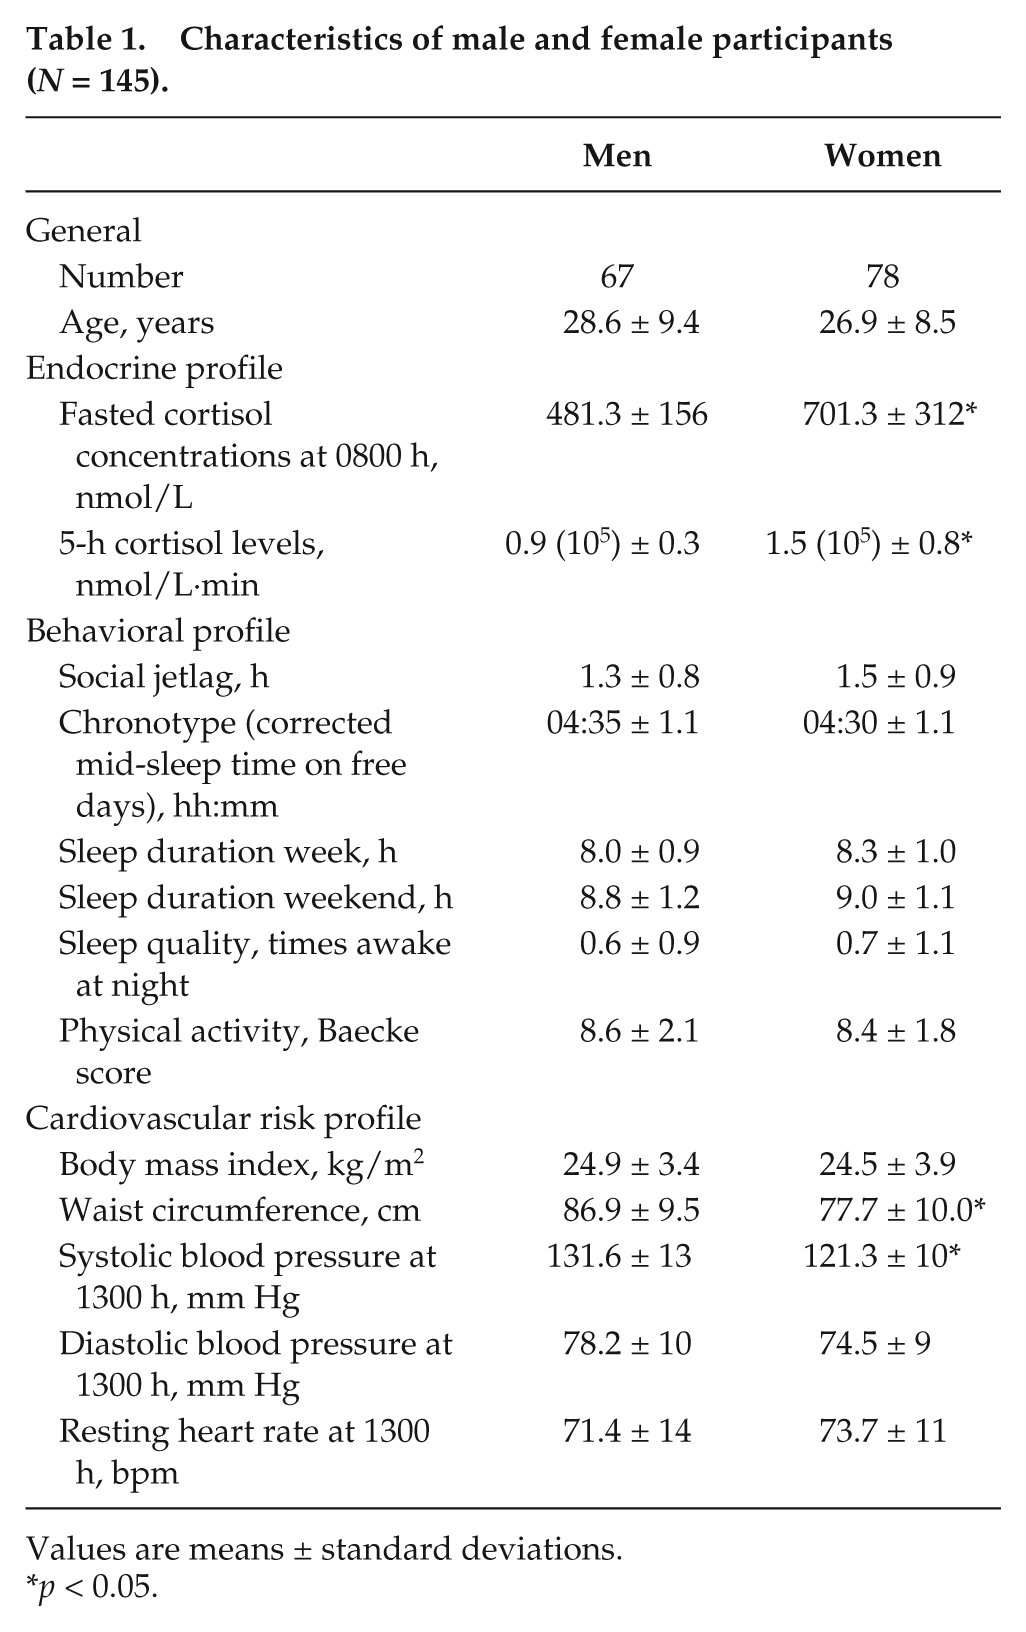
Values are means ± standard deviations.
p < 0.05.
We observed that 37% of our participants had ≤1 h social jetlag, 37% had 1 h, and 26% had ≥2 h. The prevalence of social jetlag is in line with previous studies (Wittmann et al., 2006; Roenneberg and Merrow, 2007; Roenneberg et al., 2012; Reutrakul et al., 2013), which indicates that social jetlag is a widespread phenomenon; over two-thirds of the (healthy) population could be at risk of social jetlag. In line with previous studies, social jetlag was strongly associated with chronotype (r = 0.19, 95% CI 0.09-0.30); however, no significant association between social jetlag and age was observed. Previous studies showed an inverse relationship between social jetlag and age (Wittmann et al., 2006; Roenneberg and Merrow, 2007; Roenneberg et al., 2012; Reutrakul et al., 2013), but these studies included a wider age range and our cohort consisted mainly of people <30 years old.
Table 2 represents the associations between social jetlag and the endocrine, behavioral and cardiovascular risk profiles. We compared participants with ≤1 h social jetlag to those with 1 h social jetlag or participants with ≥2 h social jetlag, all adjusted for age and sex. A significant association between social jetlag and an adverse endocrine profile was observed. Participants with ≥2 h social jetlag had increased 5-h cortisol levels during the day measured as AUC [1.4 (105) ± 0.6 nmol/L·h versus 1.1 (105) ± 0.6, p = 0.04], compared with those with ≤1 h social jetlag. Additionally, participants with ≥2 h social jetlag had notably higher fasting cortisol levels (671 ± 300 versus 538 ± 224 nmol/L, p = 0.05) (Figure 1). Similar changes in cortisol levels have been observed in experimental, constant routine studies in which the circadian rhythm was disrupted by a 9-h phase delay, controlling for circadian phase differences (Scheer et al., 2009; Gonnissen et al., 2012), as well as in an experimental study mimicking social jetlag for 1 week (Pejovic et al., 2013). These results suggest that social jetlag disrupts the HPA axis, which is thought to predispose to visceral obesity and other chronic diseases (Rutters et al., 2009). Tendencies toward higher cortisol levels were observed in participants with 1-h social jetlag (>1 h and <2 h) compared with those with ≤1 h social jetlag, although these differences were not statistically significant.
Participant characteristics in categories of social jetlag as well as associations between social jetlag and endocrine, behavioral and cardiovascular risk factor profiles.
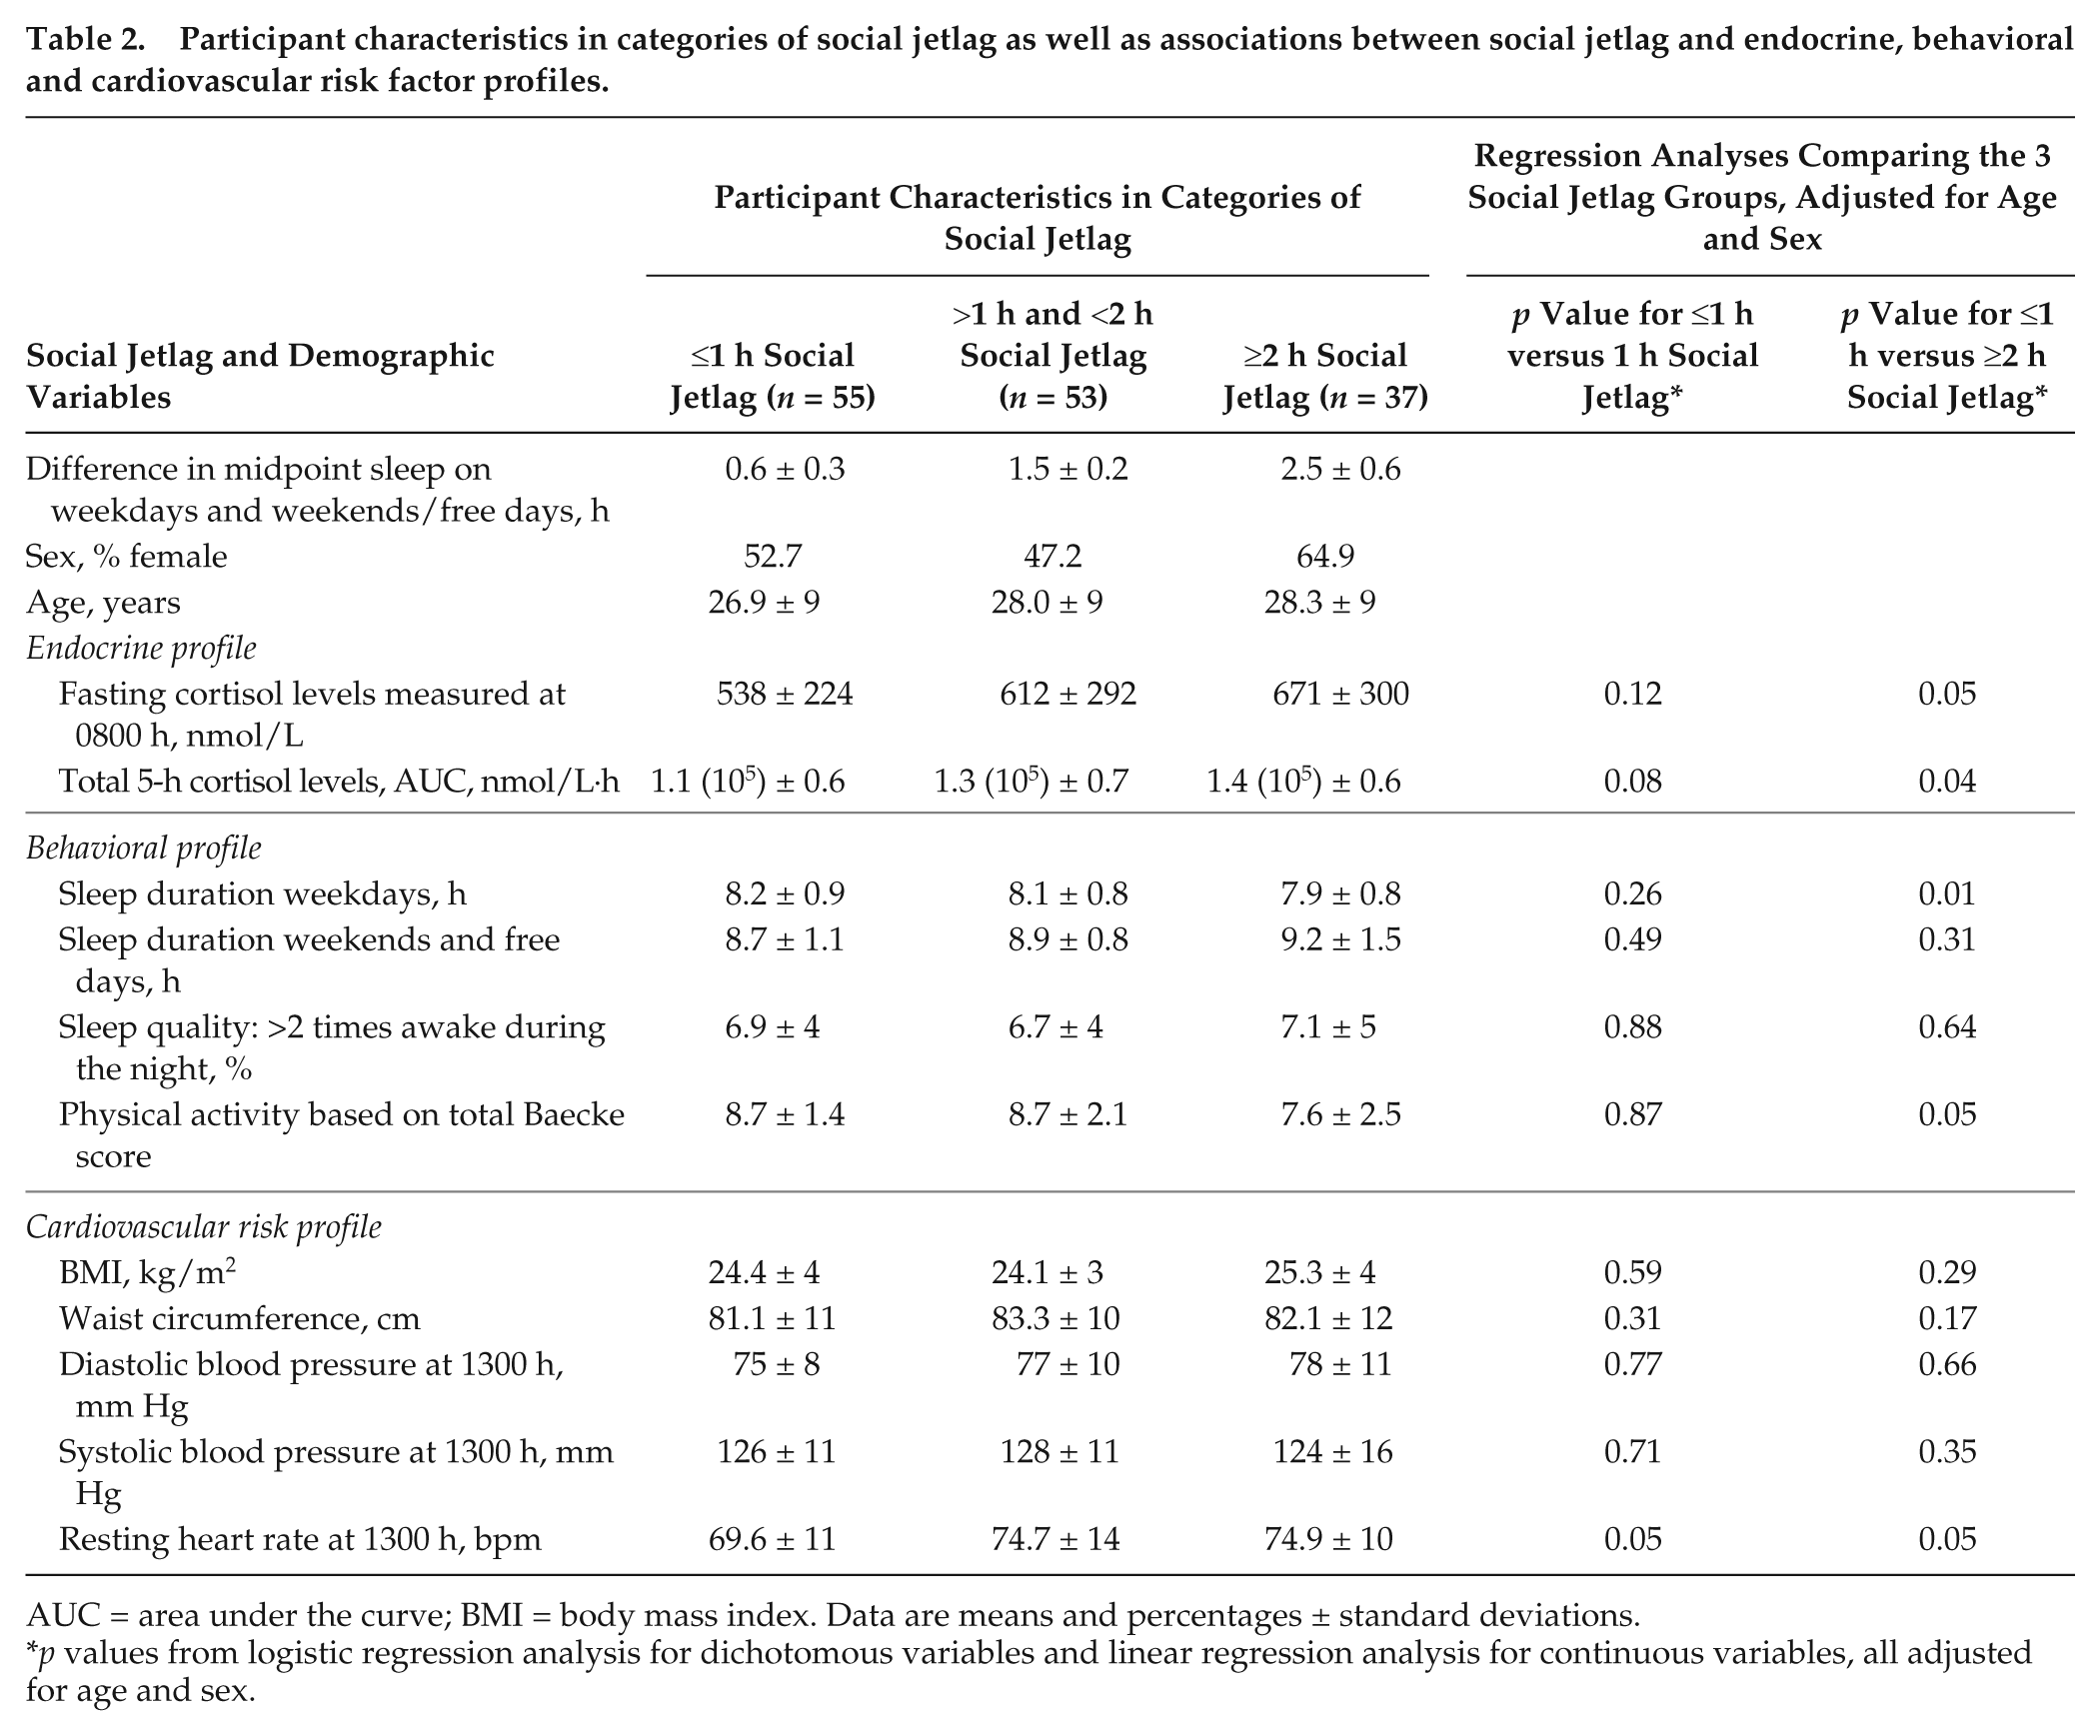
AUC = area under the curve; BMI = body mass index. Data are means and percentages ± standard deviations.
p values from logistic regression analysis for dichotomous variables and linear regression analysis for continuous variables, all adjusted for age and sex.
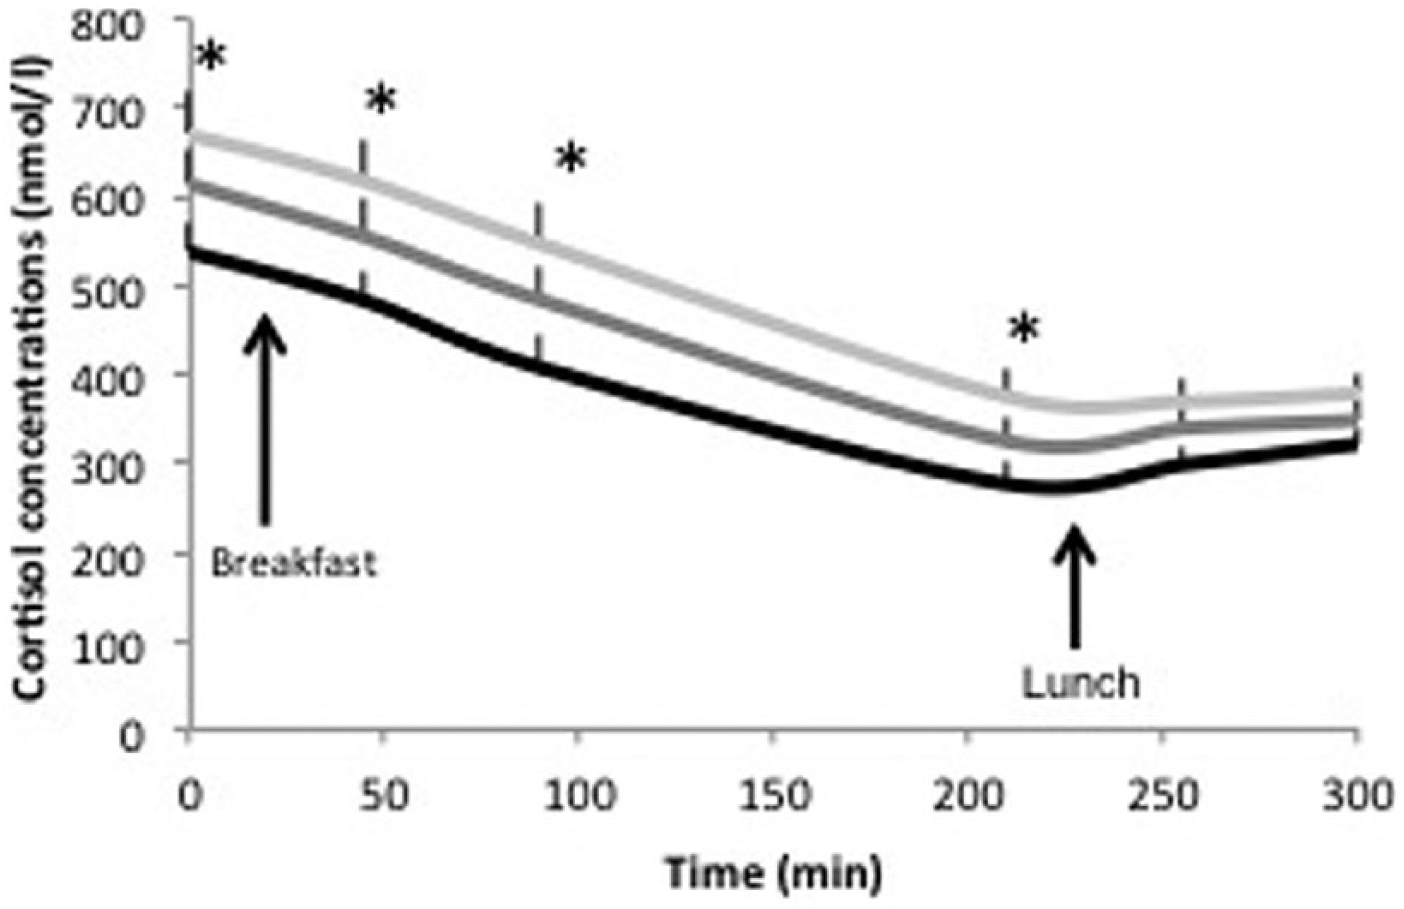
Cortisol concentrations (nmol/L) over a 5-h time period in apparently healthy participants with ≤1 h social jetlag (black, n = 55), with >1 h and <2 h social jetlag (dark gray, n = 53), and with ≥2 h social jetlag (gray, n = 37). Cortisol concentrations are given as mean ± SEM. *p < 0.05 values from multiple regression analysis for cortisol concentrations comparing no social jetlag to ≥2 h social jetlag, all adjusted for age and sex.
We observed significant associations between social jetlag and behavioral factors. Participants with ≥2 h social jetlag slept less on weekdays (7.9 ± 0.8 versus 8.2 ± 0.9 h, p < 0.01), compared with those with ≤1 h social jetlag. These results are in concordance with findings of previous studies (Wittmann et al., 2006; Roenneberg et al., 2007; Levandovski et al., 2011; Roenneberg et al., 2012). Additionally, participants with ≥2 h social jetlag were less physically active based on a lower total Baecke questionnaire score (7.6 ± 2.5 versus 8.7 ± 1.4, p = 0.05), compared with those with ≤1 h social jetlag. We are the first to show that participants with social jetlag are more physically inactive compared with those without social jetlag. No significant differences in sleep duration on weekends/free days or sleep quality were observed between participants with ≥2 h, 1 h, or ≤1 h social jetlag. Overall, these findings show that participants with social jetlag sleep less on weekdays and are less physically active, which adds to the risk for chronic diseases.
We observed significant associations between social jetlag and cardiovascular risk factors; participants with 1-h social jetlag and ≥2 h social jetlag had a significantly higher resting heart rate in the afternoon, compared with those with ≤1 h social jetlag (74.7 ± 14 and 74.9 ± 10 versus 69.9 ± 11 bpm, p = 0.05). Similar changes in heart rate were observed in experimental studies in which the circadian rhythm was disrupted (Scheer et al., 2009; Scheer et al., 2010) and in an observational study in shift workers with social jetlag (Kantermann et al., 2013). We observed no significant differences in BMI, waist circumference, or systolic and diastolic blood pressures. Our null findings on BMI and waist circumference are in concordance with previous Internet-based studies that only showed an association between social jetlag and BMI in overweight participants and not in lean participants (Roenneberg et al., 2012). We are, however, the first to show that social jetlag is associated with increased resting heart rate in apparently healthy participants, which suggests increased activation of the sympathetic nervous system. Together with the finding on increased HPA axis activation, this finding suggests that negative effects of social jetlag are driven by an increased stress response, which in turn results in further negative effects (Bjorntorp, 2001).
Finally, when the linear and logistic regression models were adjusted for age, sex and average sleep duration, we observed very similar differences in endocrine, behavioral and cardiovascular risk profiles between the social jetlag groups. For example, after the additional correction for average sleep duration, participants with ≥2 h social jetlag still had significantly increased cortisol levels during the day (beta = 28,332, 95% CI 512 to 56,152), compared with those with ≤1 h social jetlag. Similarly, when the models were adjusted for age, sex, average sleep duration and chronotype, we observed similar significant differences. For example, after the additional correction for chronotype, participants with ≥2 h social jetlag had increased cortisol levels during the day (beta = 28,885, 95% CI 523 to 57,247), compared with those with ≤1 h social jetlag. These findings suggest that the association between social jetlag and adverse risk profiles is not caused solely by short sleep duration or chronotype. The findings support the hypothesis that social jetlag is caused by chronotype differences, mediating the association between chronotype and adverse risk profiles.
Our study has some limitations that warrant discussion. First, we had a relatively small and homogenous cohort of apparently healthy, nonsmoking participants, all recruited from the vicinity of the university, which might result in underestimation of the deleterious health effects of social jetlag in the general population. Due to this selection, our results are not nationally representative and we were not able to study possible mediating factors such as alcohol intake, smoking and socioeconomic status. Second, we did not perform a prospective study, which makes it difficult to determine cause and effect. Third, bedtimes and wake times are self-reported; however, self-reported sleep duration is highly correlated with habitual sleep duration (Kushida et al., 2001). Fourth, we used an adapted version of the Munich ChronoType Questionnaire from 2003 to assess social jetlag (Roenneberg et al., 2003; Wittmann et al., 2006). This version questions sleep and wake times on weekdays and on weekends and free days and does not inquire about the use of an alarm clock on weekends and free days, which might lead to an underestimation of social jetlag, while our current estimates of sleep and wake times on weekends and free days would be earlier when compared with days with unrestricted sleep and wake times. Finally, we did not exclude individuals who recently travelled across time zones. We do not expect this to be a strong confounder, because such time zone travel is infrequent in this population. Future research on social jetlag should therefore consist of a large, prospective, population-based cohort, including sleep recordings using accelerometers and control for time zone travel and alarm clock use in the weekends.
A strength of our study is that we are the first to measure several endocrine, behavioral and cardiovascular factors in vivo instead of collecting self-reported measures. Overall, we observed that apparently healthy participants with ≥2 h social jetlag had significantly higher 5-h cortisol levels, slept less on weekdays, were more physically inactive and had an increased resting heart rate. However, further in vivo research in larger and more diverse groups is necessary to confirm these findings. Our research does show the high prevalence of social jetlag in apparently healthy participants and its negative effects. Possible interventions targeting social jetlag, including simple behavioral modifications such as keeping a regular sleep-wake schedule, could therefore have beneficial effects on endocrine, behavioral, and cardiovascular profiles.
In summary, we conclude that social jetlag is associated with an adverse endocrine, behavioral and cardiovascular risk profile in apparently healthy participants. These adverse profiles put healthy participants at risk for development of metabolic diseases as well as mental disorders, including diabetes and depression, in the near future.
Footnotes
Acknowledgements
We thank our participants for their participation in this study. FR and SGL carried out the study and collected the data. FR analyzed and wrote the largest part of the manuscript. SGL, TCA, MAB, PJE, GN and JMD reviewed the manuscript.
Conflict of Interest Statement
The author(s) have no potential conflicts of interest with respect to the research, authorship, and/or publication of this article.