
Abstract
Birds seasonally switch from one life history state (LHS) to another to maximize their fitness. Accordingly, they exhibit distinct differences in their physiological and behavioral phenotypes between seasons. Possible molecular mechanisms underlying changes through the seasons have scarcely been examined in migratory birds. The present study measured key genes suggested to be involved in the metabolic regulation of 4 photoperiodically induced seasonal LHSs in a long-distance migratory songbird, the blackheaded bunting (Emberiza melanocephala). Buntings were held under short days (8 h light:16 h darkness, 8L:16D), during which they maintained the winter nonmigratory phenotype. Then they were exposed for several weeks to long days (13L:11D). Differences in the activity-rest pattern, body fattening and weight gain, testis size, organ (heart, intestine) weights, and blood glucose and triglyceride levels confirmed that buntings sequentially exhibited spring migration–linked premigratory, migratory, and postmigratory LHSs under long days. The mRNA levels of circadian genes involved in metabolism (Bmal1, Clock, Npas2, Rorα, and Rev-erbα) and of genes that encode for proteins/enzymes involved in the regulation of glucose (Sirt1, FoxO1, Glut1, and Pygl) and lipids (Hmg-CoA; Pparα, Pparγ; Fasn and Acaca) showed LHS-dependent changes in their light-dark expression patterns in the hypothalamus and liver. These initial results on genetic regulation of metabolism in a migratory species extend the idea that the transitions between LHSs in a seasonal species are accomplished by changes at multiple regulatory levels. Thus, these findings promise new insights into the mechanism(s) of adaptation to seasons in higher vertebrates.
Most vertebrates exhibit distinct daily and seasonal cycles in their physiology and behavior, as governed by circadian (circa = about, dian = day) and circannual (circa = about, annum = year) clocks (Kumar et al., 2010; Rani and Kumar, 2013), respectively. A circadian clock in vertebrates including birds is constituted by a transcriptional-translational feedback loop composed of gene sets forming positive (Clock/Npas2 and Bmal1) and negative (Per and Cry) limbs (Reppert and Weaver, 2002; Bell-Pedersen et al., 2005; Kumar and Singh, 2006). An additional loop involves nuclear orphan receptor genes, namely, Rors and Rev-erbs (Bell-Pedersen et al., 2005). However, an equivalent molecular feedback loop has not been shown for circannual timing (Kumar et al., 2010).
The circadian clock genes are involved in energy homeostasis by regulating the metabolism of carbohydrates and lipids, the major sources of metabolic fuels (Peek et al., 2012; Mazzocoli et al., 2012). Bmal1 contributes to insulin secretion, lipogenesis, and adipogenesis in mice (Marcheva et al., 2010; Shimba et al., 2005), and inactivation of Bmal1 and Clock suppresses diurnal variations in blood glucose and triglyceride levels in mice (Rudic et al., 2004). Similarly, Rev-erbα affects lipid and cholesterol biosynthesis in the liver as well as fatty acid and carbohydrate oxidation in mice (Feng et al., 2011). Rorα also affects steroid metabolism in mice (Duez and Staels, 2008). Further, in addition to the contribution to circadian clock (Belden and Dunlap, 2008) and clock-mediated metabolic effects (Nakahata et al., 2008, 2009), Sirt1 affects glucose regulation by modulating insulin sensitivity through FoxO1 (Sun et al., 2007). In addition, several genes not directly connected to the circadian clock contribute to carbohydrate (FoxO1, Glut1, Pygl) and lipid (Hmgcr or Hmg-CoA, Acaca, Pparα, Pparγ, Fasn) regulation in mammals. Hypothalamic FoxO1 regulates food intake, and hence energy balance (Sun et al., 2007) and lipid metabolism, in mice and humans (Matsumoto et al., 2006; Kim et al., 2006). Also, Glut1, 1 of the 11 glucose transporter genes of the Glut family, has been shown to be responsible for the maintenance of basal glucose levels (Uldry and Thorens, 2004). Energy supply by stored glycogen is also made available by the action of the Pygl gene encoding the glycogen phosphorylase enzyme, catalyzing the degradation of glycogen to glucose-1-phosphate and through further biochemical steps to glucose (Bhagavan, 2001). Similarly, Hmg-CoA encoding for the rate-limiting reductase enzyme for cholesterol biosynthesis (Rodwell et al., 1976) regulates serum lipoprotein metabolism (Goldstein and Brown, 1990), and the Fasn gene encoding the fatty acid synthase enzyme catalyzes the synthesis of saturated fatty acids via de novo lipogenesis (Wakil, 1989; Schmid et al., 2005). Ppars (Pparα, Pparγ), the ligand activated transcription factors, are also involved in lipid metabolism (Latruffe and Vamecq, 1996).
However, genes regulating changes in metabolism through the seasons remain poorly understood in vertebrates. To this end, a migratory bird is an ideal system, for it exhibits clear differences in its seasonal phenotypes linked with migration, reproduction, and molt, with each phenotype described as a life history state (LHS; Wingfield, 2008; Malik et al., 2014). Each year, a migrant species exhibits 2 migratory LHSs, the spring and autumn migration, placed before and after the reproductive LHS, respectively (Wingfield, 2008; Malik et al., 2014). The nonmigratory and migratory LHSs with easily distinguishable behavioral phenotypes can serve as reliable markers for the seasonal LHSs in avian migrants. A night migrant undergoes a period of hyperphagia, fattening and gains in body mass, but remains day active in the days prior to migration (the premigratory state; Jain and Kumar, 1995). With the onset of the migratory state, there occurs a behavioral shift in the night migrants: they become predominantly night active and show intense nighttime restlessness, characterized by wing whirring in caged birds (Zugunruhe; Gwinner and Czeschlik, 1978; Rani et al., 2006). Postmigration, birds lose fat, become lean, and return to predominant day activity. In parallel with the behavioral shifts, there is a phase inversion of brain activity, particularly in areas implicated in the regulation of seasonal migration, namely, the olfactory and visual sensory circuits and mediobasal hypothalamus (Rastogi et al., 2011, 2013). In captivity, exposure to short and long photoperiods can faithfully induce the nonmigratory and migratory phenotypes, respectively, in migratory birds. Photoperiodic induction of premigratory body fattening and weight gain, and the daily manifestation of Zugunruhe, has been shown to be under circadian clock control in night-migratory songbirds (Tewary and Kumar, 1983; Kumar, 1988; Bartell and Gwinner, 2005; Rani et al., 2006).
The present study was carried out on the night-migratory blackheaded bunting (Emberiza melanocephala), which overwinters in India (Ali and Ripley, 1974). In captivity, buntings maintain the winter nonmigratory phenotype under short days. On exposure to long days (≥12 h), they sequentially exhibit the premigratory (initiation of body fattening and testis recrudescence but no Zugunruhe), migratory (fattened body, enlarged testes, and intense Zugunruhe), and postmigratory (regressed gonads and return to daytime activity) phenotypes (Rani et al., 2006; Misra et al., 2004; Gupta and Kumar, 2013). The spring Zugunruhe in buntings is initiated after about 2 wk and terminates with gonadal regression and onset of molt after several weeks of long-day exposure (Rani et al., 2006; Rastogi et al., 2011, 2013). A distinction between the photoperiodic-induced LHSs can also be made based on the reproductive phenotypes, namely, refractory, prebreeding, breeding, and postbreeding.
We propose that seasonal LHSs in migratory blackheaded buntings are accompanied by changes at the level of gene expression, particularly in the expression of genes implicated in glucose and lipid metabolism, the major sources of metabolic fuels. To examine this, we measured the mRNA levels of circadian clock and nonclock genes in the hypothalamus and liver during photoperiodically induced LHSs. In migratory buntings, the hypothalamus is the site of seasonal timing and possibly involved in energy (food) intake and regulation of migration (Rastogi et al., 2011, 2013), while the liver as principal metabolic center shows a daily rhythm in clock gene expression (Singh et al., 2013). We expected a difference in the expression levels of hypothalamic “gene switches,” should they regulate the transitions in metabolic states between LHSs in migratory birds. Similarly, an increased and decreased expression was expected of genes involved in energy homoestasis and metabolism in the liver, in parallel with changes in the migratory phenotype in buntings under short and long days. In this study, all 4 photoperiodically induced LHSs, characterized by distinct behavioral phenotypes in buntings, were considered as separate LHSs, despite an overlap between migration- and reproduction-linked events.
Materials and Methods
Blackheaded buntings, long-distance Palearctic–Indian migrant songbirds, travel south in the autumn (fall or autumnal migration) to their wintering grounds around ~25° N in India, overwinter, and return north in the following spring (spring or vernal migration) to their breeding grounds around ~40° N in west Asia and east Europe (Ali and Ripley, 1974). Adult males were procured from the overwintering flocks in late February 2011. At this time, buntings do not have fat depots (body mass = 25-27 g; fat score = 0) and testes are small and reproductively inactive (testis volume = 0.33 to 0.52 mm3). Birds were kept in an outdoor aviary (size = 3 × 2.5 × 2.5 m) for a week and thereafter moved indoors in an aviary (size = 2.2 × 1.8 × 2.8 m) and maintained on short days (8 h light:16 h darkness, 8L:16D; temperature = 22 ± 2 °C) until used in the experiment, beginning in November 2011. Under short days, buntings remain unstimulated (do not deposit fat or grow testes and maintain their body mass) and maintain sensitivity to long-day stimulation (Misra et al., 2004). These birds are called photosensitive birds, and when exposed to long days, they exhibit spring migration–linked phenotypes (Misra et al., 2004; Rani et al., 2006).
Experiment
The experiment was carried out at the Department of Zoology, University of Lucknow, Lucknow, India, in accordance with the guidelines of the Institutional Animal Ethics Committee. Photosensitive birds, which had experienced an almost similar number of short days, were distributed in 4 groups (groups 1 to 4, n = 12-14 birds each) and singly housed in activity-recording cages (size = 60 × 40 × 35 cm) that were individually placed in photoperiodic boxes (size = 71 × 67 × 48 cm) providing 8 h of light per day (8L:16D; L = 100 lux; D = <1 lux). This was considered day 0 of the experiment. Each activity cage was provided with 2 perches mounted with an infrared motion sensor that continuously detected the bird’s movement in its cage and transmitted it to a computerized data acquisition system. Temperature was kept constant at 22 ± 2 °C, and food and water were provided ad libitum.
After a week in short days, groups of 2 to 4 birds were exposed to long days (13L:11D) for varying durations, so that they would be in different seasonal LHSs at the time of sampling. Group 1, however, remained on short days for another week. To measure changes in mRNA levels, birds (n = 5-7) were sacrificed by decapitation in the middle of the day and night of a photoperiod-induced LHS, as described below. Group 1 birds were sampled on day 15 of the experiment in the middle of 8 h light and 16 h darkness of the short days, during which they maintained the nonmigratory phenotype. Group 2 birds were sampled after the first 7 long days (i.e., on day 15 of the experiment), in the middle of 16 h light and 8 h darkness of the long days. At this time, the birds were photostimulated with an increased body fattening and weight gain and initiated testis recrudescence, but they were still day active (premigratory phenotype). Similarly, group 3 birds were sacrificed in the middle of light and dark periods of long days after they had shown 7 to 10 nights of Zugunruhe (photostimulated migratory phenotype) and were fully fattened and gained in body mass and gonadally recrudesced. Because of individual variations in the onset of Zugunruhe, the sampling time of this group was scattered between 30 and 35 d of the experiment. Group 4 birds were continued on long days for several weeks and sampled in the middle of light and dark periods of long days after 100 d of the experiment when they had stopped showing Zugunruhe and were gonadally regressed (postmigratory, photorefractory phenotype).
Measurement of Seasonal Phenotypes and Associated Physiological Changes
Measurement of seasonal phenotypes
The Chronobiology Kit software program from Stanford Software Systems (Santa Cruz, CA) was used to collect data on daily activity, as described in our earlier publications (Malik et al., 2004; Singh et al., 2010). Two days before each sampling, the food intake of each bird was recorded as described by Kumar et al. (2001). Briefly, food intake over 2 d for each individual was calculated from the difference between the food supplied and recovered after 24 h (light onset to next-day light onset). From this, food intake (g/bird/d, mean ± SE) for each group was calculated. On the day of sampling, fat deposition was subjectively scored on a scale of 0 to 5 (0 = no visible fat depot, 5 = heavy fat bulging all over the abdomen; Kumar et al., 1991), and body mass was recorded using a top-pan balance to an accuracy of 0.1 g. A 200-µL blood sample was collected by puncturing the wing vein before the bird was sacrificed. Plasma was harvested and stored at −20 °C until assayed for glucose and triglycerides. Brain (hypothalamus) and liver tissues were harvested and stored in the RNA later (AM7020; Ambion, Grand Island, NY), first overnight at 4 °C and then at −80 °C until assayed for mRNA. Also, testes, heart, and intestine were dissected out. Heart and intestine were weighed to determine the changes in these organs during different LHSs. The intestine was cut open longitudinally, rinsed in 0.75% NaCl, and blotted dry before it was weighed. The dimensions of the left testis were measured, and testis volume (TV) was calculated using the formula 4/3 π ab2, where a and b denote half of the short and long axes, respectively.
Measurement of blood glucose and triglycerides
Plasma glucose and triglycerides were measured using QuantiChromTM glucose (DIGL-100) and EnzyChromTM triglyceride (ETGA-200) assay kits, respectively, by enzyme-linked immunoabsorbent assay (ELISA) as per the manufacturer’s protocol (BioAssay Systems, Hayward, CA). Briefly, plasma samples were allowed to thaw on ice before they were processed for ELISA. For glucose assay, standards were diluted in distilled water at the final concentrations of 300, 200, 100, and 50 mg/dL; a distilled water sample (blank) served as the control. Five microliters of each of the samples, blank and standards mixed with 500 µL reagent solution, were put first for 8 min in boiling water and then allowed to cool at room temperature for 4 min in a water bath. Thereafter, a 200-µL aliquot of a reaction solution was transferred to an individual well in a 96-well plate, and the optical density (OD) was measured at 630-nm wavelength on a microplate reader (SpectraMaxM2; Molecular Devices, Sunnyvale, CA). The concentration of glucose in a sample was calculated as follows: glucose (mg/ dL) = OD sample – OD blank/slope.
Triglycerides were measured in a 10-µL aliquot of a 5-fold diluted plasma sample in distilled water; a distilled water sample (blank) served as the control. The standards were diluted in distilled water at the final concentrations of 1, 0.6, and 0.3 mmol/ L. Each sample (plasma, blank, and standard) was mixed with a 100-µL aliquot of the working reagent (a mix of 100 µL assay buffer, 2 µL enzyme mix, 5 µL lipase, 1 µL ATP, and 1 µL dye) and incubated for 30 min at room temperature. The OD was measured at 570-nm wavelength on a microplate reader (SpectraMaxM2; Molecular Devices). The concentration of triglycerides in a sample was calculated as follows: triglycerides (mmol/ L) = (OD sample – OD blank/slope) × N, where N = plasma dilution factor.
Cloning, Partial cDNA Sequencing, and Measurement of mRNA Levels
Cloning and partial gene sequencing
Total RNA was extracted using Tri Reagent solution (AM9738; Promega, Madison, WI) as per the manufacturer’s protocol and as described in a recent publication from our laboratory (Singh et al., 2013). Briefly, cDNA was prepared from 1 µg DNase (M610A, Promega) treated RNA using RevertAidFirst Strand cDNA Synthesis kit (K1622; Thermo Scientific, Waltham, MA). Degenerate primer sequences (Suppl. Table S1) were used to amplify partial sequences from brain or liver tissue cDNA templates of circadian genes involved in metabolism (Bmal1 [Brain and muscle arnt like protein 1], Clock [circadian locomotor output cycles kaput], Npas2 [neuronal PAS domain protein 2], Rorα [retinoid-related orphan receptor], Rev-erbα [reverse transcript of erythroblastosis gene]) and of genes that encode enzymes involved in carbohydrate (Sirt1 [silent mating type information regulation 2 homologue type 1], Glut1 [glucose transporter 1], FoxO1 [forkhead box protein O1], Pygl [phosphorylase, glycogen, liver]) and lipid (Hmgcr or Hmg-CoA [3-hydroxy-3-methyl-glutaryl-CoA reductase], Acaca [acetyl-CoA carboxylase 1]; Pparα and Pparγ [peroxisome proliferator-activated receptors], Fasn [fatty acid synthase]) metabolism. The polymerase chain reaction (PCR) conditions consisted of sequential cycles of 94 °C/3 min (1 cycle), 94 °C/1 min, T °C/1 min, and 72 °C/1 min (34 cycles), 72 °C/7 min (1 cycle), and 4 °C/hold at primer-specific annealing temperature (Suppl. Table S1). Desired amplified product as visualized on 1.2% agarose gel was harvested and purified using a Qiagen gel extraction kit (Qiagen Cat. 28704). This was ligated to a cloning vector (pGemT-easy, Promega Cat. 1360) and transformed into Escherichia coli DH5α colonies. Plasmids with gene-specific amplicon inserts were extracted using a QIAprep Spin miniprep kit (Qiagen Cat. 27104), and clone inserts were confirmed by restriction digestion using EcoRI restriction enzyme. Positive clones were commercially sequenced by Eurofin (Bangalore, India) and compared with available sequences from other species in the NCBI database by BLAST analysis (Suppl. Table S1).
Measurement of mRNA levels (quantitative PCR)
Gene-specific primers for real-time PCR (qPCR) designed from the partially cloned sequences (Suppl. Table S2) by Primer 3 plus online program were used to amplify and quantify transcripts of the candidate genes by ABI Step One Plus real-time PCR using power SYBR green chemistry. Each run included beta-actin as reference gene, a nontemplate control, and a sample that lacked reverse transcriptase in the cDNA synthesis. The mRNA levels were quantified using the ΔΔCt method (Livak and Schmittgen, 2001), as described in a publication from our laboratory (Singh et al., 2013).
Statistical Analysis
Data on food intake, body mass, fat score, testis size, and organ weight were pooled for the day and night samples for the purpose of presentation and statistical analyses. One-way analysis of variance (ANOVA), followed by the Newman-Keuls test, determined the significance of differences between the 4 LHSs in these parameters. Student t test compared blood glucose and triglyceride levels and gene expression levels between day and night within a group. Two-way ANOVA followed by Bonferroni post hoc test was used for analyzing together the effects of LHS (factor 1) and time of day (day and night; factor 2) on blood glucose and triglyceride levels. These statistics were performed by GraphPad Prism version 5 (San Diego, CA). Further, in addition to 2-way ANOVA, we analyzed our data sets on gene expression using a general linear model (GLM) test. This considered LHS, time of day (day/night), and tissue (hypothalamus and liver) together as factors (tissue = within-subject factor; LHS and time of day = between-subject factor) by SPSS version 16. The ANOVA statistics given in the results are mainly from the GLM test. A few birds that died during the experiment were excluded from the statistical analysis.
Results
Photoperiod-Induced Seasonal Phenotypes and Associated Physiological Changes
Under short and long days, buntings exhibited distinct phenotypes representing 4 different seasonal LHSs (Fig. 1). Under short days, birds were day active and did not fatten or recrudesce their testes (photosensitive unstimulated, nonmigratory phenotype; Fig. 1a-c, e). Under long days, buntings underwent different LHSs (Fig. 1). Initially, they were day active but showed the initiation of fat deposition and gain in body mass as well as testis recrudescence by the end of the first week of long days (photosensitive stimulated, premigratory phenotype; Fig. 1a-c, e). Subsequently, buntings exhibited a behavioral shift with predominant activity at night (intense nighttime restlessness, Zugunruhe; photostimulated migratory phenotype) and were fat and had recrudesced testes (Fig.1a-c, e). On continued exposure to long days, buntings stopped showing Zugunruhe and returned to day activity, lost body fat, and were gonadally regressed (photorefractory, postmigratory phenotype; Fig. 1a-c, e). Thus, there were significant differences in fattening (F3,44 = 35.68, p < 0.0001; Fig. 1b), body mass gain (F3,44 = 43.67, p < 0.0001; Fig. 1c), and testicular size (F3,44 = 178.1, p < 0.0001; Fig. 1e; one-way ANOVA) between the 4 LHSs. In general, there was significantly greater fat, greater body mass gain, and larger testes during the premigratory, migratory, and postmigratory states than during the nonmigratory state (Fig. 1b, c, e). Also, birds had significantly greater fat, body mass gain, and larger testes in the migratory state than in the other 3 LHSs (p < 0.05, Newman-Keuls post hoc test; Fig. 1b, c, e). However, the 3 parameters did not differ between premigratory and postmigratory states (cf. Fig. 1b, c, e). In parallel, there was also a significant difference in food intake among the 4 LHSs (F3,44 = 11.85, p < 0.0001; one-way ANOVA; Fig. 1d), with a significantly higher food intake in premigratory than in the other 3 LHSs (p < 0.05, Newman-Keuls post hoc test; Fig. 1d).
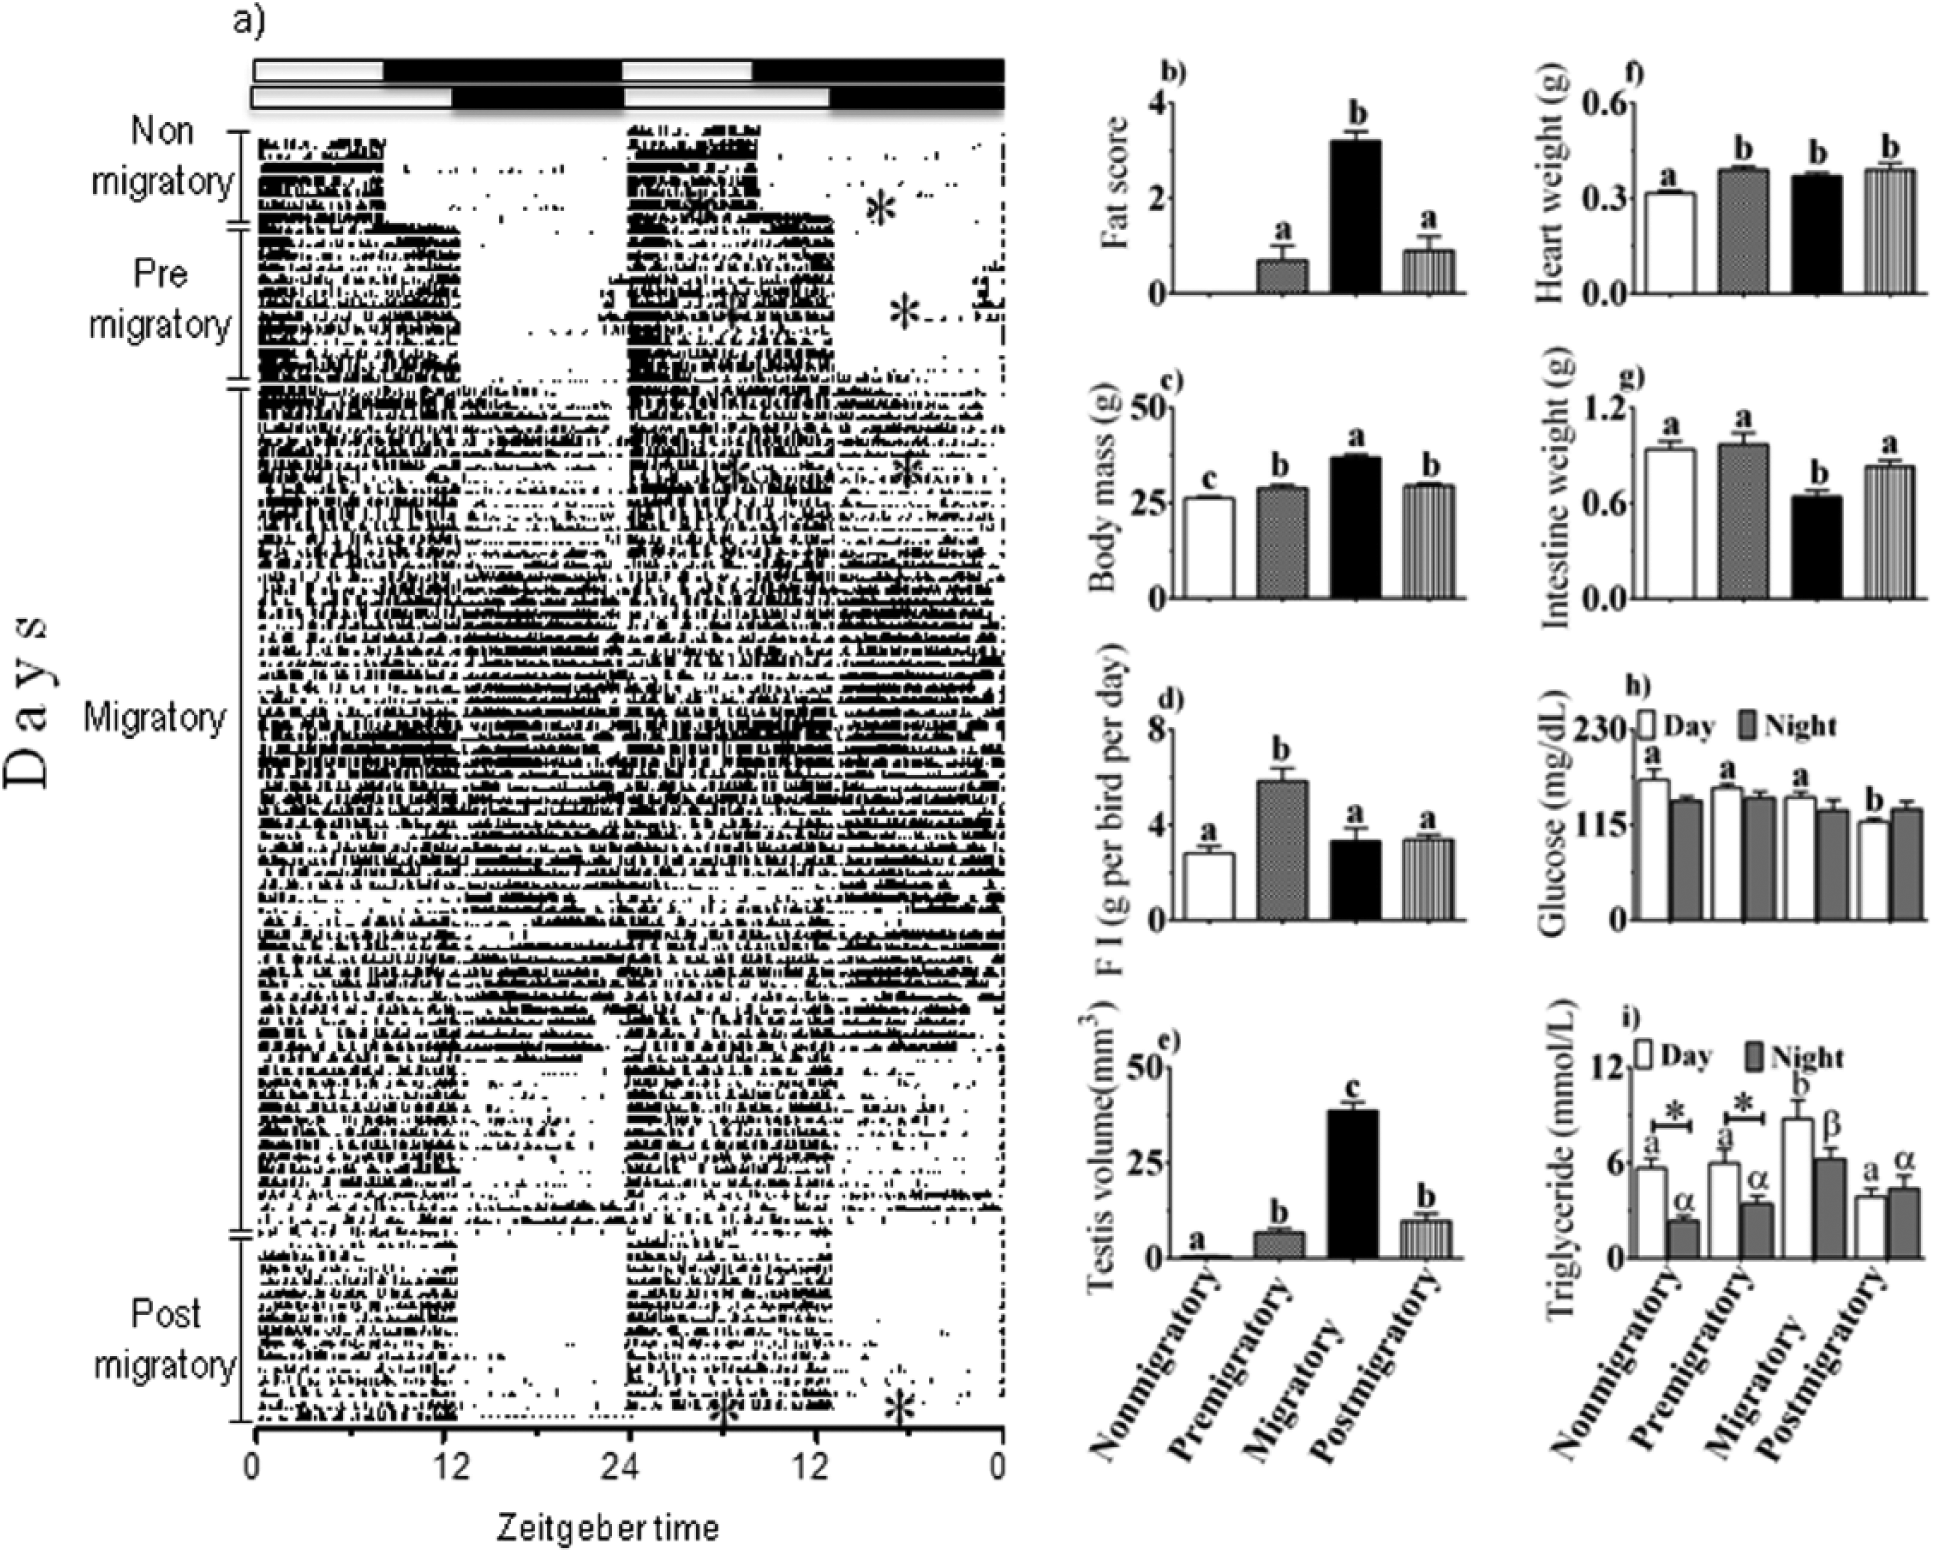
(Left panel) Activity recording (actogram, a) of a representative blackheaded bunting (Emberiza melanocephala) exposed first to short days (8 h light:16 h darkness, 8L:16D) and then to long days (13L:11D). Asterisk (*) within the actogram indicates the projected time of sampling in different life history states (LHSs) indicated vertically on the left. The right 2 panels show mean (±SE) fat score (b), body mass (c), food intake (d), testis size (e), organ weights (heart, f; intestine, g), plasma glucose level (h), and triglyceride level (i). Similar alphabet or Greek letter on bars indicates no difference, while different alphabet or Greek letter indicates a significant difference between LHSs (p < 0.05, Bonferroni test). Open and closed bars in (h) and (i) indicate midday and mid-night, values, respectively. Asterisk (*) on a bar in (h) and (i) indicates a significant difference between midday and mid-night values (p < 0.05, Student t test).
There were also significant differences in heart and intestine weights between the 4 LHSs (heart: F3,26 = 4.388, p = 0.0126; intestine: F3,26 = 6.803, p = 0.0016; one-way ANOVA; Fig. 1f, g). The heart was significantly heavier in the premigratory, migratory, and postmigratory states than in the nonmigratory state (p < 0.05; Newman-Keuls post hoc test; Fig. 1f). Conversely, the intestine was significantly lighter in weight in the migratory state compared with the other 3 LHSs (p < 0.05; Newman-Keuls post hoc test; Fig. 1g).
Blood physiological measures also showed significant differences between the LHSs. Glucose levels were significantly different between the 4 LHSs, independent of the time of day (LHS: F3,35 = 5.176, p = 0.0046; time of day: F1,35 = 4.335, p = 0.0446; LHS × time of day interaction: F3,39 = 2.452, p = 0.0778; 2-way ANOVA; Fig. 1h). Daytime glucose levels were significantly reduced in the postmigratory state compared with the other 3 LHSs (p < 0.05; Bonferroni test; Fig. 1h). Similarly, there was a significant effect of the LHS and time of day on blood triglyceride levels, but the 2 effects were not linked with each other (LHS: F3,35 = 12.32, p < 0.0001; time of day: F1,35 = 19.87, p < 0.0001; LHS × time of day interaction: F3,35 = 2.244, p = 0.1004; 2-way ANOVA; Fig. 1i). Birds had significantly higher triglyceride levels both during the day and the night in the migratory state, as compared with the other 3 states (p < 0.05; Bonferroni test; Fig. 1i). Between the 2 times in the same LHS, birds in the nonmigratory and premigratory, but not migratory and postmigratory, states had significantly higher daytime than nighttime levels (p < 0.05; Student t test; Fig. 1i).
Gene Expression: LHS Dependence
The BLAST analysis showed that partially cloned gene sequences of blackheaded bunting in the present study had >90% identity with sequences from other birds and >97% identity with those of the redheaded bunting (Suppl. Table S1).
Circadian genes involved in metabolism
There was a significant difference in expression levels between hypothalamus and liver (F1,39 = 21.460, p < 0.0001) and day and night (F1,39 = 109.901, p < 0.0001), but not between the LHSs (F3,39 = 0.755, p = 0.755). The effect of time of day was not dependent on the LHSs (F3,39 = 0.237, p = 0.870). Individually, in each tissue, Bmal1 mRNA levels were significantly higher at day than at night, regardless of the LHSs (p < 0.05; Student t test; Fig. 2a, b). Clock mRNA levels were neither different between the 2 tissues (F1,36 = 3.538, p = 0.068) nor between day and night (F1,36 = 1.013, p = 0.321) or LHSs (F3,36 = 0.619, p = 0.607; Fig. 2c, d). On the other hand, Npas2 was expressed at significantly different levels between tissues (F1,36 = 44.497, p < 0.0001), time of day (time: F1,36 = 86.375, p < 0.0001), and LHSs (F3,36 = 6.880, p = 0.001). Interestingly, the effect of time of day was linked with the LHSs (F3,36 = 3.698, p = 0.020). The expression of Npas2 was higher at night than day, regardless of the LHSs (p < 0.05, Student t test; Fig. 2e, f). Also, night Npas2 mRNA levels were significantly higher in the premigratory state than in the other 3 LHSs in the liver but not in the hypothalamus (p < 0.05, Bonferroni test; cf. Fig. 2f).
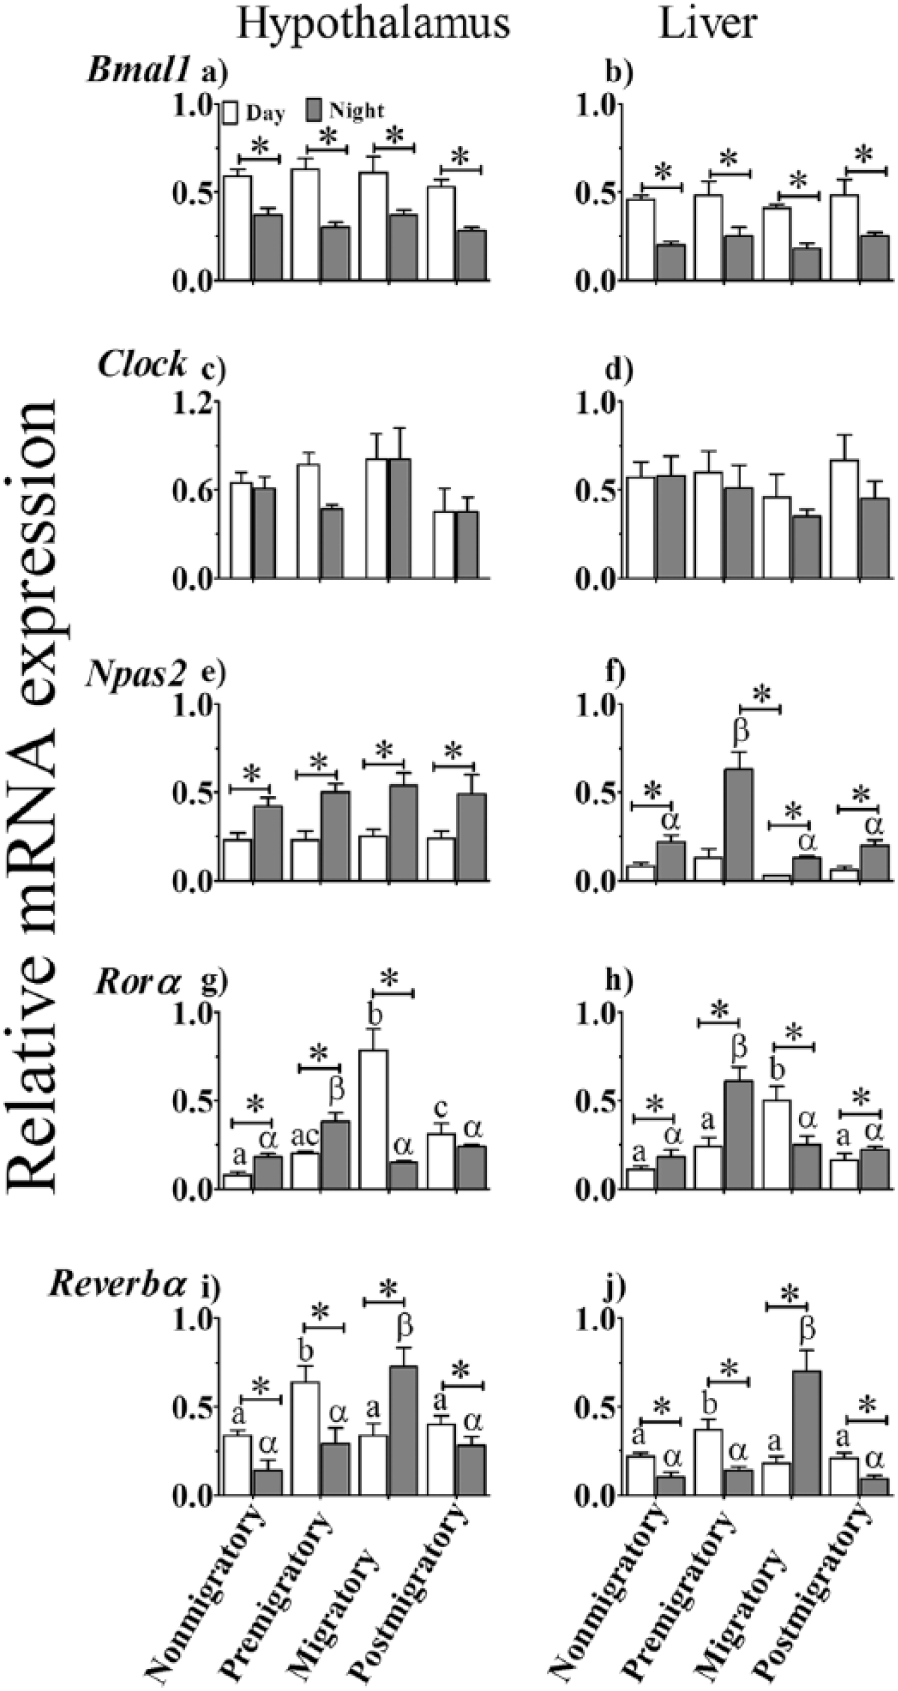
Clock and clock-controlled gene expression in the hypothalamus (left panel) and liver (right panel) of migratory blackheaded bunting (Emberiza melanocephala) during different photoperiod-induced life history states (LHSs), as measured by real-time polymerase chain reaction. (a, b) bmal1. (c, d) clock. (e, f) Npas2. (g, h) Rorα. (i, j) Rev-erbα. Asterisk (*) indicates significant difference between midday and mid-night mRNA levels. Difference in expression levels between different LHSs is indicated as follows. Similar alphabet or Greek letter on bars indicates no difference, while different alphabet or Greek letter indicates a significant difference between LHSs in midday and mid-night values, respectively (p < 0.05, Bonferroni test).
A similar pattern was found in Rorα expression between hypothalamus and liver (F1,38 = 0.593, p = 0.446), but the expression levels were significantly different between the LHSs (F3,38 = 22.915, p < 0.001). The effect of time of day varied significantly with the LHS (F3,38 = 35.735, p < 0.0001). The mRNA levels were significantly higher at night than day in the nonmigratory and premigratory states and at day than night in the migratory state (p < 0.05, Student t test; Fig. 2g, h). Postmigratory birds had significantly higher Rorα mRNA levels at night than day only in the liver (p < 0.05, Student t test). Among the LHSs, day levels in the migratory state and night levels in the premigratory state were significantly higher than in the other LHSs (p < 0.05, Bonferroni test; Fig. 2g, h).
Further, Rev-erbα expression was almost opposite in phase to that of Rorα expression. There was a significant difference in Rev-erbα mRNA levels between hypothalamus and liver (F1,38 = 16.250, p < 0.001). In each tissue, the expression levels were significantly affected by LHSs (F3,38 = 17.248, p < 0.001) in interaction with the time of day (F3,38 = 32.975, p < 0.0001). The mRNA levels were significantly higher at day than night in the nonmigratory, premigratory, and postmigratory states; conversely, the levels were significantly higher at night than day in the migratory state (p < 0.05, Student t test; cf. Fig. 2i-j). Among the LHSs in both tissues, there were significantly higher Rev-erbα levels at day and night in premigratory and migratory states, respectively, as compared with other LHSs (p < 0.05, Bonferroni test; Fig. 2i, j).
Genes involved in glucose regulation
Sirt1 expression significantly varied between the hypothalamus and liver (F1,36 = 74.216, p < 0.001) and between the LHSs (F3,36 = 16.894, p < 0.001) but not between day and night in an LHS (F1,36 = 0.458, p = 0.503). Sirt1 mRNA levels were significantly higher in premigratory and migratory than in nonmigratory and postmigratory states, both at day and night in the hypothalamus but only at night in the liver (p < 0.05, Bonferroni test; Fig. 3a, b). However, FoxO1 expression was not significantly different between hypothalamus and liver (F1,37 = 3.082, p = 0.087) or day and night (F1,37 = 0.220, p = 0.642), but it varied between the LHSs (F3,37 = 4.227, p = 0.011). Daytime expression levels of FoxO1 were significantly higher in premigratory and migratory than in nonmigratory and postmigratory states in the hypothalamus but not in the liver (p < 0.05, Bonferroni test; Fig. 3c). However, selective comparisons showed that FoxO1 mRNA levels were significantly higher at day than night in the hypothalamus only in the premigratory state (p < 0.05, Student t test; Fig. 3c, d).
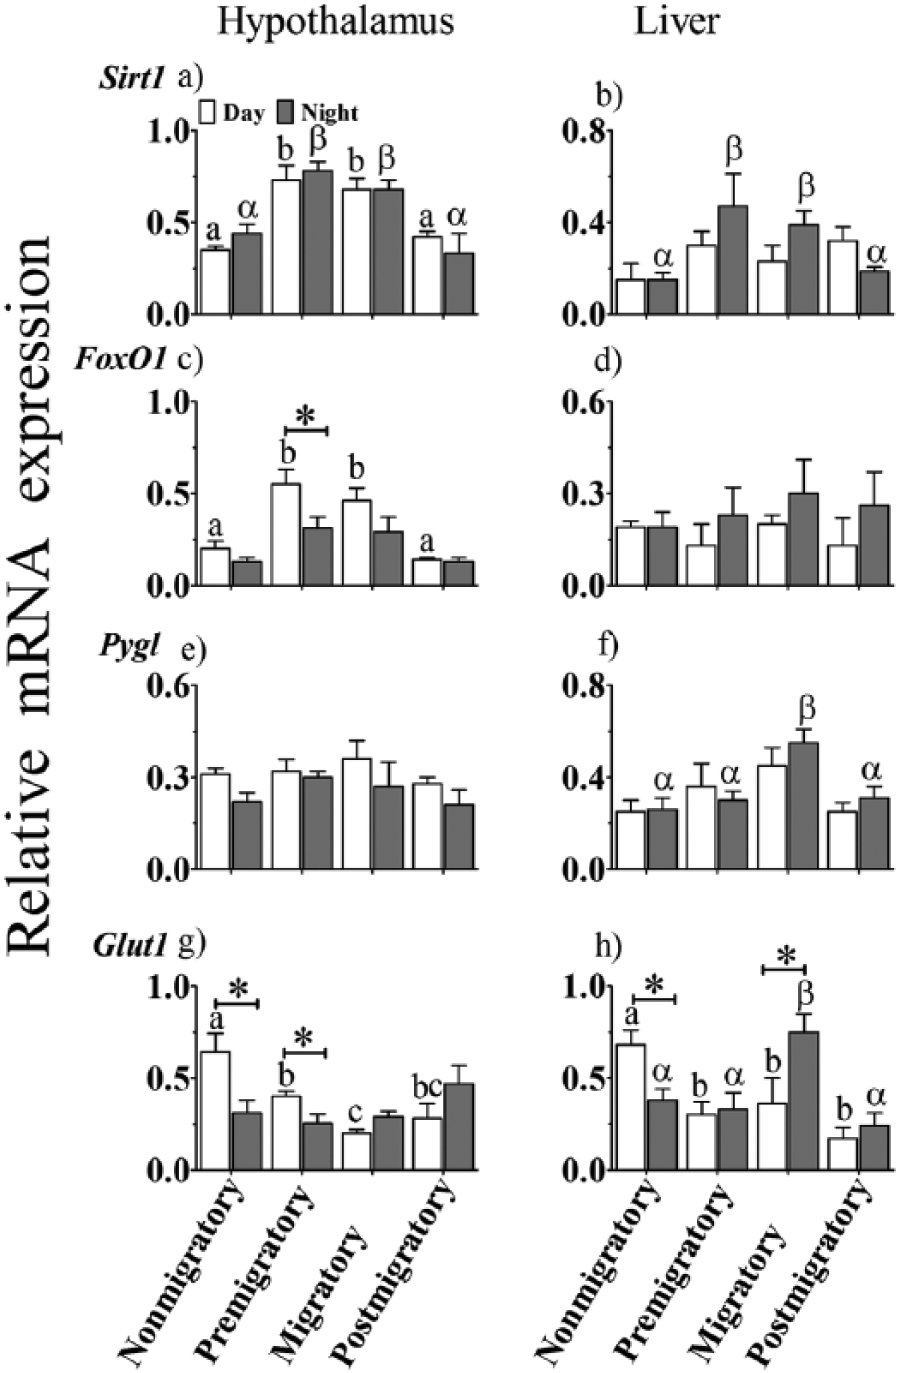
Relative expression levels of genes involved in glucose metabolism in the hypothalamus (left panel) and liver (right panel) of migratory blackheaded bunting (Emberiza melanocephala) during different photoperiod-induced life history states (LHSs), as measured by real-time polymerase chain reaction. (a, b) Sirt1. (c, d) Foxo1. (e, f) Pygl. (g, h) Glut1. Asterisk (*) indicates significant difference between midday and mid-night mRNA levels. Difference in expression levels between different LHSs is indicated as follows. Similar alphabet or Greek letter on bars indicates no difference, while different alphabet or Greek letter indicates a significant difference between LHSs in midday and mid-night values, respectively (p < 0.05, Bonferroni test).
On the other hand, Pygl expression patterns differed between the hypothalamus and liver (F1,35 = 6.044, p = 0.019; cf. Fig. 3e, f). There was a significant effect of the LHSs (F3,35 = 4.831, p = 0.006) but not of the time of day (F1,35 = 0.500, p = 0.484; Fig. 3e, f). Nighttime Pygl mRNA levels were significantly higher in the migratory than in the other 3 LHSs only in the liver (p < 0.05, Bonferroni test; Fig. 3e, f). Compared with this, there was no difference in Glut1 expression between hypothalamus and liver (F1,35 = 2.080, p = 0.158). However, there was a significant effect of LHSs (F3,35 = 6.325, p = 0.002), dependent on the time of day (F3,35 = 12.016, p < 0.0001). Day Glut1 mRNA levels were significantly higher in the nonmigratory than in the other 3 states in both the tissues (p < 0.05, Bonferroni test; Fig. 3g, h). Night mRNA levels, on the other hand, were significantly higher in the migratory than in the other 3 LHSs only in the liver (p < 0.05, Bonferroni test; Fig. 3h). Glut1 mRNA levels were significantly higher at day than night in both tissues of nonmigratory birds and only in the hypothalamus of premigratory birds (p < 0.05, Student t test; Fig. 3g, h). In the migratory state, night mRNA levels were significantly higher than day levels in the liver (p < 0.05, Student t test; Fig. 3h).
Genes involved in lipid regulation
There was no difference in the expression pattern of HmgCoA between the hypothalamus and liver (F1,37 = 1.202, p = 0.280). However, HmgCoA mRNA levels in both tissues varied significantly as a function of LHSs (F3,37 = 12.954, p < 0.0001) and time of day (F1,37 = 15.726, p < 0.0001) as well as the interaction between these 2 factors (F3,37 = 8.894, p < 0.0001). Daytime HmgCoA mRNA levels were significantly higher in premigratory and migratory than in nonmigratory and postmigratory states (p < 0.05, Bonferroni test; Fig. 4a, b). Within the LHSs, HmgCoA mRNA levels in the hypothalamus did not vary between day and night, except in the migratory state, when HmgCoA levels were significantly higher at day than at night (p < 0.05, Student t test; Fig. 4a). Similarly, HmgCoA was expressed at significantly higher levels in the liver at day than night in all the LHSs, except in the nonmigratory state, when mRNA levels were significantly higher at night than day (p < 0.05, Student t test; Fig. 4b).
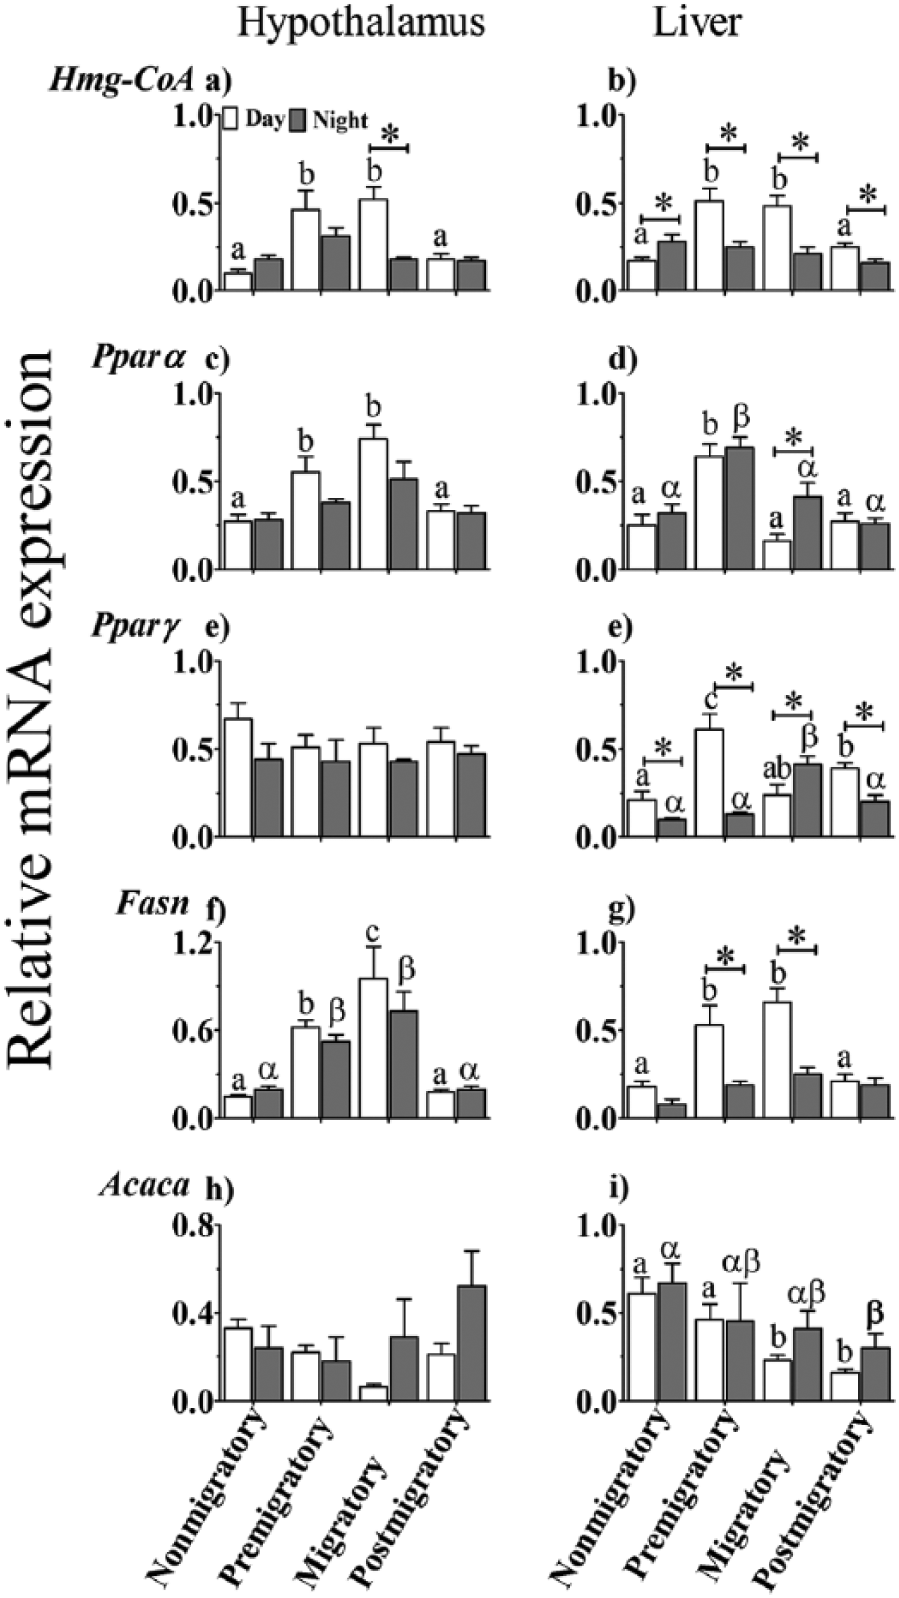
Relative expression levels of genes involved in lipid metabolism in the hypothalamus (left panel) and liver (right panel) of migratory blackheaded bunting (Emberiza melanocephala) during different photoperiod-induced life history states (LHSs), as measured by real-time polymerase chain reaction. (a, b) Hmg-CoA. (c, d) Pparα. (e, f) Pparγ. (g, h) Fasn. (i, j) Acaca. Asterisk (*) indicates significant difference between midday and mid-night mRNA levels. Difference in expression levels between different LHSs is indicated as follows. Similar alphabet or Greek letter on bars indicates no difference, while different alphabet or Greek letter indicates a significant difference between LHSs in midday and mid-night values, respectively (p < 0.05, Bonferroni test).
Pparα mRNA levels were not significantly different between day and night in either tissue, except in the liver in the migratory state, when the levels were significantly higher at night than day (p < 0.05, Student t test; Fig. 4c, d). Overall, there was neither tissue difference (F1,36 = 1.915, p = 0.175) nor time-of-day effect (F1,36 = 0.018, p = 0.893) on the Pparα expression pattern. However, Pparα mRNA expression significantly varied with LHSs (F3,36 = 19.603, p < 0.0001) but not in interaction with the time of day (F3,36 = 0.217, p = 0.884). In the hypothalamus, day mRNA levels were significantly higher in premigratory and migratory than in nonmigratory and postmigratory states (p < 0.05, Bonferroni test; Fig. 4c). In the liver, the expression levels at both times of day were significantly higher in the premigratory than in the other 3 LHSs (p < 0.05, Bonferroni test; Fig. 4d).
There was a significant variation in the expression of Pparγ between hypothalamus and liver (F1,36 = 44.154, p < 0.0001). Although the expression levels did not differ between the 4 LHSs at either time of day in the hypothalamus, they were different in the liver (Fig. 4e). There was an effect of time (F1,36 = 16.937, p < 0.0001) and of its interaction on Pparγ expression (F3,36 = 3.276, p = 0.032). In the liver, day levels in the premigratory state and night levels in the migratory state were significantly higher than levels in other LHSs (p < 0.05, Bonferroni test; Fig. 4f). Also, liver Pparγ mRNA levels were significantly higher at day than at night (p < 0.05, Student t test; Fig. 4f) in all the LHSs, except in the migratory state, in which they were higher at night than day (p < 0.05, Student t test; Fig. 4f).
The expression of Fasn mRNA showed significant differences between tissues (F1,36 = 22.010, p < 0.0001) and was affected by the LHSs (F3,36 = 37.877, p < 0.001) and time of day (F1,36 = 16.235, p < 0.001), as well as showed an interaction between the LHS and time of day (F3,36 = 3.995, p = 0.015). In the premigratory and migratory states, there were higher Fasn mRNA levels at day than night only in the liver (p < 0.05, Student t test; Fig. 4h). Further, Fasn mRNA levels were significantly higher in premigratory and migratory states than in nonmigratory and postmigratory states at both day and night in the hypothalamus and at day only in the liver (p < 0.05, Bonferroni test; Fig. 4g, h).
There were similar expression levels of Acaca mRNA, regardless of the time of day in the hypothalmus. However, liver had a significantly different Acaca expression pattern between the 4 LHSs. Day Acaca mRNA levels were significantly higher in nonmigratory and premigratory than in migratory and postmigratory states in the liver (p < 0.05, Bonferroni test; Fig. 4j). However, liver Acaca mRNA levels were significantly higher at night in the nonmigratory than in the postmigratory state (p < 0.05, Bonferroni test; Fig. 4j). Overall, there was a significant difference in expression levels between tissues (F1,36 = 10.388, p = 0.003), and the expression levels were affected by the LHSs (F3,36 = 3.016, p = 0.042) but not by time of day (F1,36 = 3.665, p = 0.064) or LHS × time interaction (F3,36 = 1.981, p < 0.134).
Discussion
Photoperiod-Induced Seasonal Phenotypes and Associated Physiological Changes
Distinct short- and long-day phenotypes confirm our previous findings that photoperiod regulates events linked with spring migration (hyperphagia, body fattening and weight gain, and development of Zugunruhe) and reproduction (testicular maturation) in the blackheaded bunting (Kumar et al., 2001; Misra et al., 2004; Rani et al., 2005, 2006; Gupta and Kumar, 2013). Differences in organ weights were consistent with nonmigratory and migratory phenotypes, with a significantly reduced intestinal weight in the migratory LHS as compared with the other 3 states (Fig. 1g). Perhaps this reflects an adaptation of buntings to their in-flight starvation in the wild (McWilliams and Karasov, 2001). Similar reductions in intestine weight have also been reported in migratory garden warblers (Sylvia borin; Biebach, 1998), red knots (Calidris canutus islandica; Piersma et al., 1999), and great knots (Calidris tenuirostris; Battley et al., 2000). Increases and decreases in organ size are physiological adaptations in migrants to meet energy demands during premigratory and migratory periods, respectively (Piersma and Jukema, 2002). Per unit of time, nonmigratory and stopover periods have high income and relatively low energy expenditure, compared with migratory periods with low income and high energy expenditure. Consistent with this, buntings in the premigratory and migratory states had larger hearts than in the nonmigratory state. Inconsistent with this, however, was heart size in postmigratory birds, which had larger hearts (perhaps in response to an overall higher metabolism under long days).
Similar blood glucose levels in the nonmigratory, premigratory, and migratory states would support the argument that blackheaded buntings have less dependence on carbohydrate metabolism to meet their energy needs (Fig. 1h). At the same time, significantly lower blood glucose levels in the postmigratory state suggest an overall reduced metabolism in postmigratory, gonadally regressed (photorefractory) buntings. The absence of a difference in blood glucose levels between nonmigratory and migratory states has also been reported in migratory godwits (Limosa l. taymyrensis; Landys et al., 2005), Canada geese (Branta Canadensis interior; Mori and George, 1978), western sandpipers (Calidris mauri; Guglielmo et al., 2002), blackcaps (Sylvia atricapilla; Jenni-Eiermann and Jenni, 1996), robins (Erithacus rubecula; Jenni-Eiermann and Jenni, 1996), and Islandica-knots (Calidris canutus; Jenni-Eiermann et al., 2002). On the other hand, serum triglyceride levels exhibited LHS-linked daily variations in buntings, as reported in sandpipers (Guglielmo et al., 2002). Elevated blood triglycerides throughout the day in the migratory state may indicate that buntings use free fatty acids as their flight fuel during migration (Fig. 1i), as suggested in other migratory species (Berthold, 1975; Ramenofsky, 1990). Induction of premigratory fat deposition has been shown to be positively correlated with increasing serum triglycerides in migratory songbirds (Guglielmo et al., 2002; Jenni-Eiermann and Jenni, 1994; Williams et al., 1999).
Gene Expression: LHS Dependence
The present results implicate Rorα and Rev-erbα in the regulation of seasonal metabolic physiology in the blackheaded bunting. These altered their expression patterns and were phase inversed in parallel with phase inversions in behavioral and neural activities (cf. Fig. 1; Rastogi et al., 2011, 2013). On the other hand, similar expression patterns of Bmal1, Clock, and Npas2 in 4 LHSs may be taken as evidence for their noninvolvement in seasonal metabolic regluation, with the caveat that tissue sampling was limited (2 samples in 24 h) in the present study. This may be consistent with carbohydrates not being a major migratory fuel in blackheaded buntings. Results on physiological measures (Fig. 1) seem to indicate that buntings meet much of their energy needs from lipid metabolism. However, this does not mean that there is an absence of glucose regulation in seasonal metabolism. Possibly, carbohydrate metabolism is influenced by changes in the expression levels of genes involved in the regulation of energy (food) intake and metabolism of stored glycogen in the liver. Several nonclock genes were differentially expressed between different migratory LHSs in buntings (cf. Figs. 2-4). For example, hypothalamic Sirt1 and FoxO1 at significantly higher levels in the premigratory and migratory states appear consistent with the proposition that an increased energy need during these states is met through hyperphagia, subsequent fat deposition, and weight gain (Kim et al., 2006). FoxO1 stimulates and suppresses the transcription of genes encoding orexigenic (neuropeptide Y and agouti-related peptide [AgRP]) and anorexigenic (proopiomelanocortin [POMC]) peptides (Kim et al., 2006), respectively. POMC and AgRP neurons also express Sirt1 (Sasaki et al., 2010; Ramadori et al., 2008). A functional linkage between Sirt1 and FoxO1 could be suggested, based on reports that these genes influence insulin secretion and hence carbohydrate metabolism (Sun et al., 2007). Further, the differential expression of Pygl and Glut1 between LHSs in the liver suggests that buntings perhaps use stored liver glycogen as the flight fuel. There were significantly higher Pygl mRNA levels in the liver but not in the hypothalamus during the migratory state in buntings. Similarly, liver Glut1 mRNA levels were significantly higher at day than night in the nonmigratory and migratory states, respectively.
The genetic regulation of metabolism between nonmigratory and migratory states is further supported by the expression patterns of genes involved in lipid regulation. There was a tissue-dependent regulation of HmgCoA reductase mRNA expression in buntings. HmgCoA reductase mRNA levels significantly varied between day and night during all of the LHSs in the liver but only during the migratory state in the hypothalamus (Fig. 4a, b). A similar presence and absence of diurnal variation in HmgCoA reductase expression in the liver and brain, respectively, has been reported in rats entrained to 12L:12D (Jurevics et al., 2000). The daily HmgCoA reductase expression pattern in the liver closely follows the feeding pattern. Nocturnal rats under 12L:12D show peak HmgCoA reductase expression at night under ad libitum food condition but inverse peak expression during the day under restricted feeding, with food present in the light hours only (Edwards et al., 1972). There also appears to be a correlation between HmgCoA reductase expression and food availability in buntings. Given that buntings exclusively eat during the day (our unpublished data), midday HmgCoA reductase levels in samples mimicked those taken in a restricted feeding condition. Higher daytime HmgCoA reductase mRNA levels in buntings in long days (at 6.5 h during the light period) than in short days (at hour 4 during the light period) is consistent with the peak timing of expression about 6 h after the presentation of food in rats (Goldfrab and Pitot, 1971).
The genetic regulation of lipid metabolism is further supported by Ppar and Fasn gene expression patterns. High Pparα mRNA levels in the premigratory and migratory states may indicate energy generation by β-oxidation of fatty acids, as reported in other studies (Latruffe and Vamecq, 1996; Latruffe et al., 2000). Similarly, high Pparγ mRNA levels in the liver in premigratory LHS may reflect an enhanced adipogenesis in order to store fat fuel for the ensuing migratory flight (Fig. 4f). Likewise, an increased Fasn expression in the hypothalamus and liver in premigratory and migratory states (Fig. 4h) is consistent with the idea that increased energy needs of the migratory state may be met via de novo lipogenesis (Wakil, 1989; Schmid et al., 2005; Loftus et al., 2000).
Some genes could possibly be involved in multiple metabolic pathways. For example, Sirt1 appears to connect the circadian clock and metabolism. Similarly, FoxO1, which, in conjuction with Sirt1, is involved in energy homeostasis at the hypothalamic level (see above), also affects lipid metabolism in mice (Matsumoto et al., 2006). Thus, there could possibly be several unreported candidate molecules that could serve as links between carbohydrate and lipid metabolism, enabling seasonal migrants to use both carbohydrates and lipids in times of greater energy demands.
A question could be raised whether the observed differences between the different LHSs in buntings might be due to the presence or absence of the migratory state alone or also due to the extent of inactivation or activation of the hypothalamo-hypophyseal-gonadal axis. Testes were small and reproductively inactive in nonmigratory and postmigratory states, and they were slightly initiated in the premigratory and fully recrudesced in the migratory state. In fact, postmigratory buntings also represent a postbreeding state, with initiated molt. However, despite the concomitant induction of migratory and reproductive phenotypes in the laboratory environment, the 2 events are reported not to be linked; they are separately controlled by photoperiods order to avoid a physiological conflict in migratory buntings (Kumar et al., 2006). Also, testes are not involved in the photoperiodic induction of migration, since castrated blackheaded buntings exhibit premigratory and migratory phenotypes, as do the intacts (Misra et al., 2004; Tewary and Kumar, 1981; Gupta and Kumar, 2013).
To sum up, these results show that several genes involved in metabolic regulation dramatically change their mRNA expression levels between LHSs, corresponding to nonmigratory and spring migration–linked states in blackheaded buntings. Thus, these initial results on the molecular basis of seasonal metabolism extend the idea that transitions between LHSs in migrants is accomplished by changes in gene expression at multiple regulatory levels. Further, with a focus on genetic regulation of metabolism in a migratory species, the present findings promise new insights into mechanism(s) of adaptation to seasons in birds, in particular, and higher vertebrates, in general. However, in the absence of functional data at this time, a definitive conclusion about the physiological roles of genes described above in the regulation of avian migration needs to be drawn with some caution.
Footnotes
Acknowledgements
Generous financial support from the Department of Science and Technology (now the Science and Engineering Research Board), Government of India, through funding under the IRHPA (Intensification of Research in High Priority Areas) program and a regular research grant, and from the Department of Biotechnology, Government of India, to the research included in this article are gratefully acknowledged.
Conflict of Interest Statement
The author(s) have no potential conflicts of interest with respect to the research, authorship, and/or publication of this article.
Notes
References
Supplementary Material
Please find the following supplemental material available below.
For Open Access articles published under a Creative Commons License, all supplemental material carries the same license as the article it is associated with.
For non-Open Access articles published, all supplemental material carries a non-exclusive license, and permission requests for re-use of supplemental material or any part of supplemental material shall be sent directly to the copyright owner as specified in the copyright notice associated with the article.