
Abstract
Most cyclic biological processes are under control of a circadian molecular timing system that synchronizes these phenomena to the 24-h day. One generic property of circadian-controlled processes is that they operate within a specific temperature range, below which the manifestation of rhythm ceases. Little is known about the evolutionary relevance of the lower temperature limit of rhythmicity or about the mechanism underlying the loss of overt circadian behavior below this lower limit, especially in one model organism of chronobiology, Drosophila melanogaster. Natural populations of Drosophila are evolving under divergent selection pressures and so provide a source of diversity necessary to address these issues. Using lines derived from African populations, we find that there is natural variation in the expression of rhythmic behavior under low-temperature conditions. We found evidence that this variability is evolutionarily relevant at extremely low temperature (12 °C) because high-altitude populations exhibit selection for locally adapted genomes that contribute to rhythmic behavior. Lines resistant to 15 °C show an additional layer of diversity in their response to temperature extremes because some lines are resistant to low temperature (15 °C) only, whereas others are cross-resistant to high and low temperature (15 °C and 30 °C). Genetic analysis of one cold-resistant circadian line at 15 °C reveals that the phenotype maps to the X-chromosome but not to the core clock genes, per and sgg. Analysis of the central clock cells of this line reveals that maintenance of rhythm is associated with robust clock function, which is compromised in a standard laboratory strain. These data indicate that the cold-resistant circadian phenotype is clock based. This study highlights the importance of using natural populations to inform us of the basic features of circadian traits, especially those that might be under temperature-based selection.
Keywords
Most biochemical, physiological, and behavioral phenomena exhibit daily cycles that are under control of an internal circadian timing system that serves to synchronize these processes to peak at critical times of the 24-h day. The ability to anticipate and coordinate biological processes according to light:dark transitions of the environment confers a fitness advantage in several organisms (Ouyang et al., 1998; Woelfe et al., 2004; Dodd et al., 2005), which is presumably why the internal timing mechanism is evolutionarily conserved from bacteria to mammals. In flies (Drosophila melanogaster), the molecular clock is characterized by a well-established negative feedback loop in which core clock proteins—PERIOD (PER) and TIMELESS (TIM)—inhibit the transcription of their own mRNAs. The ~24-h cycle begins when 2 transcription factors (CLK and CYC) bind to E-boxes upstream of the period (per) and timeless (tim) genes and transcribe per and tim mRNA. These mRNAs are translated into proteins that accumulate in the cytosol, form a heterodimer complex, and translocate into the nucleus. Phosphorylation plays a central role in the accumulation of the proteins as well as their nuclear transfer. Once the complex translocates into the nucleus, PER-TIM bind to CLK-CYC, inhibiting their binding affinity for the per and tim E-boxes, thereby negatively regulating the transcription of their own mRNAs. The negative inhibition is removed once other proteins degrade the PER-TIM complex, allowing the cycle to begin again. For a detailed review of the molecular clock, see Zheng and Sehgal (2012).
In the Drosophila brain, several neuronal clusters exhibit oscillations of the molecular clock, and these “clock cells” coordinate the timing of circadian-controlled processes. Within the environment, there are a number of stimuli such as light, chemicals, and temperature that affect the timing and efficacy of circadian outputs. Of these, temperature is especially interesting because it influences overt rhythms in several ways, one of which is that low temperature blocks rhythm, which resumes once returned to permissive temperatures. Thus, the overt manifestation of circadian rhythms occurs within specific temperature limits (Njus et al., 1977; Francis and Sargent, 1979; Martino-Catt and Ort, 1992). With the exception of one study on the fungus Neurospora crassa (Liu et al., 1997), little is known about the biological significance of this circadian property or why species lose their ability to maintain rhythm below the lower limit of rhythmicity. Although Drosophila has been the focus of intense research on the evolutionary and molecular biology of circadian rhythms and some studies have addressed mechanisms and selection pressure for temperature-dependent changes in activity patterns (Majercak et al., 1999; Low et al., 2008), the lower temperature limit property of circadian rhythm has not been investigated.
Natural populations of D. melanogaster are evolving in diverse environments across the world (Kyriacou et al., 2008), and their molecular clocks have been shown to be under selection pressure based on how well they resonate with the ~24-h cycle of the environment (Sawyer et al., 1997; Sawyer et al., 2006; Low et al., 2008). In addition, cold tolerance and correlated phenotypes (reproductive diapause expression, longevity, starvation tolerance, lipid content, fecundity profiles; Schmidt et al., 2005) are directly relevant to Drosophila populations in the wild and are affected by selection pressures that vary spatially and temporally (Mitrovski and Hoffman, 2001; Schmidt and Conde, 2006; Schmidt and Paaby, 2008). This suggests that the maintenance of fundamental biological processes (including circadian rhythmicity) during exposure to cold temperatures is directly relevant to performance and fitness of Drosophila evolving in temperate environments. Here we tested the response of wild-derived populations of Drosophila to extremely-low-temperature (12 °C) and low-temperature (15 °C) stress to determine whether this trait is evolutionarily relevant. We then use lines rhythmic at 15 °C to address the mechanism underlying the maintenance of rhythm under this condition.
Methods
Isofemale Lines
Isofemale lines are strains derived from a single, multiply-mated, wild-caught female and are often used to investigate the genetic architecture of natural populations (David et al., 2005). In this study, 46 isofemale lines derived from 6 natural populations in Africa (9 from CO: Oku, Cameroon [6.25, 10.43; altitude: 2169 m]; 3 from ED: Dodola, Ethiopia [6.98, 39.18; altitude: 2492 m]; 11 from GA: Franceville, Gabon [–1.65, 13.6; altitude: 350]; 9 from NG: Maiduguri, Nigeria [11.85, 13.16; 295 m]; 9 from RG: Gikongoro, Rwanda [–2.49, 28.92; 1927]; and 5 from SP: Phalaborwa, South Africa [–23.94, 31.14; 350 m]) were used to investigate the evolutionary relevance and mechanism of this circadian property. All 46 lines were used in the 12 °C data set, and a random subset of these lines was used for analyses at 15 °C. J. Pool collected lines from CO and ED in 2004 as well as RG in 2008, lines from GA were collected by B. Ballard and S. Charlat in 2002, lines from NG were collected by D. Gwary and B. Sastawa in 2004, and SP lines were collected by R. Corbett-Detig in 2010 (Pool et al., 2012). Cosmopolitan admixture data for these lines are available in Pool et al. (2012). All Drosophila lines used in this study were maintained according to the principles and practices of the US National Institute of Health’s (NIH) Guide for the Care and Use of Laboratory Animals.
Behavioral Analysis
The following behavioral assays were conducted under extremely low (12 °C), low (15 °C), standard (25 °C), or high (30 °C) temperature. Adult males between 1 and 5 d old were entrained in TriKinetics Activity Monitors (TriKinetics, Waltham, MA) under a 12:12 h light:dark schedule for 3 d in a temperature-regulated Precision incubator model 818 (Thermo Electron Corporation, Marietta, OH). Flies were then placed in constant darkness (DD) and allowed to free-run for 4 d, after which locomotor activity—a commonly used metric of circadian behavior in Drosophila (Frenkel and Ceriani, 2011)—was scanned into 5-min bins using the DAM File Scan (version 1.1.06, TriKinetics). We used ClockLab software (version 2.61; Actimetrics, Wilmette, IL) to score an individual fly as either rhythmic or arrhythmic, which we characterized based on the strength of the rhythm (FFT). Flies were scored as rhythmic only if they achieved an FFT value of ≥0.01. For each fly, we reported its behavioral state (rhythmic/arrhythmic) and, if it achieved rhythmicity, the strength of its rhythm and its corresponding period length.
Mapping the NG7 Cold-Resistant Circadian Behavior
Establishing chromosomally isolated genetic lines
We mapped the chromosome responsible for the NG7 cold-resistant circadian behavior by establishing chromosomally isolated genetic lines of the NG7 isofemale line. To do this, we first crossed a group of NG7 males that exhibited rhythm (FFT ≥ 0.01) at 15 °C to virgins balanced for each of the 3 fly chromosomes. Balancer lines were obtained from Bloomington Drosophila Stock Center (http://flystocks.bio.indiana.edu/), and each was initially outcrossed to our isogenized w118 background (Iso31) for 7 generations.
To isolate the NG7 X-chromosome, we used the attached X line XX/Y (Bloomington stock No. 988); to isolate the second chromosome, we used the balancer line, Sco/Cyo (Bloomington stock No. 5907); and to isolate the third chromosome, we used the balancer line TM2/TM6b (Bloomington stock No. 5906). F1 males were sorted by the presence of the chromosomal balancer and then crossed to virgin females with the appropriate chromosomal balancer line used in the P1 cross. This process was repeated for a total of 3 generations. To achieve homozygosity of each chromosome after the third generation (F3), we sorted and then crossed males and virgin females based on the absence of the chromosomal balancer, thereby generating 3 outcrossed genetic lines of X, second, and third chromosomal isolates for NG7. We then phenotyped each chromosomally isolated stock at 15 °C to see which could maintain rhythmicity (see the Behavioral Analysis section).
Generating recombinants
To test whether the NG7 per or sgg locus accounts for its cold-resistant circadian behavior, we created recombinant lines of the NG7 and Iso31 X-chromosome. To do this, we first crossed a male from the chromosomally isolated X NG7 line positive for the behavior to a female Iso31 virgin negative for the behavior. We then selected female virgins from the F1 generation (which are all heterozygous for the NG7 and Iso31 X-chromosome) and crossed them to a male from the Iso31 strain. Because recombination occurs in the female sex of this species, the resulting males of this F2 progeny carry an X-chromosome that underwent 1 round of meiosis and was therefore recombinant for the Iso31 and NG7 X-chromosome. We used eye color as a marker for per and sgg allelic identity because the genes are linked. We then assayed the behavior of 64 white and 62 red-eyed males from the cross at 15 °C.
Immunohistochemistry and Confocal Microscopy
For the 15 °C and 25 °C immunohistochemistry (IHC) experiments, we entrained Iso31 and X-chromosome–isolated NG7 males as described in the Behavioral Analysis section. Once we characterized the behavior of the 2 genotypes, we then reentrained these animals for 1 d on a 12:12 h light:dark schedule, followed by a return to constant darkness (DD1). All samples were collected on DD1. IHC preparation and quantification protocols for PER in the pigment-dispersing factor (PDF)–positive small ventral-lateral neurons (s-LNVs) have been described previously (Benito et al., 2007; Blanchard et al., 2010; Zhang et al., 2013). We quantified PER in this cell cluster because it is essential for robust circadian behavior in DD (Zheng and Sehgal, 2012). Briefly, to compare PER intensity in the s-LNVs, NG7 and Iso31 were sacrificed at 4-h intervals starting at CT0 (CT0, 4, 8, 12, 16, and 20). For the 15 °C experiment, all Iso31 males (which were arrhythmic) were sampled for IHC, whereas both arrhythmic and rhythmic NG7 males were sacrificed (NG7A and NG7R, respectively). For the 25 °C experiment, males from both genotypes were rhythmic.
After dissection in chilled phosphate-buffered saline with 0.1% Triton (PBS-T), brains were fixed in 4% paraformaldehyde diluted in PBS-T for 25 min at room temperature. Subsequently, the brains were rinsed and washed with PBS-T 3 times (5 min for each wash), incubated with 5% normal donkey serum in PBS-T for 30 min, and then incubated with primary antibodies at 4 °C overnight. To stain for PER, we used rat anti-PER (1:1000). Because the PDF-containing s-LNVs control circadian behavior in DD (Renn et al., 1999; Stoleru et al., 2005), we co-stained the brains for PDF expression using rabbit anti-PDF (1:250). The following day, brains were washed 3 times with PBS-T (5 min for each wash) and then incubated in the following secondaries at room temperature for 1.5 h: Alexa 488-conjugated donkey anti-rat (2:1000) and Alexa 555-conjugated donkey anti-rabbit (Life Technologies, Grand Island, NY; 1:500 dilution). Brains were mounted on a glass slide using Vectashield (Vector Laboratories, Burlingame, CA).
Images of the s-LNVs were acquired on a Leica TCS SP5 confocal microscope with a 40× oil immersion lens by sequentially collecting z-sections at 1.5 uM for both Alexa fluorophores. To avoid oversaturating the image, we calibrated the gain and offset for the PER detector to the s-LNV with the maximal amount of PER expression for each experiment; therefore, the scales in Figures 4b, 4d, and 5b are not comparable with each other. The calibration of the detector remained constant throughout the given experiment for all groups. Once collected, the images were digitally projected using ImageJ v1.42q (http://rsb.info.nih.gov/ij). Mean PER fluorescence was taken for each s-LNV and normalized to the field adjacent to the imaged neuron. PDF (magenta channel) was used as a marker for the neuron. For each time point, signal intensity was measured bilaterally in up to 4 neurons from at least 5 brains.
Statistical Analyses
All statistical analyses were performed using JMP PRO version 10 (SAS Institute, Cary, NC). We used 2 nominal logistic regression models to examine the relationship between a fly’s altitude of origin (high/low), the proportion of a fly’s genomic admixture, and a fly’s likelihood of maintaining rhythm under extremely cold (12 °C) and cold temperature stress (15 °C), respectively. We classified a fly as originating from a high-altitude source if it derives from a location that exceeds 1900 m (Cameroon [CO], Ethiopia [ED], Rwanda [RG]) and originating from a low-altitude source if the location is below or equal to 350 m (Gabon [GA], Nigeria [NG], South Africa [SP]). Data on a fly’s proportion of genomic admixture from cosmopolitan sources was taken from genomic analysis of its isofemale line (Pool et al., 2012). When a fly line’s admixture data were not available, we used the average population admixture as an input (Pool et al., 2012). In all models, we controlled for the nested structure of the data (e.g., we included each population nested within a high or low altitude). In our 12 °C (but not 15 °C) data set, we conducted 3 assays in which we characterized circadian behavior. In this data set, we controlled for the effects of each assay (assay 1, 2, and 3) and reported the effects when statistically significant.
To compare the differences among the proportion of rhythmic individuals between 2 or more independent groups, we used a χ2 test. When the proportions between the independent groups consisted of sparse data (cells <5), we used a Fisher exact test. To compare differences in means between 2 groups, we used an independent sample t test; to compare differences in means in groups that exceeded 2, we used a 1-way between-subjects analysis of variance followed by a post hoc test. To take into account the nested structure of the IHC data (e.g., we analyzed mean PER intensity in cells nested within fly brains), we used a linear mixed-effects model to analyze differences in PER intensity at each time point for all groups.
Results
Rhythmicity at Low Temperatures Varies in Naturally Occurring Drosophila Populations
To determine if natural populations of Drosophila display variation in the manifestation of circadian behavior under extremely low temperature stress, we evaluated the locomotor rhythm of isofemale strains derived from ancestral African populations at 12 °C. We phenotyped between 10 and 128 individuals for each of the 46 isofemale lines, recording the individual’s behavioral state (rhythmic/arrhythmic). We found that the proportion of rhythmicity in these lines varies at 12 °C (Fig. 1a).
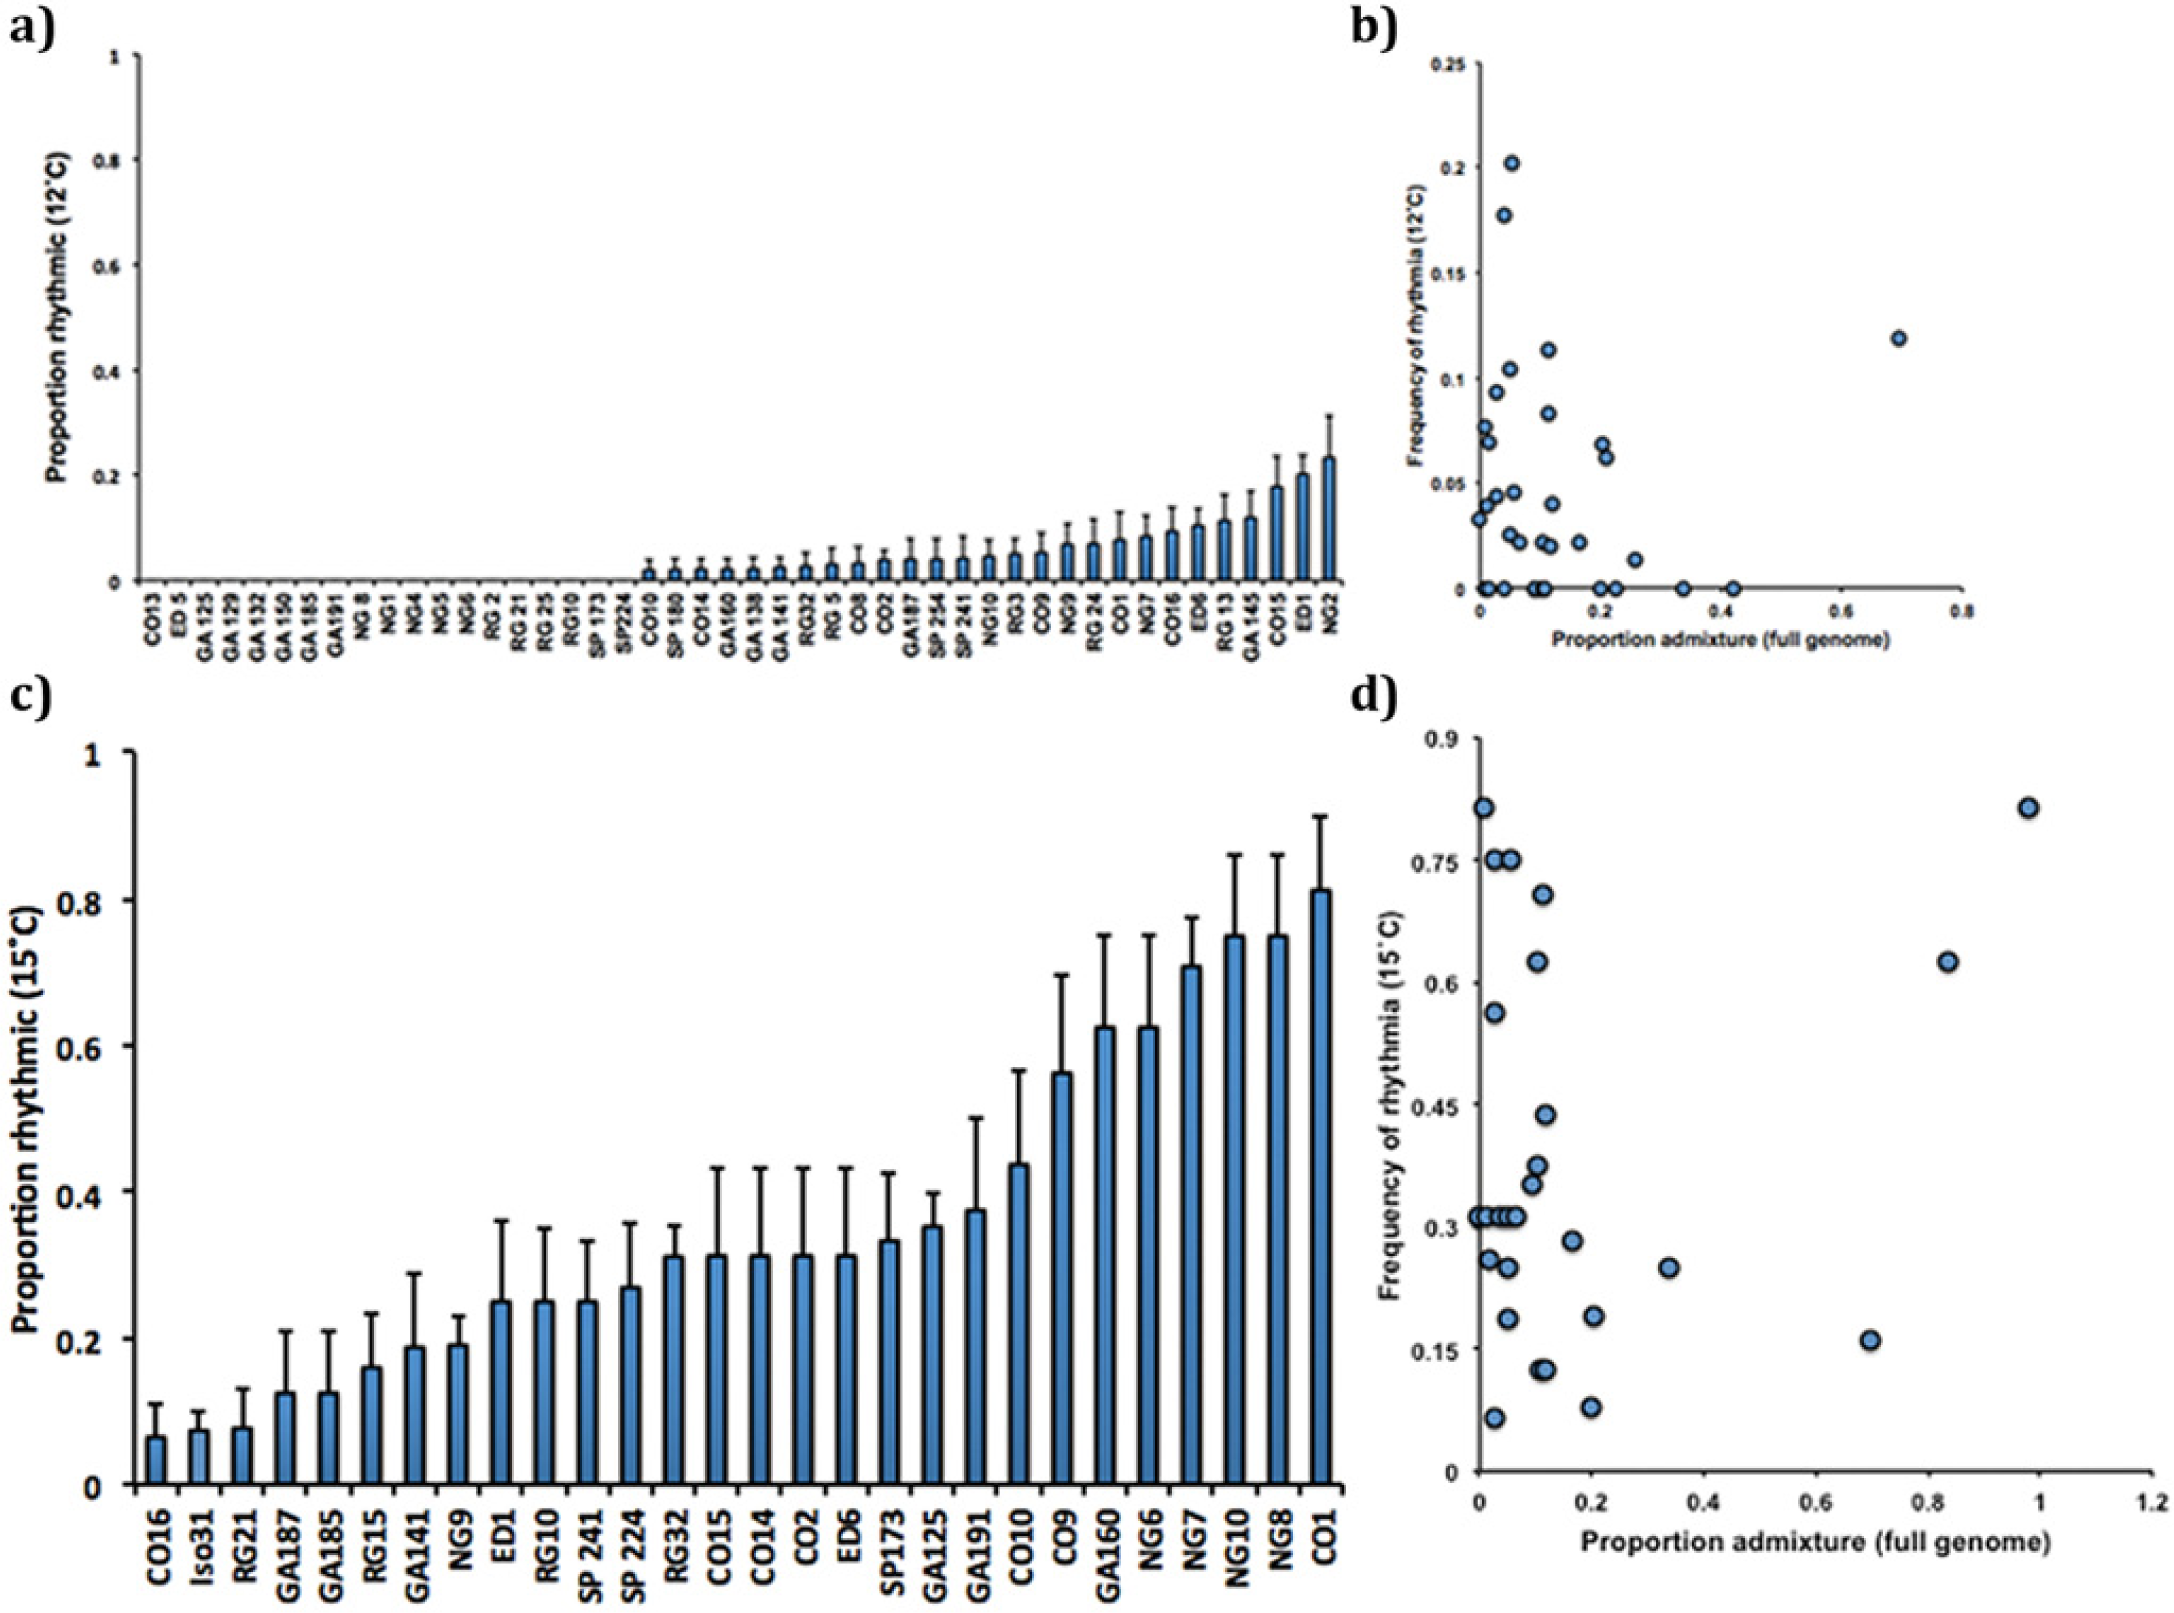
Rhythmicity at lower temperatures varies in naturally occurring Drosophila populations. (a) 12 °C. Using a χ2 test, we found that the proportion of rhythmic individuals differs among 46 isofemale lines at 12 °C, χ2(df = 45, N = 1937) = 145, p < 0.001. We computed the standard error of the proportion using the formula SE = sqrt((p(1 – p)/n)), where p is the proportion of rhythmic individuals in our sample, n is the number of individuals in the sample, and sqrt is the square root. (b) Isofemale lines with a lower percentage of genomic admixture are more likely to maintain rhythm under extreme temperature stress. Results of the logistic regression are found in Table 1b. (c) At 15 °C, rhythmicity varies in naturally occurring Drosophila populations. Using a χ2 test, we found that the proportion of rhythmic individuals differs under low-temperature stress among a random 27-line subset of our isofemale strains, χ2(df = 28, N = 862) = 145, p < 0.001. We computed the standard error of the proportion using the formula SE = sqrt((p(1 – p)/n)), where p is the proportion of rhythmic individuals in our sample, n is the number of individuals in the sample, and sqrt is the square root. (d) There is no significant association between a line’s percentage of cosmopolitan admixture and a fly’s likelihood of maintaining rhythm under low-temperature stress. Results of the logistic regression can be found in Table 2.
As the lines we tested derived from different altitudes, and higher altitudes are typically associated with lower temperatures, we wondered whether higher altitude strains show selection for low-temperature–adapted traits. Previous work has demonstrated that altitude is functionally important for the selection of fitness-related traits (e.g., desiccation, heat knock-down and starvation resistance, developmental time; Sørensen et al., 2004; Sambucetti et al., 2006), but it is unknown whether it is relevant for the circadian clock as well. Because the circadian clock is known to be under selection based on its ability to maintain a ~24-h period regardless of the temperature variance (Sawyer et al., 1997; Sawyer et al., 2006), we predicted that extreme environmental flux associated with high altitude would select for cold-resistant circadian traits at 12 °C.
To test the effects of altitude on a fly’s likelihood of maintaining rhythm under extremely low-temperature stress, we performed a nominal logistic regression model. We found a significant association between a fly’s altitude of origin and its behavioral response to 12 °C, where flies from high-altitude sources are more rhythmic than those sampled from low altitude (Table 1a).
(a) Altitude is a significant predictor of a fly’s likelihood of rhythmicity under extremely low-temperature stress (12 °C). (b) Percentage of cosmopolitan admixture drives the relationship between altitude and a fly’s circadian response to 12 °C.
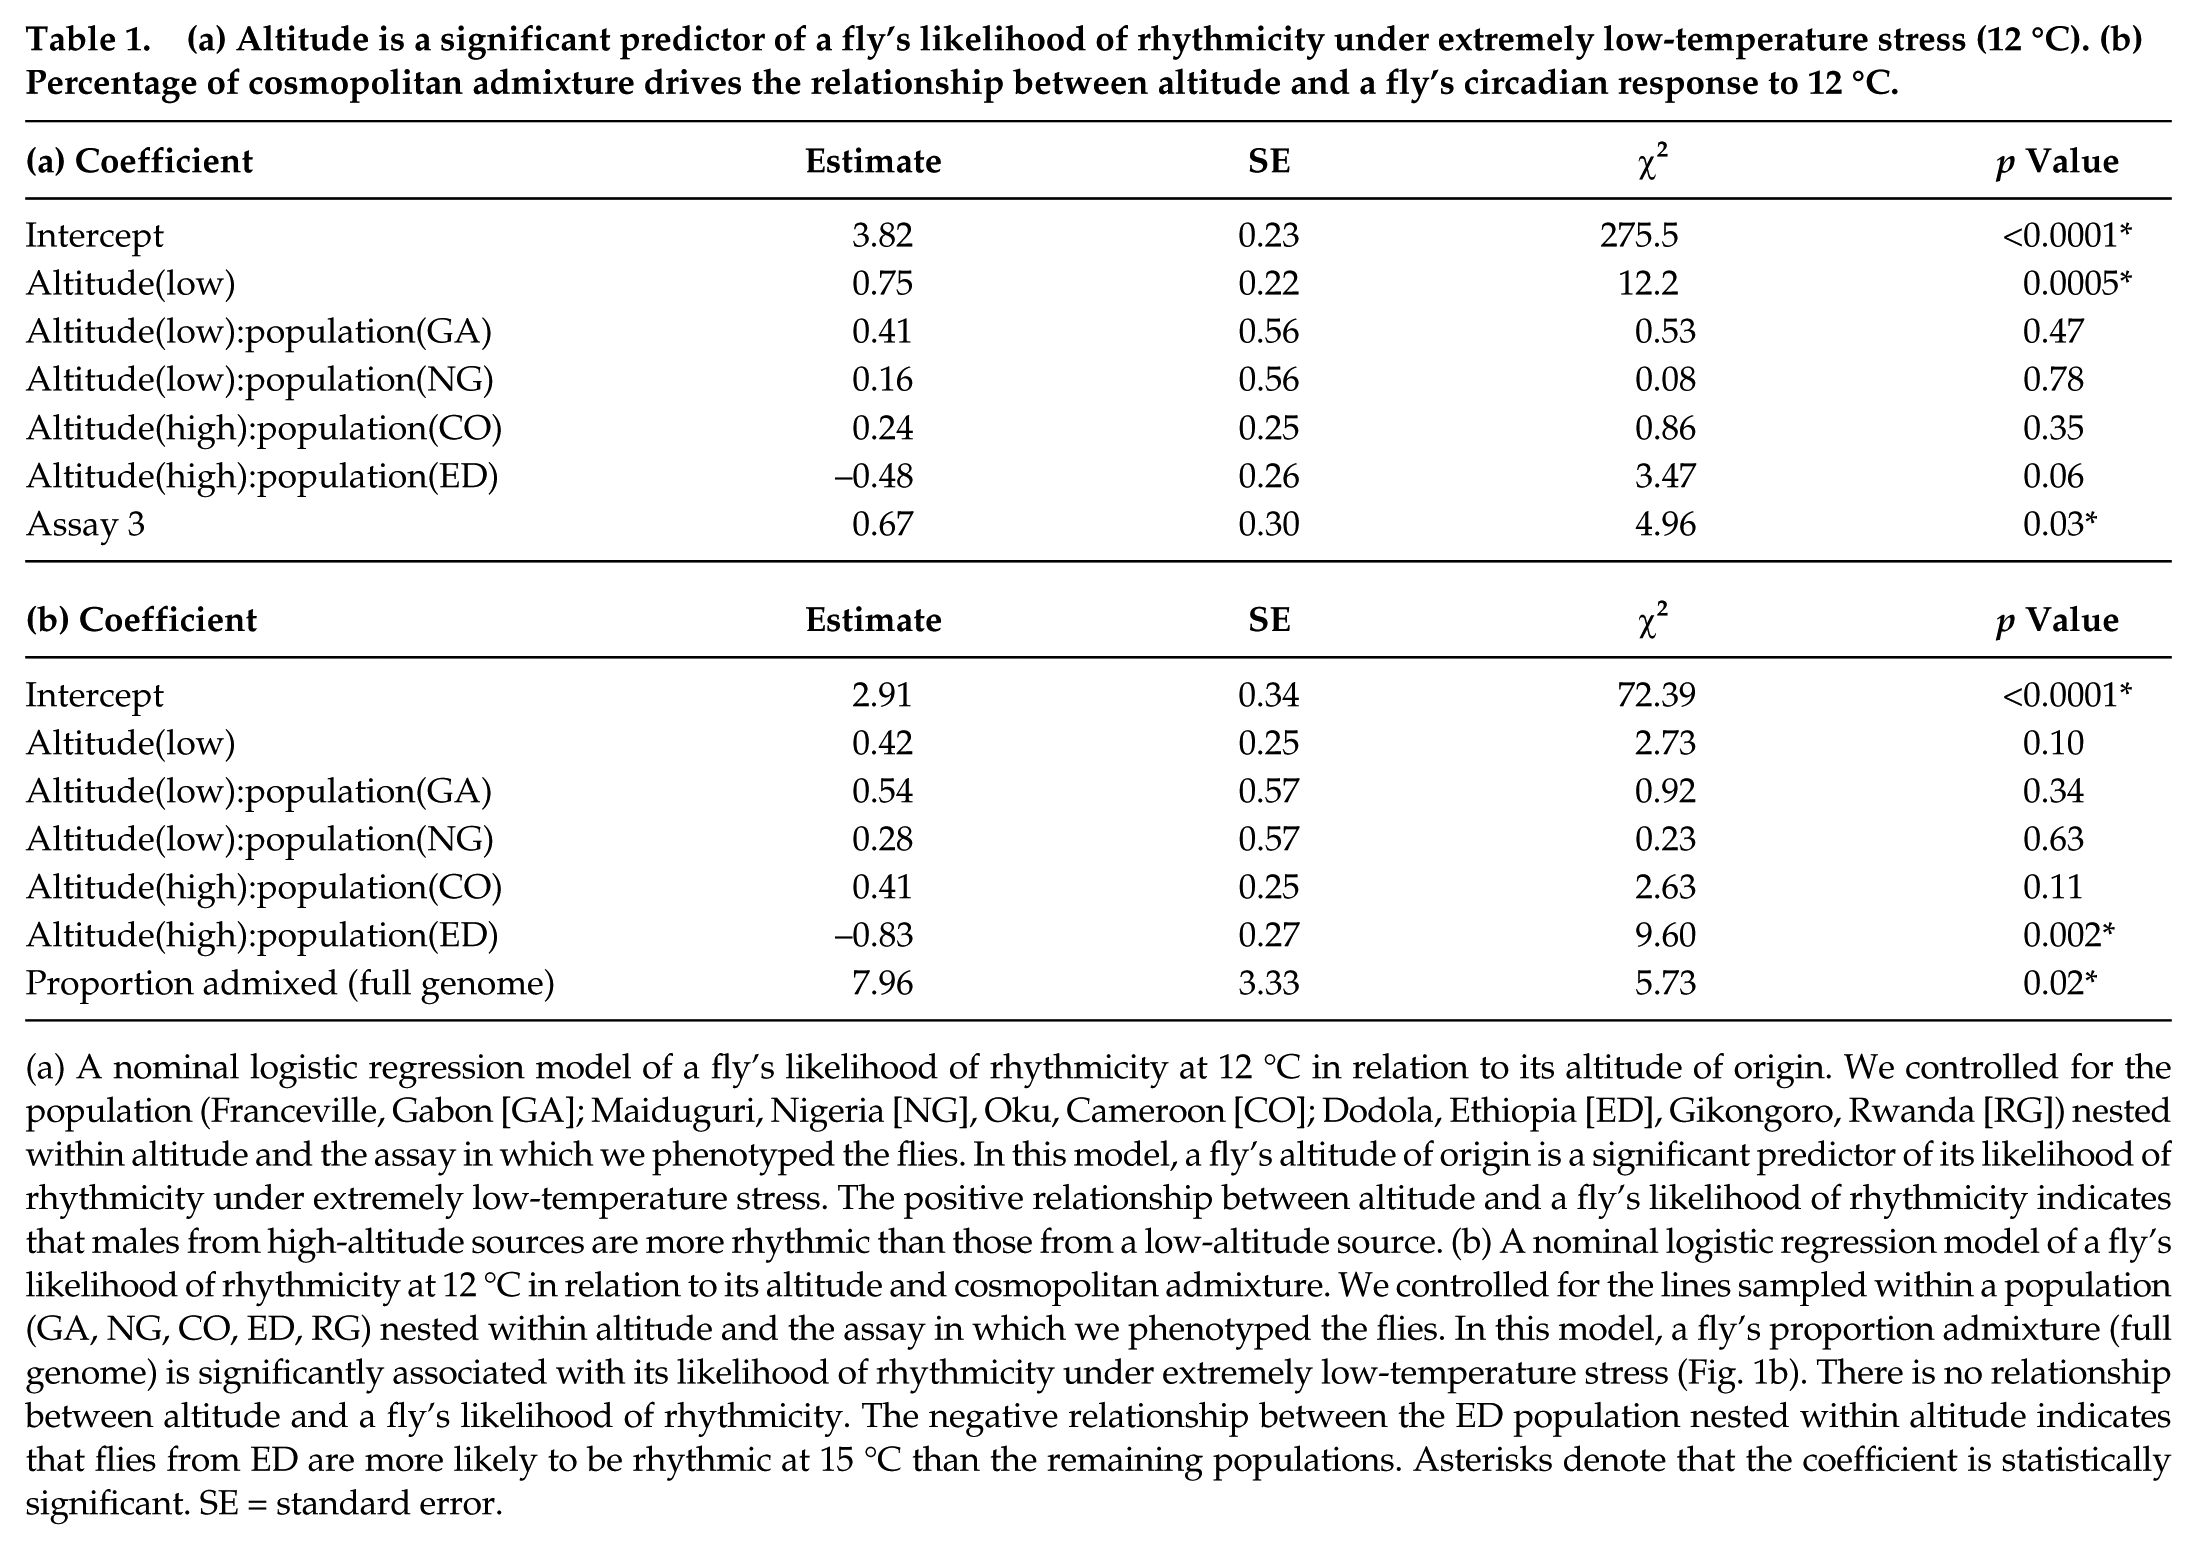
(a) A nominal logistic regression model of a fly’s likelihood of rhythmicity at 12 °C in relation to its altitude of origin. We controlled for the population (Franceville, Gabon [GA]; Maiduguri, Nigeria [NG], Oku, Cameroon [CO]; Dodola, Ethiopia [ED], Gikongoro, Rwanda [RG]) nested within altitude and the assay in which we phenotyped the flies. In this model, a fly’s altitude of origin is a significant predictor of its likelihood of rhythmicity under extremely low-temperature stress. The positive relationship between altitude and a fly’s likelihood of rhythmicity indicates that males from high-altitude sources are more rhythmic than those from a low-altitude source. (b) A nominal logistic regression model of a fly’s likelihood of rhythmicity at 12 °C in relation to its altitude and cosmopolitan admixture. We controlled for the lines sampled within a population (GA, NG, CO, ED, RG) nested within altitude and the assay in which we phenotyped the flies. In this model, a fly’s proportion admixture (full genome) is significantly associated with its likelihood of rhythmicity under extremely low-temperature stress (Fig. 1b). There is no relationship between altitude and a fly’s likelihood of rhythmicity. The negative relationship between the ED population nested within altitude indicates that flies from ED are more likely to be rhythmic at 15 °C than the remaining populations. Asterisks denote that the coefficient is statistically significant. SE = standard error.
Pool et al. (2012) recently showed that introgression from nonnative sources (e.g., populations outside of sub-Saharan Africa) varies among the lines evaluated in this study. When previously isolated populations meet and mix, the resulting admixed population can benefit from several fitness-related advantages (Keller and Taylor, 2010), including increased genetic variation, the creation of novel genotypes, and the masking of deleterious mutations. However, in populations that are locally adapted for maintaining rhythm under extremely low-temperature stress, admixture can also be selected against if the costs of diluting this local adaptation outweigh the benefit of reducing an inbreeding depression (Verhoeven et al., 2004). To determine if cosmopolitan admixture was relevant for the response of a line to extremely low-temperature stress, we added information on a fly’s percentage admixture as an input in our model (data from Pool et al., 2012). We found a significant association between a fly’s proportion of cosmopolitan admixture and its circadian response to extremely low-temperature stress because as admixture increases, flies are less likely to maintain rhythmia (Fig. 1b; Table 1b). Interestingly, we also found that the association between altitude and a fly’s circadian response becomes nonsignificant (Table 1b), indicating that genomic admixture drives the relationship between altitude and rhythmicity.
Next, we sought to determine the extent to which natural populations display variation in their ability to maintain rhythm at a slightly higher temperature (15 °C), and so we phenotyped a random subset of our original pool under this less stressful cold condition. Similarly to the 12 °C data set, we found that natural populations of Drosophila display variation in the manifestation of circadian behavior (Fig. 1c). However, unlike the 12 °C data set, we did not find that altitude is a predictor of a fly’s behavioral response (Table 2a). We also found that cosmopolitan admixture is not a significant predictor of a fly’s likelihood of rhythmicity when included in the model (Fig. 1d; Table 2b).
(a) Altitude is not a significant predictor of a fly’s likelihood of rhythmicity under low-temperature stress (15 °C). (b) There is no significant association between a line’s genomic admixture and its likelihood of maintaining rhythm under low-temperature stress (15 °C).
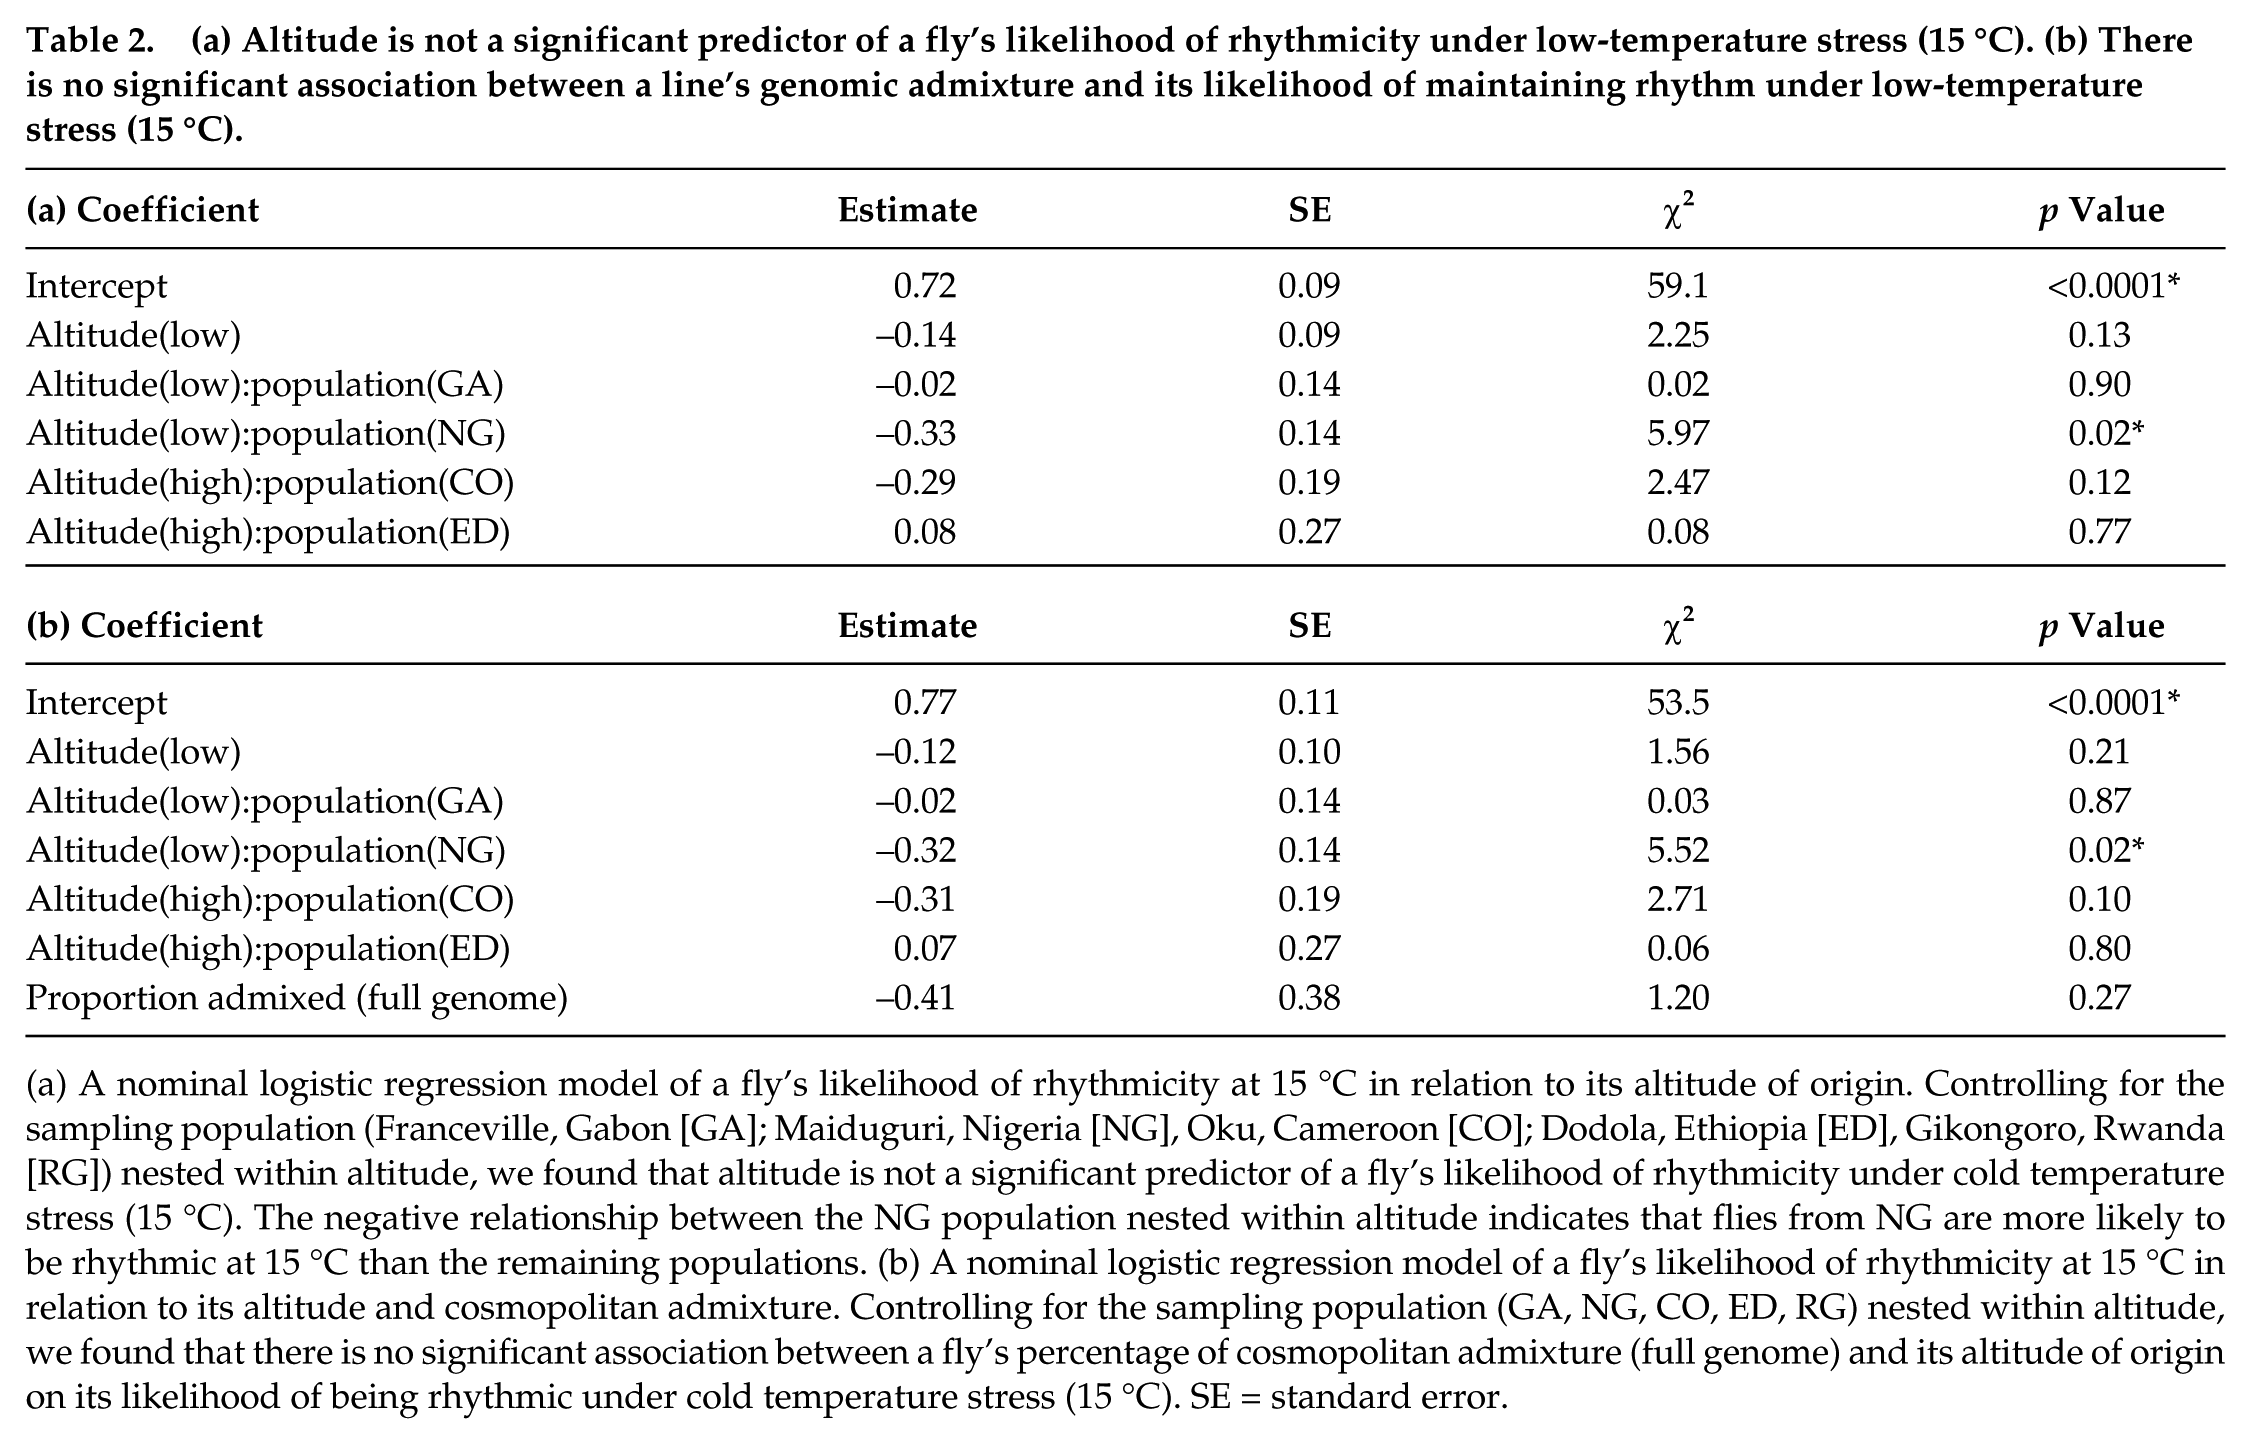
(a) A nominal logistic regression model of a fly’s likelihood of rhythmicity at 15 °C in relation to its altitude of origin. Controlling for the sampling population (Franceville, Gabon [GA]; Maiduguri, Nigeria [NG], Oku, Cameroon [CO]; Dodola, Ethiopia [ED], Gikongoro, Rwanda [RG]) nested within altitude, we found that altitude is not a significant predictor of a fly’s likelihood of rhythmicity under cold temperature stress (15 °C). The negative relationship between the NG population nested within altitude indicates that flies from NG are more likely to be rhythmic at 15 °C than the remaining populations. (b) A nominal logistic regression model of a fly’s likelihood of rhythmicity at 15 °C in relation to its altitude and cosmopolitan admixture. Controlling for the sampling population (GA, NG, CO, ED, RG) nested within altitude, we found that there is no significant association between a fly’s percentage of cosmopolitan admixture (full genome) and its altitude of origin on its likelihood of being rhythmic under cold temperature stress (15 °C). SE = standard error.
For the remainder of the study in which we investigate the mechanistic aspects of the lower-limit trait, we chose to phenotype the isofemale lines under 15 °C, as this temperature yielded more penetrant and robust rhythms.
In Natural Populations, Cold-Buffered Circadian Behavior at 15 °C Is Resistant Only to Low-Temperature Stress or Cross-Resistant to High- and Low-Temperature Extremes (15 °C and 30 °C)
Drosophila respond adaptively to selection for heat (Hoffman et al., 1997) or cold stress (Watson and Hoffman, 1996), resulting in a change of the resistance to high or low temperature, respectively. Less understood in insect thermal physiology is the concept of cross-resistance, in which an adaptation to one stressor (e.g., low temperature) confers an advantage in counteracting the deleterious effects of another (e.g., high temperature). This property may be due to selection of genes that curb the effects of stressors that induce similar physiological responses, predicting positive genetic correlations between the traits of interest. In this experiment, we tested whether cold-buffered circadian behavior at 15 °C (Fig. 1c) is resistant to low-temperature stress only or is cross-resistant to high- and low-temperature extremes. If the cold-buffered rhythm is resistant to low temperature only, we predicted that any of the following behaviors related to rhythm—a line’s proportion of rhythmicity, average rhythm strength (FFT), and/or ability to temperature compensate—would degrade from low- (15 °C) to high- (30 °C) temperature stress. In contrast, if the cold-buffered rhythm is cross-resistant to high- and low-temperature stress, we predicted that there would be no change in the three behaviors between 15 °C and 30 °C. From the isofemale lines we phenotyped in Figure 1c, we identified 4—CO1, NG8, NG10, and NG7—that were highly rhythmic at 15 °C, meaning that the proportion of rhythmic individuals in the line exceeded 70%. We consider these lines as resistant to low-temperature stress because they have robust, cold-buffered rhythm.
For the first resistance assay, we compared the difference in each line’s proportion of rhythmic individuals between low- and high-temperature stress. Of the 4 lines assayed, NG8 shows a significant decrease in rhythmicity from low to high temperature and, so we categorize this line as cold resistant (Fig. 2a; note that comparisons between high- and low-temperature phenotypes for the same line are shown with black asterisks). Next, we used rhythm strength as an output measure of a line’s circadian response to temperature stress. We found that the rhythms of NG8 and NG7 show a decrease in strength when placed under high-temperature stress, indicating that their rhythms are cold resistant (Fig. 2b).
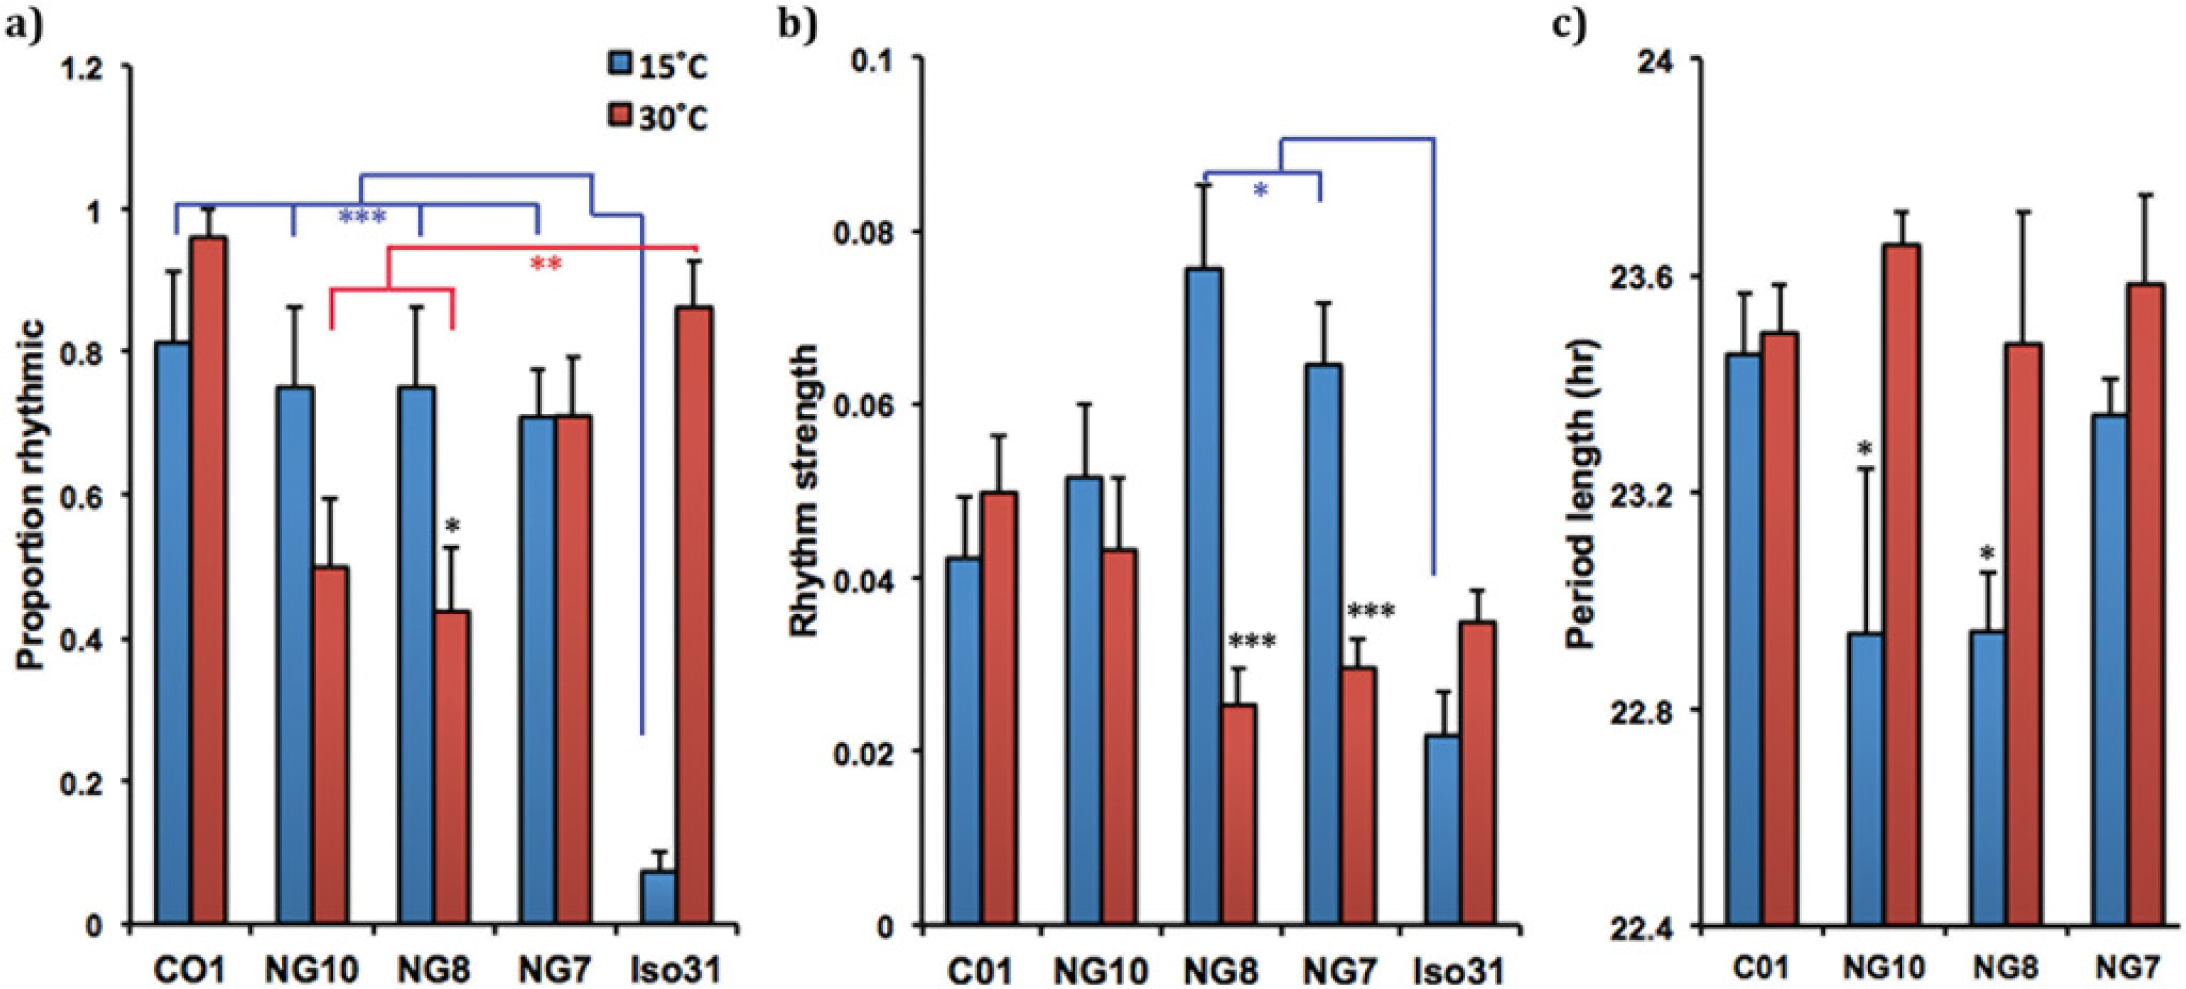
In natural populations, cold-buffered circadian behavior at 15 °C is resistant only to low-temperature stress or cross-resistant to high- and low-temperature extremes (15 °C and 30 °C). Comparisons between high- and low-temperature phenotypes for the same line are shown with black asterisks. Comparisons made between Iso31 and an Isofemale line are shown in blue for low temperature and red for high temperature. (a) Resistance assay for the proportion of isofemale rhythmicity. We used a Fisher exact test to compare differences in the proportion of rhythmic individuals between low- and high-temperature stress for CO1, NG8, NG10, and NG7. *p < 0.05. There is a nonsignificant trend for the proportion of rhythmic individuals in NG10 to decrease from 15 °C to 30 °C (p = 0.09). Cold-buffered lines are more rhythmic than Iso31 at 15 °C. We used Fisher exact tests to compare differences in the proportion of rhythmic individuals between Iso31 and CO1, NG8, NG10, and NG7, respectively. ***p < 0.0005. Iso31 is more rhythmic than some cold-buffered isofemale lines at 30 °C. We used Fisher exact tests measuring the proportion of rhythmic individuals between Iso31 and CO1, NG10, NG8, and NG7, respectively, under high-temperature stress. **p < 0.005. (b) Resistance assay for rhythm strength. Independent sample t tests were conducted to compare the rhythm strength (FFT) between an isofemale line at 15 °C and 30 °C. ***p < 0.0005. NG7 and NG8 show degradation of rhythm strength as a function of temperature. Two cold-resistant lines have stronger rhythm strength than that of Iso31 at 15 °C. We used a 1-way between-subjects analysis of variance (ANOVA) to compare the rhythm strength of Iso31, CO1, NG8, NG10, and NG7. There was a significant effect of low temperature on rhythm strength at the p < 0.05 level for the 5 groups, F(4) = 3.64, p < 0.01. Post hoc comparisons using the Dunnett method indicate that the FFT of Iso31 is significantly lower than that of NG8 and NG7; *p < 0.05. There was no significant difference in mean FFT values among the isofemale lines. There is no difference in rhythm strength between Iso31 the isofemale lines at 30 °C. We used a 1-way between-subjects ANOVA to compare the rhythm strength of Iso31, CO1, NG8, NG10, and NG7. There was a significant effect of high temperature on rhythm strength at the p < 0.05 level for the 5 groups, F(4) = 3.35, p = 0.01. However, post hoc comparisons using the Dunnett method indicate that the FFT of Iso31 is not significantly different from any of the isofemale lines. Instead, we found that the rhythm strength of CO1 is higher than that of NG8 (p < 0.03) and NG7 (p < 0.05). (c) Resistance assay for temperature compensation. Independent sample t tests were conducted to compare the period length between an isofemale line at 15 °C and high 30 °C. *p < 0.05.
Temperature compensation (Hastings and Sweeney, 1957; Pittendrigh, 1993) is a generic circadian property in which the period length of the rhythm does not change within the temperature limits of rhythmicity. To determine whether temperature compensation is maintained in the lines that display rhythms at low temperature, we assessed the circadian period of CO1, NG10, NG8, and NG7 at low and high temperatures (15 °C and 30 °C). We found that NG10 and NG8 show a significant lengthening of their period as a function of temperature, indicating that their rhythm is not temperature compensated (Fig. 2c).
The results of the resistance assays in Figure 2a-c suggest that rhythms of the NG lines are resistant to cold temperature stress only because their rhythmic behavior degrades with high temperature in at least 1 of the 3 resistance assays: NG7, rhythm strength; NG8, proportion rhythmicity, rhythm strength, period length; and NG10, period length. In contrast, our data suggest that the rhythm of CO1 is cross-resistant to high- and low-temperature extremes (15 °C and 30 °C) because its circadian behavior does not vary as a function of temperature. Taken together, these results suggest that in nature, cold-buffered circadian lines at 15 °C can be either resistant to cold-temperature stress or cross-resistant to both high- and low-temperature extremes (30 °C and 15 °C).
Cold-Buffered Rhythmic Lines Withstand Low-Temperature Stress Better Than a Generic Wild-Type Laboratory Line
Using the same data, we next determined whether the cold-buffered rhythmic lines withstand cold temperature stress better than Iso31. We predicted that if an isofemale line is better able to withstand cold temperature stress, then either its proportion of rhythmic individuals or the rhythm strength would be higher than Iso31 at 15 °C. Our data are consistent with this prediction: cold-buffered rhythmic lines have a higher proportion of rhythmic animals (Fig. 2a), and 2 cold-buffered rhythmic lines have a higher rhythm strength (Fig. 2b) under low-temperature stress than Iso31 (note that comparisons made between Iso31 and an isofemale line are shown in blue in Figure 2 for low temperature). Next we determined whether the rhythm of Iso31 is better buffered against high-temperature stress than our cold-buffered lines. If so, then either the proportion of rhythmic individuals or the rhythm strength would be higher in Iso31 than in any of the cold-buffered rhythmic lines at high temperature. Figure 2a is consistent with this prediction because at 30 °C, Iso31 is more rhythmic than 2 cold-buffered rhythmic lines (NG10 and NG8; note that comparisons made between Iso31 and an isofemale line are shown in red in Figure 2 for high temperature). The rhythm strength was not different among the lines at this temperature (Fig. 2b). These data suggest that our laboratory line can buffer high-temperature extremes better than some of our cold-resistant (but not cross-resistant) isofemale lines.
Mapping the Genetic Locus of a 15 °C Cold-Resistant Rhythmic Line (NG7)
To determine whether the cold-resistant circadian behavior of one line (NG7) could be mapped to a single chromosome or if it represented a quantitative output of any combination of the 3 major fly chromosomes (X, second, or third), we isolated each NG7 chromosome into 3 independent lines in an Iso31 background (see the Methods section). As we determined that Iso31 is negative for the cold-resistant rhythmic phenotype (Fig. 2a, b), isolating each NG7 chromosome in an Iso31 background would reveal the source of the behavior. We found that the X-chromosome of NG7 contributes to the phenotype, while the other isolated chromosomes do not (Fig. 3a).
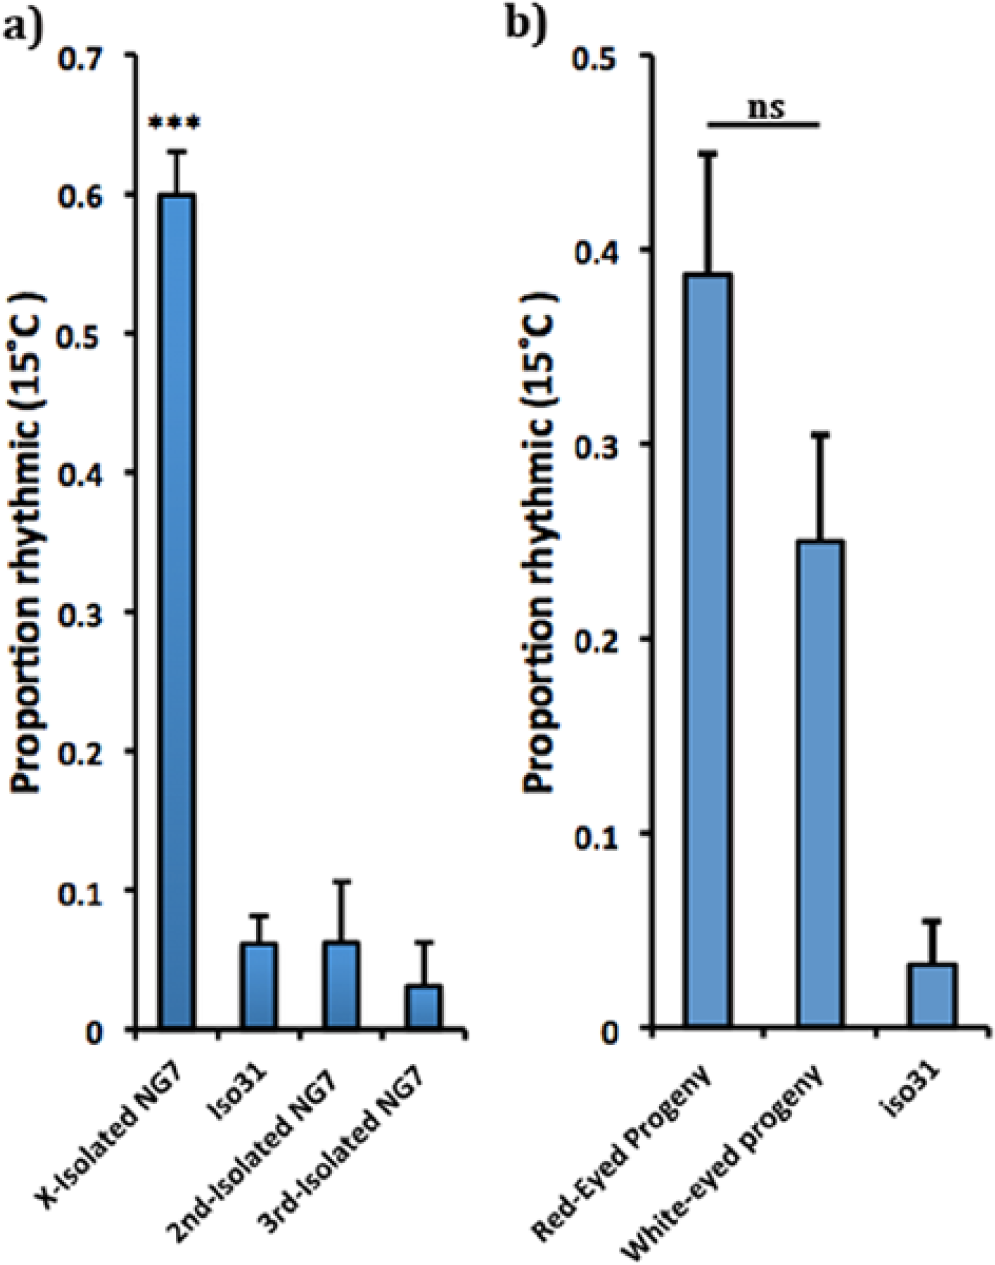
Mapping the genetic locus of a 15 °C cold-resistant circadian line (NG7). (a) The X-chromosome of NG7 underlies cold-resistant circadian behavior. A 1-way between-subjects analysis of variance was conducted to compare the effect of low temperature (15 °C) on rhythmicity for the 4 groups (X-isolated NG7, Iso31, second-isolated NG7, and third-isolated NG7). There was a significant effect of low temperature on rhythmicity at the p < 0.05 level for the 4 groups, F(3) = 71.1, p < 0.0001. Post hoc comparisons using the Tukey HSD test indicate that the mean proportion of rhythmic individuals for the X-isolated NG7 line (M = 0.60, SD = 0.49) was significantly higher than that of Iso31 (M = 0.61, SD = 0.24), the second-isolated NG7 line (M = 0.63, SD = 0.25) and the third-isolated NG7 line (M = 0.31, SD = 0.18); ***p < 0.0001. There is no difference in the proportion of rhythmic individuals at cold temperature among Iso31, the second-isolated NG7 line, and the third-isolated NG7 line. (b) The NG7 clock genes per and sgg do not underlie the cold-resistant rhythmic behavior. Fisher exact test, p = 0.07.
Next, we tested whether the period and shaggy loci are functionally important for the phenotype because these are 2 important clock genes on the X-chromosome and they are implicated in interactions of the clock with temperature (Cheng et al., 1998; Majercak et al., 1999; Low et al., 2008). Because per and sgg are linked to the eye color gene, white (w)—meaning that they are located so positionally close together that they do not recombine—w can be used as a marker of per and sgg allelic identity: NG7 contains a wild-type copy of the allele (w+), which produces red eyes, and Iso31 contains the mutant allele w118, which results in a white-eyed phenotype. Therefore, red-eyed recombinants of the NG7 and Iso31 X-chromosome are expected to have NG7 per and sgg alleles. If the cold-resistant rhythmic phenotype maps to per or sgg, then recombination of the NG7 X-chromosome with the Iso31 X-chromosome (see the Methods section) should yield only red- (and no white-) eyed recombinants that are positive for the behavior. However, we were able to recombine the w118 gene of Iso31 with the NG7, cold-resistant circadian behavior (Fig. 3b), suggesting that the phenotype is not linked to NG7 per or sgg.
A More Robust Circadian Clock Underlies the 15 °C Cold-Resistant Behavioral Rhythm of NG7
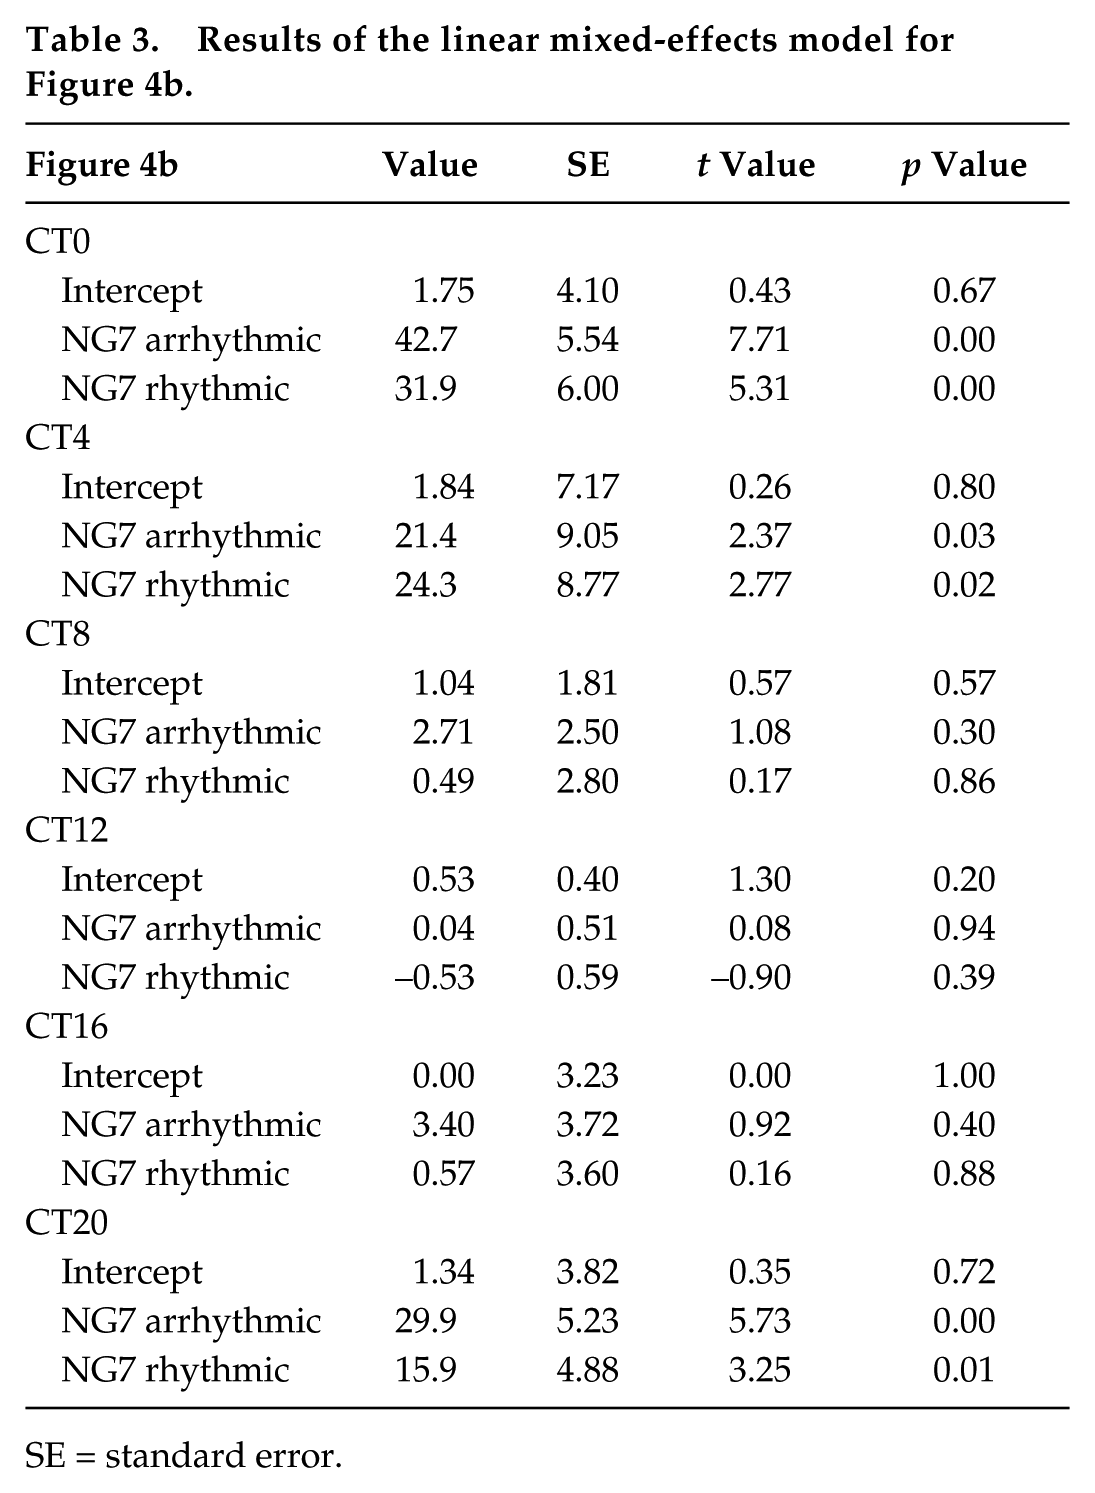
Stronger behavioral rhythm at lower temperature could result from enhanced clock function or from better transmission of output signals from the clock. To distinguish between these 2 possibilities, we assayed molecular cycling of the clock protein, PER, in the s-LNVs, which are central clock cells of the Drosophila brain. As not all NG7 flies are rhythmic at lower temperature, we first assayed all flies for behavior to separate them into rhythmic and arrhythmic groups. Briefly, we entrained flies from the NG7 X-chromosome cold-resistant circadian strain (generated in Fig. 3a) as well as Iso31 to 3 d of 12:12 h light:dark cycles. On the fourth day, we moved the flies into constant darkness and let them free run for 4 d, after which we scored the behavior of the flies as either rhythmic or arrhythmic based on the strength of the rhythm. All Iso31 flies were arrhythmic in this experiment. Once we characterized the behavior of individual flies, we reentrained them for 1 d to resynchronize molecular oscillations across flies and then returned them to constant darkness. On the first day of constant darkness (DD1), we dissected the brains of rhythmic and arrhythmic NG7 as well as Iso31 flies at 4-h intervals. We then examined PER expression by immunohistochemistry in the s-LNVs, which are central clock cells of the Drosophila brain that maintain free-running rhythm (Grima et al., 2004) and can be identified through their expression of a neuropeptide, PDF. Representative images of the IHC are shown in Figure 4a. We found that rhythmic and arrhythmic NG7 flies have stronger PER oscillations in central clock cells at 15 °C than Iso31 (Fig. 4b), indicating that the strong behavioral rhythm of NG7 is due to stabilization of the central clock as well as the clock output under cold-temperature stress. Table 3 illustrates the linear mixed-effects model regression weights and significance levels for each treatment group in predicting mean PER expression for each time point.
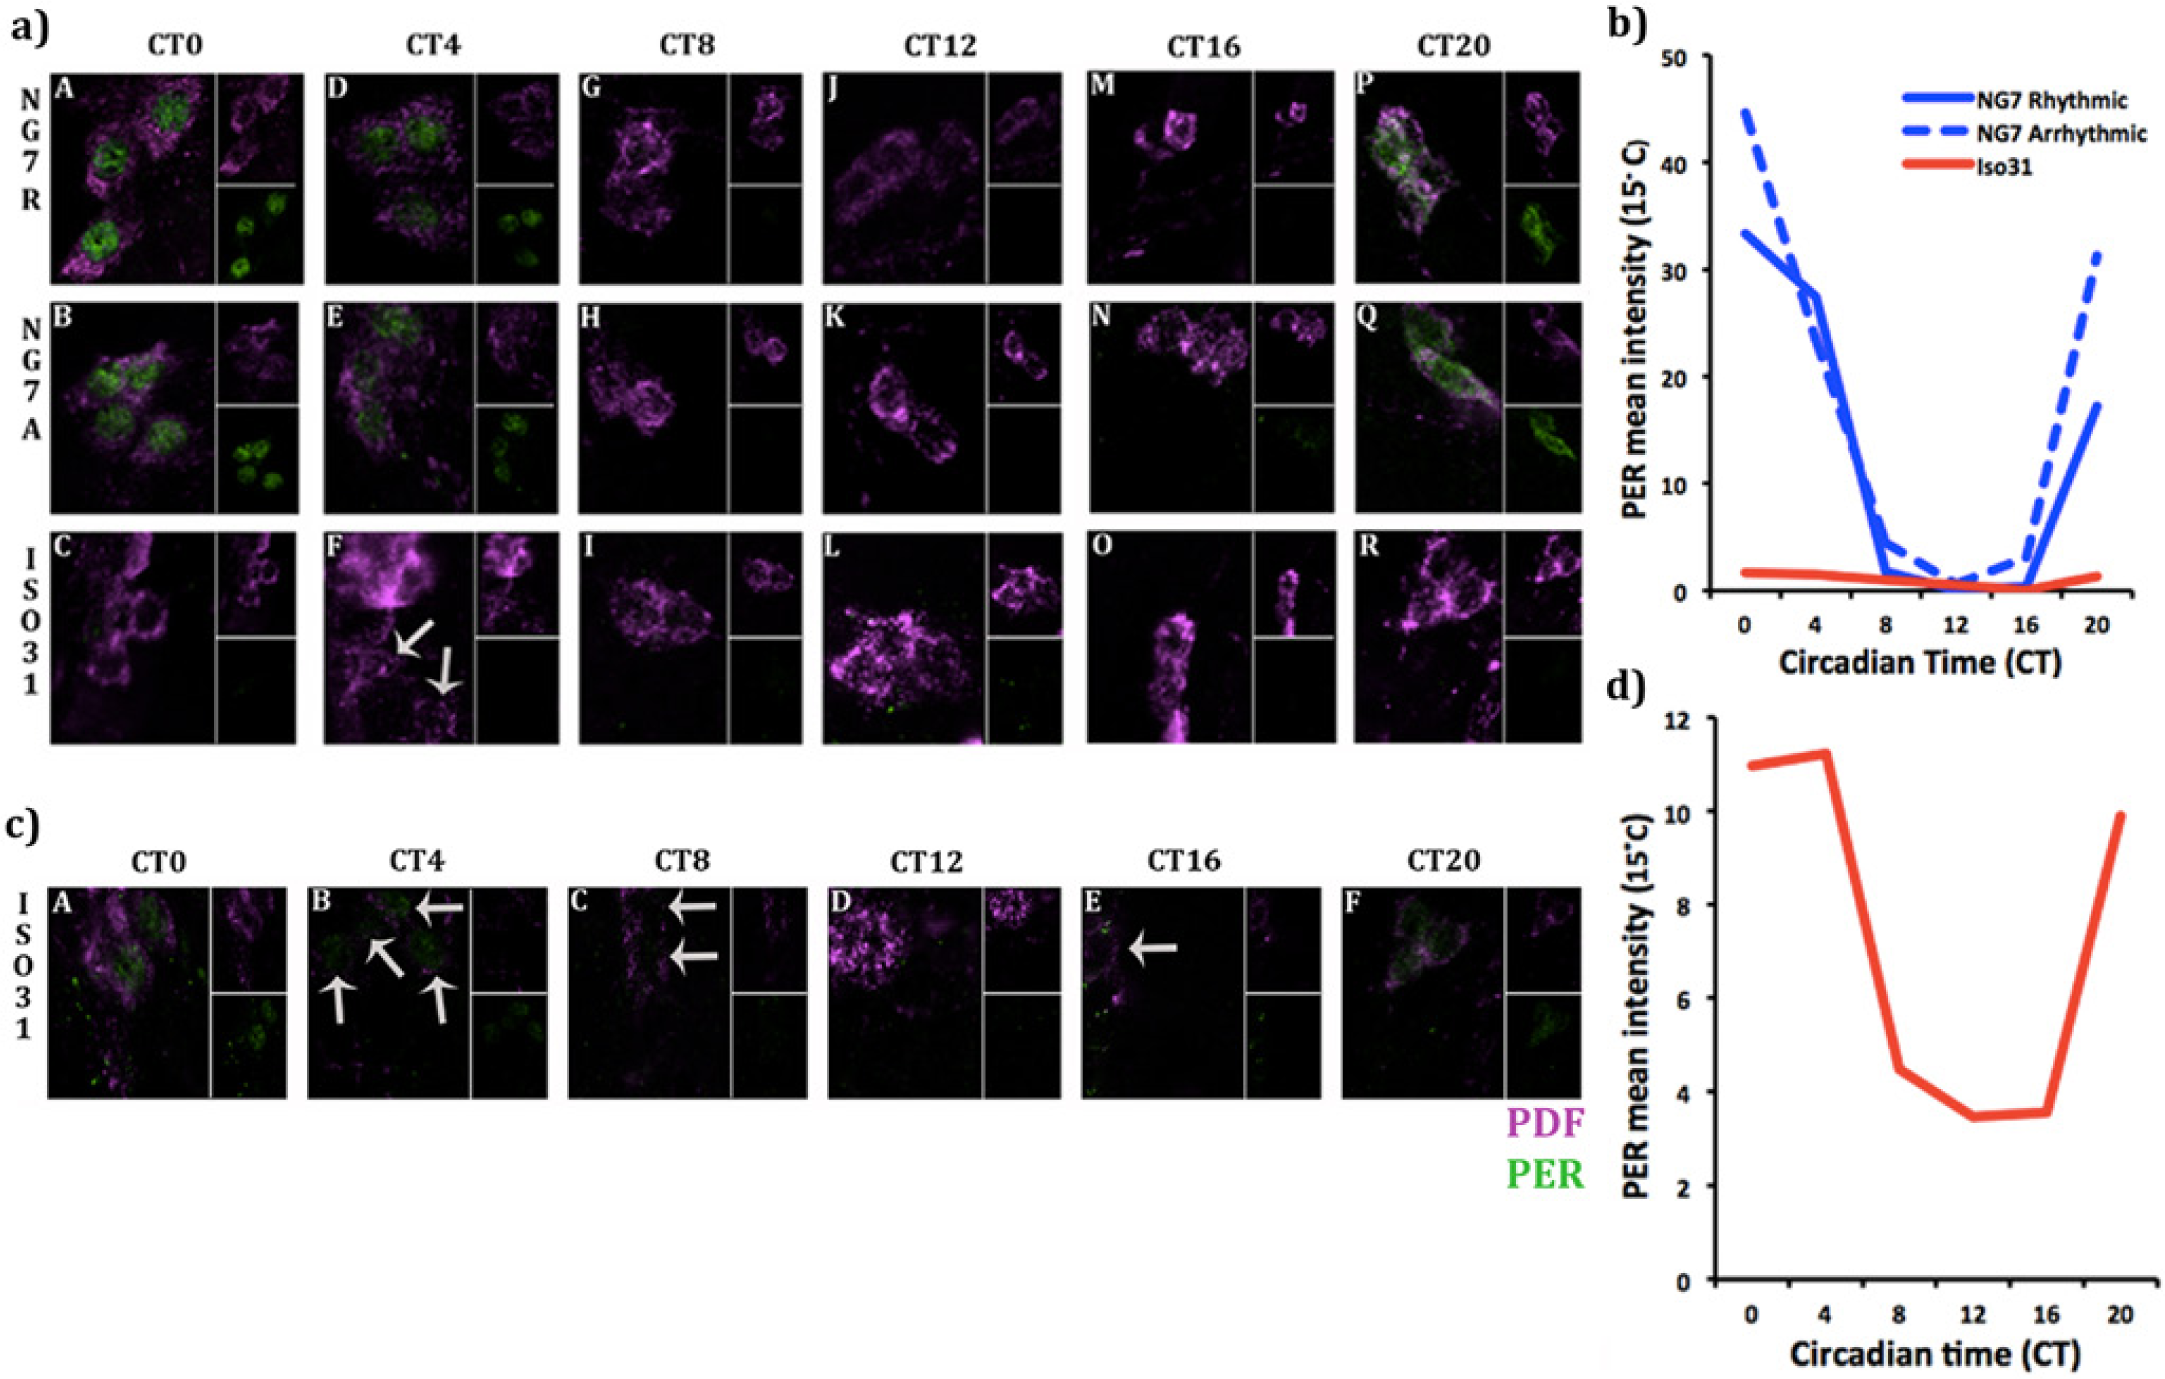
A more robust circadian clock underlies the 15 °C cold-resistant behavioral rhythm of NG7. (a) Representative images of PER (green) and pigment-dispersing factor (magenta) staining in the small ventral-lateral neurons (s-LNVs) of rhythmic and arrhythmic NG7 flies (NG7R and NG7A, respectively) as well as Iso31. Rhythmic and arrhythmic NG7 flies express classic cycling of PER protein in the s-LNVs throughout the circadian cycle: PER is primarily nuclear between CT0 and CT4 (panels A, B and D, E), absent in the middle of the subjective day at CT8-16 (panels G, J, M and H, K, N), and then cytoplasmic toward the end of the cycle at CT20 (panels P and Q). In contrast, PER is absent in the s-LNVs in Iso31 throughout the circadian cycle (panels C, F, I, L, O, R) under the same detection level for PER. (b) NG7 has enhanced PER oscillations relative to Iso31 at cold temperature. Group means of PER expression in the s-LNVs of rhythmic and arrhythmic NG7 flies as well as Iso31. (c) Representative images of the Iso31 s-LNVs captured under enhanced detection. When we captured images of the Iso31 samples using a stronger PER detector than in Figure 4a and 4b, we found that PER expression is not disrupted at low temperature. (d) Iso31 has a dampened (not disrupted) circadian clock at cold temperature. Group means of the requantified Iso31 genotype show that PER oscillations persist, suggesting that Iso31 produces lower levels of PER protein in the s-LNVs than NG7 throughout the circadian cycle. The pattern of PER cycling is the same between Iso31 and NG7 individuals: PER is present at CT0, 4, and 20 but absent at CT 8, 12, and 16. Note that Figures 4a, b and 4c, d were analyzed using a different calibration of mean PER intensity. Therefore, scales of 4b and 4d are not the same and are not comparable.
Results of the linear mixed-effects model for Figure 4b.
SE = standard error.
In comparison with NG7, PER expression appeared low and noncyclic in Iso31 at 15 °C (Fig. 4a, b). To determine whether PER oscillations in Iso31 are indeed disrupted or merely reduced in amplitude, we enhanced the detection of PER expression in Iso31 using a calibration specific to an Iso31 s-LNV cell with maximal PER expression. A disrupted molecular profile would produce a flat protein expression profile throughout the circadian time course. Representative images of this requantification are show in Figure 4c. The group means of these samples show that PER cycling is not disrupted (Fig. 4d) but considerably dampened, due to an overall reduction in levels relative to expression in NG7.
Enhanced PER Expression of the NG7 Cold-Resistant Clock Is Specific to Cold Temperature Stress
To determine whether enhanced PER expression of the NG7 cold-resistant clock relative to Iso31 (Fig. 4) is specific to low-temperature stress, we performed IHCs on NG7 and Iso31 s-LNVs at room temperature (25 °C) using the same methods as above. Both genotypes were rhythmic in this experiment. Representative images of NG7 and Iso31 flies are shown in Figure 5a. Group means of the 2 genotypes show that there is no difference in PER expression at room temperature (Fig. 5b). Table 4 illustrates the linear mixed-effects model weights and significance levels for each treatment group in predicting mean PER expression for each time point.
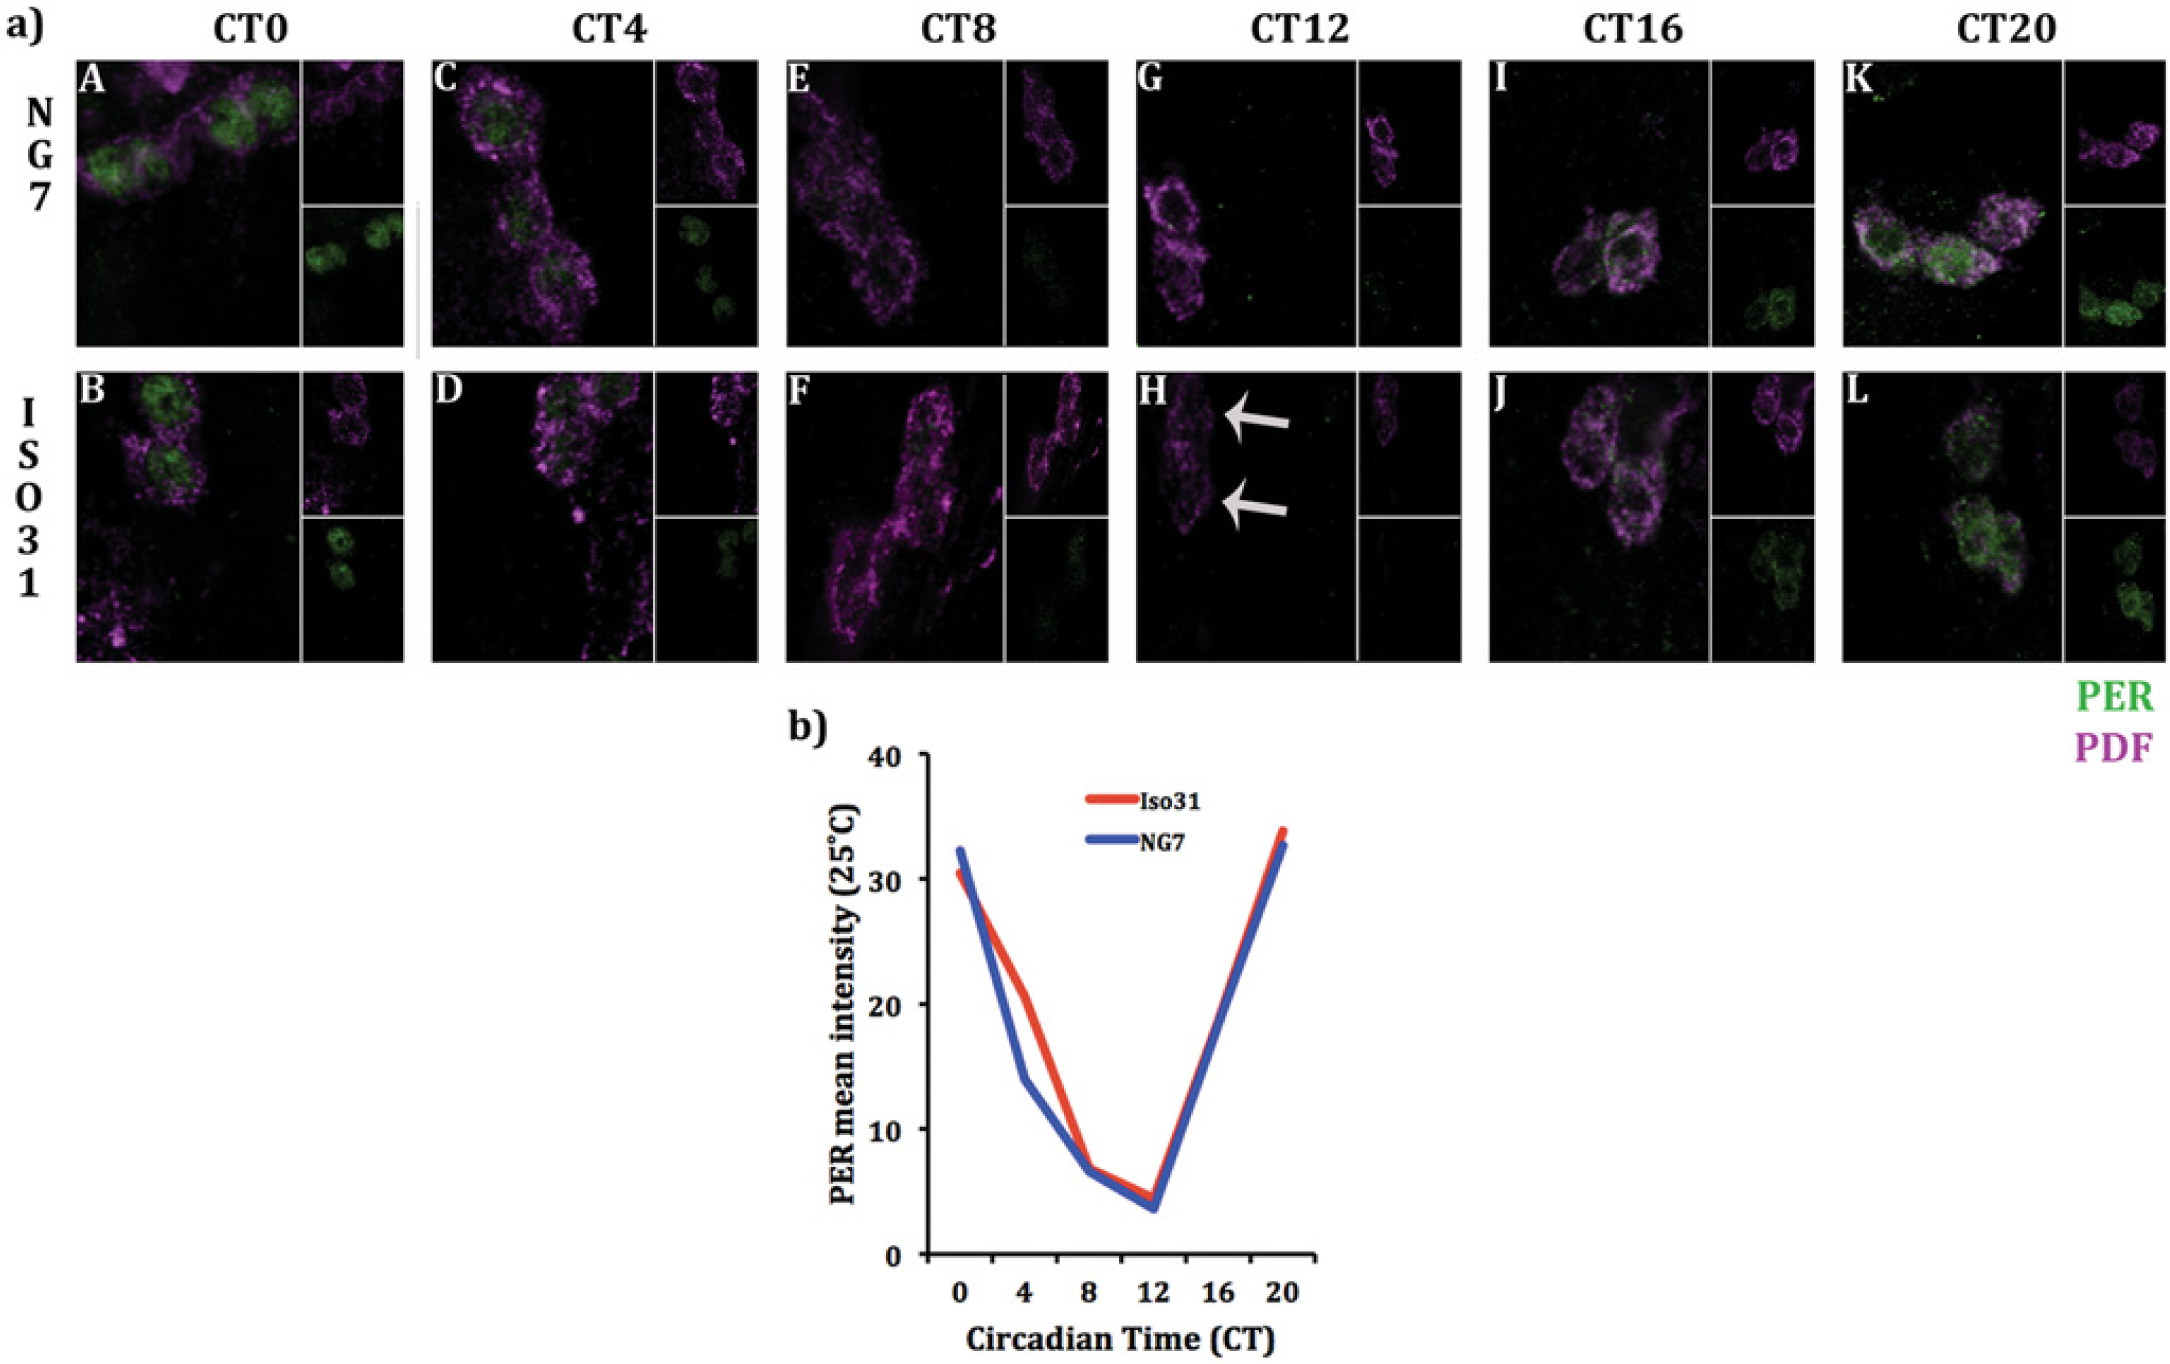
Enhanced PER expression of the NG7 cold-resistant clock is specific to low-temperature stress. (a) Representative images of NG7 and Iso31 PER expression in the small ventral-lateral neurons (s-LNVs) under room temperature. (b) The higher level of PER expression in the s-LNVs of NG7 observed in Figure 4a and 4b is a specific response to cold temperature stress. Group means reveal that there is no difference in PER expression between the genotypes throughout the circadian cycle. Both groups exhibit classic patterns of PER nuclear and cytoplasmic localization. Note that Figures 4a, b and 4c, d and 5a, b were analyzed using a different calibration of mean PER intensity. Therefore, scales of 4b-d and 5b are not the same and are not comparable.
Results of the linear mixed-effects model for Figure 5b.
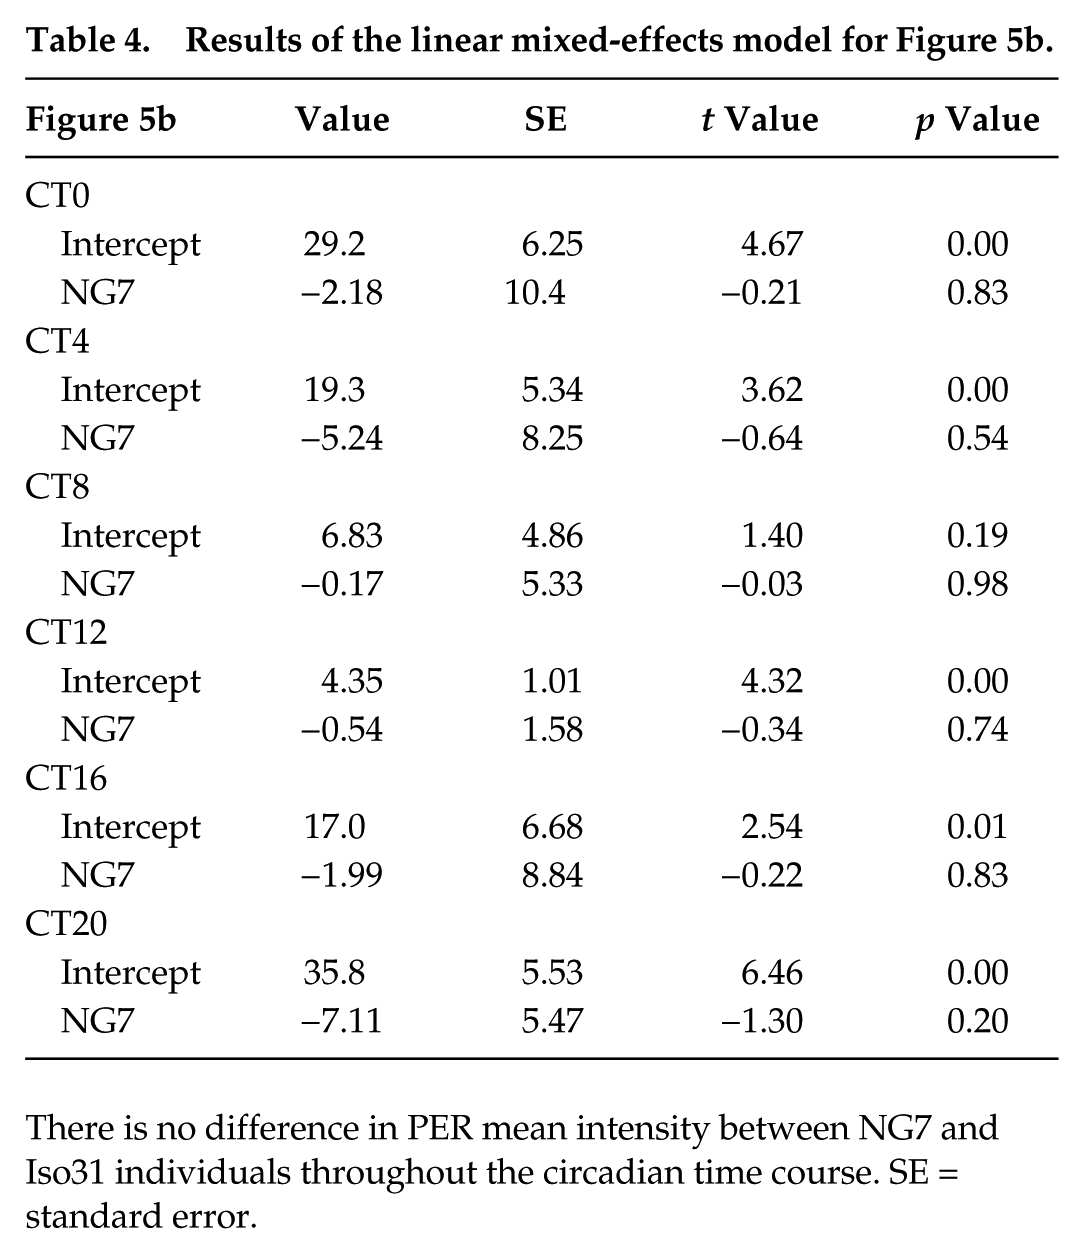
There is no difference in PER mean intensity between NG7 and Iso31 individuals throughout the circadian time course. SE = standard error.
Discussion
Little is known about the evolutionary significance and mechanistic features of the lower temperature limit property of circadian rhythm, especially in Drosophila, in which there has been no research effort. In this study, we used 46 isofemale lines isolated from 6 different natural populations of D. melanogaster to address these issues. Previous work has shown that physiological traits influenced by temperature (such as the temperature compensation property of the clock, cold tolerance, and reproductive diapause) are under predictable selection pressures of the environment, so natural populations offer a unique medium to understand the biological (e.g., whether the trait is evolutionarily relevant) and mechanistic (why Drosophila experience overt loss of behavior rhythm) features of this trait.
Our study is the first to capture the diversity in how the Drosophila circadian system responds to low-temperature stress: under both extremely low (12 °C) and low (15 °C) temperatures, some isofemale lines are better at maintaining behavioral rhythm than others (Fig. 1a, c). Interestingly, we found evidence that this variability is evolutionarily relevant at 12 °C because high-altitude populations exhibit selection for locally adapted genomes that contribute to rhythmic behavior (Table 1). However, our data show that the maintenance of rhythmicity at 15 °C is not functionally significant because we did not find evidence of selection for rhythmic behavior as a function of altitude or cosmopolitan admixture (Table 2). While the evolutionary significance of differential patterns of rhythmicity at 12 °C and 15 °C is unknown, one possible explanation for this difference is that both native and cosmopolitan populations may experience temperatures of 15 °C or higher. In this scenario, both high- and low-altitude populations would experience equal selection pressures of native and nonnative genomes. However, high-altitude populations might experience cold temperature extremes (<15 °C), where a local adaptation to the environment would be selectively advantageous. This condition might then cause a differential selection pattern for native genomes that contain circadian allele(s) specialized to buffer extreme cold in the high population group.
For the lines that withstand cold temperature stress at 15 °C, we found additional diversity in how they respond to temperature stress in general. Some of these cold-buffered lines display rhythms that are resistant only to low-temperature stress (NG7, NG8, NG10; Fig. 2), whereas others are cross-resistant to both high- and low-temperature extremes (15 °C and 30 °C; CO1, Fig. 2). Extension of this work to natural populations on other continents and from other habitats would be required to further evaluate the significance of resistance to a specific temperature extreme and cross-resistance to temperature extremes.
Our research also highlights the advantage of using lines derived from natural populations to identify novel loci relevant to temperature-influenced circadian traits. Although the locus responsible for the phenotype of one cold-resistant strain (NG7) maps to the X-chromosome (Fig. 3a), it does not appear to be the canonical clock gene, period (per) (Fig. 3b). This is distinct from findings in Neurospora crassa, in which the determinants of the lower limit are linked to the central clock gene, frequency (frq) (Liu et al., 1997). In this study, we have shown that the rhythm of at least 1 isofemale line is resistant to low-temperature stress due to a locus unrelated to per (Fig. 3b), which is surprising given that this gene is important for other ways the clock interacts with temperature. For example, the structure of per is fundamentally important for temperature-dependent changes in the distribution of daily activity patterns (Majercak et al., 1999; Low et al., 2008) whereby temperature-sensitive splicing of per (Cheng et al., 1998) facilitates the temperature-mediated advance and delay in behavior.
Although per is not the allelic source of NG7, we believe that the enhanced PER expression we observed in NG7 at low temperature (Fig. 4a, b; Table 3) is functionally important for maintaining rhythmicity. The cold-resistant circadian behavior of NG7 is most likely due to more robust oscillations of core clock genes. As shown from our IHC data, PER expression is significantly higher in the s-LNVs of NG7 than Iso31 during times at which it is typically elevated, from CT20-4 (Fig. 4a, b; Table 3). As shown previously (Liu et al., 1997; Lim and Allada, 2013), a threshold amount of PER is required for the circadian rhythm to persist, and this level changes as a function of temperature. Our wild-type line is likely arrhythmic under cold temperature stress because their s-LNVs do not reach sufficient PER expression to achieve rhythmicity. We note that we observed oscillations (Fig. 4c, d) when imaging the circadian cells under a lower calibration for PER.
Interestingly, our data also suggest that while enhanced clock function is necessary for overt rhythm to persist under low-temperature stress, it is not sufficient because there is no difference in PER levels between rhythmic and arrhythmic NG7 flies throughout the circadian cycle (Fig. 4a, b; Table 3). Thus, mechanisms downstream of the clock also need to be resistant to low temperature to produce rhythmic behavior. Given that the overall behavior can be recombined with w (and, therefore, is not linked to per/sgg), we suggest that the NG7 line contains component(s) distinct from per and sgg on the X-chromosome (Fig. 3b) that enhance PER oscillations in the s-LNVs at low temperature and stabilize output circuits necessary for rhythmic behavior. Furthermore, our data also suggest that these component(s) are active in response to cold-temperature stress only, since we did not observe a difference in PER cycling between NG7 and Iso31 under standard temperature conditions (Fig. 5a, b; Table 4).
Footnotes
Acknowledgements
The authors thank David Garbe and Mi Shi for their help on the IHC experiments and mapping aspect of the project, respectively. Chris Reece provided invaluable support for the statistical work. This article benefited from the comments of anonymous reviewers. S.E.M. was funded by an NIH predoctoral training grant (HL07953). P.S.S. was supported by a grant from the NIH (RO1GM100366). A.S. was supported by a grant from the NIH (RO1NS048471). Data included in this article will be made available upon request.
Conflict of Interest Statement
The authors declared no potential conflicts of interest with respect to the research, authorship, and/or publication of this article.