
Abstract
Light not only entrains the circadian system but also has acute effects on physiology and behavior, a phenomenon known as masking. Behavioral masking responses to bright light differ in diurnal and nocturnal species, such that light increases arousal in the former and decreases it in the latter. Comparisons made within a species that displays both diurnal and nocturnal patterns of behavior may provide insight into how masking differs between chronotypes and the association between mechanisms controlling masking and the circadian drive for activity. Nile grass rats (Arvicanthis niloticus) provide a useful model for studying such issues because when these animals are housed with running wheels, some run primarily during day, while others run at night. Here we compared behavioral masking responses to 2-h pulses of light and darkness given across a 12:12 light/dark cycle in day-active (DA) and night-active (NA) grass rats. Both wheel-running activity (WRA) and general activity (GA) were monitored. Light pulses at night tended to increase both WRA and GA overall in the DA grass rats, while in NA grass rats, light pulses significantly reduced WRA but had no effect on GA. Dark pulses during the day tended to decrease both WRA and GA in the DA grass rats, while in the NA grass rats, they tended to increase WRA in the early day but had no effect on GA overall. Next, we measured cFos expression within 2 brain areas potentially involved in masking, the intergeniculate leaflet (IGL) and the olivary pretectal area (OPT), of DA and NA grass rats either sacrificed on a control night or after a 1-h light pulse at ZT14. In DA grass rats, light at ZT14 induced cFos in the IGL and OPT, whereas in NA grass rats, cFos levels in both structures were high at ZT14 and were not altered by a 1-h light pulse. Overall, these results suggest that masking responses to light and darkness are dependent on the chronotype of the individual and that the responsiveness of the IGL and OPT to light may depend on or contribute to the behavioral response of these animals.
Keywords
Light shapes an organism’s daily activity profile in two general ways. First, it entrains endogenously generated circadian rhythms to the environmental light-dark cycle, which it does in mammals through a projection from the retina to the suprachiasmatic nucleus (SCN) (Moore and Eichler, 1972; Moore and Lenn, 1972; Stephan and Zucker, 1972). Light can also have more acute effects on arousal, a process known as masking. Whereas bright light increases arousal in diurnal species (“positive masking”), it decreases arousal and induces sleep in nocturnal ones (“negative masking”) with the reverse pattern of responsiveness often being true of darkness (Mrosovsky, 1999). However, masking can vary among individuals within a species and can sometimes be modified in striking ways by changes in the environment. For example, in some diurnal rodents, masking effects of light can be reversed with the introduction of a running wheel (Redlin and Mrosovsky, 2004; Vivanco et al., 2009; Weinert et al., 2007).
Here we used the Nile grass rat to examine intraspecific variation in masking responses to light and darkness. One advantage of studying variation in masking within a species is that any differences in response to light can be attributed to the chronotype and not merely to a difference between the species. The Nile grass rat is native to sub-Saharan Africa and is strongly diurnal in the field and under standard laboratory conditions (Blanchong and Smale, 2000; Katona and Smale, 1997; McElhinny et al., 1997). This species is adapted to a diurnal way of life as indicated by body temperature rhythms, sleep, and reproductive behavior (McElhinny et al., 1997; Schwartz and Smale, 2005); the visual system is also equipped for a diurnal life with a ratio of cones to rods that is 10 times higher than that seen in typical nocturnal rodents (Gaillard et al., 2008; Hut et al., 2012) and a superior colliculus that is the same size as that of a nocturnal laboratory rat 4 times its size (Gaillard et al., 2008; Gaillard et al., 2013). When given access to running wheels, however, some grass rats run during the day, while others restrict their wheel running to the night (Blanchong et al., 1999). These night-active (NA) grass rats retain some diurnal characteristics, such as the timing of the body temperature nadir (Blanchong et al., 1999) and longer nighttime sleep bout lengths (Schwartz and Smale, 2005), while displaying some nocturnal characteristics, such as having PER1/2 rhythms in many extra-SCN oscillators that are 180° out of phase with those of day-active (DA) grass rats (Ramanathan et al., 2010). The NA profile of wheel running persists in constant darkness (Mahoney et al., 2001), suggestive of a change in the circadian regulation of activity in these animals.
In the current study, we tested the hypothesis that mechanisms controlling masking and the circadian drive for activity are associated. A circadian drive for daytime activity together with an arousal response to light may help consolidate locomotor activity and confine it to the daytime in diurnal species, with the reverse processes occurring in nocturnal ones. If the above coupling hypothesis is correct, then masking responses to bright light and darkness should depend on the prevailing chronotype of the individual. To determine whether this is the case, we exposed DA and NA grass rats to pulses of light and darkness across the night and day, respectively.
The second part of this study focused on potential brain regions mediating masking and whether the responsiveness of cells in these areas to light is dependent on the behavioral response of the animal. Currently, very little is known about how the neural pathways contributing to this process may differ in diurnal and nocturnal animals. Lesion studies suggest that 2 brain areas that receive direct retinal input, the intergenticulate leaflet (IGL) of the thalamus (Gall et al., 2013; Redlin et al., 1999) and the olivary pretectal area (OPT) of the pretectum, may play a role (Miller et al., 1998). Both the IGL and OPT receive input from melanopsin-containing retinal ganglion cells, which are essential for normal circadian entrainment, the pupillary light reflex, and masking responses to light in nocturnal mice (Goz et al., 2008; Guler et al., 2008; Hatori et al., 2008; Hattar et al., 2006). Melanopsin-containing retinal ganglion cells are also present in the retina of diurnal mammals, including 2 species of Arvicanthis (A. niloticus, unpublished data; A. ansorgei, Karnas et al., 2013) and humans (Hannibal et al., 2004; Provencio et al., 2000), but their specific role in irradiance detection in diurnal species is yet to be determined. Here we measured the light-induced expression of the immediate early gene cFos in the IGL and OPT in grass rats to determine if these structures respond differently in the diurnal and nocturnal chronotypes.
Materials and Methods
Animals and Housing
Adult female grass rats from a breeding colony maintained at Michigan State University were used in this study. Animals were singly housed in plexiglass cages (34 × 28 × 17 cm3) with access to food (PMI Nutrition; Prolab RMH 2000, Brentwood, MO) and water ad libitum. To identify DA and NA wheel runners, each cage was equipped with a running wheel (17 cm diameter, 8 cm width). Each wheel revolution was picked up by a monitoring system (VitalView; MiniMitter, Bend, OR) and measured as a single count. General activity (GA) was monitored via an infrared (IR) detection system (VitalView; MiniMitter) with sensors located on the lid of each cage. For both wheel-running activity (WRA) and GA, all counts were binned into 5-min periods. Actograms were created using ClockLab (Actimetrics, Inc., Wilmette, IL). All experiments we performed in accordance with guidelines established by the National Institutes of Health Guide for the Care and Use of Laboratory Animals and the Michigan State University Institutional Animal Care and Use Committee. All efforts were made to minimize the number of animals used in these experiments.
Chronotype Determination
Animals were housed with a running wheel for at least 2 weeks in a 12:12 LD cycle (40-175 lux at side of cage; variation in light intensity had no effect on present results). White fluorescent bulbs provided illumination during the light period and a red light (<1 lux) was kept on throughout the night. The proportion of wheel running that occurred during the light period divided by the total wheel running across the 24-h day was used in categorization of animals as DA or NA. Animals were considered to be DA when that ratio was >50% and wheel-running activity occurred across the light phase and as NA when that ratio was <50% and at least 100 wheel revolutions occurred from zeitgeber time (ZT, where ZT0 = lights-on) 18 to 20. Animals that fit neither of the above criteria were excluded from the analyses. After 3 weeks, DA and NA animals were randomly reorganized in the housing room to ensure that equal numbers of DA and NA animals would have access to IR sensors, which were limited.
Behavioral Response of Masking to 2-h Pulses in LD Conditions
Administration of each 2-h pulse of darkness or light (during the light and dark phases of the 12:12 LD cycle, respectively) involved a 3-day protocol that was repeated in succession; this design was similar to those used by Redlin and Mrosovsky (2004) and Shuboni et al. (2012) (see Suppl. Fig. S1). The first day (maintenance day) was used for weekly cage changes and upkeep of the housing room. The second day (baseline day) was used for comparison to the next day’s activity during the light or dark pulse. On the third day (experimental day), all animals received a single dark (room lights turned off) or light (room lights turned on) pulse. Dark pulses (DPs) were administered at ZTs 0, 2, 4, 6, and 8 and light pulses (LPs) at ZTs 12, 14, 16, 20, and 22. All light pulses were administered before any of the dark pulses. The light pulses were given in the order of ZT16, 14, 22, 20, and 12, followed by the dark pulses in the order of ZT8, 2, 6, 4, and 0. It took a total of 30 days to complete the protocol (10 dark/light pulses given during a 3-day protocol). Some animals switched their wheel-running patterns after the start of the experiment and were excluded from the analyses. Two cohorts of animals were used for the DP portion of the experiment because the number of DA animals remaining at the conclusion of the series of light pulses was low. Thus, a total of 46 animals were used (n = 30 from cohort 1 exposed to both light and dark pulses and n = 16 from cohort 2 exposed to only dark pulses). Of those 46 animals, 22 did not meet the criteria for inclusion as either DA or NA subjects and were excluded from analysis (n = 15 from cohort 1 and n = 7 from cohort 2). The data below, therefore, come from 15 of 30 animals exposed to the series of light pulses (n = 4 DA, 11 NA) and 24 of 46 animals exposed to the dark pulses (n = 9 DA, 15 NA).
Brain Responses to Light Pulses
A total of 35 grass rats were used to measure light-induced cFos expression in response to a 1-h LP at ZT14. In this experiment, some DA grass rats did not show a behavioral response to the LP, and they were evaluated as a separate group. Overall, this study included 8 DA controls unexposed to light, DA animals with (n = 7) and without (n = 5) a light-induced increase in activity, 7 NA controls, and 8 NA animals exposed to light (all of which decrease their activity in response to the light).
Tissue collection
Animals were sacrificed immediately following the 1-h LP at ZT14, or at the same time on a control night with sodium pentorbital (Nembutal; Ovation Pharmaceutical, Deerfield, IL; 0.5 cc/animal), and perfused transcardially with 0.01M phosphate-buffered saline (PBS; pH 7.4) followed by 4% paraformaldehyde (Sigma-Aldrich, St. Louis, MO) with 75 mM lysine (Sigma-Aldrich) and 10 mM sodium periodate (PLP; Sigma-Aldrich) in 0.1M phosphate buffer (PB). Brains were harvested and postfixed in PLP for 4 h followed by at least 24 h in 20% sucrose solution in 0.1M PB at 4 °C. Coronal sections (30 µm) were cut on a cryostat and collected in 3 alternating series. Tissue was stored in cryoprotectant (Watson et al., 1986) at –20 °C until further processing.
Immunohistochemistry (IHC)
One series of sections from each animal was processed for staining of cFos using methods described in detail in Castillo-Ruiz et al. (2010). The rabbit anti-c-Fos primary antibody (Santa Cruz Biotechnology, Dallas, TX) was used at a concentration of 1:25,000 and the secondary biotinylated donkey anti-rabbit antibody (Jackson ImmunoReseach Laboratories, West Grove, PA) was used at a concentration of 1:200; normal donkey serum was used as a blocking agent. Following the reaction, sections were mounted on gelatin-coated slides, dehydrated, and coverslipped using dibutyl phthalate xylene (DPX; Sigma-Aldrich).
Cell-Counting Procedure
cFos-immunoreactive cells were counted using a camera lucida drawing tube mounted on a Zeiss light microscope (Axioskop 2 Plus; Zeiss, Göttingen, Germany) by an investigator unaware of the experimental group to which each animal belonged. Bilateral counts across 2 sections were averaged for each brain area. Cells were counted using a 10x (IGL) or 25x (OPT) objective, and manual traces of the borders of the caudal IGL and rostral OPT were made corresponding to atlas plate 71 of the rat brain atlas by Paxinos and Watson (2005).
Statistical Analysis
Wheel-running and general activity were each subject to 4 different 2-factor repeated-measures analyses of variance (ANOVAs). Specifically, for each of these dependent variables, separate analyses were done on data from DA and NA animals, and the analyses of effects of dark pulses during the light period and of light pulses during the dark period were done separately. In each of these ANOVAs, one factor was time (ZTs 0, 2, 4, 6, and 8 for the analyses of effects of dark pulses during the light period and ZTs 12, 14, 16, 20, and 22 for analyses of effects of light pulses during the dark period), and the second factor was light treatment (light pulse vs. baseline in one analysis and dark pulse vs. baseline in the other analysis). Each of the 2 factors was treated as repeated measures (i.e., there were no between-subject factors in any of the analyses). Significant interactions between time and light treatment were followed by analyses of each light treatment at each time point via the use of paired sample t tests (2-tailed test). Significant main effects of time were followed up with post hoc analyses using pairwise comparisons with a Bonferroni adjustment.
In the cFos experiment, a 2-factor ANOVA was used to determine whether cFos expression in each brain area was affected by chronotype (factor 1; DA vs. NA) and pulse (factor 2; control vs. light pulse); cFos counts were square root transformed to equalize the variance among the groups. Significant interactions were broken down by analyses of simple main effects of pulse for each chronotype. Two distinct groups arose within the DA grass rats (those that responded with an increase in WRA to the ZT14 light pulse vs. those that did not change their WRA at all), so a multivariate 1-factor ANOVA was used to test whether cFos expression in each brain area was affected by group (control vs. light pulsed with masking response vs. light pulsed with no masking response). A post hoc Tukey test was conducted to identify significant pairwise mean differences between the DA groups. Two distinct DA groups did not arise during the 2-h pulse at ZT14 in the first experiment, so the DA animals were analyzed as a single group in that study. SPSS version 19 (SPSS, Inc., an IBM Company, Chicago, IL) was used for all statistical tests, and tests were considered significant if p < 0.05. Data are presented as the mean ± standard error of the mean (SEM) in all figures.
Results
Wheel Running and General Activity of Day- and Night-Active Grass Rats
DA grass rats (n = 10) displayed bouts of WRA across the light phase of the light-dark cycle, whereas NA (n = 14) grass rats restricted their WRA to the dark phase. Representative actograms of a single DA and NA grass rat are displayed in Figure 1. Records of GA revealed that DA grass rats were active in their cages primarily during the day (Fig. 1A). Interestingly, although they did not run in their wheels during the day, NA grass rats were very active in their cages at this time (Fig. 1B).
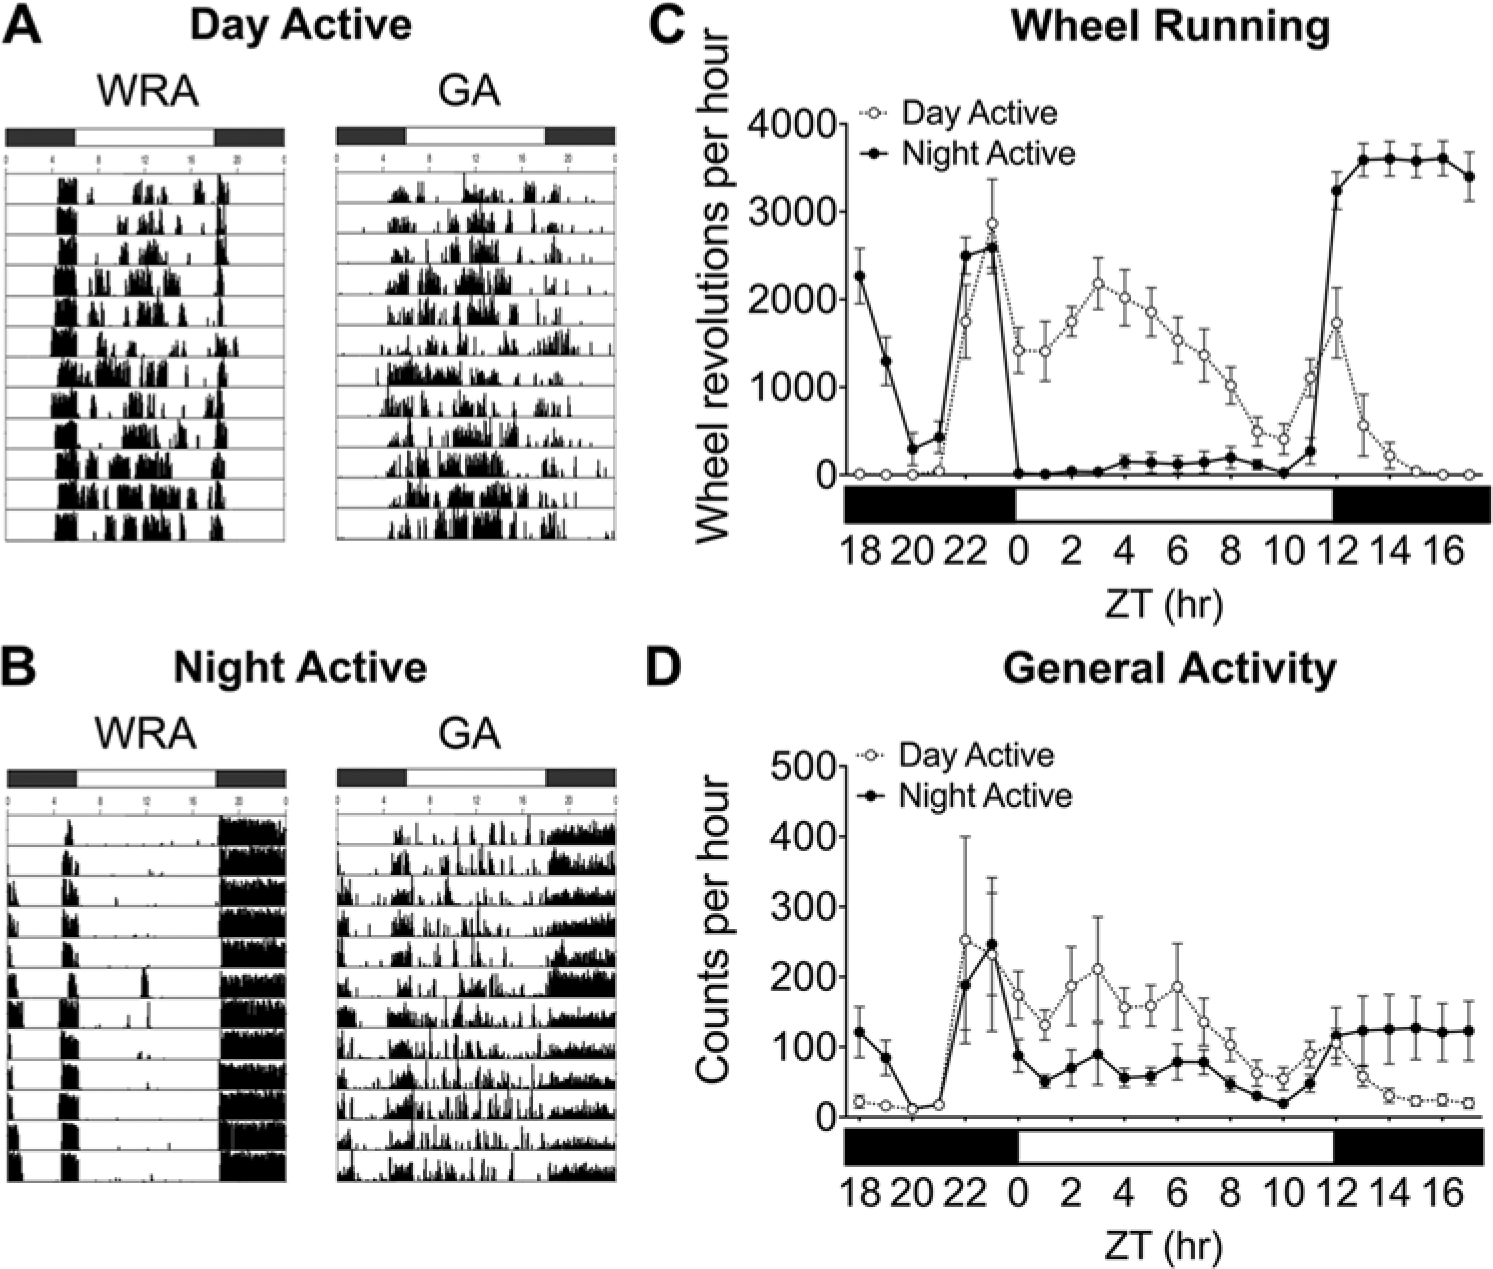
Actograms of wheel-running activity (WRA) and general activity (GA) of a single DA (A) and NA (B) grass rat, as well as average wheel revolutions (±SEM; C) and general activity counts (±SEM; D) over a 4-day monitoring period in 12:12 LD for all of the DA (open circles) and NA (closed circles) grass rats used in this study. White bars indicate lights on, and dark bars indicate lights off.
DA grass rats ran more in their running wheels during the day, exhibited a gradual decrease in activity after lights off, and had an anticipatory increase in activity before lights on (Fig. 1C). NA grass rats ran in their wheels very little during the day and had an abrupt and rapid increase in WRA at lights off, which was sustained until around ZT20 to ZT21, at which point WRA decreased substantially; NA grass rats underwent an increase in WRA before lights on that was very similar to that seen in DA grass rats, but they stopped running abruptly when the lights came on. Our measures of GA of DA and NA grass rats were influenced by the revolutions of the running wheel, so the representation of the average GA looks similar to that of the average WRA (Fig. 1D). However, NA grass rats displayed higher bouts of general activity across the daytime (Fig. 1D).
Effect of 2-h Light Pulses on WRA and GA
WRA among DA animals was not affected by time (p = 0.25) or by an interaction between time and light (p = 0.32), and although light pulses at night appeared to increase WRA, the effect did not reach significance (main effect of lighting condition: F1,3 = 6.90, p = 0.08) (Fig. 2A). Among NA grass rats, the time × pulse interaction was significant (F4,40 = 11.92, p < 0.01) (Fig. 2B) such that WRA decreased in response to light at all time points (p < 0.01) except ZT20 (p = 0.33).
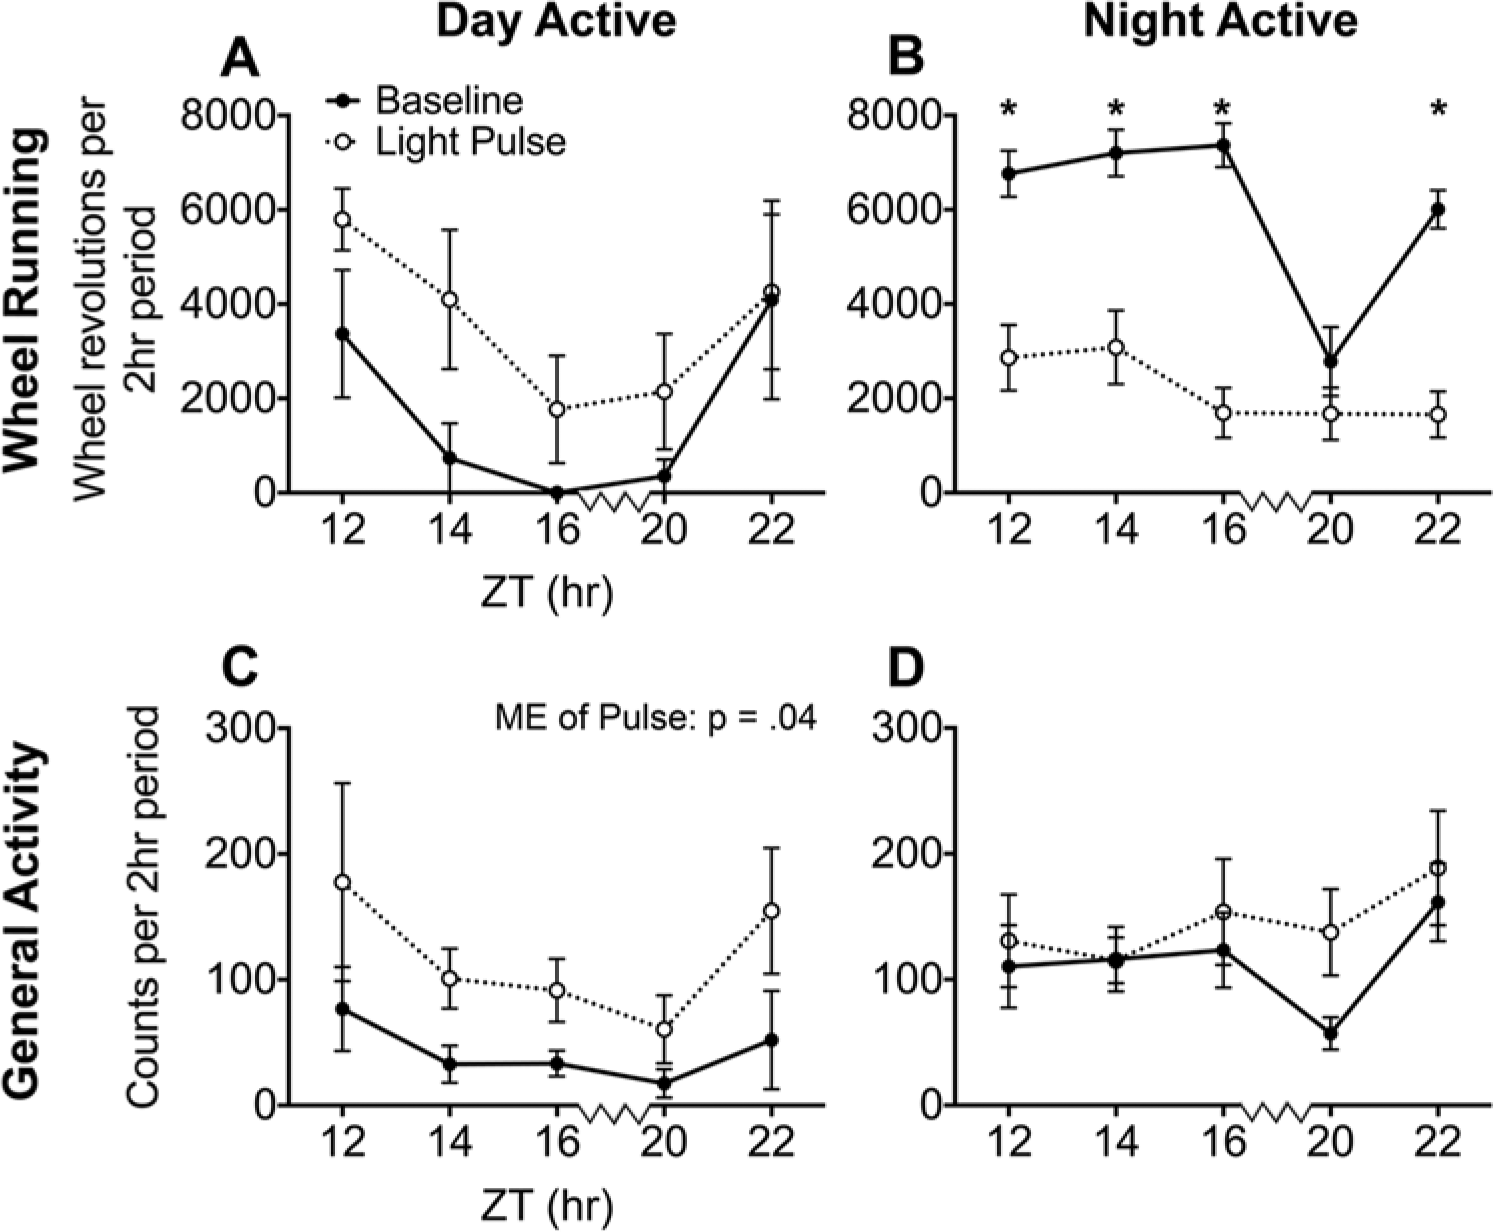
Average wheel running (A, B) and general activity (C, D) of DA and NA grass rats during each 2-h light pulse and the same 2 h on the previous day. Overall, DA grass rats tended to increase their wheel running in response to the light pulses (A), while NA grass rats decreased their wheel running at all time points except ZT20 (B). The general activity of DA grass rats was significantly increased overall in response to the light pulses (C), while the general activity of NA grass rats did not change. Asterisks indicate a significant difference between the baseline night and the corresponding light pulse night. Light pulses were delivered at 2-h intervals with the exception of the 4-h interval indicated by the jagged line on the x-axes between ZT16 and ZT20.
GA among DA grass rats was significantly increased by light pulses at night (F1,3 = 12.36, p = 0.04), but there was no main effect of time (p = 0.18) or an interaction between time and lighting condition (p = 0.19) (Fig. 2C). Among NA grass rats, GA was not affected by the light pulses (p = 0.20), time (p = 0.20), or by an interaction between these 2 variables (p = 0.19) (Fig. 2D).
Effect of 2-h Dark Pulses on WRA and GA
Dark pulses during the day appeared to decrease WRA in DA grass rats, although the effect was not significant (main effect of lighting condition: F1,8 = 4.06, p = 0.08); this ANOVA also revealed no effect of time (p = 0.50) and no interaction between time and lighting condition (p = 0.28) (Fig. 3A). In the NA grass rats, dark pulses significantly increased WRA (F1,14 = 8.08, p = 0.01), while the interaction between time and lighting condition (F4,56 = 3.63, p = 0.06) and the main effect of time (F4,56 = 3.37, p = 0.06) both approached significance such that the main effect of lighting condition appeared to be driven primarily by the dark pulse given during the early part of the day (ZT0) (Fig. 3B).
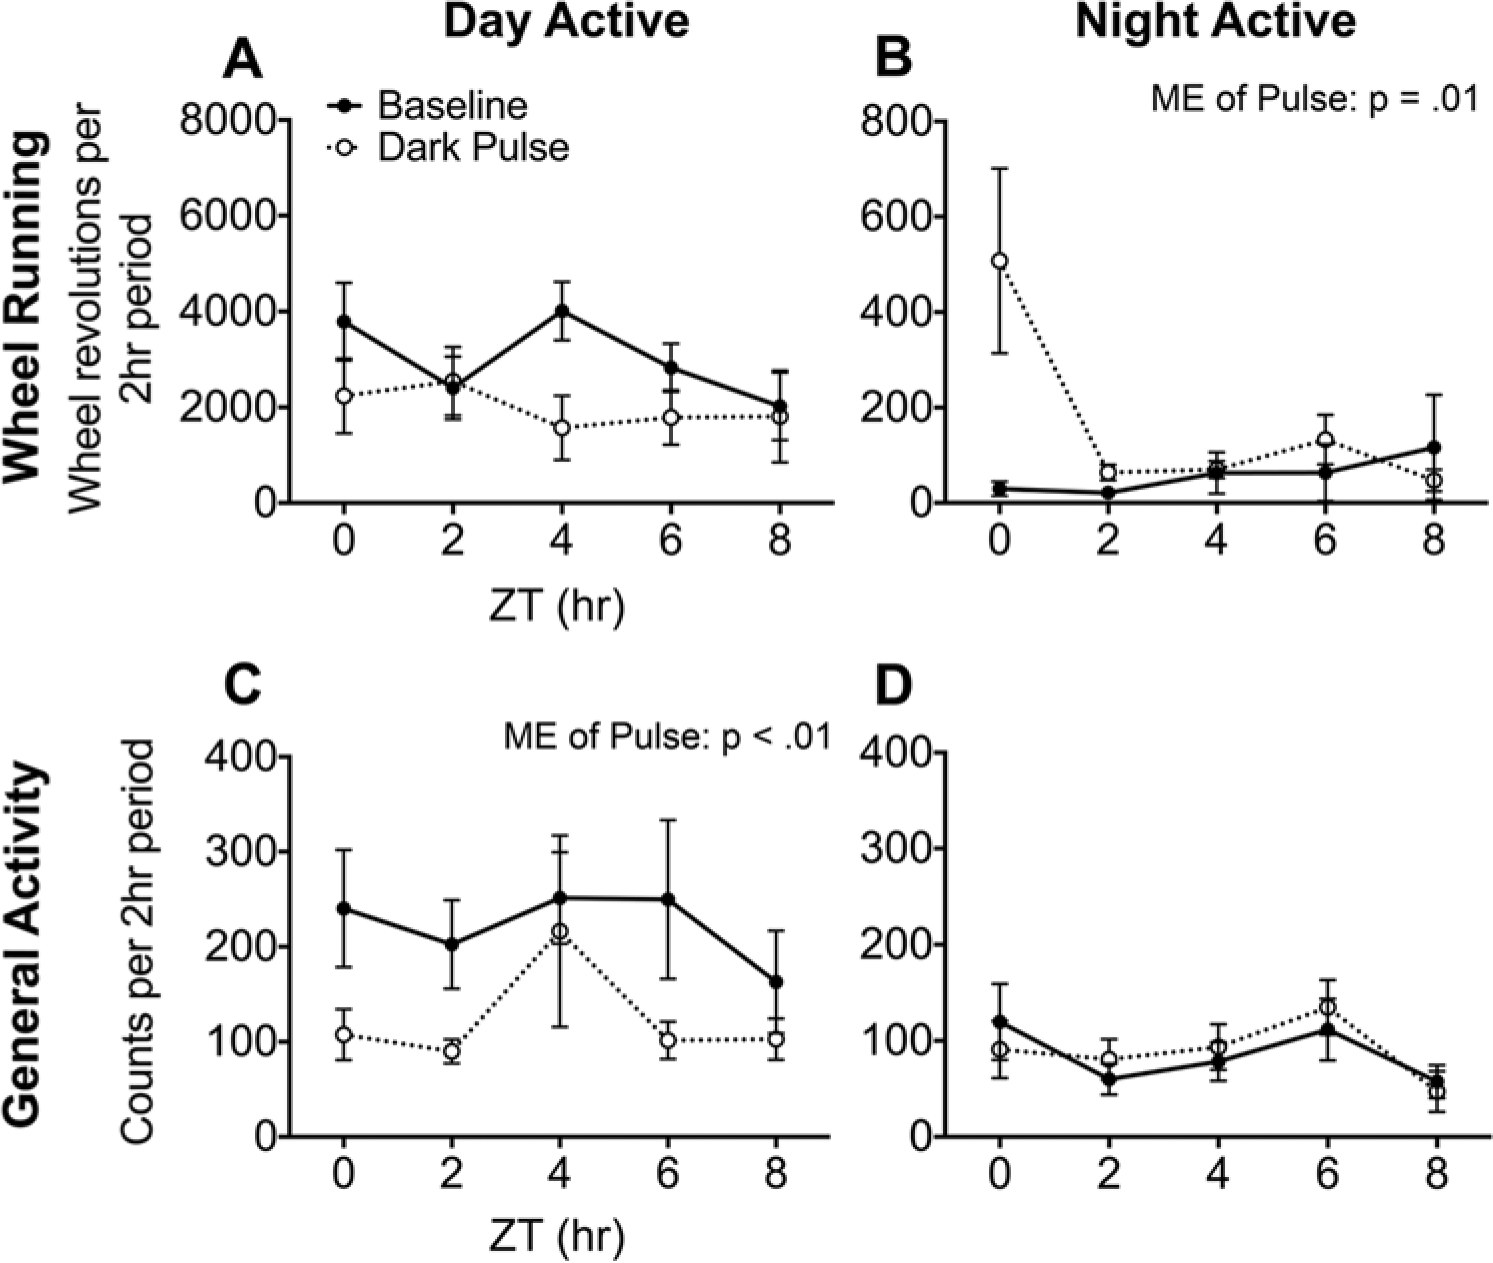
Average wheel-running (A, B) and general activity (C, D) of DA and NA grass rats during each 2-h dark pulse and the same 2-h on the previous day. Overall, DA grass rats tended to decrease their wheel running in response to the dark pulses (A), while NA grass rats significantly increased it (B). The general activity of DA grass rats was significantly decreased overall in response to the dark pulses (C), while the general activity of NA grass rats did not change in response to the dark pulses (D).
Dark pulses decreased GA in DA grass rats (main effect of lighting condition: F1,8 = 18.74, p < 0.01), but there was no main effect of time (p = 0.20) and no interaction between time and lighting condition (p = 0.54) (Fig. 3C). Among NA grass rats there were no main effects of lighting condition (p = 0.76) or time (p = 0.10), and there was no interaction between these variables (p = 0.20) (Fig. 3D).
cFos Expression in Response to 1-h LP Starting at ZT14
WRA of all groups included in this experiment is illustrated in Supplementary Figure S2. In the IGL, there was a significant interaction between chronotype and pulse (F1,25 = 7.90, p < 0.01), such that a 1-h LP at night induced an increase in cFos in the IGL of DA grass rats (F1,13 = 27.48, p < 0.01) but not NA grass rats (p = 0.63) (Fig. 4A,B).The same pattern was seen in the OPT, where the interaction between chronotype and pulse was significant (F1,25 = 4.13, p = 0.05), such that the 1-h LP increased cFos in DA (F1,13 = 13.03, p < 0.01) but not NA (p = 0.63) (Fig. 5A,B) grass rats. cFos was high in the IGL and OPT of both control and light-exposed NA animals.
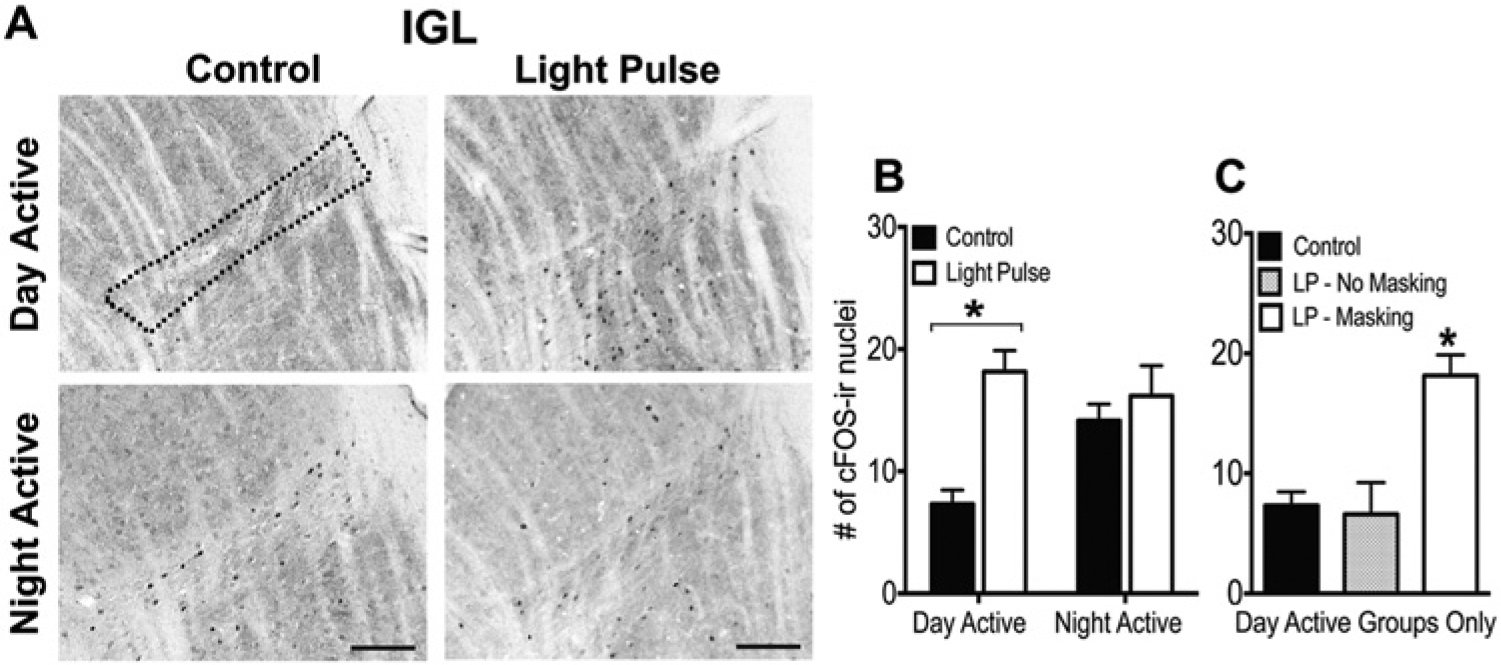
cFos expression in the IGL of DA and NA grass rats on a control night or after a 1-h light pulse at ZT14. (A) Representative photomicrographs of cFos expression in the IGL of day- and night-active grass rats on a control night or after a 1-h light pulse at ZT14. Scale bars represent 100 µm. (B) Numbers of cells expressing cFos in the IGL of DA and NA grass rats perfused on a control night (DA: n = 8; NA: n = 7) or after a 1-h light pulse at ZT14 (DA: n = 7; NA: n = 8). (C) A third group of DA grass rats received a light pulse at night but did not display a behavioral response to it (LP – No Masking; n = 5), and the cFos expression within this group is plotted with the other 2 DA groups (Control; LP – Masking). Asterisks indicate a significant elevation of cFos expression in the IGL of the DA (B) or a significant elevation relative to all DA groups (C).
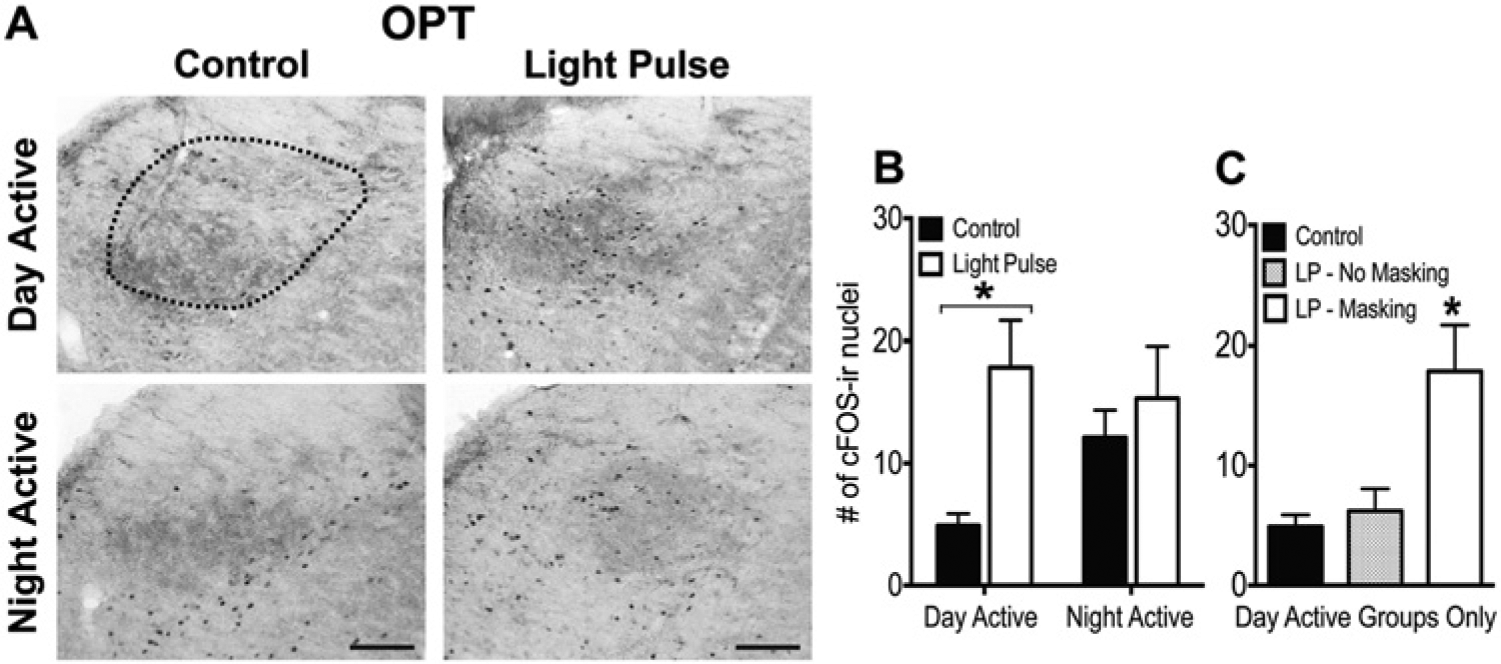
cFos expression in the OPT of DA and NA grass rats on a control night or after a 1-h light pulse at ZT14. (A) Representative photomicrographs of cFos expression in the OPT of DA and NA grass rats on a control night or after a 1-h light pulse at ZT14. Scale bars represent 100 µm. (B) Group averages of the number of cells expressing cFos in the OPT of DA and NA grass rats perfused on a control night (DA: n = 8; NA: n = 7) or after a 1-h light pulse at ZT14 (DA: n = 7; NA: n = 8). (C) A third group of day-active grass rats received a light pulse at night but did not display a behavioral response to it (LP – No Masking; n = 5), and the cFos expression within this group is plotted with the other 2 day-active groups (Control; LP – Masking). Asterisks indicate a significant elevation of cFos expression in the OPT of the DA group (B) or a significant elevation relative to all DA groups (C).
As noted above, in 1 subset of DA animals, WRA did not change in response to the LP, which enabled us to examine relationships between effects of light on activity and on cFos more precisely. Within the IGL, cFos expression differed between the DA groups (F2,17 = 10.01, p < 0.01), such that it was only induced by the LP in those DA animals whose behavior was also increased (p < 0.01); DA grass rats that did not respond behaviorally to the LP did not differ from DA controls (p = 0.67) (Fig. 4C). The same pattern was seen in the OPT, where cFos expression differed between the groups (F2,17 = 7.98, p < 0.01), such that it was only elevated by light in DA animals whose activity was also stimulated by that light (p < 0.01); cFos did not differ between DA controls and those whose behavior was unresponsive to the light (p = 0.93) (Fig. 5C).
Discussion
The effects of light on resetting the phase of circadian rhythms are the same in the DA and NA grass rats, as their PRCs are virtually indistinguishable (Mahoney et al., 2001), but here we found that mechanisms mediating the direct effects of light on WRA are clearly somewhat different. This basic distinction has been well established when nocturnal and diurnal species are compared (Smale et al., 2003) but not when individual differences within a species are considered. Individual differences are particularly interesting because they reveal the presence of a high degree of plasticity. That is, the NA pattern is induced in some animals by the presence of a running wheel, but these animals are diurnal with respect to both masking and circadian influences on general activity when there is no wheel. This suggests that 2 key drivers of an animal’s adaptation to its temporal niche, the circadian influence on activity and masking, may be linked in some way at a mechanistic level in these animals.
A previous study from Redlin and Mrosovsky (2004) examined masking responses to changes in lighting intensity in grass rats that were maintained with and without running wheels. All of their animals were diurnal with respect to GA, but when the wheel was introduced, a range of patterns emerged. While the absolute level of WRA during the day was quite variable, the ratio of dark- vs. light-phase WRA was significantly higher than the dark vs. light ratio of GA (in the absence of a wheel). Redlin and Mrosovsky (2004) also found that exposure to the same photic stimuli could have opposite effects on general activity (which was more diurnal) and wheel running (which was more nocturnal). In the current study, we were able to show that photic stimuli presented under identical experimental conditions have very different acute effects on the same behavior (i.e., WRA) as a function of whether the animals are NA or DA, again illustrating that the differences in the overall patterns of wheel running are associated with differences in masking behavior.
Another difference between the study of Redlin and Mrosovsky (2004) and ours is in the lighting conditions used to assess masking behavior. Redlin and Mrosovsky (2004) exposed animals to 1-h LD cycles across the light phase of a 12:12 LD cycle; during this time, 30 min of bright light (1000 lux, for entrainment purposes) was followed by 30 min of light of varying intensities (0-2200 lux), and activity was averaged across 30-min periods for comparisons. A second approach used by Redlin and Mrosovsky (2004) was to measure overall changes in GA and WRA activity in a skeleton photoperiod. These protocols revealed direct effects of light on wheel running but did not permit assessment of time of day effects. Our approach revealed that the acute effects of light and darkness were in fact both time dependent in the NA grass rats (Figs. 2 and 3).
The design of the current study also enabled us to measure WRA and GA concurrently, which revealed interesting differences. Although the NA grass rats reduced their WRA in response to light pulses at night, their GA did not change at that time. Interpretation of this result is complicated by the fact that the IR detectors used for GA picked up some movement of the wheels as well. However, the fact that NA grass rats did significantly reduce WRA but not GA suggests that either (1) these animals were just as active outside of the wheel with the light pulses as without them or (2) these animals actually increased their activity outside of the wheel when WRA decreased. Either way, inhibitory effects of light in NA grass rats were restricted to wheel running. Furthermore, although NA grass rats restricted their WRA to the night, they were active outside of the wheel during the daytime (refer to Fig. 1B,D). Both findings highlight the fact that one should be cautious about making general conclusions regarding masking on the basis of WRA. Wheel-running and general activity represent distinct behavioral states, and some features of their regulation, such as activation of circuits associated with reward and addiction, are quite different (Novak et al., 2012; Sherwin, 1998).
Several recent studies of rodents that are diurnal in nature have revealed interesting and paradoxical patterns of masking in the lab. Some of these diurnal rodents have nocturnal patterns of GA in the lab (spiny mice, Levy et al., 2007; fat sand rats, Barak and Kronfeld-Schor, 2013; tuco-tucos, Tomotani et al., 2012), and in others, GA is diurnal, but the introduction of a wheel can lead to running at night rather than during the day (Octodon degus, Kas and Edgar, 1999; Nile grass rats, Blanchong et al., 1999; Mongolian gerbils, Weinert et al., 2007). In most of these species, light can produce negative masking when the animals are night active. In degus, the NA pattern is produced in some individuals by negative masking and in others by circadian mechanisms (Otalora et al., 2013), whereas the 2 processes appear to operate together to drive the NA pattern in grass rats. This can be inferred from the facts that (1) wheel running in all NA grass rats was directly inhibited by light (Fig. 2), and (2) in an earlier study, the NA pattern persisted when animals were released into DD from LD (Mahoney et al., 2001). This species difference suggests that the neural mechanisms determining the contribution of masking and circadian processes to chronotype are more tightly linked in grass rats than in degus.
Very little is known about how the neural mechanisms mediating the masking responses to light may differ in diurnal and nocturnal species. Two brain areas that receive dense input from melanopsin-containing retinal ganglion cells and may be important are the IGL and OPT (Hattar et al., 2006). The role of the IGL, which projects to the SCN, has been studied primarily in the context of how it modulates effects of light on the circadian clock, but there is some evidence that it also contributes to the direct effects of light on behavior (Gall et al., 2013; Redlin et al., 1999). In diurnal grass rats maintained without access to a wheel, IGL lesions lead to night-active profiles of general activity both in an LD cycle and in constant conditions, and they lead to a reversal in masking such that animals reduce their activity in response to light (Gall et al., 2013). The OPT, which plays an important role in regulation of pupillary constriction, may also contribute to masking, as lesions of the pretectum that include the OPT attenuate masking of REM sleep by darkness in albino rats (Miller et al., 1998).
The responsiveness of cells within the IGL and OPT to photic stimulation has been examined in multiple studies. Results have been varied, as in some cases there is an induction of cFos by light, in others there is no change, and in some there is a light-induced decrease in cFos. Differences in the time of day, the duration of exposure to the light, the species, and strains of animals used may have contributed to the discrepancies (Juhl et al., 2007; Krajnak et al., 1997; Lupi et al., 1999; Lupi et al., 2012; Park et al., 1993; Prichard et al., 2002; Shuboni, 2013). Most studies, however, find that light increases cFos in the IGL and OPT, whether animals are diurnal or nocturnal (Juhl et al., 2007; Krajnak et al., 1997; Lupi et al., 2012; Prichard et al., 2002; Shuboni, 2013).
In the current study, light induced an increase in cFos in the IGL and OPT of DA grass rats, but in NA grass rats, cFos was high on a control night and was not changed by the 1-h light pulse (Figs. 4 and 5). Furthermore, this induction of cFos in DA grass rats only occurred in those animals that displayed an increase in WRA in response to the light. This association raises the possibility that increased neuronal activity in the IGL and OPT contributes to the behavioral response to light and/or that neuronal activity in these brain regions is induced by increased levels of WRA in the DA grass rats (Janik et al., 1995; Smale et al., 2001). The absence of a cFos response to light in the IGL and OPT of NA grass rats could mean several things: (1) cFos may not be an adequate indicator of light responsiveness in these regions, (2) light-induced changes in neuronal activity in these regions may not be necessary for masking, (3) a light-induced decrease in cFos may take longer than 1 h, or (4) some populations of cells within these regions may be stimulated by light while others are activated by wheel running such that there are no changes in overall levels of cFos. In fact, in the IGL of rats, neurons that contain enkephalin can respond to photic stimulation with an increase in cFos, whereas those containing neuropeptide-y do not (Juhl et al., 2007); the latter population expresses higher levels of cFos in association with heightened WRA in both hamsters and grass rats (Janik et al., 1995; Smale et al., 2001). The phenotype of light-responsive cells in these areas needs to be determined in grass rats as it may provide insight into the relationships between their activity and the direction of the behavioral response to light.
In summary, the present study illustrates how masking responses to light and darkness are dependent on the chronotype of the individual. Our findings suggest a linkage between masking and circadian mechanisms in grass rats such that if the circadian system drives WRA up at night, that activity can be directly suppressed by light and vice versa. The mechanisms responsible for the association between masking and circadian regulation may help individuals occupy different temporal niches when environmental conditions change. It is tempting to speculate that neural processes accounting for the plasticity of masking responses to light exist within brain areas that receive input from melanopsin-containing retinal ganglion cells. This is suggested by the current evidence that cells within 2 such structures, the IGL and OPT, respond to light in different ways in DA and NA chronotypes.
Footnotes
Acknowledgements
This study was supported by the National Science Foundation grant (IOS-1051919) to L.S., A.A.N., and L.Y. and by a training grant from the National Institutes of Health (T32 MH070343) to J.L. The authors thank Dorela Shuboni, Andy Gall, Carmel Martin-Fairey, Thomas Groves, Ashley Baird, Sara Wennersten, Chuck Ternes, Dennis Downing, Andrea Lynema, and Gabby Naula-Quintero for their technical assistance and valuable comments.
Conflict of interest statement
The author(s) have no potential conflicts of interest with respect to the research, authorship, and/or publication of this article.
Notes
References
Supplementary Material
Please find the following supplemental material available below.
For Open Access articles published under a Creative Commons License, all supplemental material carries the same license as the article it is associated with.
For non-Open Access articles published, all supplemental material carries a non-exclusive license, and permission requests for re-use of supplemental material or any part of supplemental material shall be sent directly to the copyright owner as specified in the copyright notice associated with the article.