
Abstract
The term masking refers to immediate responses to stimuli that override the influence of the circadian timekeeping system on behavior and physiology. Masking by light and darkness plays an important role in shaping an organism’s daily pattern of activity. Nocturnal animals generally become more active in response to darkness (positive masking) and less active in response to light (negative masking), and diurnal animals generally have opposite patterns of response. These responses can vary as a function of light intensity as well as time of day. Few studies have directly compared masking in diurnal and nocturnal species, and none have compared rhythms in masking behavior of diurnal and nocturnal species. Here, we assessed masking in nocturnal mice (Mus musculus) and diurnal grass rats (Arvicanthis niloticus). In the first experiment, animals were housed in a 12:12 light-dark (LD) cycle, with dark or light pulses presented at 6 Zeitgeber times (ZTs; with ZT0 = lights on). Light pulses during the dark phase produced negative masking in nocturnal mice but only at ZT14, whereas light pulses resulted in positive masking in diurnal grass rats across the dark phase. In both species, dark pulses had no effect on behavior. In the 2nd experiment, animals were kept in constant darkness or constant light and were presented with light or dark pulses, respectively, at 6 circadian times (CTs). CT0 corresponded to ZT0 of the preceding LD cycle. Rhythms in masking responses to light differed between species; responses were evident at all CTs in grass rats but only at CT14 in mice. Responses to darkness were observed only in mice, in which there was a significant increase in activity at CT 22. In the 3rd experiment, animals were kept on a 3.5:3.5-h LD cycle. Surprisingly, masking was evident only in grass rats. In mice, levels of activity during the light and dark phases of the 7-h cycle did not differ, even though the same animals had responded to discrete photic stimuli in the first 2 experiments. The results of the 3 experiments are discussed in terms of their methodological implications and for the insight they offer into the mechanisms and evolution of diurnality.
Most mammals display rest-activity cycles with heightened activity occurring either during the day (diurnal species) or the night (nocturnal species). Photic cues influence the daily patterning of activity in 2 ways. First, light can set the phase of the endogenous circadian rhythms and thereby entrain them to a light:dark (LD) cycle (Daan and Pittendrigh, 1976). Although details of this process can vary across species, it is fundamentally very similar in nocturnal and diurnal animals (reviewed in Smale et al., 2003); the effects that the circadian system has on most rhythmic parameters is, however, very different in diurnal and nocturnal species, resulting in phase reversals in the rhythms of most functions. Most research examining mechanisms underlying adaptations to different temporal niches has focused on the circadian system (Smale et al., 2008). The second major way in which light can shape the patterning of daily activity is via masking, a process that can override the influence of the circadian system on activity by producing direct and immediate responses to a stimulus. In the case of masking, the responses to light are very different in nocturnal and diurnal species (Redlin, 2001). To understand the mechanisms responsible for the fundamental differences between diurnal and nocturnal species, as well as the evolution of those differences, both masking and circadian regulation of behavior must be examined. Until recently, masking has received relatively little attention.
Masking allows an organism to increase (positive masking) or decrease (negative masking) activity in response to an acute change in the environment (Aschoff, 1999). The direction of the masking response to light depends on the temporal niche a species occupies (Redlin, 2001), such that activity is generally decreased in response to light in nocturnal animals and increased in response to light in diurnal ones; darkness typically has the opposite effects. Earlier studies of these issues in vertebrates, however, involved comparisons between very different classes of organisms (Mrosovsky, 1999), such as diurnal birds (Aschoff and von Goetz, 1989) and nocturnal rodents (Aschoff and von Goetz, 1988). Masking was recently described in 2 sister species in the genus Acomys (golden and common spiny mice) with very different activity patterns. In this case, some acute responses to photic stimuli were quite similar and others were quite different in the 2 species (Cohen et al., 2010; Rotics et al., 2011). Other recent studies have examined masking in rodents in which phase preference for the display of activity can be changed by the introduction or removal of a running wheel (Arvicanthis niloticus, Redlin and Mrosovsky, 2004; Octodon degus, Vivanco et al., 2010a, 2010b; Meriones unguiculatus, Weinert et al., 2007). Although interpretation of these results is complicated by the fact that wheel running and general activity are not the same behaviors, they do highlight the plasticity that can exist in the mechanisms responsible for the structuring of activity patterns. In the studies described below, however, our focus was not on issues related to changes that can occur within an animals’ life span but on changes that have taken place over evolutionary time to support adaptation to a primarily nocturnal or diurnal niche.
The current experiments were designed to shed light on the contribution of masking to differences between activity patterns of nocturnal and diurnal species. Specifically, we directly compared masking of general activity in 2 murid rodents, mice (Mus musculus) and Nile grass rats (Arvicanthis niloticus). Nile grass rats are diurnal in their natural habitat in East Africa, where they enter traps during the day, particularly the middle of the day, but not at night (Blanchong et al., 1999); all other rodents in this area enter traps almost exclusively during the night (Blanchong and Smale, 2000). In the lab, these animals are also diurnal, exhibiting the highest levels of general activity during the day (e.g., McElhinny et al., 1997; Blanchong et al., 1999; Schwartz et al., 2009; Redlin and Mrosovsky, 2004; Refinetti, 2004). Grass rats exhibit a variety of other adaptations to diurnal life such as the phase of rhythms in reproductive function (Mahoney and Smale, 2005; Mahoney et al., 2004), body temperature (Tb; McElhinny et al., 1997), and sleep (Novak et al., 2000; Schwartz and Smale, 2005). When provided a running wheel, some grass rats run primarily at night (night-active; Blanchong et al., 1999); however, even when this happens, Tb is lowest late in the dark phase, a point at which activity is at the same (minimal) level as during the day, suggesting an internal drive for a Tb rhythm that is characteristic of a diurnal mammal (Blanchong et al., 1999). Patterns of sleep also appear to reflect basic mechanisms that support diurnality in this species. That is, in night-active individuals, sleep is far more fragmented when it occurs during the day than the night, and daytime activity (as indicated by cFos activation) in the sleep-active cell group of the ventrolateral preoptic area is the same in grass rats that run during the day and those that run at night (Schwartz and Smale, 2005). In addition, these animals have visual systems adapted to a daytime existence, with a ratio of cones to rods that is 10 times higher than that seen in nocturnal rodents (Gaillard et al., 2008) and, relative to body weight, an optic tectum that is 4 times larger than that of the laboratory rat (Y. Sauve, personal communication). Here we address the question of whether and how masking of general activity in grass rats differs from that seen in a nocturnal rodent, the mouse. We also determine whether and how circadian rhythms in responsiveness to masking stimuli differ between these 2 species.
Methods
Animals
Ten adult male CD1 mice were obtained from Charles River and 50 adult grass rats (40 female and 10 male) from a breeding colony maintained at Michigan State University. All animals were singly housed in Plexiglas cages (mice: 45 × 24 × 19 cm; grass rats: 34 × 28 × 17 cm) equipped with infrared motion detectors (IRs; Visonic, Tel Aviv, Israel) attached to the cage tops. Grass rats were also supplied with a PVC pipe (length: 8 cm, diameter: 6 cm). This device reduces the stress of cage changes (the animals enter it readily and are transported in it to the clean cage); it does not allow the animals to escape from light exposure because the length of the pipe is shorter than the animals’ body length. All animals were provided with ad libitum access to food (PMI Nutrition Prolab RMH 2000, Brentwood, MO) and water. Animals were kept in a 12:12 LD cycle with 300 lux of white light during the light phase and <5 lux of red light during the dark phase. In all 3 experiments, the light that animals were exposed to was either 300 lux of white light (which we refer to simply as “light”) or <5 lux of red light (which we refer to as “darkness”). All experiments were approved by the Institutional Animal Care and Use Committee of Michigan State University and were performed in compliance with the National Institutes of Health Guide for the Care and Use of Laboratory Animals.
Experimental Procedures
Experiment 1: 1-h pulses in LD conditions
Animals were maintained on a 12:12 LD cycle. One-hour masking pulses (light during the dark phase and darkness during the light phase) were administered in 3-day cycles: day 1, maintenance day (12:12 LD); day 2, baseline day; and day 3, pulse day (Figure 1A). For experiments 1 and 2, replenishment of food and water, as well as cage changes, were restricted to the maintenance day to avoid altering activity during days when data were to be compared. Light pulses (1 h) were presented during the dark phase at ZT14, ZT18, and ZT22, while dark pulses (1 h) were presented during the light phase at ZT2, ZT6, and ZT10. Ten mice and 20 grass rats (10 female and 10 male) first received all light pulses and then all dark pulses; the times of the pulses were randomly selected, but both species received the same sequence of pulses.
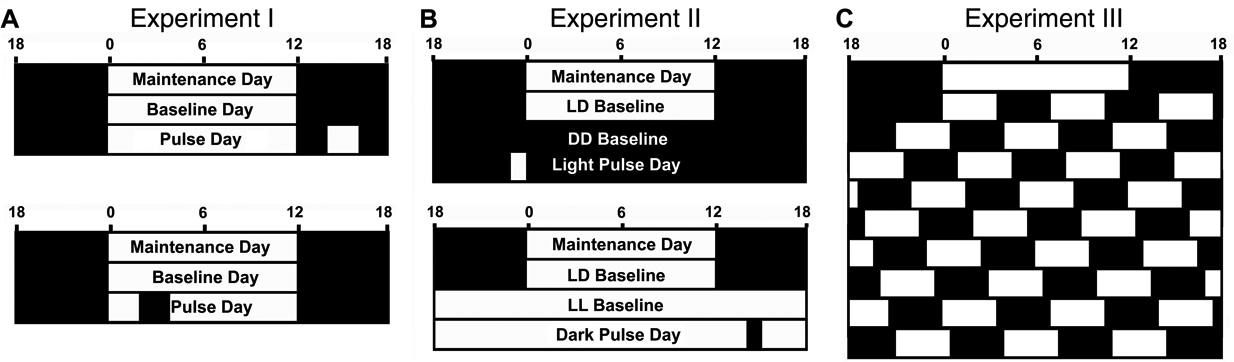
Schematic representations of the 3 experiments. (A) The 3-day cycle in LD conditions of experiment 1; the same basic experimental paradigm was used to collect data on light (top panel) and dark pulses (bottom panel). The 1-h light/dark pulses were timed in reference to the LD cycle in which lights-on defined Zeitgeber time (ZT) 0. Light pulses were presented during the night (ZT2, 6, and 10) and dark pulses during the day (ZT14, 18, 22). In experiment 2 (B), the animals receiving light pulses were placed in constant darkness (DD, top panel) and those receiving dark pulses into constant light (LL, bottom panel). Pulses were administered across the 24-h period; timing for pulse presentations was determined using the predicted onset of activity, with the estimated onset of the subjective day taken as circadian time (CT) 0. CT0 corresponded to ZT0 of the preceding LD cycle. Both light and dark pulses occurred at CT2, 6, 10, 14, 18, and 22. Finally, in experiment 3 (C), the animals were placed in a 3.5:3.5-h LD cycle.
Experiment 2: 1-h pulses in constant conditions
To determine if masking responses to photic stimuli change across a full 24-h period, animals were placed into constant light (LL) or darkness (DD) and pulsed at 6 time points across the 24-h period with either 1 h of light (when housed in DD) or 1 h of darkness (when housed in LL); these pulses were administered at circadian time (CT) 2, CT6, CT10, CT14, CT18, CT22 (with CT0 = time of normal light onset). Pulses were administered in 4-day cycles: day 1, maintenance day in 12:12 LD; day 2, baseline day in 12:12 LD; day 3, LL or DD; and day 4, pulse day (Figure 1B). The 10 mice from experiment 1 were first exposed to all the light pulses and then to all the dark pulses. One group (n = 10) of grass rats was exposed to all the light pulses and another group (n = 10) to all of the dark pulses, both in the same order as the mice. For both LP and DP regimes, a control measure was obtained from a 4-day cycle during which animals remained in undisturbed conditions on day 4; we use the label unpulsed control to refer to the times of this day that correspond to when the 6 light or dark pulses occurred on the experimental days.
Experiment 3: 7-h (3.5:3.5) LD cycle
Here, we implemented a 7-h LD cycle, a procedure commonly used to assess effects of lesions (Redlin and Mrosovsky, 1999a; Li et al., 2005) and genetic manipulations (e.g., van der Veen and Archer, 2010) on masking, to determine if results from this protocol reflect those obtained from the more targeted approaches of the first 2 experiments. Animals were exposed to a 7-h LD cycle, with lights on for 3.5 h then off for 3.5 h, over a period of 9 days. This protocol removes the circadian influence on masking because animals cannot entrain their circadian rhythms to the ultradian cycle; consequently, over a 7-day period, animals are exposed to light and darkness at all phases of their endogenous circadian rhythm (Redlin and Mrosovsky, 1999b). The same 10 mice from the previous experiments and 10 different grass rats were used in this study.
Data Analysis
All activity data were collected on a computer in a room adjacent to the animal suite, using the VitalView Program (Minimitter, Bend, ORUSA). These raw data were converted into actograms using ClockLab (Actimetrics, Wilmette, IL), compiled in Microsoft Excel, and analyzed with SPSS. For experiment 1, counts from the same 1-h interval from the pulse day and the preceding day (baseline; Figure 1) were used in the analysis. For mice, female grass rats and male grass rats ANOVAs were used to analyze the data with a 2 × 3 factorial design (lighting condition [masking pulse vs. control] × time of day [ZT2, 6, and 10 for dark pulses, or ZT14, 18, and 22 for light pulses]) with repeated measures on both factors. In experiment 2, the values for the control pulses all came from the day identified as unpulsed control (as noted above). Separate ANOVAs were used to analyze the data from the LL and DD conditions for each species. The data were treated as 2 × 6 factorial designs (lighting condition [masking pulse vs. control] × time of day [CT2, 6, 10, 14, 18, and 22] with repeated measures on both factors). For both experiments 1 and 2, significant interactions were followed by analyses of simple main effects and after significant main effects of lighting condition evaluation of the effects of pulses at each CT used paired sample t-tests (2-tailed test). Finally, for experiment 3, chi-square periodograms were constructed using Clocklab to determine if there were significant 7-h and 24-h rhythms. In addition, to evaluate independently the direct effects of light and dark exposure on activity counts, data from 1 week of the ultradian cycle were summed for light and dark phases and expressed as a percentage of total activity, and then a pairwise t test (2-tailed) was used to determine if these values differed significantly. Before performing the t test, the data were subject to a square root transformed because they did not meet the assumptions of parametric t tests. For all 3 experiments, statistical significance was set at p < 0.05.
Results
Experiment I: 1-h pulses in LD conditions
Light induced a significant increase in activity in both male and female grass rats. Specifically, in female grass rats housed in LD 12:12 (Figures 2A and 3), there was a significant main effect of 1-h light pulses (F[1, 8] = 8.176, p = 0.021) but not of time (F[2, 16] = 1.910, p = 0.190), and there was no interaction between these 2 variables (F[2, 16] = 1.015, p = 0.373). Male grass rats showed the same pattern (Table 1), with a significant effect of lighting condition (F[1, 9] = 14.576, p = 0.004), no effect of time (F[2, 18] = 2.454, p = 0.161), and no interaction (F[2, 18] = 1.261, p = 0.269). For mice, there was no main effect of lighting condition (F[2, 18] = 3.966, p = 0.078) or of time (F[2, 18] = 1.507, p = 0.248), but there was a significant interaction between the 2 variables (F[1, 9] = 6.558, p = 0.011). Evaluation of the simple effect of lighting condition detected a significant difference only at ZT14 (t[9] = 2.698, p = 0.024; Figure 2B).
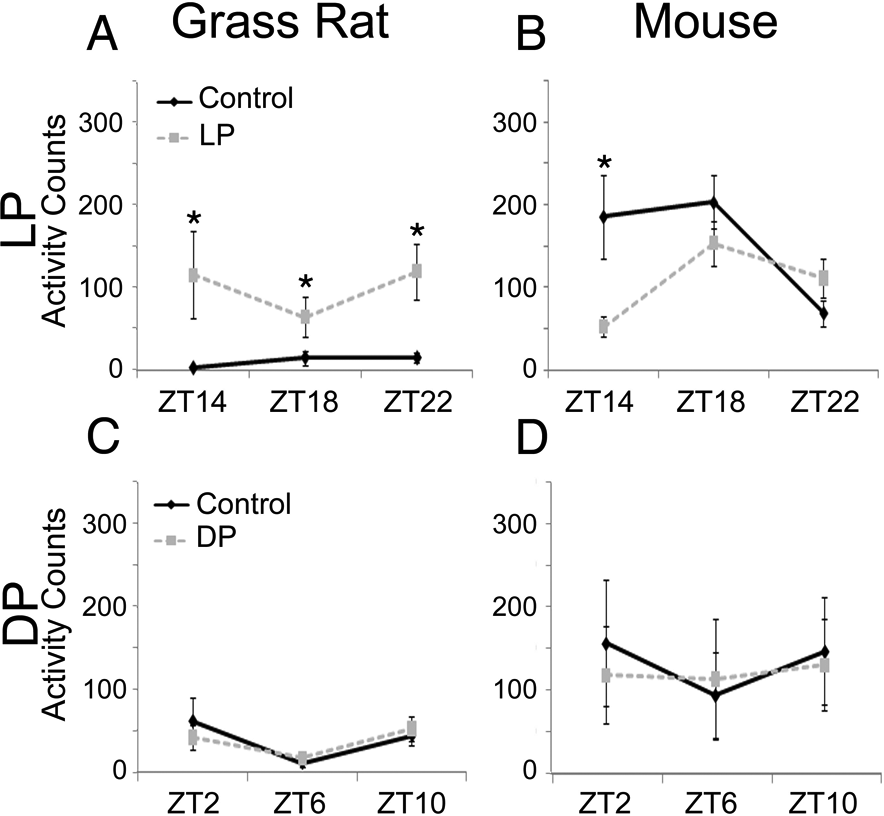
Responses to light and dark pulses in LD conditions. In grass rats (A), activity during the light pulses (dashed line) was increased when compared with activity on the baseline day (solid line), for all time points across the entire dark portion of the day. Mice (B) showed suppression of activity only in response to a light pulse at the beginning of the night (at ZT 14). During the light portion of the LD cycle, neither grass rats (C) nor mice (D) were responsive to pulses of darkness (dashed line) when compared with baseline activity (solid line). Significant differences (p < 0.05) between the 2 conditions within a ZT are indicated with the * symbol.
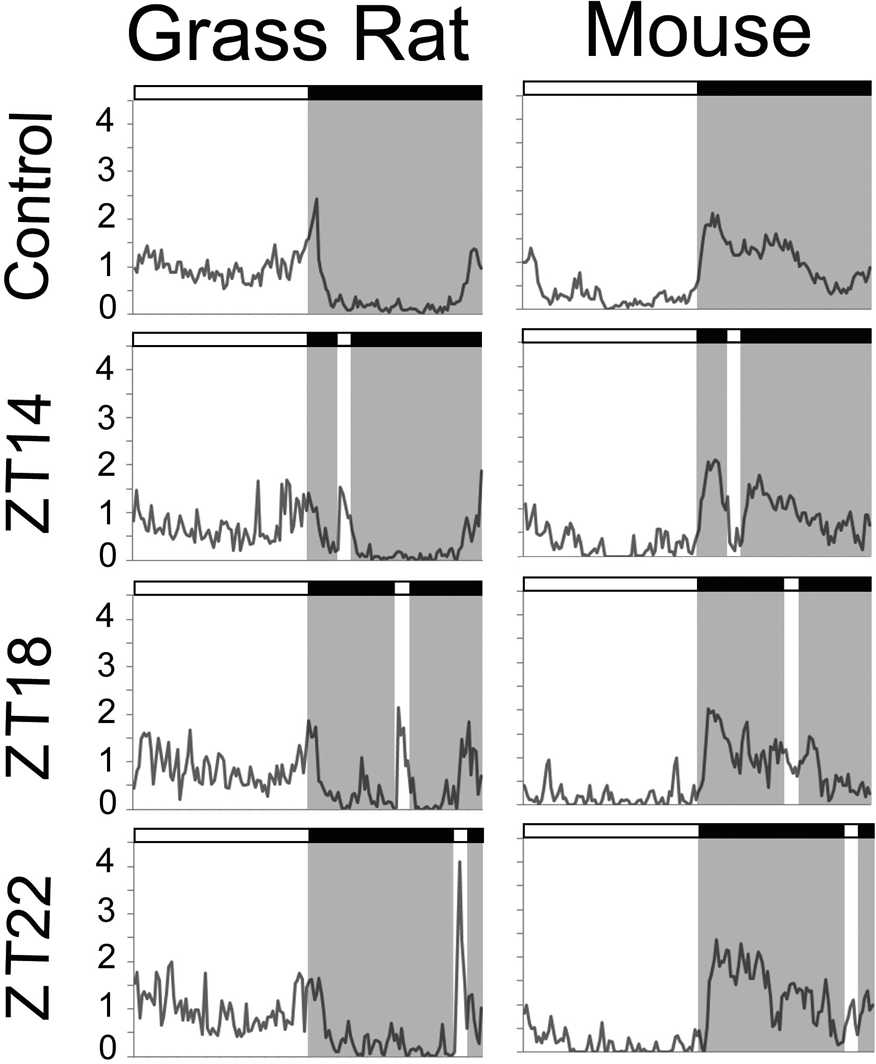
Average patterns of activity in experiment 1 across the day during the 5 baseline days when no light pulses were administered (control/top) and when light pulses were presented (bottom 3 panels); white indicates the 12-h light phase, and gray indicates the 12-h dark phase. For the light pulse given at ZT14, average activity was enhanced among grass rats (left panel) and inhibited among mice (right panel). At ZT18 and ZT22, light enhanced activity of grass rats (left panel) but had no effect on mice (right panel).
Masking in male grass rats.
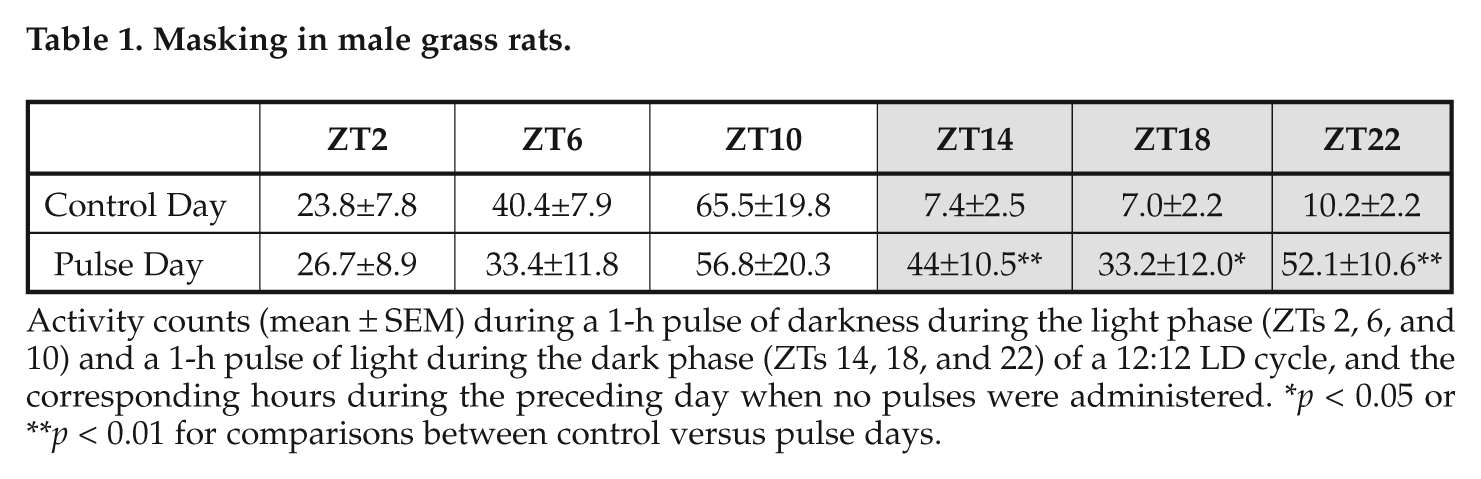
Activity counts (mean ± SEM) during a 1-h pulse of darkness during the light phase (ZTs 2, 6, and 10) and a 1-h pulse of light during the dark phase (ZTs 14, 18, and 22) of a 12:12 LD cycle, and the corresponding hours during the preceding day when no pulses were administered. *p < 0.05 or **p < 0.01 for comparisons between control versus pulse days.
The activity of female grass rats exposed to 1-h DPs during the light phase of the 12:12 LD cycle was not significantly affected by lighting condition (F[1, 9] = 0.487, p = 0.503) or time (F[2, 18] = 0.887, p = 0.413), and there was no interaction between these variables (F[2, 18] = 0.415, p = 0.661; Figure 2C). The same pattern was seen among male grass rats (lighting condition: F[1, 9] = 0.231, p = 0.642; time: F[2, 18] = 2.320, p = 0.127; interaction: F[2, 18] = 0.217, p = 0.775; Table 1). Mice were also unaffected by lighting condition (F[1, 18] = 0.008, p = 0.931), by time of day (F[2, 36] = 2.817, p = 0.093), or by an interaction between these variables (F[2, 36] = 0.445, p = 0.541; Figure 2D).
Experiment 2: 1-h pulses in constant conditions
The activity of grass rats kept in DD and exposed to 1-h pulses of light across a 24-h period was affected by lighting condition (F[1, 9] = 45.216, p = 0.001) with no significant main effect of time of day (F[5, 45] = 1.462, p = 0.245); however, there was a significant interaction between these 2 variables (F[5, 45] = 3.196, p = 0.028; Figure 4A). Exposure to light significantly increased activity at all CTs (ts = 2.42 to 7.90, ps = 0.001 to 0.038). For mice exposed to light pulses in constant darkness, there was a significant interaction between time and lighting condition (F[5, 40] = 2.554, p = 0.034). Analysis of the simple main effect of lighting condition showed that light significantly reduced activity only at CT14 (t[9] = 3.105, p = 0.015; Figure 4B).
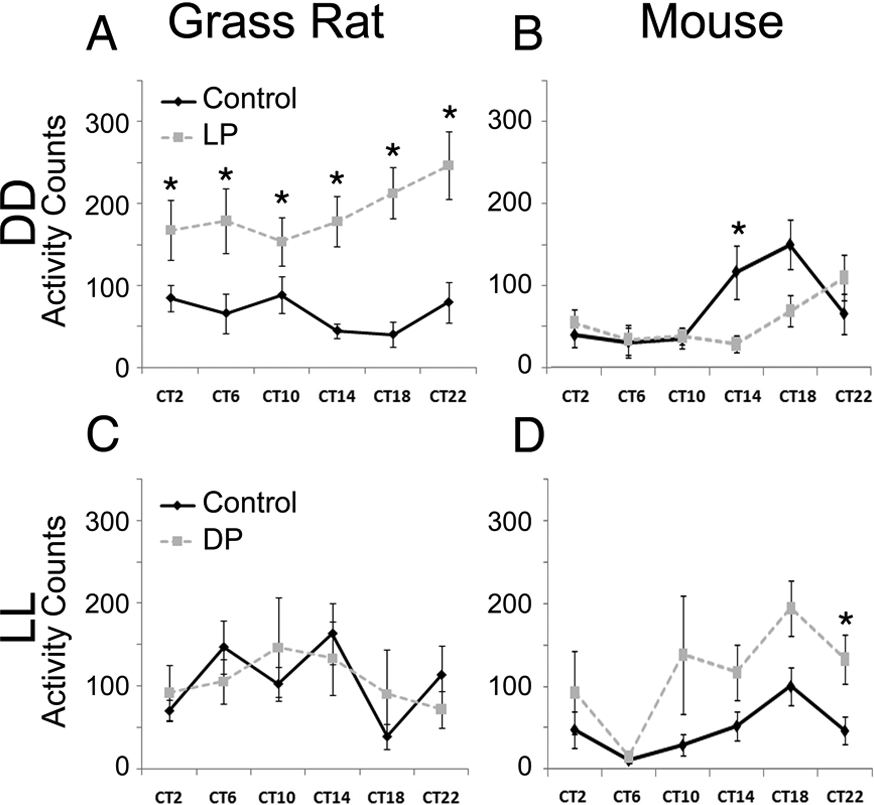
Activity counts of animals exposed to light and dark pulses under constant darkness (DD; upper panels) and constant light (LL: lower panels), respectively. (A) Activity of grass rats during the light pulses (dashed line) was increased when compared with activity on the baseline day (solid line), for all time points across the entire 24-h period. (B) Activity of mice was affected only by light at the beginning of the subjective night, at which point it was suppressed. (C) Grass rats in constant light never responded to pulses of darkness. (D) Mice increased their activity in response to darkness at the end of the subjective night. Significant differences (p < 0.05) between the 2 conditions within a CT are indicated with the * symbol.
The activity of grass rats housed in LL and exposed to 1-h pulses of darkness (Figure 4C) was not affected by lighting condition (F[1, 8] = 0.017, p = 0.90) or by time of day (F[5, 40] = 1.527, p = 0.11), and there was no significant interaction between these 2 variables (F[5, 40] = 2.539, p = 0.11). Among mice, there was a main effect of lighting condition (F[1, 7] = 6.421, p = 0.04) and time (F[5, 40] = 4.656, p = 0.031) but no interaction between these variables (F[5, 40] = 1.150, p = 0.344). Evaluation of the effects of lighting condition at each CT revealed a significant difference only at CT22 (t[7] = 2.898, p = 0.023; Figure 4D), at which point darkness increased activity; a trend in the same direction was also evident at CT14 (t[7] = 2.168, p = 0.067).
Under control conditions (no masking pulses) for mice in DD or LL and for grass rats in LL, there was a significant effect of CT. Surprisingly, that was not the case for grass rats in DD. This was likely a result of sampling error and individual differences associated with having only 6 sampling points of only 1 h each. We tested this explanation by analyzing 1-h bins of activity for the full 24 h for the same animals on the control day in DD; that analysis revealed a significant effect of CT (F[23, 207] = 5.134, p = 0.001).
Experiment 3: 3.5:3.5-h ultradian cycle
Actograms illustrating patterns of activity of 1 grass rat and 1 mouse in the 7-h cycle are presented in Figure 5A and 5B, respectively. Seven of the 10 grass rats had only free-running rhythms with periods of ~12 and ~24 h (Figure 5C), while in 3 animals, rhythms with periods of 7 h were also apparent. However, grass rats did show significantly more activity overall during the light phase (57.32% ± 2.23%) of the 7-h cycle than during its dark phase (42.67% ± 2.23%; t[9] = 2.853, p = 0.019; Figure 5E). One grass rat showed 54% of its activity during the dark phases of the ultradian cycle and also had unusually nocturnal behavior on baseline days. No mice in the ultradian cycle had significant 7-h rhythms, but activity in all of them did show a free-running rhythm with a period of ~24 h; an example of a periodogram from activity records of a mouse is depicted in Figure 5D. Activity levels of mice did not differ between the dark (54.06% ± 3.10%) and light phases (45.93% ± 3.10%) of the 7-h cycle (t[7] = 1.325, p = 0.231), although 1 individual showed 73% of total activity in the dark (Figure 5F).
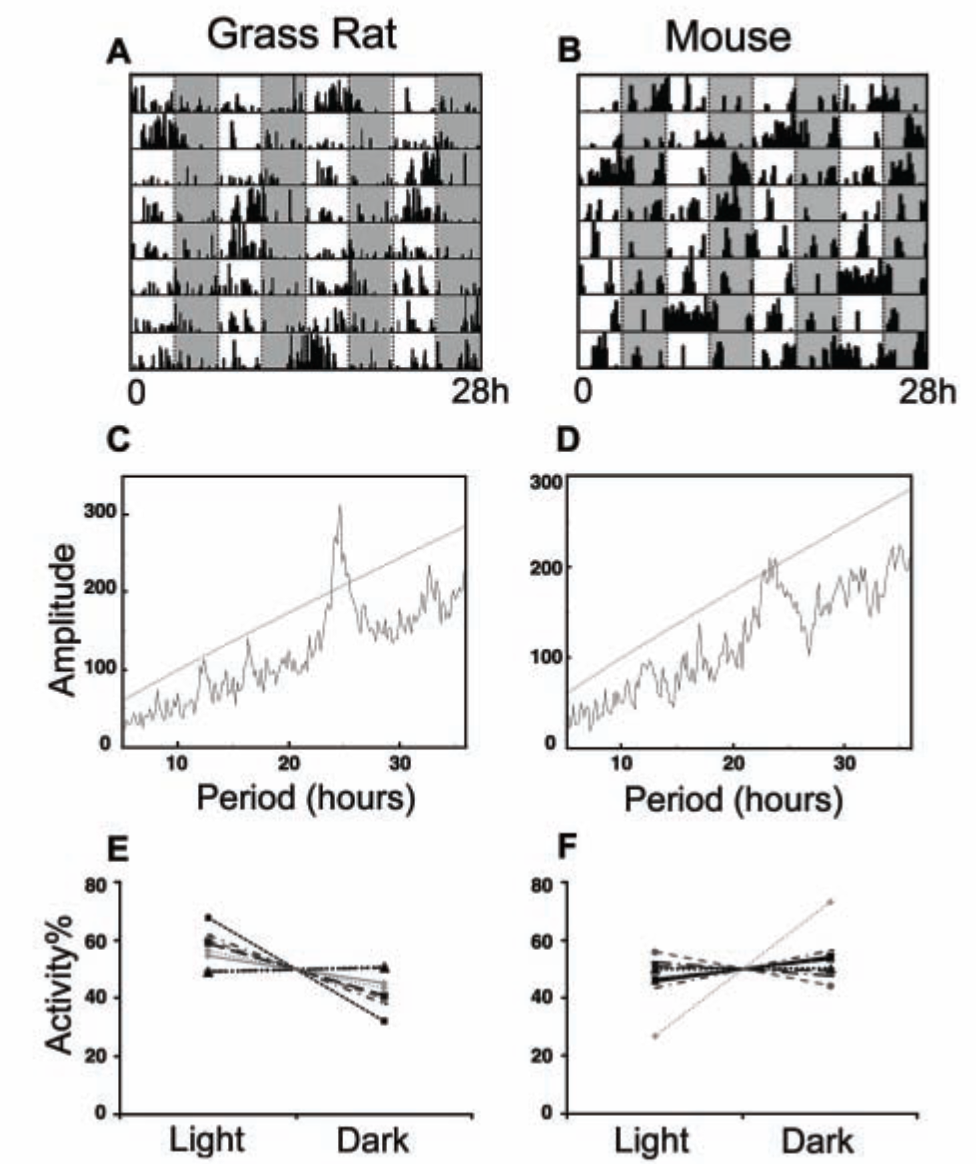
Behavior of grass rats and mice exposed to a 3.5:3.5 LD cycle in experiment 3. Two actograms (A, B) and periodograms (C, D) illustrate the presence of a rhythm with a ~24-h period in both species but no rhythms in the ultradian range in either species (see text for details). The bottom panel presents activity averaged across all of the light and dark phases during the 7-day period of exposure to the 3.5:3.5 LD cycle (E, F). Each animal is represented by a single line. Note that, deviating from the group average, 1 individual mouse showed 73% of activity during the dark phase.
Discussion
Nocturnal and diurnal species generally have inverted masking responses to light/dark stimuli, such that light suppresses activity in the former and increases it in the latter; darkness generally does the reverse (Redlin, 2001). Masking responses to light pulses followed these predictions in our mice and in both male and female grass rats. Dark pulses, however, had no effect in grass rats and only a relatively minor one on our mice. Specifically, a significant response of mice to dark pulses was only apparent at CT 22, at which point they induced a significant increase in activity; a near significant dark-induced increase was seen at CT 14 (p = 0.067). The lack of responsiveness to dark pulses during the day or subjective day by our mice contrasts with the report by Tsai and colleagues (2009) of the induction of wakefulness and suppression of sleep by a 1-h dark pulse presented at ZT3. The discrepant findings may stem from strain differences or may indicate that sleep is a more sensitive measure of masking by dark pulses than is general activity in this nocturnal species.
Dark pulses had no effects on the general activity of our grass rats, whereas Redlin and Mrosovsky (2004) reported negative masking by darkness in grass rats from the same colony. This discrepancy is likely due in part to methodological differences between the 2 studies. Over 2 consecutive days, Redlin and Mrosovsky (2004) presented animals with 1-h cycles of light and darkness across the light phase of a 12:12 LD cycle such that animals were exposed to 12 half-hour periods of darkness. In addition, their light intensity was higher than ours (1000 vs. 300 lux), thus increasing the contrast between light and darkness. Further, although Redlin and Mrosovsky (2004) detected significant differences in the display of general activity by grass rats between the 30 min of dark and light, there was no direct comparison between average activity during the dark pulses and activity during the baseline light period for each corresponding ZT. In fact, when their animals had no access to running wheels, the average activity during the 12 half-hour dark periods (0 lux) was only modestly lower than that for the 12 half-hour periods of light (1000 lux) during baseline conditions. Thus, general activity of grass rats was not very responsive to acute effects of dark exposure even in that study (Redlin and Mrosovsky, 2004).
Responses to light and dark pulses across the 24-h period can reveal the interrelationship between masking and circadian systems. In the golden hamster, masking responses to both dark (Aschoff and von Goetz, 1988) and light pulses (Redlin and Mrosovsky, 1999b) appear to be maximal during the active phase of a 24-h day, although wheel running in hamsters kept in constant light is enhanced by dark pulse delivered both during the subjective day and subjective night (Canal and Piggins, 2006). Compared with hamsters (Redlin and Mrosovsky, 1999b), mice appear to be less responsive to masking stimuli. Thus, in our mice, light suppressed activity only early in the dark phase of the LD cycle (i.e., at ZT14), which is similar to the reduction in wakefulness induced in mice by light pulses presented at ZT15 (Tsai et al., 2009) or at ZT16 (Lupi et al., 2008). We also saw light-induced negative masking in our mice during the subjective night in DD (CT 14), which is close to the point at which masking is most pronounced in hamsters (CT12; Aschoff and von Goetz, 1988). Hamsters, however, continue to show robust responses to light across the entire night. In response to dark pulses, our mice maintained in LL increased their activity at the end of the subjective night (CT22), a time at which hamsters also show enhanced responsiveness to darkness (Redlin and Mrosovsky, 1999b). Thus, although compared with hamsters mice appear to be less responsive to masking stimuli, these 2 nocturnal species display some common features with respect to rhythms in their responses to light and dark pulses.
In experiment 3, the behavior seen in the ultradian cycle could not have been predicted from the results of the first 2 experiments. Specifically, although the mice had clearly responded to discrete pulses of light in the first 2 experiments, there was no indication of masking when these mice were exposed to the ultradian cycle. That is, there was no rhythm with a period of 7 h, and there were no differences in levels of activity during the periods of exposure to light versus dark. Others have used the 7-h protocol to document masking of wheel running in mice by lighting conditions, with highest levels of running occurring during the 3.5-h dark phase of the cycle (Altimus et al., 2008; van der Veen and Archer, 2010). Interestingly, this effect of photic condition is not always accompanied by light-induced changes in sleep and wakefulness (Altimus et al., 2008). Thus, in mice, the 7-h protocol appears to be useful for detecting masking of wheel running, but the threshold for these effects may be higher for general activity (present results) and sleep (Altimus et al., 2008; Tsai et al., 2009). Taken together, these results suggest that different behavioral endpoints respond differently to the same masking stimuli. Also, the same animals may show masking responses to light and darkness at particular times of day, while not showing evidence of masking under the 7-h protocol (present results for mice). These results suggest that one should be cautious about arriving at the conclusion that masking is absent when it is not apparent in animals subjected to this commonly used protocol.
Grass rats undoubtedly evolved from nocturnal rodents (Roll et al., 2006) in which masking responses to photic stimuli were likely to have been very different. With respect to general activity, present-day nocturnal rodents show positive masking in response to darkness and negative masking in response to light, whereas grass rats show strong positive masking in response to light and little or no response to darkness. These differences raise questions as to where within the nervous system evolutionary changes mediating these responses took place. In mice, there is a remarkable separation between mechanisms within the retina that mediate positive and negative masking. Elimination of rods and cones impedes positive masking (Mrosovsky et al., 1999), whereas knocking out the protein melanopsin (Mrosovsky and Hattar, 2003) profoundly reduces negative masking of wheel running and the facilitation of sleep by light (i.e., “photosomnolence”; Morin and Studholme, 2009) in nocturnal mice (Altimus et al., 2008; Lupi et al., 2008; Tsai et al., 2009; Morin and Studholme, 2011). Redlin et al. (1999) argue that the separation between pathways mediating positive and negative masking in nocturnal species is also evident in the brain, as intergeniculate lesions alter only negative masking in hamsters. The mechanisms mediating positive and negative masking, within the retina or the brain, have never been investigated in a diurnal species. The simpler masking behavior of the grass rat, in which positive masking is dominant, may provide a useful model with which to investigate the neural mechanisms mediating masking responses to light. In addition, the species differences seen here, with nocturnal and diurnal animals showing the opposite behavioral responses to the same stimulus when tested under identical conditions, provide a useful model for the investigation of the more fundamental issue of how evolutionary changes in the nervous system could have mediated evolutionary changes in behavior.
Footnotes
Acknowledgements
We thank Breyanna Cavanaugh, Jennifer Van loon, Carmel Martin-Fairey, and Thomas Groves for their expert assistance. The study was supported by the National Science Foundation grant (IOS-1051919, to L.S., A.A.N., and L.Y.), and D.D.S. was supported by a training grant from the NIH (T32 MH070343).
Conflict of Interest Statement
The authors declared no potential conflicts of interest with respect to the research, authorship, and/or publication of this article.