
Abstract
Studies using self-report and physiological markers of circadian rhythmicity have demonstrated sex differences in a number of circadian attributes including morningness-eveningness, entrained phase, and intrinsic period. However, these sex differences have not been examined at the level of the molecular clock and not in human cerebral cortex. The authors tested the hypothesis that there are detectable daily rhythms of clock gene expression in human cerebral cortex and that there are significant sex differences in the timing of these rhythms. The expression levels of 3 clock genes—PER2, PER3, and ARNTL1—were quantified in samples of dorsolateral prefrontal cortex from 490 deceased individuals in 2 cohort studies of older individuals, the Religious Orders Study and the Rush Memory and Aging Project, using mRNA microarray data. Clock gene expression at death was parameterized as a function of time of death using cosine curves and was examined for sex differences in the phase of these curves. Significant daily variation was seen in the expression of PER2 (p = 0.004), PER3 (p = 0.003), and ARNTL1 (p = 0.0005). PER2/3 expression peaked at 10:38 (95% confidence interval [CI], 09:20-11:56) and 10:44 (95% CI, 09:29-11:59), respectively, and ARNTL1 expression peaked in antiphase to this at 21:23 (95% CI, 20:16-22:30). The timing of the expression of all 3 genes was significantly earlier in women than in men (PER2 6.8 h, p = 0.002; PER3 5.5 h, p = 0.001; ARNTL1 4.7 h, p = 0.007). Daily rhythms of clock gene expression are present in human cerebral cortex and can be inferred from postmortem samples. Moreover, these rhythms are relatively delayed in men compared with women.
There are sex-related differences in a number of circadian attributes. For instance, women are more likely to report subjective morning preference than men (Adan and Natale, 2002), women tend to sleep and wake earlier than men (Adan and Natale, 2002), and studies using measurements of core body temperature and melatonin secretion as physiological markers of the intrinsic circadian timing system have found that women have an earlier entrained phase (Cain et al., 2010) and shorter intrinsic period than men (Duffy et al., 2011).
In mammalian model organisms, circadian rhythms are generated at the cellular level by a transcription-translation feedback cycle involving a series of evolutionarily conserved clock genes (Takahashi et al., 2008). This circadian “clock” is present both in the suprachiasmatic nucleus (SCN, the master circadian pacemaker in mammals; Hastings et al., 2003) and in peripheral tissues (Hastings et al., 2003), where it drives rhythms in cellular processes in part by modulating the abundance of gene transcripts involved in these processes. It remains unclear whether sex differences in daily rhythms at the level of the human molecular clock underlie the observed sex-related differences in physiological and behavioral circadian rhythms.
There is particular interest in characterizing the daily rhythmicity of clock genes in cerebral cortex because there are prominent daily rhythms in a number of normal and pathological brain processes and behaviors, including cognition (Wright et al., 2012; Wyatt et al., 1999), seizures (Loddenkemper et al., 2011; Zarowski et al., 2011), stroke (Turin et al., 2009), and soluble amyloid-beta levels (Kang et al., 2009), and rhythms of gene expression in cerebral cortex could be a mechanism contributing to these effects. Whereas prominent daily rhythms in the abundance of clock and other gene transcripts have been demonstrated in mouse cerebral cortex (Yang et al., 2007) and daily rhythms in clock gene expression have been demonstrated in nonneurological human tissues (Archer et al., 2008; Boivin et al., 2003; Hida et al., 2009; James et al., 2007; Kusanagi et al., 2008; Leibetseder et al., 2009; Pardini et al., 2005; Takimoto et al., 2005; Teboul et al., 2005), we are aware of only one study that has assessed daily rhythms of clock gene expression in human cerebral cortex; the study found significant daily rhythms in PER2 but not PER1 in human cingulate cortex and daily rhythms of ARNTL1 (the human homolog of BMAL1) in subjects with Alzheimer disease (AD) but no rhythm in subjects without AD (Cermakian et al., 2011).
We used dorsolateral prefrontal cortex mRNA microarray data from 490 deceased individuals from 2 ongoing cohort studies of older individuals, the Religious Orders Study and the Rush Memory and Aging Project, to test the hypothesis that there are significant daily rhythms in the expression of 3 core clock genes—PER2, PER3, and ARNTL1—in human cerebral cortex and to test the hypothesis that there are significant sex differences in the timing of these rhythms.
Materials and Methods
Participants
This study included participants from 2 ongoing longitudinal cohort studies of older individuals: the Religious Orders Study (ROS) and the Rush Memory and Aging Project (MAP). The MAP is a community-based study of aging in the greater Chicago area. Recruitment and assessment procedures are described elsewhere (Bennett et al., 2012b). Participants are free of dementia at study enrollment and agree to annual evaluations and brain donation upon death. At the time of the current analyses, 1539 individuals had completed baseline evaluation and 490 had died, and cerebral cortex gene expression data that passed quality control were available from 191. The ROS is a longitudinal study of aging in Catholic priests, nuns, and brothers from 40 groups in 12 states ranging from California to New York. A detailed description can be found elsewhere (Bennett et al., 2012a). At the time of the current analyses, 1164 individuals had completed baseline evaluation and 570 had died, and cerebral cortex gene expression data that passed quality control were available from 299. Thus, a total of 490 participants (191 MAP and 299 ROS) were included in the current analyses. Because all participants in the ROS and MAP are organ donors, time of death is well captured in both cohorts. Characteristics of the study participants are shown in Table 1.
Characteristics of the study participants.
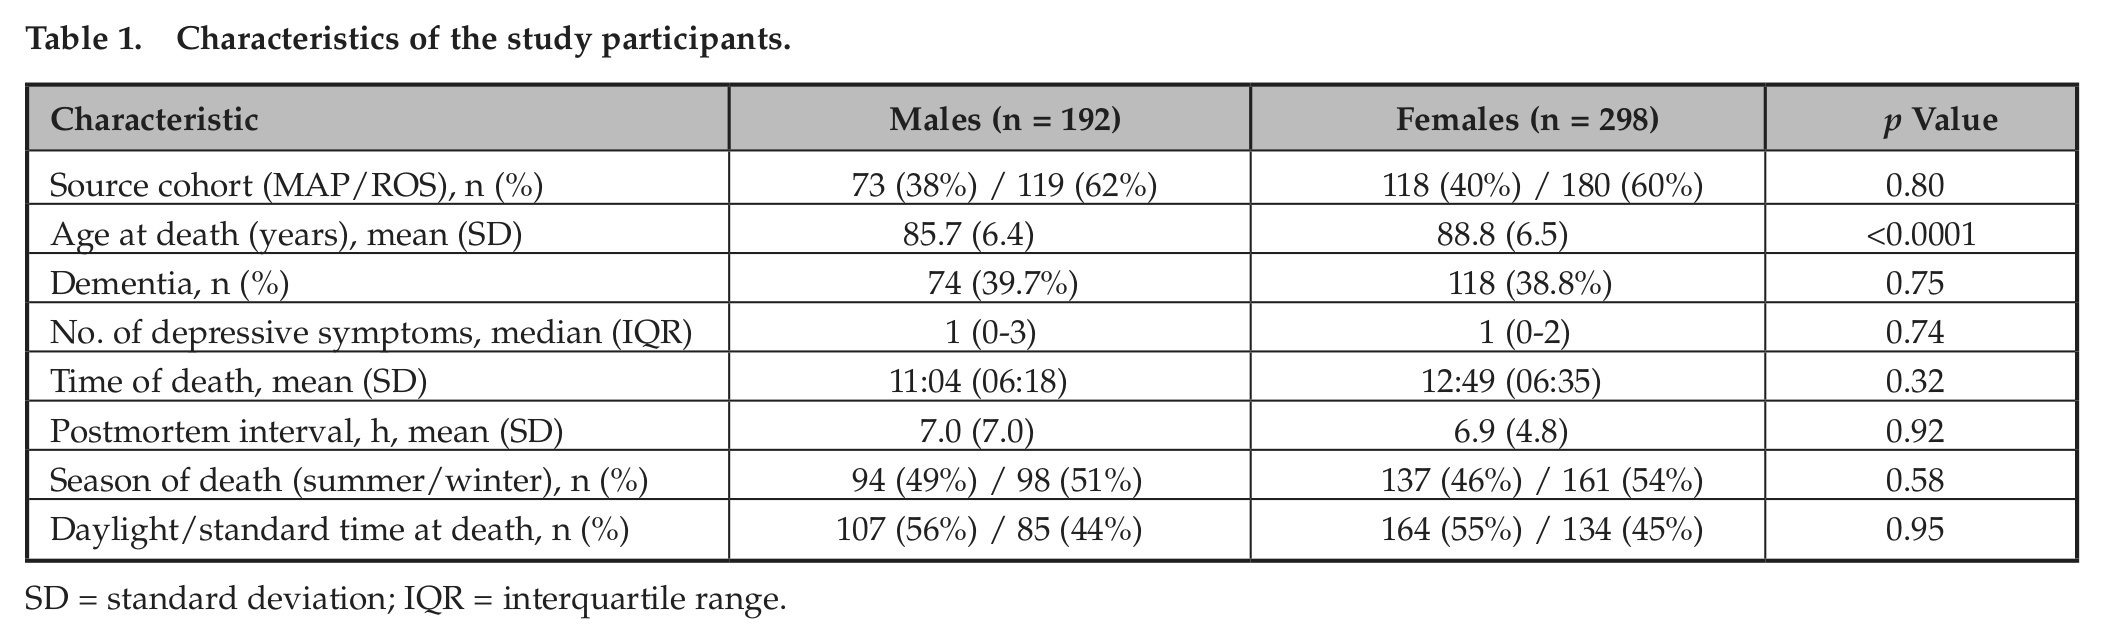
SD = standard deviation; IQR = interquartile range.
Statement of Ethics Approval
The study was conducted in accordance with the latest version of the Declaration of Helsinki and was approved by the Institutional Review Board of Rush University Medical Center. Written informed consent was obtained from all subjects.
Evaluation of Dorsolateral Prefrontal Cortex Transcript Expression
Expression data for PER2, PER3, and ARNTL1 were generated as follows. Frozen blocks of dorsolateral prefrontal cortex were manually dissected from postmortem brain tissue, and total RNA was isolated using the RNeasy lipid tissue kit (Qiagen, Valencia, CA). RNA was reverse transcribed and biotin-UTP labeled using the Illumina TotalPrep RNA Amplification Kit from Ambion (Illumina, San Diego, CA). Antisense RNA was then hybridized to the Illumina Human HT-12 v3 Expression BeadChip (Illumina) using a Scigene Little Dipper robotic processor (Illumina). To control for any skew created by subtle variations in chip-to-chip hybridization conditions, the last channel of each chip contained the same control sample (Ambion Human Brain Total RNA, Life Technologies, Grand Island, NY). Samples with control probe profiles with a signal-to-noise ratio (P95/P05 ≤ 9) were excluded. Probes with a detection score p value >0.05 were excluded. Background signal was subtracted prior to analysis using the Beadstudio software suite (Illumina). Signals were then normalized by first taking the geometric mean of all Ambion control RNA channels and dividing each control channel by that mean to get the normalization factor. The profiles for each sample were then divided by this normalization factor to obtain input for further correction using the Lumi suite available in R (Du et al., 2008; Lin et al., 2008). This additional normalization accounts for technical variability due to differences in hybridization date (a significant source of variability in previous studies; Webster et al., 2009) and also stabilizes the variance for the purposes of statistical analysis. After normalization, we sought to account for the contribution of identifiable biological (age, sex) and technical (postmortem interval, detection rate) factors to the overall variance in expression levels of each transcript, and thereby decrease the “noise” in the data, by regressing the transcript data against these factors. After the model was fitted, the residuals of the model were kept and represent the expression level of each transcript adjusted for these factors. This accounts for the contribution of these factors to the overall noise in the mean levels of each transcript but does not preclude assessment of the effects of these factors on the amplitude and phase of rhythmicity. From this data set, for each participant, we extracted the normalized expression levels of PER2, PER3, and ARNTL1. Unfortunately, data for PER1 were not available in this data set.
Assessment of Clinical Covariates
Age was computed from the self-reported date of birth and the date of death. Sex was recorded at the time of the baseline interview.
Participants were classified as having died in the summer if their date of death was between the spring equinox and the fall equinox and as having died in the winter if their date of death was between the fall equinox and the spring equinox. Individuals were classified as having died during daylight savings time if their date of death was between the first Sunday in April and the last Sunday in October (deaths prior to 2006) or between the second Sunday of March and the first Sunday of November (deaths after 2006). This change in definition reflects changes in the definition of daylight savings time due to the Energy Policy Act of 2005 in the United States.
Individuals were classified as having or not having dementia as previously described (Bennett et al., 2006). In brief, trained technicians annually administered 21 cognitive tests spanning 5 cognitive domains (Wilson et al., 2005). The results of cognitive tests were reviewed by a neuropsychologist to determine the presence or absence of cognitive impairment. At each annual evaluation, a clinician combined the most current available cognitive and clinical data to determine whether the subject had dementia according to the NINDS-ADRDA criteria (McKhann et al., 1984). The final determination of the presence or absence of dementia at the time of death was based on consideration of all cognitive assessments prior to death.
Depressive symptoms were assessed with a 10-item version of the Center for Epidemiologic Studies–Depression Scale (Bennett et al., 2005) based on the last evaluation prior to death, which occurred a median (interquartile range) of 9 (5-12) months prior to death.
Analysis
The chi-square test was used to compare male and female subjects with regard to source cohort (ROS vs. MAP), frequency of dementia, season of death, and daylight versus standard time at death. We used t tests to compare male and female subjects with respect to age and postmortem interval between death and tissue collection. The Wilcoxon test was used to compare the number of depressive symptoms between males and females. Rao’s test was used to compare male and female subjects with respect to mean clock time of death.
To visually illustrate temporal trends in gene expression in a hypothesis-free manner, we double plotted PER2, PER3, and ARNTL1 expression levels against clock time of death and performed nonparametric LOESS regression (Cleveland and Devlin, 1988) (Fig, 1, A, C, E, dashed lines). LOESS is a nonparametric regression approach that fits a simple polynomial model to a moving localized window of data (a moving average is a simple form of LOESS regression). At each data point, a low degree polynomial is fitted to the subset of data surrounding that point using a weighted least squares approach, and the value of the regression function at each point is the value of the local polynomial function evaluated at that point. LOESS regression has the advantage of not presupposing a specific functional form for the data, and therefore it complements the cosinor approach described below. In addition to using a LOESS approach, we also visualized the data by dividing the data into 4-h bins and plotting the mean expression levels and 95% confidence intervals (CIs) on the means (Fig, 1, B, D, F, bars). Based on visual inspection of these figures, and consistent with other investigators (Archer et al., 2008; Cermakian et al., 2011), we parameterized daily variation in the gene expression data using functions of the form
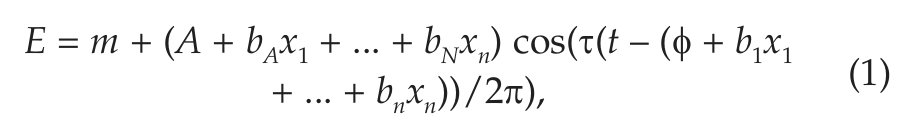
where the terms b1x1+ ... + bnxn allow assessment of the effect of various demographic and clinical predictors on the timing of the acrophase of gene expression, the terms bAx1 + ... + bNxn allow the assessment of the effect of these clinical predictors on the amplitude of gene expression, and the term ττ allows for a variable model period. Unless otherwise stated, we set ττ = 1 (corresponding to a model period of 24 h) in Equation 1. All clock times were converted to radians (2π radians = 24 h; 0 radians = midnight) for analysis and then converted back to hours for the purposes of visual representation.
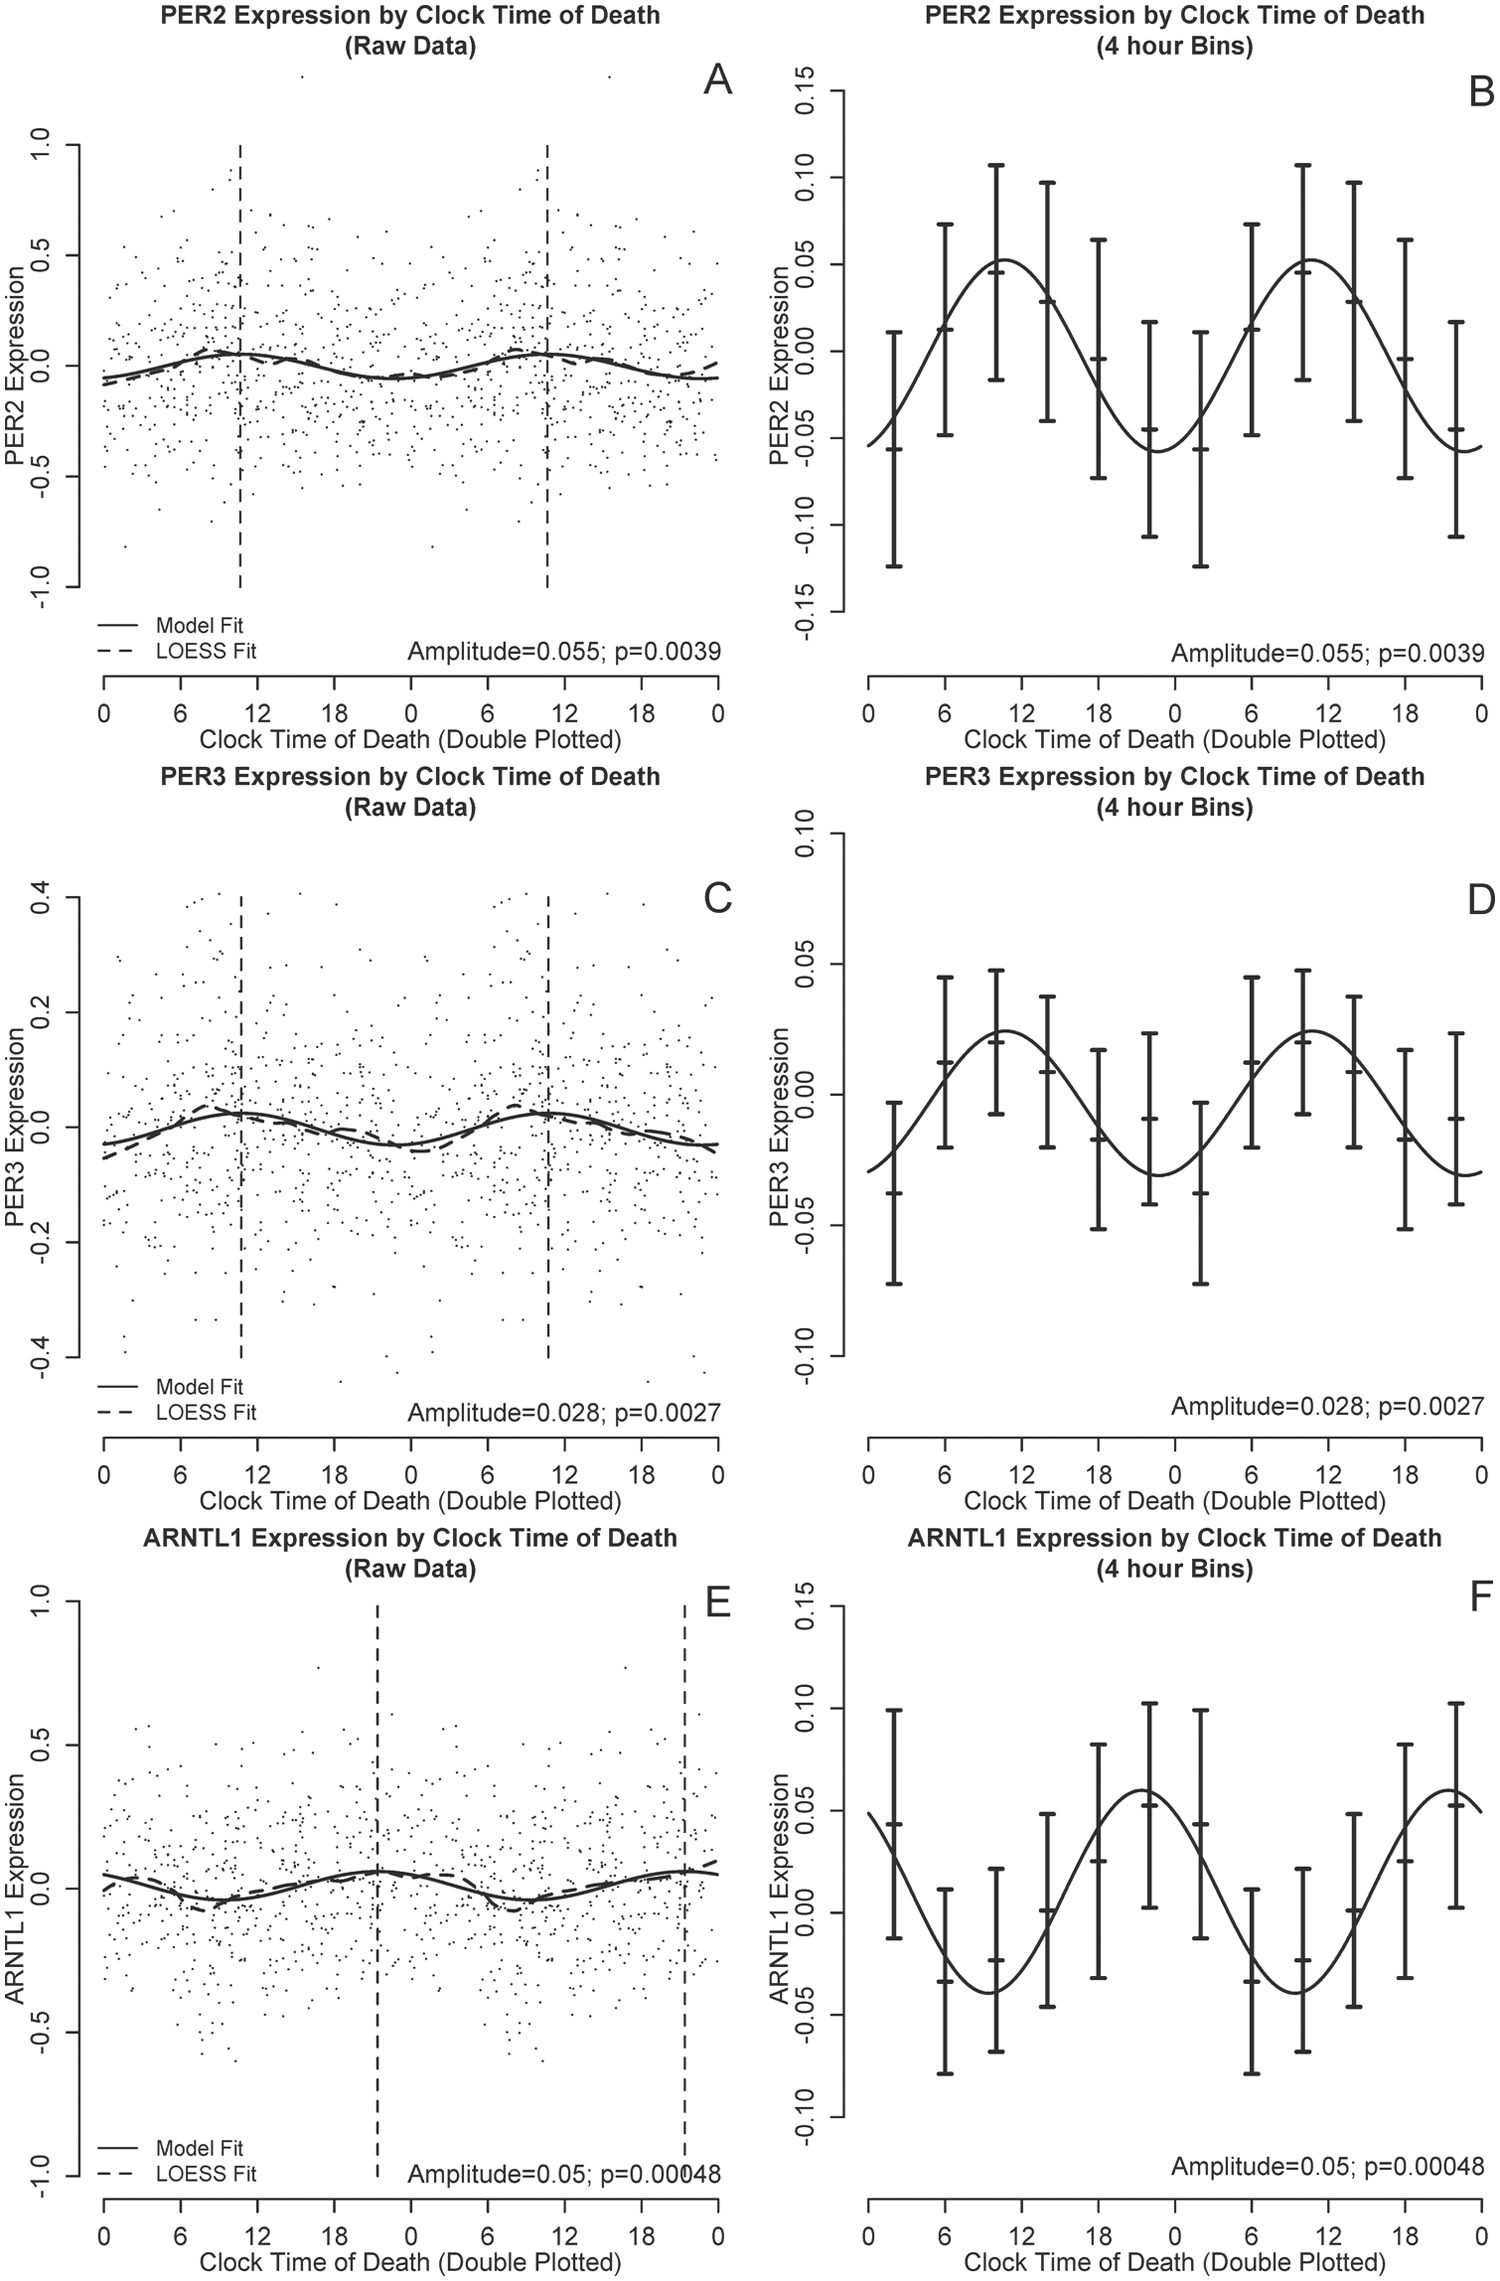
PER2, PER3, and ARNTL1 transcript abundance by clock time of death. (A, B) PER2, (B, D) PER3, and (E, F) ARNTL1 transcript abundance by time of death considering all subjects together. All 6 panels are double plotted to assist visualization, although all analyses were based on only a single 24-h cycle. (A, C, E) Black dots indicate raw data. Dashed line indicates nonparametric LOESS regression. Solid line indicates best-fit cosine curve. Vertical lines indicate the timing of the acrophase. (B, D, F) Raw data binned into 4-h intervals. Horizontal lines indicate means and 95% confidence intervals of the mean. Solid curve indicates the best-fit cosine curve based on the raw (unbinned) data.
To examine for the presence or absence of significant daily variation in gene expression, we fit base functions of the form depicted in Equation 1 with time of death as the only predictor (i.e., b1 ... bn = 0 and bA ... bN = 0) to the expression data for PER2, PER3, and ARNTL1 by nonlinear least squares regression using the R nls function, and we assessed the significance of A<>0 (i.e., |amplitude|>0) using the t statistic.
We used a bootstrap procedure to further validate these results. Specifically, we repeated the primary cosine models for 10,000 resampled copies of the data set and summarized empirical distributions of the model parameters by calculating the means and 95% confidence intervals of the bootstrap estimates.
Next, to examine the association between sex and the amplitude and timing of the acrophase of gene expression, we used nonlinear least squares to fit a series of core models of the form depicted in Equation 1, with sex as the main predictor and age and postmortem interval as covariates (i.e., x1 = sex, x2 = age, and x3= postmortem interval; Model 1). To determine whether the findings were similar in both cohorts, we augmented these models with terms for source cohort (MAP vs. ROS) and (cohort × sex) interaction.
We then proceeded to augment our core models with terms for the presence or absence of dementia and the number of depressive symptoms (i.e., x1 = sex, x2 = age, x3 = postmortem interval, x4 = dementia, x5 = depression; Model 2). We then proceeded to augment our core models with terms for the season of death and whether death occurred during daylight savings time (DST) or standard time (i.e., x1 = sex, x2 = age, x3 = postmortem interval, x4 = season, x5 = DST; Model 3). Finally, we repeated our core models but allowed τ in Equation 1 to be unconstrained.
Visual examination of residual plots confirmed that cosine curves of the form described above provided a functionally appropriate description of temporal trends in the expression of PER2, PER3, and ARNTL1 and confirmed model assumptions of homogeneous variance.
Results
Characteristics of the Study Participants
Data from 490 participants (192 males and 298 females) were included in this study. Characteristics of the study participants are shown in Table 1. There were no significant differences between men and women with regard to source cohort (ROS vs. MAP), prevalence of dementia, number of depressive symptoms, clock time of death, season of death, or postmortem interval. The female subjects were older than the males at the time of death (88.6 vs. 85.7 years, p < 0.0001).
Daily Patterns of Cortical PER2, PER3, and ARNTL1 Expression
We used nonparametric LOESS (Cleveland and Devlin, 1988) regression to illustrate daily patterns in cortical PER2, PER3, and ARNTL1 expression in an unbiased manner (Fig. 1, A, C, E, dashed line). We also divided the data into 4-h bins and plotted expression levels across binned time of death (Fig. 1, B, D, F). Using these plots, we then used nonlinear least squares to fit the data to cosine functions of the form depicted in Equation 1 and examined the effect sizes for m (mesor), A (amplitude), and φ (acrophase). These analyses were performed on the raw rather than the binned data. As shown in Figures 1 and 2 and Table 2, the amplitudes of the best-fit functions were significantly greater than 0 for all 3 genes (i.e., p < 0.05 for the null hypothesis A = 0), indicating nonuniformity of PER2, PER3, and ARNTL1 expression through the 24-h day. Both PER2 and PER3 had peak expression in the late morning, whereas ARNTL1 expression was nearly in antiphase to PER2 and PER3, peaking in the late evening (Fig. 2).
Parameters of the best-fit cosine curves for the daily rhythms of cerebral cortex PER2, PER3, and ARNTL1 expression.
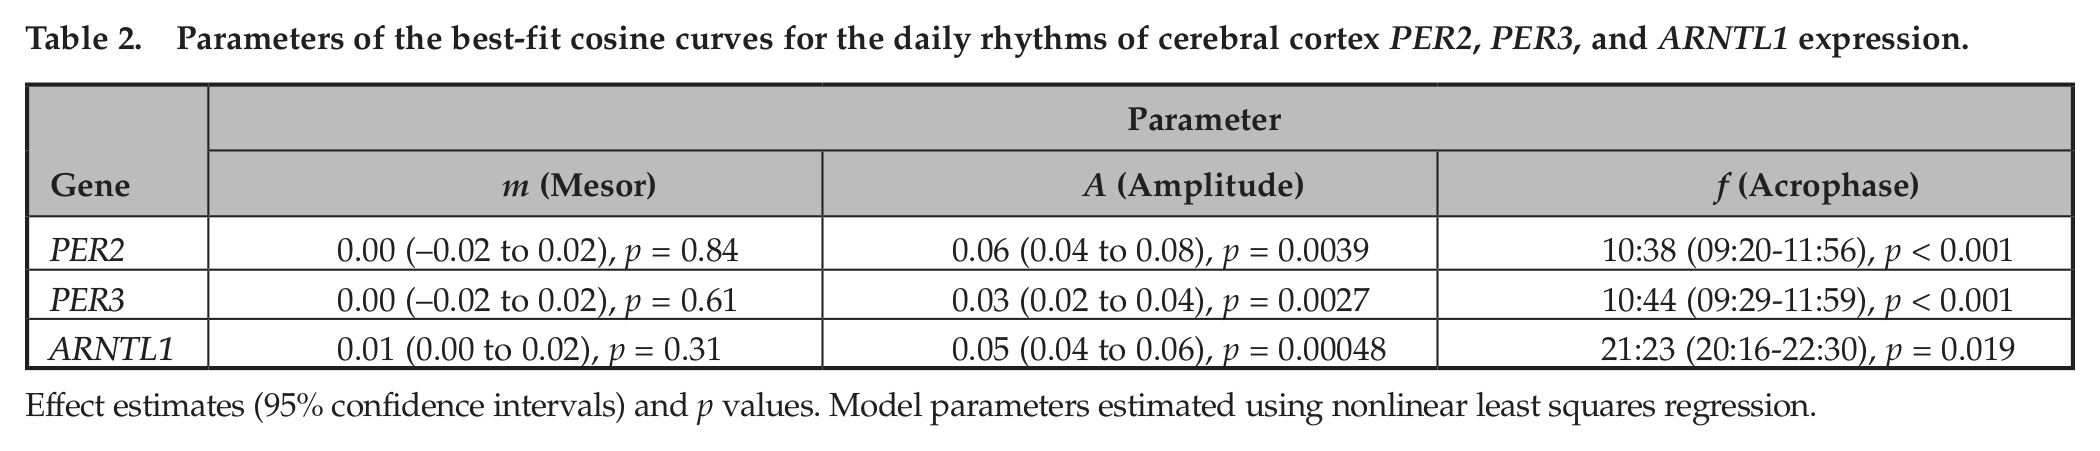
Effect estimates (95% confidence intervals) and p values. Model parameters estimated using nonlinear least squares regression.
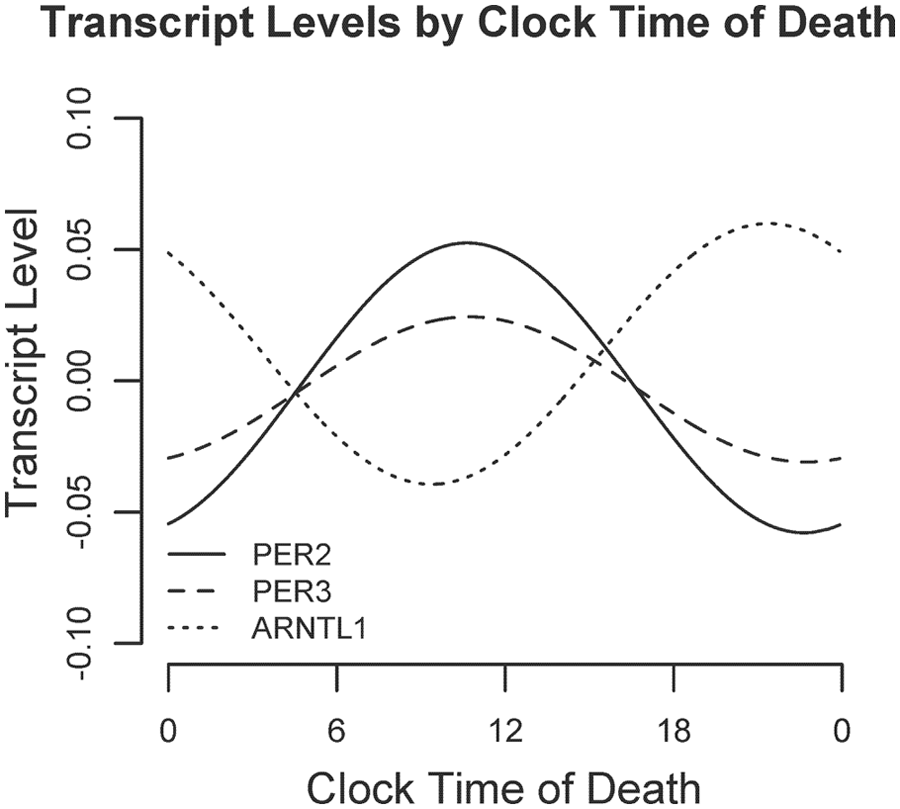
Relative timing of daily rhythms of PER2, PER3, and ARNTL1. Best-fit cosine curves for PER2, PER3, and ARNTL1 illustrating their relative abundances as a function of clock time.
The empirical distributions for the parameters of these models were estimated using a bootstrap procedure. The parameter estimates and 95% CIs estimated from the bootstrap procedure were similar to those from the main cosinor analysis (Suppl. Table S1). As with the main analysis, the amplitudes of the best-fit functions were significantly greater than 0 for all 3 genes (i.e., p < 0.05 for the null hypothesis A = 0).
Sex Differences in the Timing of Cortical PER2, PER3, and ARNTL1 Expression
To examine associations between sex and the timing of cortical PER2, PER3, and ARNTL1 expression, we used nonlinear least squares methods to fit cosine curves of the form depicted in Equation 1 to the raw data, with additional terms to account for age, sex, and postmortem interval. There was no difference in amplitude between men and women for any of the transcripts. However, peak expression was significantly delayed in males compared with females for all 3 transcripts (Table 3, Model 1; Fig. 3) with an estimated delay of 6.8 h (95% confidence interval [CI], 2.9-10.8 h), 5.5 h (95% CI, 1.3-9.8 h) and 4.7 h (95% CI, 1.2-8.1 h) for PER2, PER3, and ARNTL, respectively
Effect of sex, dementia, depression, and calendar date on parameters of the daily rhythms of cerebral cortical PER2, PER3, and ARNTL1 expression.
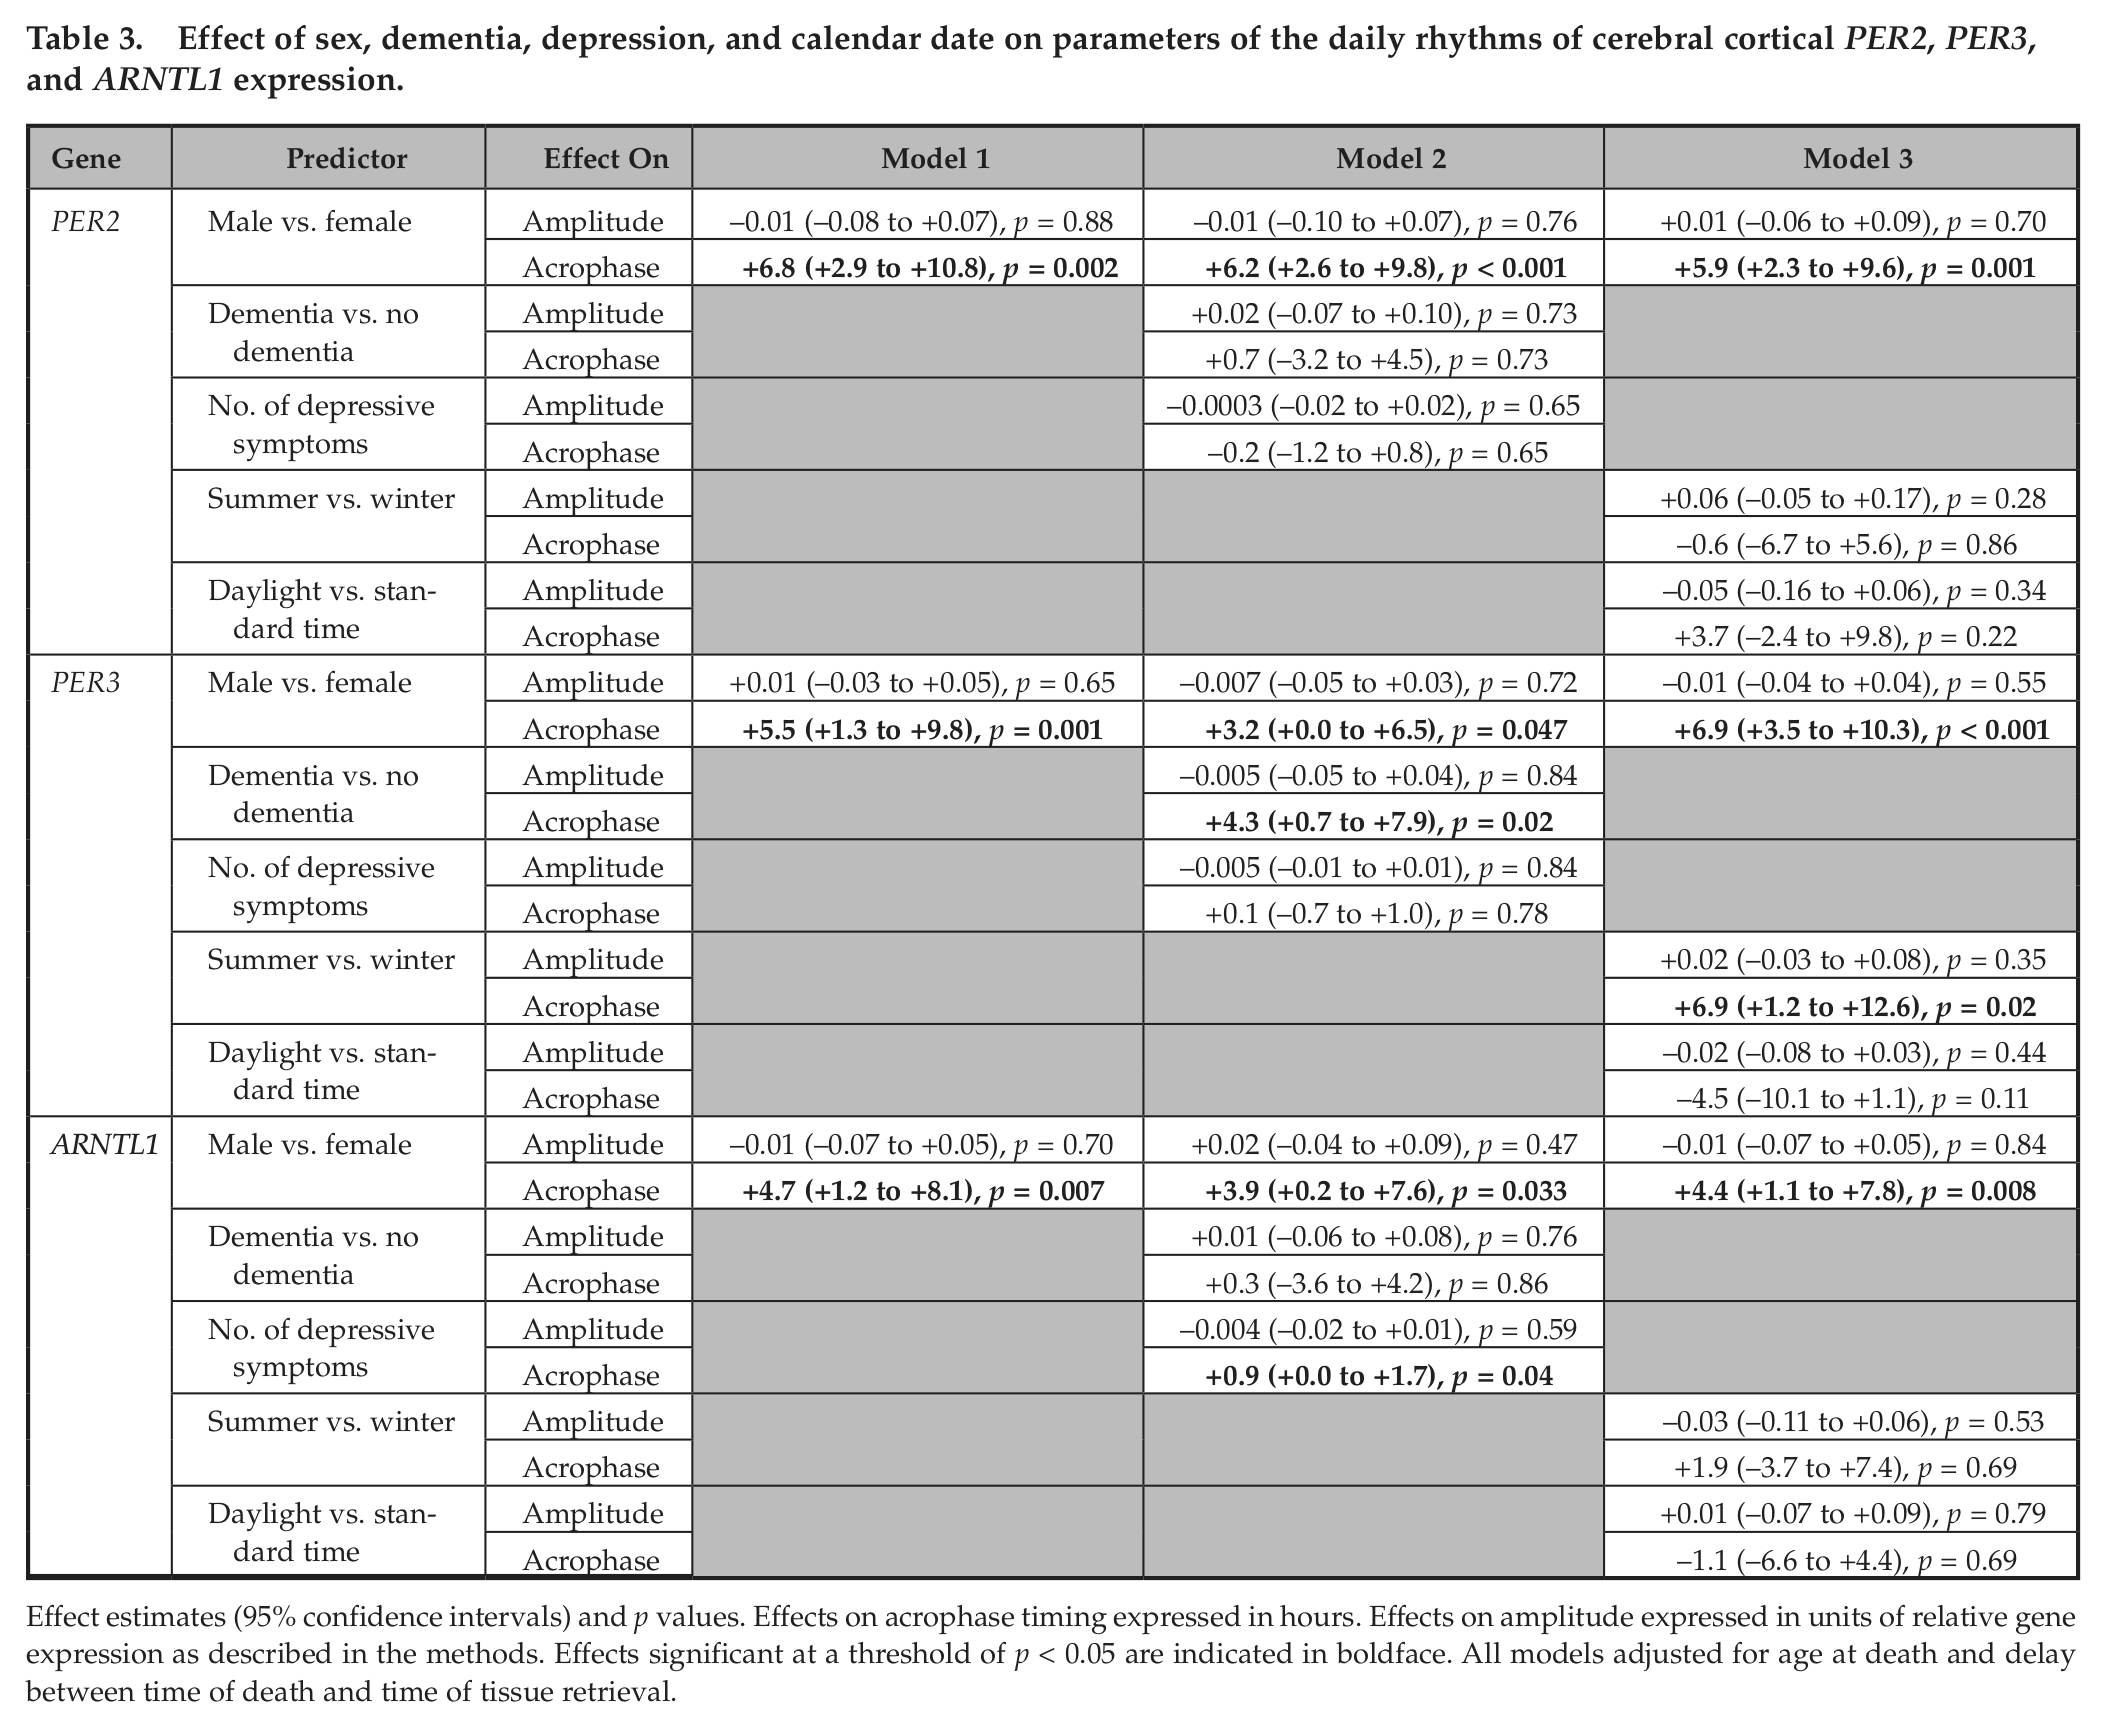
Effect estimates (95% confidence intervals) and p values. Effects on acrophase timing expressed in hours. Effects on amplitude expressed in units of relative gene expression as described in the methods. Effects significant at a threshold of p < 0.05 are indicated in boldface. All models adjusted for age at death and delay between time of death and time of tissue retrieval.
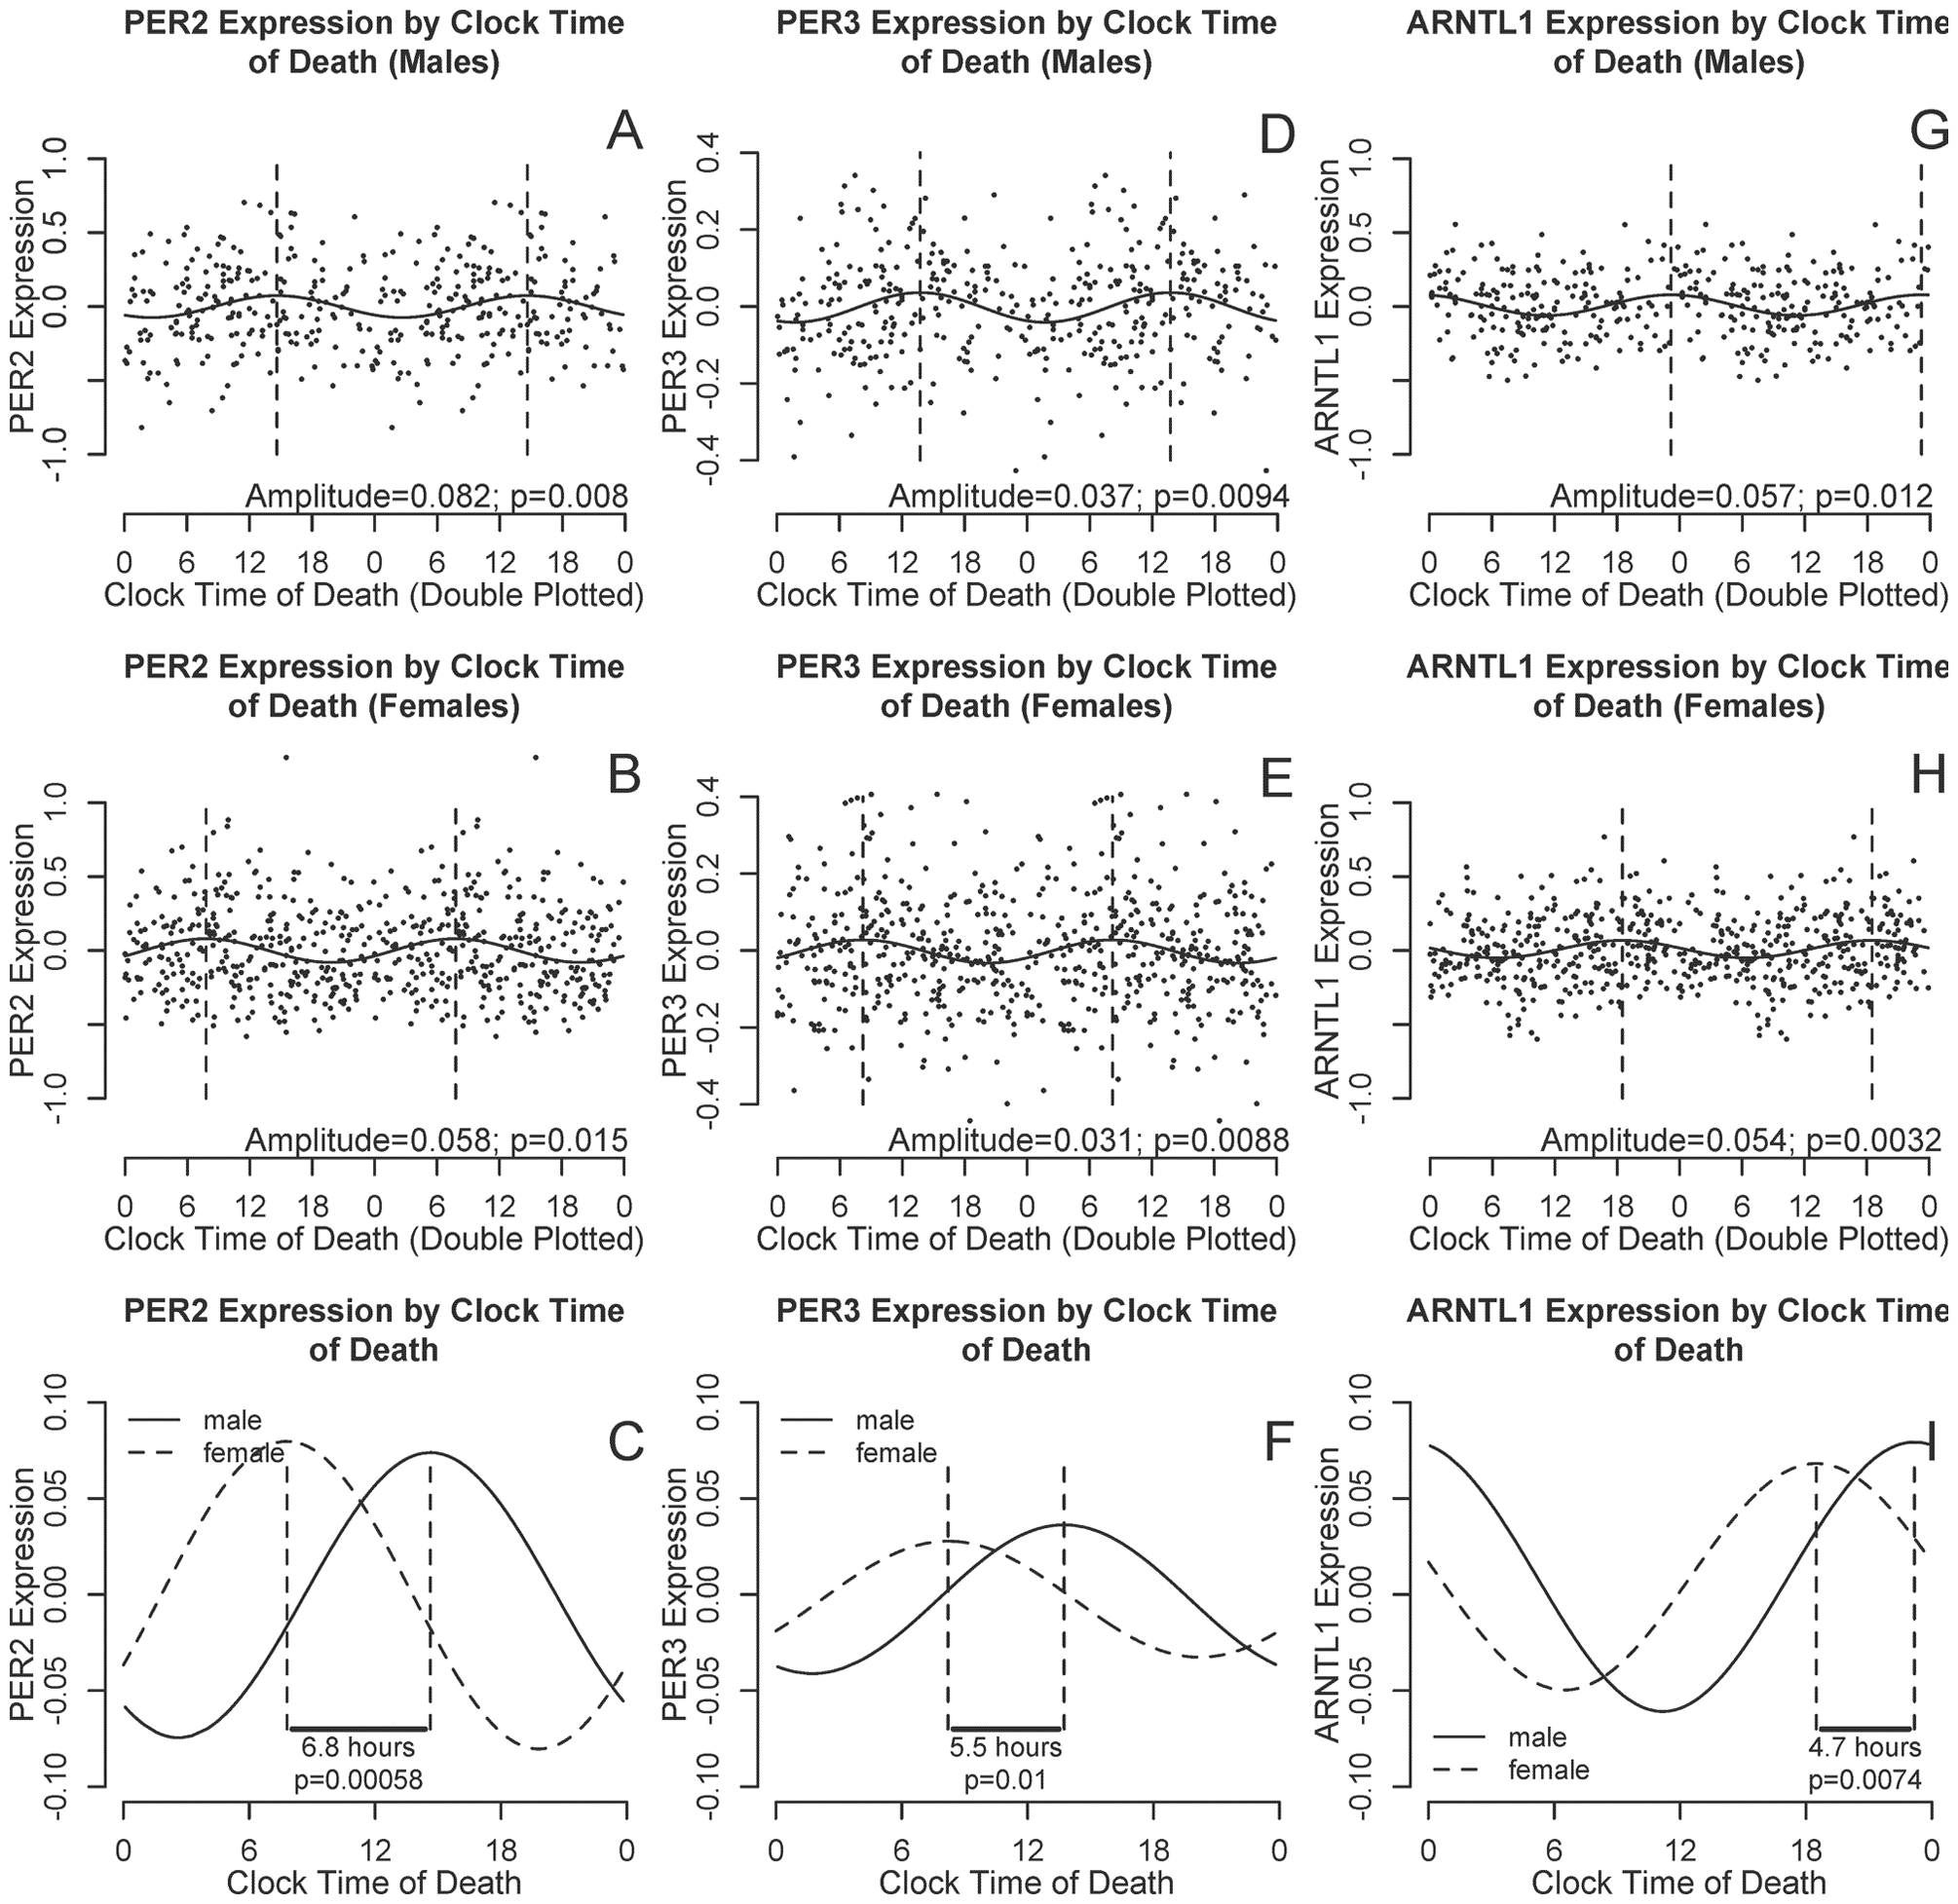
PER2, PER3, and ARNTL1 transcript abundance by clock time of death, stratified by sex. (A-B, D-E, and G-H) PER2, PER3, and ARNTL1 abundance double plotted against clock time for males (A, D, F) and females (B, E, I). Data are binned into 4-h windows. Horizontal lines indicate means and 95% confidence intervals of the means, the solid curve is the best-fit cosine curve, and dotted lines indicate acrophase. (C, F, I) Difference in acrophase timing between male (solid line) and female (dashed line) best-fit cosine curves for PER2, PER3, and ARNTL1 abundance as a function of clock time of death, adjusted for age and postmortem interval. A-B, D-E, and G-H show raw data and best-fit curves unadjusted for age and postmortem intervals. C, F, I show best-fit curves adjusted for age and postmortem interval.
Effect of Source Cohort
Our study population was derived from 2 source cohorts, the MAP and ROS, which were pooled to increase study power. To investigate the extent to which our findings are similar in both cohorts, we augmented Model 1 for each transcript to include terms for source cohort and for a cohort × sex interaction. None of these terms was significant (p > 0.05 for all), indicating that the amplitude, acrophase timing, and effect of sex were similar in both cohorts.
Effect of Dementia and Depression on the Timing of Cortical PER2, PER3, and ARNTL1 Expression
Individuals with dementia can have alterations of entrained circadian behavior and gene expression compared with those without dementia (Cermakian et al., 2011; Witting et al., 1990; Wu et al., 2007). Moreover, depression and circadian disruption are linked in a number of ways (Kronfeld-Schor and Einat, 2012). To investigate the effect of dementia and depression on daily rhythms of PER2, PER3, and ARNTL1 expression, we augmented our cosine models for each transcript to include terms for presence or absence of dementia and number of depressive symptoms. There was no significant difference in the clock time of death (p = 0.73 by Rao’s test) or in the date of death (p = 0.69 by Rao’s test) between subjects with and without dementia. In all 3 models with terms for dementia and depression, the timing of cortical PER2, PER3, and ARNTL1 expression remained significantly later in males compared with females (Table 3, Model 2). Neither the presence or absence of dementia nor the number of depressive symptoms had a significant effect on the amplitude of the best-fit cosine curve for any of the 3 transcripts. The timing of the acrophase of PER3 expression was later in individuals with dementia than without (point estimate +4.3 h; 95% CI, 0.7-7.9 h; p = 0.02), but this was not the case for PER2 and ARNTL1. A higher number of depressive symptoms was associated with a later timing of the acrophase of ARNTL1 rhythmicity (point estimate +0.9 h per additional symptom; 95% CI, 0.0-1.7 h; p = 0.04) but not PER2 or PER3.
Effect of Season and Daylight Savings Time
Light is an important environmental time cue. The timing of natural light exposure relative to local clock time is influenced by season, superimposed over which there is in North America an effect of daylight savings time. To account for and evaluate these effects on the amplitude and timing of the acrophase of the daily rhythms of PER2, PER3, and ARNTL1 expression, we augmented our core model for each transcript with additional terms for date of death (summer vs. winter, and daylight savings time vs. standard time). Daylight savings time was not associated with amplitude or acrophase timing for any of the 3 transcripts. Death occurring in the summer was associated with a later timing of the acrophase for PER3 (effect = 6.9 h; 95% CI, 1.2-12.6 h; p = 0.02), but not for PER2 or ARNTL1, and was not associated with differences in amplitude for any of the 3 transcripts.
Consideration of Unrestricted τ
Under normal conditions, an organism’s internal circadian timekeeping system is entrained to the 24-h light-dark cycle and therefore expresses a period of 24 h. However, this may not be the case toward the end of life, when many individuals may be relatively isolated from environmental and social time cues. As a sensitivity analysis, we repeated our core models without constraining τ at all. In this model, the estimates (SE) for the parameter τ of the best-fit cosine curves for PER2, PER3, and ARNTL1 were 26.4 (3.6), 25.2 (4.3), and 23.3 (3.4) h, respectively. Even allowing for τ to assume values different from 24 h, the timing of cortical PER2, PER3, and ARNTL1 expression remained significantly later in males compared with females (point estimates [95% CI] p values for PER2, PER3, and ARNTL1 were 6.2 h [2.4-9.0 h], p = 0.001; 5.7 h [1.5-9.9 h], p = 0.007; and 4.7 h [1.1-8.3 h], p = 0.009, respectively).
Discussion
In this set of cerebral cortical tissue from 490 deceased older individuals, the expression of PER2, PER3, and ARNTL1 varied significantly by time of day, with PER2 and PER3 showing peaks in the late morning and ARNTL1 in the late evening. Moreover, the timing of the expression of these genes was significantly later in males compared with females. These effects were independent of age, postmortem interval, dementia, depression, and season of death. These data are consistent with the presence of a peripheral oscillator in human cerebral cortex. Moreover, they suggest that previously reported sex differences in circadian preferences, behavior, and physiology may extend down to the molecular level and reflect differences in the entrained phase of the core molecular clock.
Studies in animal models have provided abundant evidence for the existence of molecular circadian oscillators in a number of peripheral tissues (Hastings et al., 2003), including cerebral cortex (Yang et al., 2007). A body of evidence supports the existence of these “peripheral” clocks in a number of human tissues as well, including peripheral blood mononuclear cells (Archer et al., 2008; Boivin et al., 2003; Hida et al., 2009; James et al., 2007; Kusanagi et al., 2008; Takimoto et al., 2005; Teboul et al., 2005), heart (Leibetseder et al., 2009), and colon (Pardini et al., 2005). One previous study provided evidence for daily variation of PER2 expression in human cingulate cortex and of ARNTL1 expression in human cingulate cortex from individuals with AD but not in control subjects (Cermakian et al., 2011). Our results extend this previous work by showing evidence for significant daily variation not only in PER2 but also in ARNTL1 and PER3 in human dorsolateral prefrontal cortex. Our data suggest that peak expression levels of PER2/PER3 in the human cerebral cortex occur in the late morning, whereas peak levels of ARNTL1 occur in the evening. The timing of the PER2 peak in our data is similar to that reported in a previous study using human cingulate cortex (Cermakian et al., 2011). Allowing for an incomplete concordance between light exposure and clock time for humans in real world environments, and allowing for a time delay between transcription and translation, our results are also in keeping with studies in Arvicanthis niloticus, a diurnal rodent, in which levels of PER1 and PER2 protein in the piriform cortex peak toward the end of the light period (Ramanathan et al., 2010). However, our results are in contrast to those seen in nocturnal rodents such as rats and mice, where neocortical PER1 and PER2 mRNA peak partway through the dark period and ARNTL1 mRNA peaks early in the light period (Rath et al., 2013; Yang et al., 2007). This concordance between our results and studies in diurnal species is to be expected given that humans are generally diurnal rather than nocturnal in behavior.
There is particular interest in confirming and characterizing the presence of a functioning extra-SCN oscillator in human cerebral cortex because of the observation that a number of neurological processes including cognition (Wright et al., 2012; Wyatt et al., 1999), soluble amyloid beta levels (Kang et al., 2009), and epilepsy (Loddenkemper et al., 2011; Zarowski et al., 2011) show time of day variation. If there are indeed oscillations within extra-SCN cortical cells, these may contribute to daily rhythms in cortically mediated processes. It will be of interest in future studies to examine whether nonclock genes relevant to human neurobiology (e.g., synaptic genes, ion channels, genes involved in amyloid biosynthesis and processing) also show time of day variation in expression levels in human cerebral cortex.
Several characteristics of human circadian behavior and rhythmicity appear to differ between men and women. Women are more likely than men to report a morning preference (Adan and Natale, 2002). Moreover, under entrained conditions, women have a relatively phase advanced temperature and melatonin rhythm compared with men (Cain et al., 2010). This is thought to be due in part to a shorter period of the intrinsic circadian timing system in women compared with men, as assessed by rhythms of core body temperature and melatonin in careful inpatient studies (Duffy et al., 2011). Thus far, studies examining sex differences in circadian behavior and rhythmicity have focused on physiological markers of underlying circadian rhythms without directly assessing expression levels of core components of the molecular clock. Meanwhile, studies examining clock gene expression in leukocytes and other tissues (Archer et al., 2008; Boivin et al., 2003; Hida et al., 2009; James et al., 2007; Kusanagi et al., 2008; Leibetseder et al., 2009; Pardini et al., 2005; Takimoto et al., 2005; Teboul et al., 2005) have generally not addressed the question of sex differences, likely because of small sample sizes. This study extends this previous work to show that previously reported sex differences in human circadian behavior and rhythmicity may reflect differences in the entrained phase of the core molecular clock, as directly reflected by sex differences in the time of day variation of clock gene transcripts in human cerebral cortex. In our data, the timing of PER2, PER3, and ARNTL1 expression was relatively advanced in women compared with men (Table 3, Models 1-3). The direction of effect is in keeping with the previous observations that women have a shorter intrinsic period and earlier phase angle of entrainment than men. However, the magnitude of the effect found in the present study is far greater. Whereas previous studies using physiological markers of phase in healthy subjects suggested that the phase of intrinsic circadian rhythmicity may be delayed by 0.5 to 1.5 h in men versus women (Cain et al., 2010), in our study using postmortem brain tissue, the estimated phase difference was 4 to 6 h. There are several possible reasons for this difference. First, because of the large variability inherent in postmortem brain tissue obtained from subjects with a range of medical comorbidities and environmental conditions at time of death, the 95% CIs for our estimates of sex difference in phase were sufficiently large to be compatible with previous estimates in the 0.5- to 1.5-h range. Second, this may reflect a difference between extra-SCN and SCN oscillators. The larger magnitude sex difference observed in the current study compared with prior studies may reflect a difference between the phase of the molecular clock and the phase of downstream physiological outputs such as melatonin secretion and temperature regulation or, potentially, may reflect differences in phase between the SCN and extra-SCN tissues. Furthermore, clock gene expression in our study reflected transcript abundance at the time of death. Immediately prior to death, some of the individuals in our study were likely institutionalized and/or living in settings without strong environmental or social periodicity, allowing the molecular rhythms to decouple from those environmental and social cues and free run. In such a situation, small sex differences in the period of the molecular clock could be exaggerated and result in a large sex difference in the timing of molecular rhythms proximate to death. By contrast, prior studies of sex differences in human physiological rhythms were conducted in healthy individuals who were living in environments with robust social and/or environmental cues.
Previous studies have suggested that dementia may be associated with changes in the timing of observed behavioral rhythms (Hu et al., 2009; Lim et al., 2012; Witting et al., 1990). However, it is not clear whether these changes reflect changes in the function of the molecular clock, changes in output pathways, or changes in environmental influences (e.g., social interactions). Indeed, one previous study reported significant rhythmicity of PER2 expression in human cingulate cortex from individuals with AD but not control subjects (Cermakian et al., 2011). In the present study, dementia was associated with a later timing of rhythms of PER3 expression but not of PER2 or ARNTL1. The direction of this effect is in keeping with previous literature suggesting that dementia is associated with a later timing of observed behavioral rhythms (Harper et al., 2004; Lim et al., 2012). However, the lack of a similar effect on the timing of PER2 or ARNTL1 expression suggests that this does not reflect an overall shift in the phase of the molecular clock as a whole. In this study, dementia was not associated with significantly decreased amplitude of the daily rhythms of PER2, PER3, or ARNTL1. There are at least 2 possible interpretations for this finding. First, subtle differences may have been difficult to detect due to the high variance inherent in postmortem human brain studies, suggesting that larger studies will be needed. Second, the rhythmicity of the core molecular clock may be relatively preserved in dementia, and the observed deterioration of behavioral rhythms, at least in mild to moderate dementia, may be due to dysfunction of output pathways (e.g., motor pathways) or alterations in social interactions or environmental factors. This is in keeping with a previous study showing relative preservation of cortisol rhythms in moderate AD despite observed changes in behavioral rhythmicity (Hatfield et al., 2004).
Light exposure is an important circadian time cue, and the timing of light exposure can have important effects on circadian phase. The timing of natural light exposure relative to local clock time depends in part on season and on the local use of daylight savings time versus standard time (during daylight savings time in North America, local clock time is delayed by 1 h compared with during standard time, and hence natural light exposure occurs 1 h earlier relative to clock time). In this study, summer was associated with a later peak of PER3 expression than winter, but this effect was not seen for PER2 or ARNTL1 and season was not associated with differences in the amplitude of daily rhythms of PER2, PER3, and ARNTL1. Moreover, daylight savings time also had no effect on the timing of daily rhythms of PER2, PER3, and ARNTL1. There are several possible explanations for this lack of effect. First, because many individuals are apt to spend much of their time indoors in the days leading up to death, the timing of natural light exposure may be a relatively unimportant determinant of circadian phase. Second, our study would likely not have had the power to detect relatively small effects (for instance, the ~1-h effect that a switch from daylight savings to standard time may be expected to create). Finally, it may be that season is in fact not an important determinant of human circadian phase in general. Indeed, at least one other study has reported that season appears to have little effect on the phase of the endogenous circadian pacemaker studied under conditions of constant routine (Van Dongen et al., 1998).
There are several limitations to the current study. First, no information was available about sleep-wake behavior or environmental light-dark conditions proximate to death, and therefore we cannot know to what extent the observed time of day variation in gene expression and the sex differences in the timing of this variation were due to environmental (e.g., light exposure) or behavioral (e.g., sleep vs. wake, activity vs. inactivity) factors rather than intrinsic circadian factors. Also, the diversity of geographic locations from which study participants were drawn made it impractical to model the effects of differing clock times of sunrise and sunset due to differences in longitude relative to time zone boundaries. Furthermore, information about cause of death was not available. Therefore, we cannot exclude the possibility that our results may have been confounded by differential causes of death at different times of day. In addition, rhythms of gene expression were assessed only in the cerebral cortex and not in the SCN, and so we cannot comment about the phase relationships of these two oscillators. Finally, because our analyses are based on a single time point from each subject, rather than repeated measurements in each subject over several days, this study design can only examine group average time of day variation in clock gene expression rather than circadian rhythmicity per se. However, an experiment to rigorously establish circadian rhythms of clock gene expression in human cerebral cortex would require repeated sampling of cerebral cortical tissue over time in the same individual, which is not feasible.
This study also has several strengths. Because all participants were organ donors, time of death was very accurately ascertained, and the postmortem interval was short. Although deaths were slightly more common in the morning than at other times of day, at least some deaths occurred at all clock times across 24-h cycle, allowing for good estimates of average gene expression at all circadian times. The large number of subjects provided power to detect time of day variation as well as power to examine the effect of clinical and demographic factors. Finally, this study directly assessed the molecular clock itself and not a physiological marker of the clock.
Footnotes
Acknowledgements
The authors thank the participants in the Rush Memory and Aging Project and Religious Orders Study and their families. They also thank Dr. Matthew Kowgier for his valuable input. This study was supported in part by NIH grants R01AG17917, P30AG10161, R01AG24480, R01NS078009, R01AG15819, R01AG30146, R01AG034504, R01AG036836, the Illinois Department of Public Health, and the Robert C. Borwell Endowment Fund.
Conflict of Interest Statement
The author(s) declared no potential conflicts of interest with respect to the research, authorship, and/or publication of this article.
References
Supplementary Material
Please find the following supplemental material available below.
For Open Access articles published under a Creative Commons License, all supplemental material carries the same license as the article it is associated with.
For non-Open Access articles published, all supplemental material carries a non-exclusive license, and permission requests for re-use of supplemental material or any part of supplemental material shall be sent directly to the copyright owner as specified in the copyright notice associated with the article.