
Abstract
Although type 2 diabetes (T2DM) and depression are associated with disturbances in circadian rhythms, most studies of these diseases use nocturnal mice and rats while modeling diurnal humans. We suggest that the development of T2DM and depression are related to changes that accompany the switch from the mammalian ancestral nocturnal activity to the current diurnal one. We show that diurnal sand rats (Psammomys obesus) held outdoors in laboratory cages (where they are exposed to natural environmental conditions) and fed a standard rodent diet do not develop T2DM in contrast to animals held indoors (where the only cycling environmental condition is light) fed the same diet. Moreover, keeping sand rats under a short photoperiod dampened behavioral and molecular daily rhythms, resulted in anxiety- and depressive-like behavior, and accelerated the development of T2DM. We suggest that the disturbed rhythms disrupt the internal temporal order and metabolic pathways controlled by feeding and the circadian system, resulting in the development of T2DM and depressive-like behavior. We further suggest that using nocturnal mice and rats as sole model animals may limit research, especially when studying circadian rhythm-related diseases.
It is widely accepted that disturbances in circadian rhythms in humans are associated with numerous diseases, including type 2 diabetes (T2DM) and depression (Javeed and Matveyenko, 2018; Takahashi et al., 2008), which demonstrate high comorbidity. Nevertheless, these diseases are usually studied using nocturnal mice and rats as models. We suggest that the development of T2DM and depression are related to changes accompanying the switch from the mammalian ancestral nocturnal activity pattern to the current diurnal one. It has been repeatedly described that removing different diurnal rodent species from their natural habitat and introducing them into laboratory-controlled conditions can lead to dramatic changes in their activity patterns (Hut, 2012; Kronfeld-Schor and Dayan, 2008). For example, when sand rats (Psammomys obesus, diurnal gerbils) are transferred from the field to the laboratory, they reverse their activity pattern to nocturnal, and when kept in the laboratory under a 12:12 LD cycle they demonstrate an unstable, nocturnal phase preference, with low amplitude and, in some cases, no rhythm at all (Barak and Kronfeld-Schor, 2013). Similar findings have been reported for several other diurnal species (Table 1). In fact, almost all diurnal rodents tested to date switch their activity pattern to nocturnal or lose rhythmicity under laboratory conditions. Furthermore, all of them show some form of rhythm instability, and their activity is not completely confined to one phase (Blanchong et al., 1999; Cohen and Kronfeld-Schor, 2006; Hagenauer and Lee, 2008; Tomotani et al., 2012; Umezu et al., 1989). Such a response to laboratory conditions has not been documented in nocturnal rodents (e.g., Barak and Kronfeld-Schor, 2013; Weber and Hohn, 2005).
Diurnal rodents that lose their activity patterns or switch from diurnal to nocturnal activity develop depressive-like behavior and type 2 diabetes under laboratory conditions.
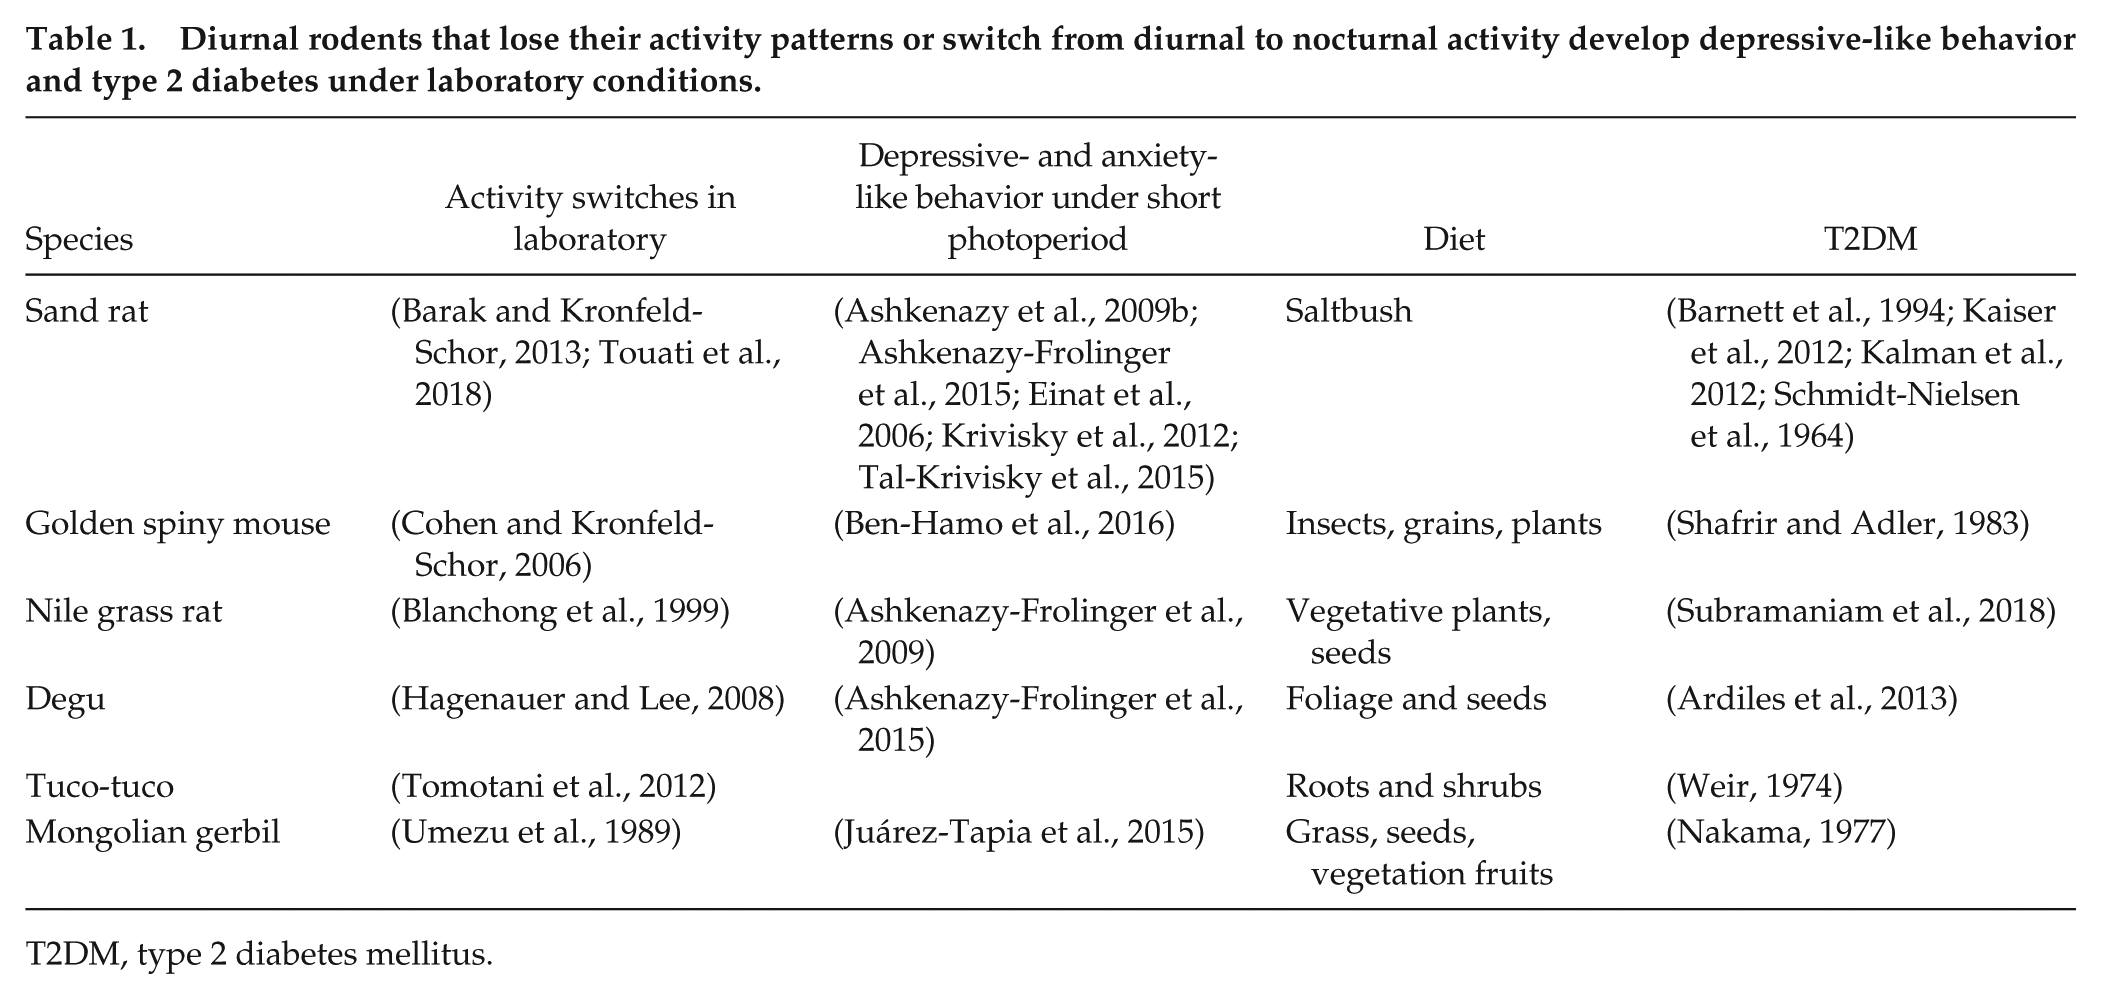
T2DM, type 2 diabetes mellitus.
We and others have previously shown that diurnal rodents acclimatized to a short photoperiod (SP, 5:19 LD conditions) demonstrate a further reduction in daily rhythm amplitude and stability (Tal-Krivisky et al., 2015) and express a depressive- and anxiety-like phenotype compared to controls acclimatized to a neutral photoperiod (NP, 12:12 LD conditions) (Table 1, reviewed by Bilu et al., 2016). In contrast, 3 different strains of nocturnal laboratory mice did not display any clear behavioral changes when maintained under a short, neutral, or reversed (19:5 LD; Flaisher-Grinberg et al., 2011) photoperiods, demonstrating that diurnal rodents are not simply a mirror image of nocturnal rodents (Bilu et al., 2016). Moreover, we have shown that bright-light treatment (Ashkenazy et al., 2009a; Krivisky et al., 2012) and voluntary wheel running (Tal-Krivisky et al., 2015), which increase rhythm amplitude and enhance daily rhythms, also ameliorate the depressive- and anxiety-like behavior.
The diurnal sand rat is an accepted and extensively studied model for diet-induced T2DM (Barnett et al., 1994; Kaiser et al., 2012; Kalman et al., 2012; Schmidt-Nielsen et al., 1964). In their natural habitat, sand rats feed mainly on the low-calorie salt bush (Atriplex halimus) and are not hyperglycemic (Kaiser et al., 2012). However, in the laboratory, when fed a standard rodent diet, many exhibit a tendency to develop T2DM. This is characterized by enhanced insulin secretion and insulin resistance in the early stages and insulin deficiency at an advanced stage. Normoglycemia can be obtained by limiting caloric intake or by feeding the sand rats a low-energy diet (Barnett et al., 1994; Kalman et al., 2012).
However, when animals are brought to the laboratory, their diet is not the only variable that changes. As we have previously shown, sand rats transferred to laboratory conditions also show a reduction in the amplitude and stability of their daily rhythms, with many individuals becoming nocturnal or showing no rhythm at all (Barak and Kronfeld-Schor, 2013; Bilu and Kronfeld-Schor, 2013; Tal-Krivisky et al., 2015). Such changes in circadian rhythms are expected to be associated with metabolic dysfunction. Consequently, in the current study, we hypothesized that this alteration in daily rhythms may constitute the basis for the increased susceptibility of sand rats to T2DM.
To directly test the hypothesis that circadian rhythms play a role in the development of T2DM in sand rats, we conducted 3 experiments. In the first, we kept sand rats either outdoors or indoors in similar cages under a similar photoperiod, provided them with standard laboratory diet, and examined whether they developed glucose intolerance. We predicted that animals held indoors (where they become nocturnal or arrhythmic) but not animals held outdoors (which we expected would be diurnal) would develop T2DM. In the second and third experiments, we conducted 2×2 experiments with photoperiod (5:19 vs. 12:12 LD cycle) and diet (standard rodent diet vs. special low-energy diet) as the main factors. In the second experiment, we studied the long-term effects of these conditions on the development of T2DM, and in the third experiment, we examined the possible involvement of the central and peripheral clocks in the development of T2DM in this species. Based on the results of the effect of photoperiod on activity rhythms and depressive- and anxiety-like behavior in sand rats, we predicted that a short photoperiod, which leads to a low rhythm amplitude and stability, would accelerate the development of T2DM.
Research Design and Methods
General Methods
We performed 3 experiments on HsdHu diabetes-prone male sand rats (Psammomys obesus, 6 to 7 months old, from our colony at Tel Aviv University Zoological Research Garden). All animals were individually housed in standard plastic cages (42×26×15 cm). Before the onset of the experiments, all animals were maintained on a low-energy diet (product 1078, Koffolk Ltd, Israel) to prevent diabetes. All animals were weighed and tested for glucose tolerance before the start of the experiment. Animals were assigned to the experimental groups based on weight and blood glucose levels to avoid a baseline bias. Body weight was measured weekly during the experiments. In-cage activity was monitored throughout the experiments using IR motion detectors (Orev Ltd., Israel). Every 2 weeks, the animals were fasted for 4 h during the light period and blood samples were collected to measure circulating glucose (U-Right glucometer TD -4269, TaiDoc, New Taipei City, Taiwan). Glucose tolerance tests were performed at zeitgeber time 2 (ZT2, ZT0: the time of lights-on) by administering 2 g glucose/kg body weight using gastric gavages (a syringe attached to a 20-gauge × 1.5 feeding needle) inserted through the mouth into the stomach. All experimental procedures followed the NIH guidelines for the care and use of laboratory animals and were approved by the Institutional Animal Care and Use Committee (IACUC) of Tel Aviv University (permit number L15055).
Experiment 1: Comparing animals housed indoors or outdoors
Fifty adult male sand rats were used in this experiment. Thirty animals were kept indoors in temperature- and light- controlled rooms (25°C), while an additional 20 animals were individually housed in the same cages but kept outdoors inside a predator-protected and shaded enclosure. All sand rats were fed a standard rodent diet (product 2018, Koffolk, Israel). Because we had predicted that animals kept indoors would become diabetic and possibly die, we started with a larger group for the rats kept indoors. Lights-on time indoors was adjusted every 3 days to match the natural daylight cycle outdoors, so that on the first week of the experiment, the day length for both groups was 10 h and 40 min and, on the last week, it was 12 h and 39 min.
Glucose tolerance tests were performed on all animals on week 8 of the experiment. Food intake during the light and dark hours was measured on week 9 by giving the animals a measured amount of food at sunrise and sunset, and collecting and weighing the leftovers at sunset and sunrise respectively, for 48 hours. Only data for the second day and night were used in the analysis.
Experiment 2: Photoperiod × diet interaction (24 weeks)
This experiment was structured in a 2×2 design, with day length (SP, 5:19; NP, 12:12 LD) and diet (standard rodent diet, product 2018, vs. special low-energy diet, product 1078, Koffolk Ltd, Israel) as variables. Forty-eight male sand rats were used (n = 12 per group). Glucose tolerance tests were performed on week 20. Behavioral tests for anxiety- and depressive-like behavior (including the elevated plus maze and forced swim test [FST]) were conducted on weeks 21 and 22 (with one-week interval between tests). On week 23, we measured tail cuff systolic blood pressure using an electrosphygmomanometer and pneumatic pulse transducer (58500 BP Recorder; UGO BASILE, Varese, Italy). After 24 weeks under these conditions, the sand rats were anesthetized, and their hearts excised and weighed.
Experiment 3: Photoperiod × diet interaction (10 weeks)
We repeated the conditions of experiment 2 described above. Ninety-six adult male sand rats were used (n = 24/group). Glucose tolerance tests were performed on week 8. The animals’ eyes were examined every 2 weeks for the presence of cataracts (a common complication of T2DM). On week 10, sand rats were euthanized at 4 different time points (at 6-h intervals; ZT2, 8, 14, 20, [ZT 0 = lights on]; n=6 for each time point in each group), and we collected blood, SCN, kidney, and liver. All tissues were snap-frozen for the analysis of Per2 expression levels in SCN, kidney, and liver using RT-PCR. Blood was used for measuring plasma glucose and insulin levels. Blood samples from 10 animals from each treatment were assayed for insulin.
RNA extraction and RT-PCR
Total RNA was isolated from brain, liver, and kidney tissue using the QIAGEN RNeasy Mini Kit (Qiagen, CA, USA) according to the manufacturer’s instructions. RNA levels were determined by the absorbance at 260 nm.
The relative expression of Actin and Per2- mRNA was assessed by RT-PCR using equal levels of cDNA (0.5 mg for the brain sample). Reverse transcription (42°C for 30 min) and PCR (35 cycles consisting of denaturation at 95°C for 1 min, annealing at 64°C for 1 min and synthesis at 72°C for 1 min) were performed for Per2 and Actin. The following primer sequences were used: Per2: f- tcactcaggagtgcatggag, r- tggtgtttcccaacactgac; Actin: f- atgcctgggtacatggtggt, r- cacggacctctacgccaa. Primers were purchased from Sigma-Aldrich (Israel). Comparison between 2 photoperiod groups was performed using the same levels of total RNA at all ZT points, and with the same sampling procedures. Results were normalized to Actin.
Plasma insulin ELISA
Plasma insulin protein was assayed with an immunoassay ELISA kit (Rat Insulin Ultrasensitive, ALPCO, Salem, NH).
Elevated Plus-Maze (EPM)
A black aluminum EPM was used, as described previously (Ashkenazy et al., 2009b; Einat et al., 2006).
Forced-Swim Test (FST)
The FST is commonly used to evaluate depressive-like behavior and to assess antidepressant effects in rats and mice. With some methodological changes, this test has also been used in sand rats (Ashkenazy et al., 2009a; Ashkenazy et al., 2009b; Ashkenazy-Frolinger et al., 2009; Ashkenazy-Frolinger et al., 2015; Einat et al., 2006; Einat and Kronfeld-Schor, 2009; Krivisky et al., 2011; Tal-Krivisky et al., 2015). Each animal was subjected to the FST apparatus twice over 2 consecutive days, and the second exposure was considered the test session. Testing began 1 h after the onset of light and ended within the light period in the colony rooms. Each animal was placed individually into a white opaque cylinder (30 cm in diameter and 45 cm high) that was filled with water (22°C to 23°C) to a depth of 25 cm. The test was digitally recorded from above for later manual scoring of behavior. As noted in previous work with sand rats, their ability to float in the water is lower than that of rats or mice and, therefore, the standard measure of floating time in the FST is replaced with measures of “time to sink” (Ashkenazy et al., 2009a; Ashkenazy et al., 2009b; Einat et al., 2006; Krivisky et al., 2011). When a sand rat is placed in the cylinder, it first attempts to actively swim and struggle, but at some point, it stops and sinks into the water. The rat will immediately start swimming again and surface but, at some point, it will stop and sink again. Uninterrupted, this cycle will continue until the animal is unable to sustain itself above water. Based on previous work, the established FST measures for the sand rats’ FST, reflecting depression-like behavior, are “time to first sink” and “time to second sink”, where a sink event is defined by the animal going entirely under water for approximately 2 sec. Accordingly, immediately following the second sink, the sand rat is taken out of the water by the experimenter and placed in its home cage and the test is terminated. Water was replaced in the cylinder for every test. Recordings were used to time the sink events by an experimenter blind to treatments.
Data analysis
Statistical analysis was performed using Statistica 13.2 (Dell, Tulsa, OK). Mixed ANOVA was used to analyze data from all experiments followed by LSD post-hoc tests when needed. For experiment 1, ANOVA included housing conditions as the main factor with 2 levels: indoors or outdoors; and time was defined as a repeated measures factor. For experiments 2 and 3, photoperiod and diet were the main factors (short or neutral for photoperiod and regular or low calories for diet), and time was the repeated measures factor. Additional specific methods for statistical analysis for unique measures are detailed in the Results section. Actograms were generated using CTools 7.0 by van der Veen.
Results
Experiment 1: Comparing animals housed outdoors and indoors
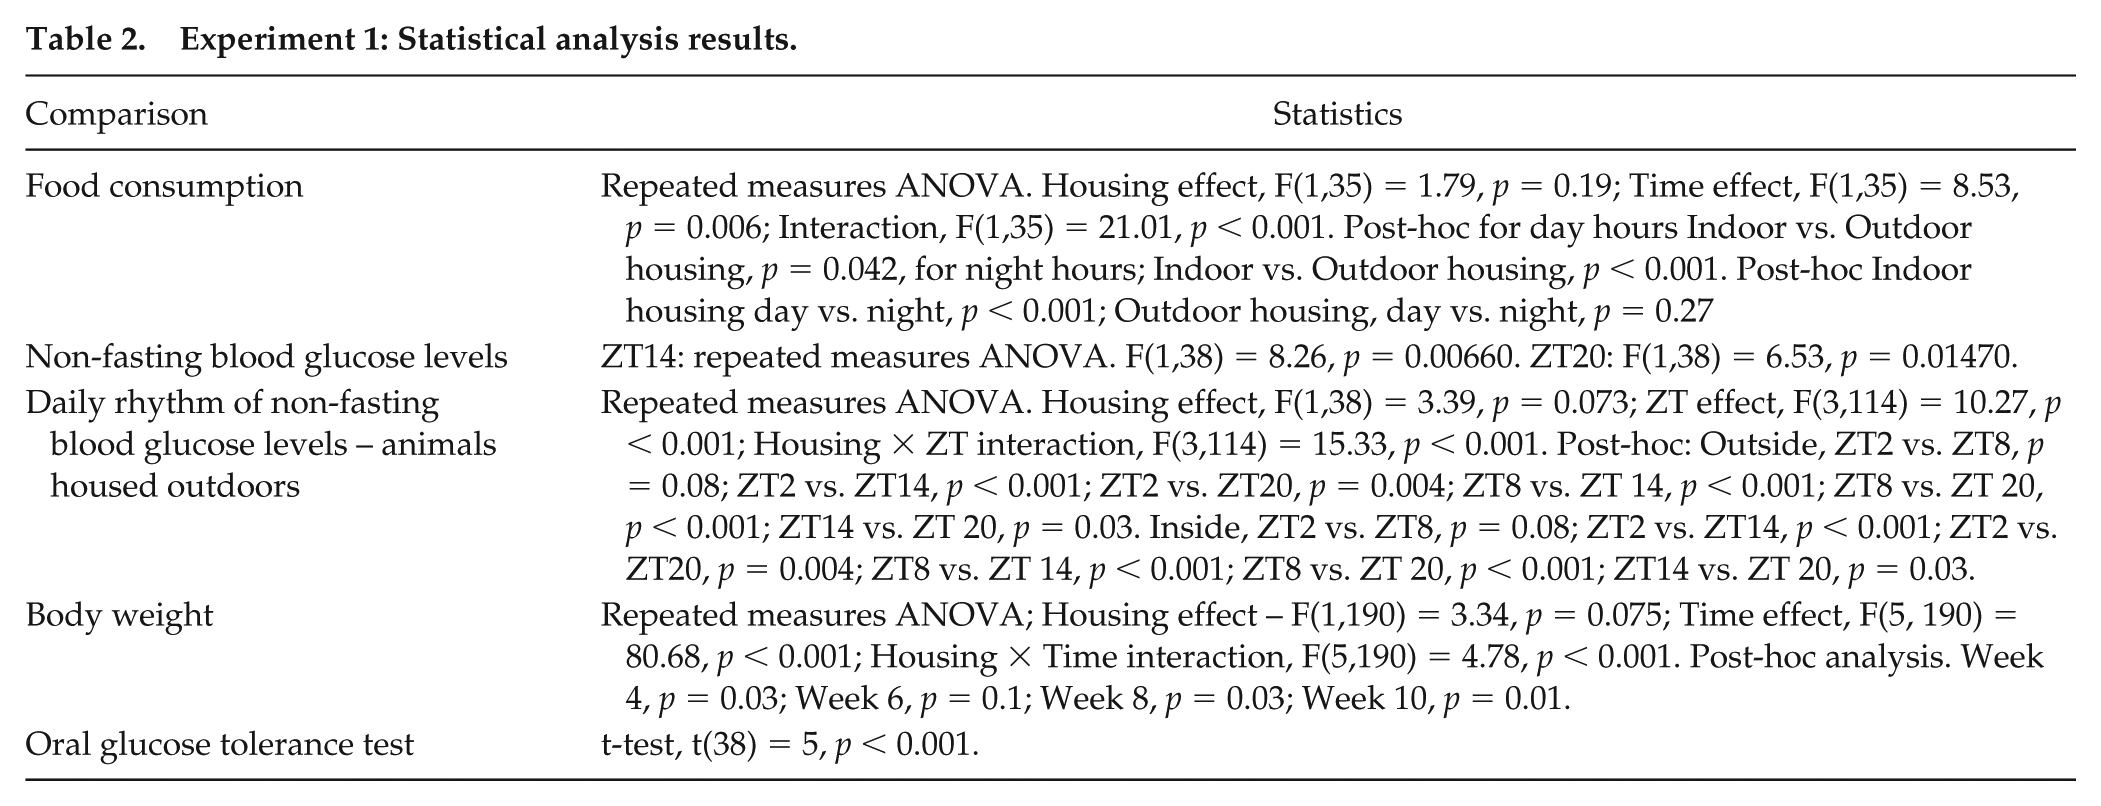
During the experiment, the outdoor ambient temperature ranged from 8.3°C to 33.4°C (Supplementary Figure 5) and solar radiation ranged from 0 to 551 W/m2 (Supplementary Figure 6). Animals held outdoors were diurnal, whereas animals held indoors became arrhythmic or nocturnal, with dampened rhythm (Figure 1A, B, see legends for individual measures). Accordingly, animals held outdoors consumed more food during the day and less during the night than animals kept indoors [see Table 2 for statistical analysis]; whereas animals held indoors consumed most of their food during the night [Figure 1C, see Table 2 for statistical analysis]. There was no difference, however, in food consumption between day and night for animals housed outdoors [see Table 2 for statistical analysis]. Sand rats housed indoors had significantly higher non-fasting blood glucose levels compared with those housed outdoors at ZT14 and at ZT20 (see Table 2 for statistical analysis).
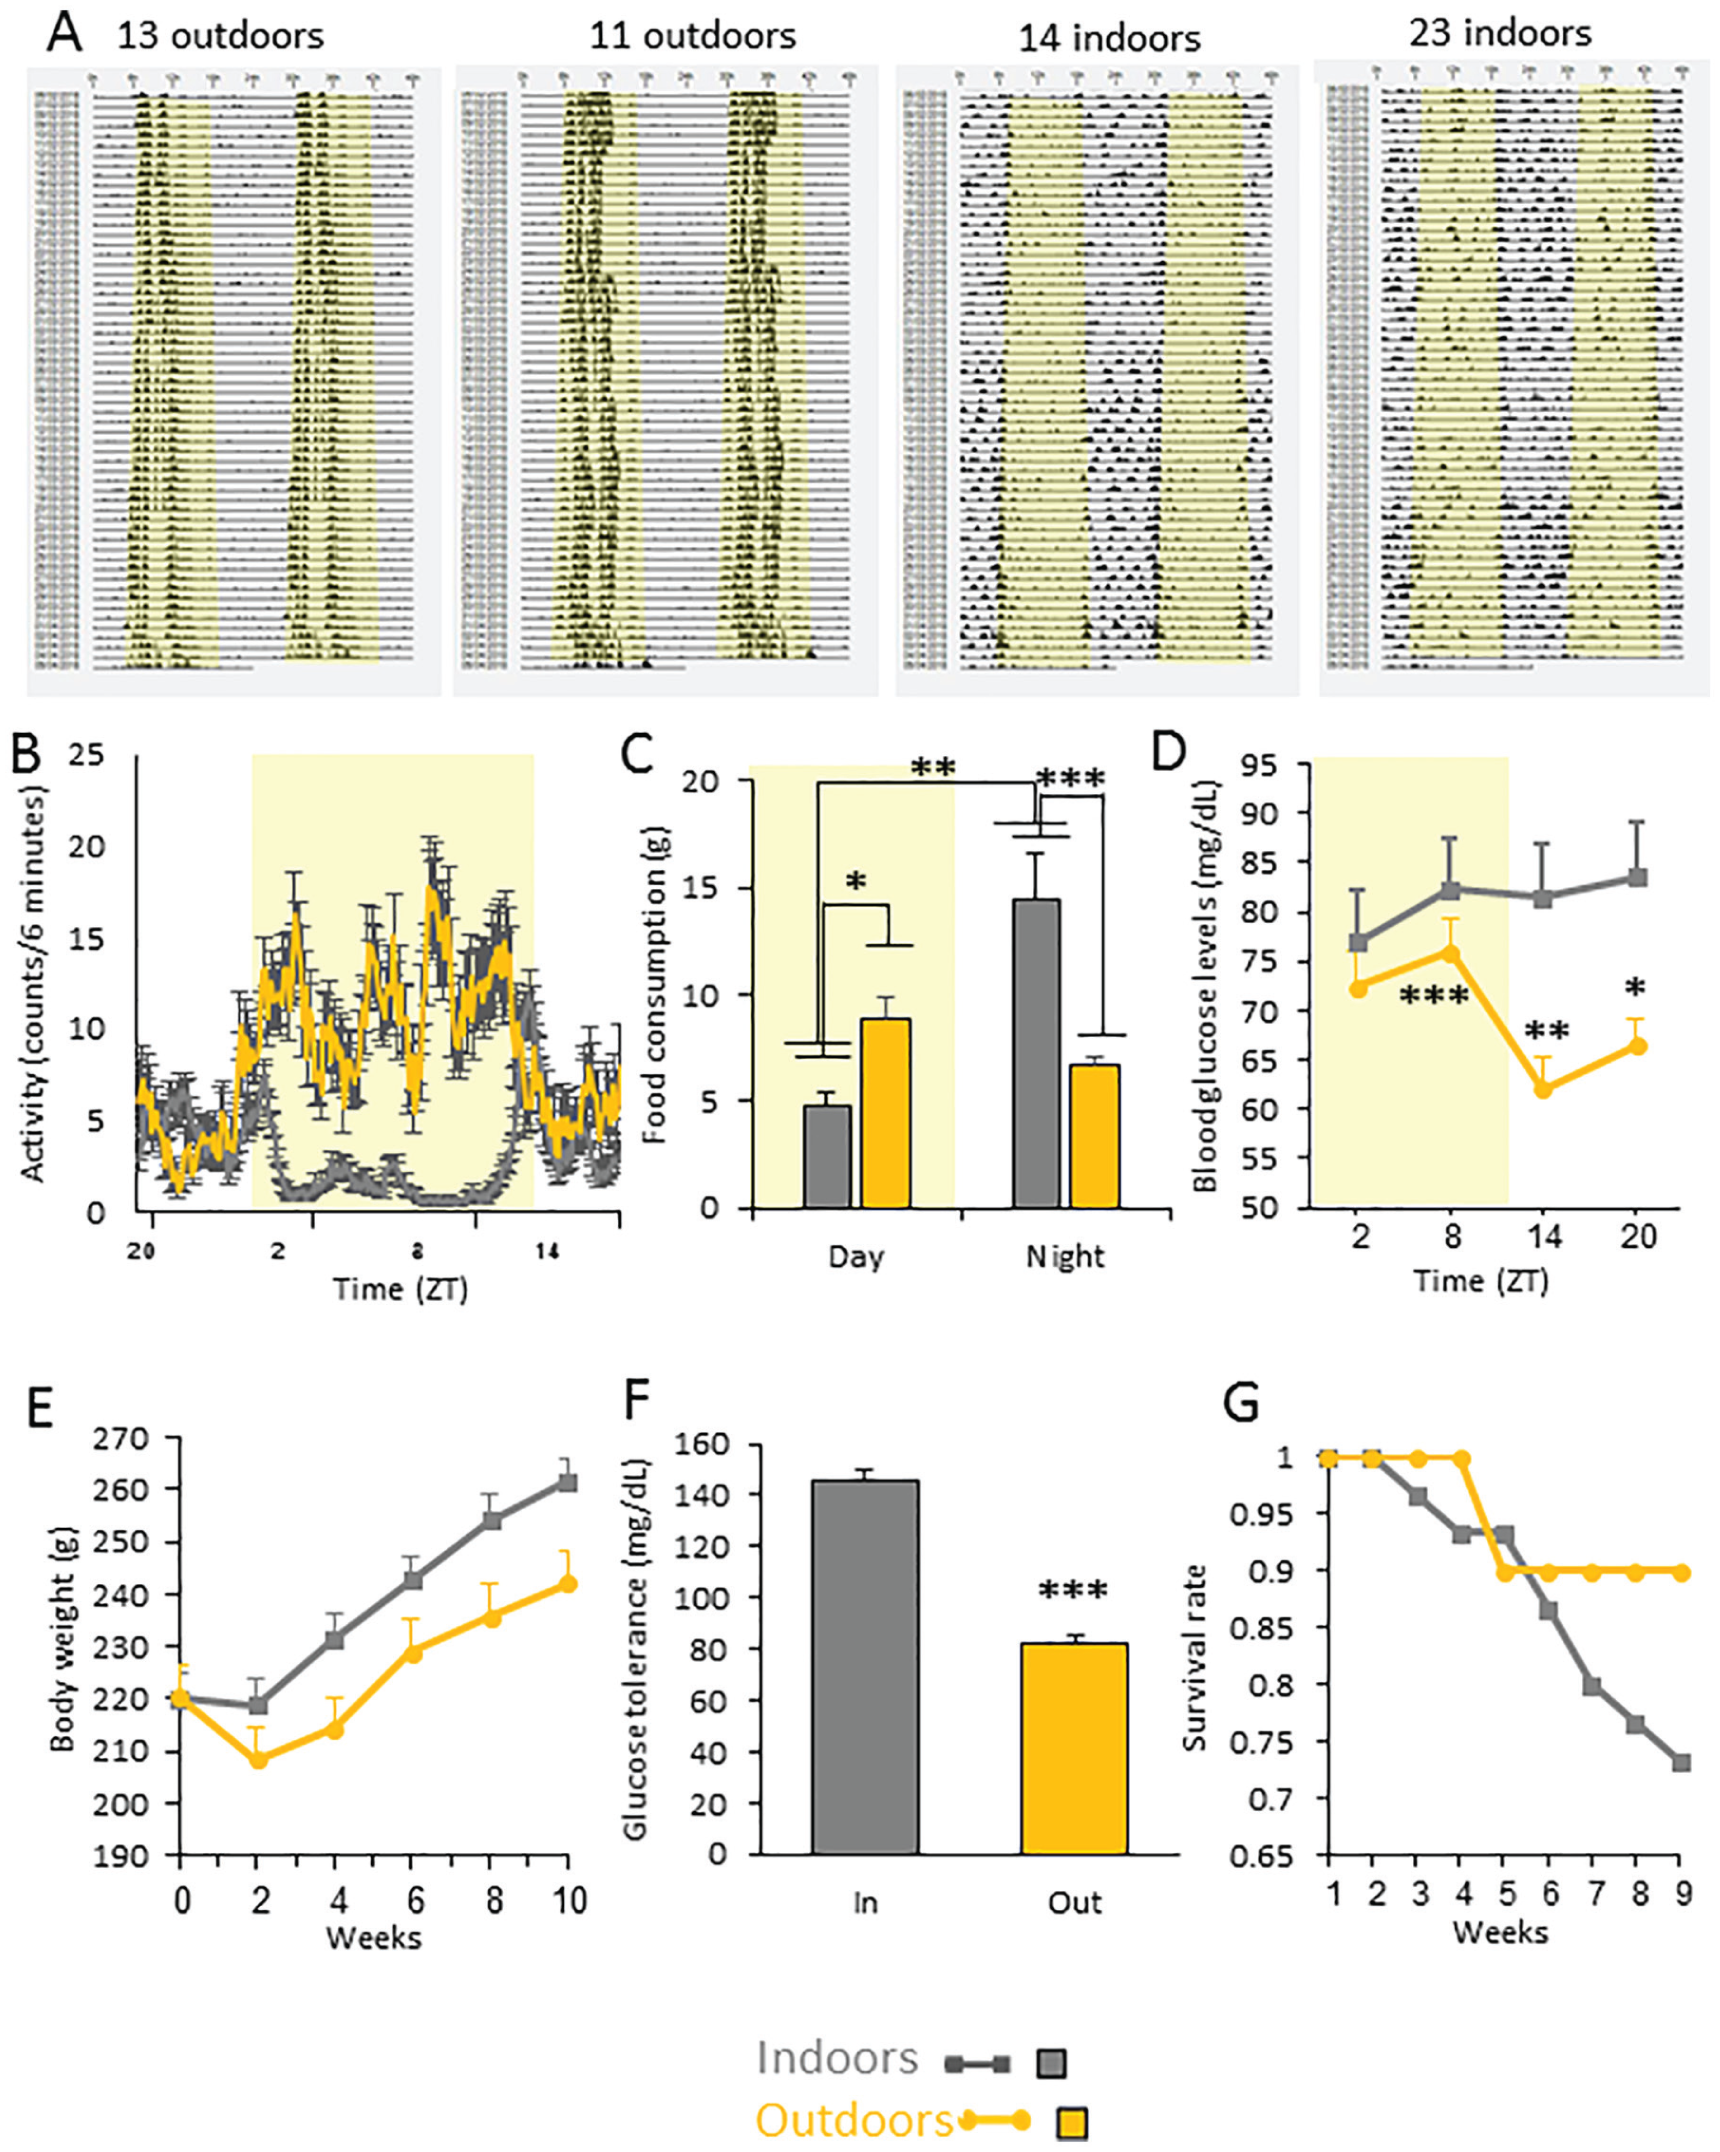
Comparison of sand rats housed indoors (grey in all figures) and outdoors (orange in all figures) from January to April, in laboratory cages under a similar photoperiod and fed a standard rodent diet. Yellow background represents light hours. (A) Representative double-daily plotted actograms of 2 sand rats (IDs 11, 13) held outdoors and 2 sand rats (IDs 14, 23) held indoors. Each row represents 2 consecutive days, depicted one below the other. (B) Activity rhythm: Data are the mean ± SEM of group daily activity rhythm of animals held indoors or outdoors during the last week of the experiment. (C) Food consumption: Sand rats kept outdoors consumed more food during the day and less during the night than animals kept indoors; animals kept indoors consumed most of their food during the night. (D) Twenty-four-hour glucose rhythm: Sand rats housed indoors had significantly higher non-fasting blood glucose levels compared with those housed outdoors at ZT14 and at ZT 20. Non-fasting blood glucose levels of animals housed outdoors showed a significant daily rhythm: glucose levels at ZT8 significantly differ from glucose levels at ZT14. Blood glucose levels of sand rats housed indoors showed no significant differences among the 4 ZTs. (E) Body weight: animals housed indoors gained significantly more weight than those housed outdoors. Data are the mean ± SEM (p < 0.01). (F) Blood glucose levels (mg/dL) in the oral glucose tolerance test: Sand rats housed indoors had significantly higher blood glucose levels measured 120-min post-glucose administration compared with those housed outdoors. (G) Cumulative proportion of surviving individuals: only 2 sand rats died in the outdoor group, whereas 13/30 animals died in the indoor group. *p > 0.05, **p < 0.01, ***p > 0.001.
Experiment 1: Statistical analysis results.
The daily rhythm of non-fasting glucose differed between animals housed indoors and outdoors. Whereas there was a significant difference across ZTs in both groups, peak time differed between groups, and the animals housed outdoors showed a more robust daily rhythm (Figure 1D; see statistical analysis in Table 2).
Animals housed indoors gained significantly more weight compared with those housed outdoors, with the difference becoming significant at the 4-week measurement (Figure 1E, See Table 2 for statistical analysis). Animals housed indoors had significantly higher blood glucose levels measured 120-min post-glucose administration, as compared with those housed outdoors (Figure 1F, see Table 2 for statistical analysis) and, accordingly, had lower survival rates (only 2 animals died outdoors, whereas 13 died indoors, Figure 1G). There was no significant difference between groups in terms of heart mass (data not shown).
Experiment 2: Photoperiod × diet interaction (24 weeks)
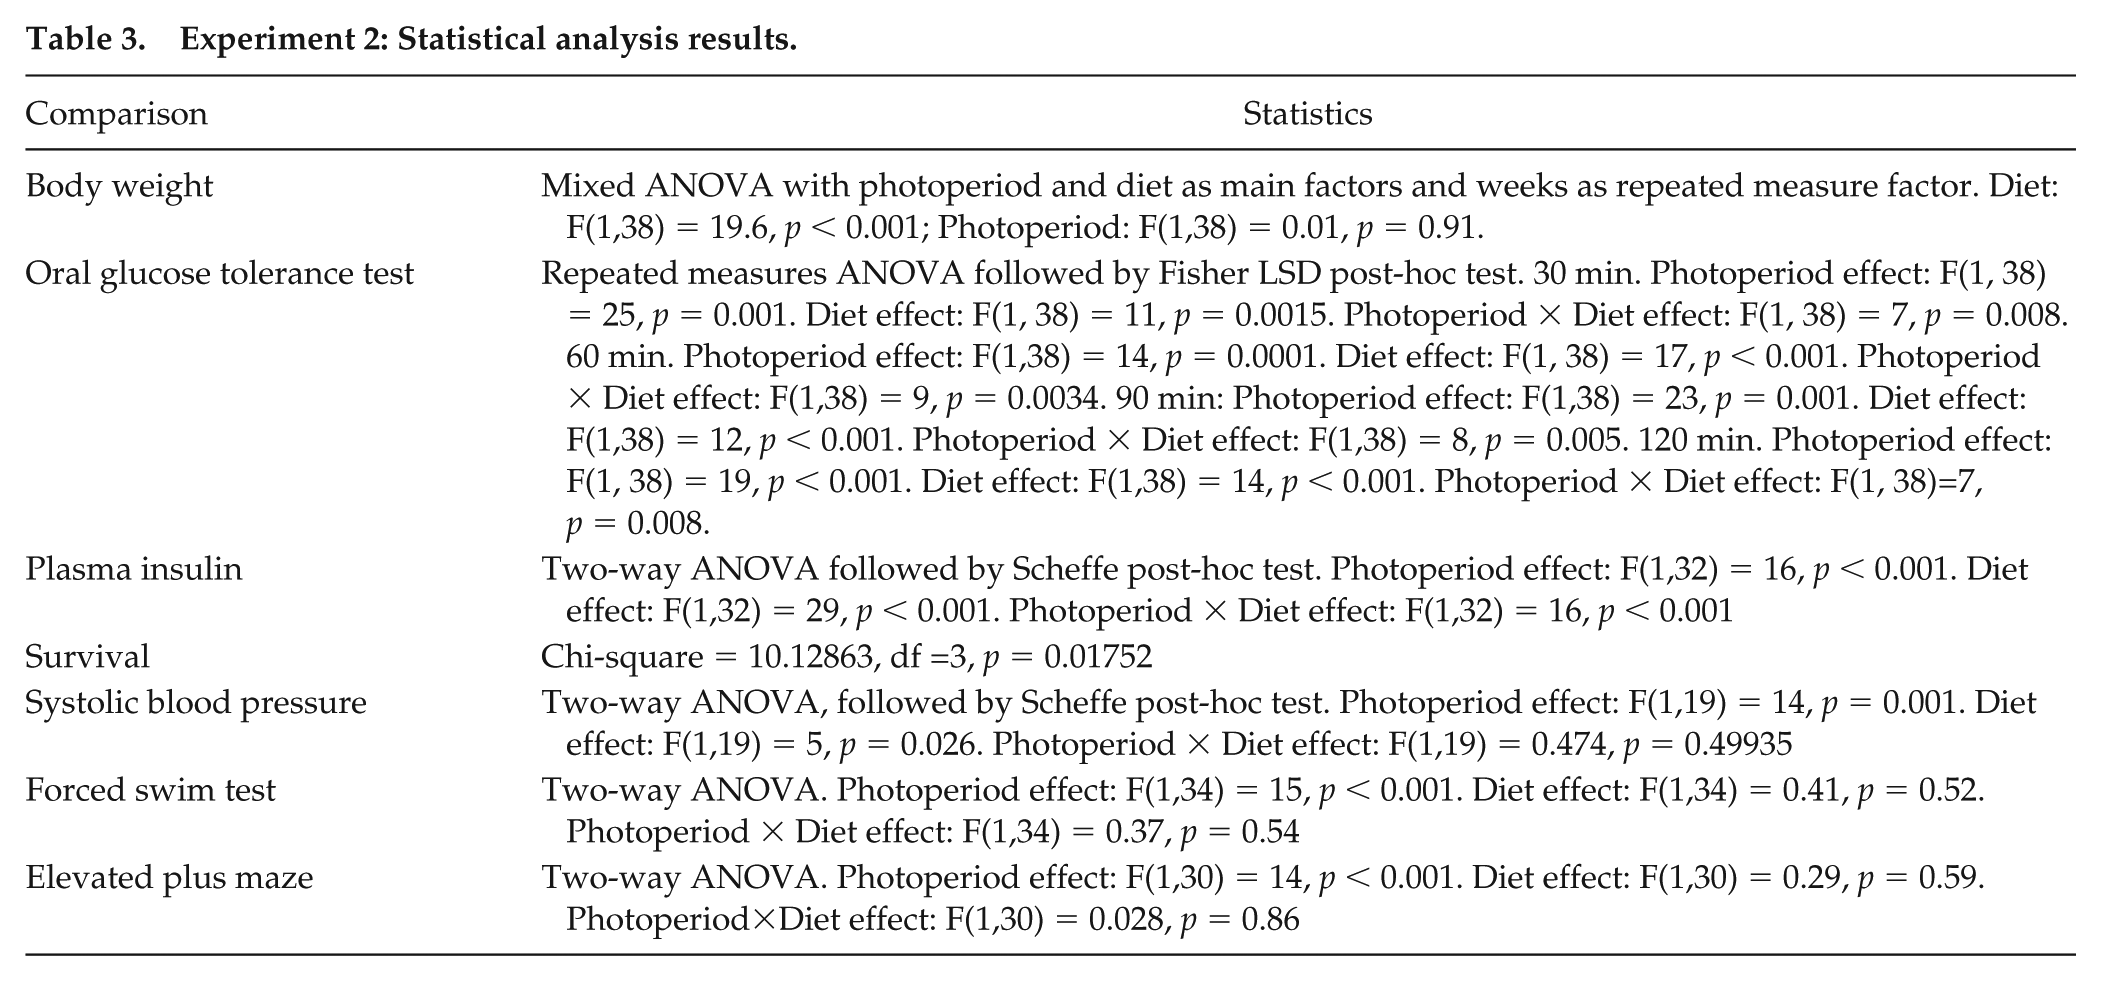
In this experiment, all animals were nocturnal or arrhythmic. More animals kept under a short-photoperiod were arrhythmic or had a dampened activity rhythm as compared with animals kept under neutral photoperiod (Figure 2A, B, C). From week 6 onward, animals fed a standard rodent diet were significantly heavier than those fed the low-energy diet, whereas the photoperiod had no significant effect (Figure 2D, see Table 3 for statistical analysis). In the oral glucose tolerance test conducted on week 20, animals kept under a short photoperiod and fed a standard rodent diet (SR) had significantly higher blood glucose levels as compared with all other groups (at 30, 60, 90, and 120 min post-glucose administration; Figure 2E, see Table 3 for statistical analysis). In the neutral photoperiod with standard rodent diet (NR) group, 1 of the 9 sand rats became glucose intolerant, whereas in the SR group, 5 of the 9 surviving rats became glucose intolerant (Figure 2F). On average, rats in the SR group had higher insulin levels than those in all other groups (Figure 2G, see Table 3 for statistical analyses) but those with relatively low insulin levels and low glucose tolerance had already developed insulin deficiency (Figure 2F). The 2 rats that were normoinsulinemic-hyperglycemic died within 4 weeks, and another rat from this group that was hyperinsulinemic-normogycemic died within 8 weeks. In total, during the experiment, sand rats fed the low-energy diet demonstrated significantly higher survival rates than those fed the standard rodent diet (12/12 for both neutral (NL) and short photoperiod with low-energy diet (SL) groups; 7/12 for NR; and 6/12 for SR) (Figure 2H, see Table 3 for statistical analyses). Both diet and photoperiod had a significant effect on systolic blood pressure measured on week 22: Animals kept under a short photoperiod had significantly higher systolic blood pressure compared with those held under a long photoperiod; and animals fed a low-energy diet had significantly higher blood pressure than those fed a standard rodent diet (Figure 2I, see Table 3 for statistical analyses).
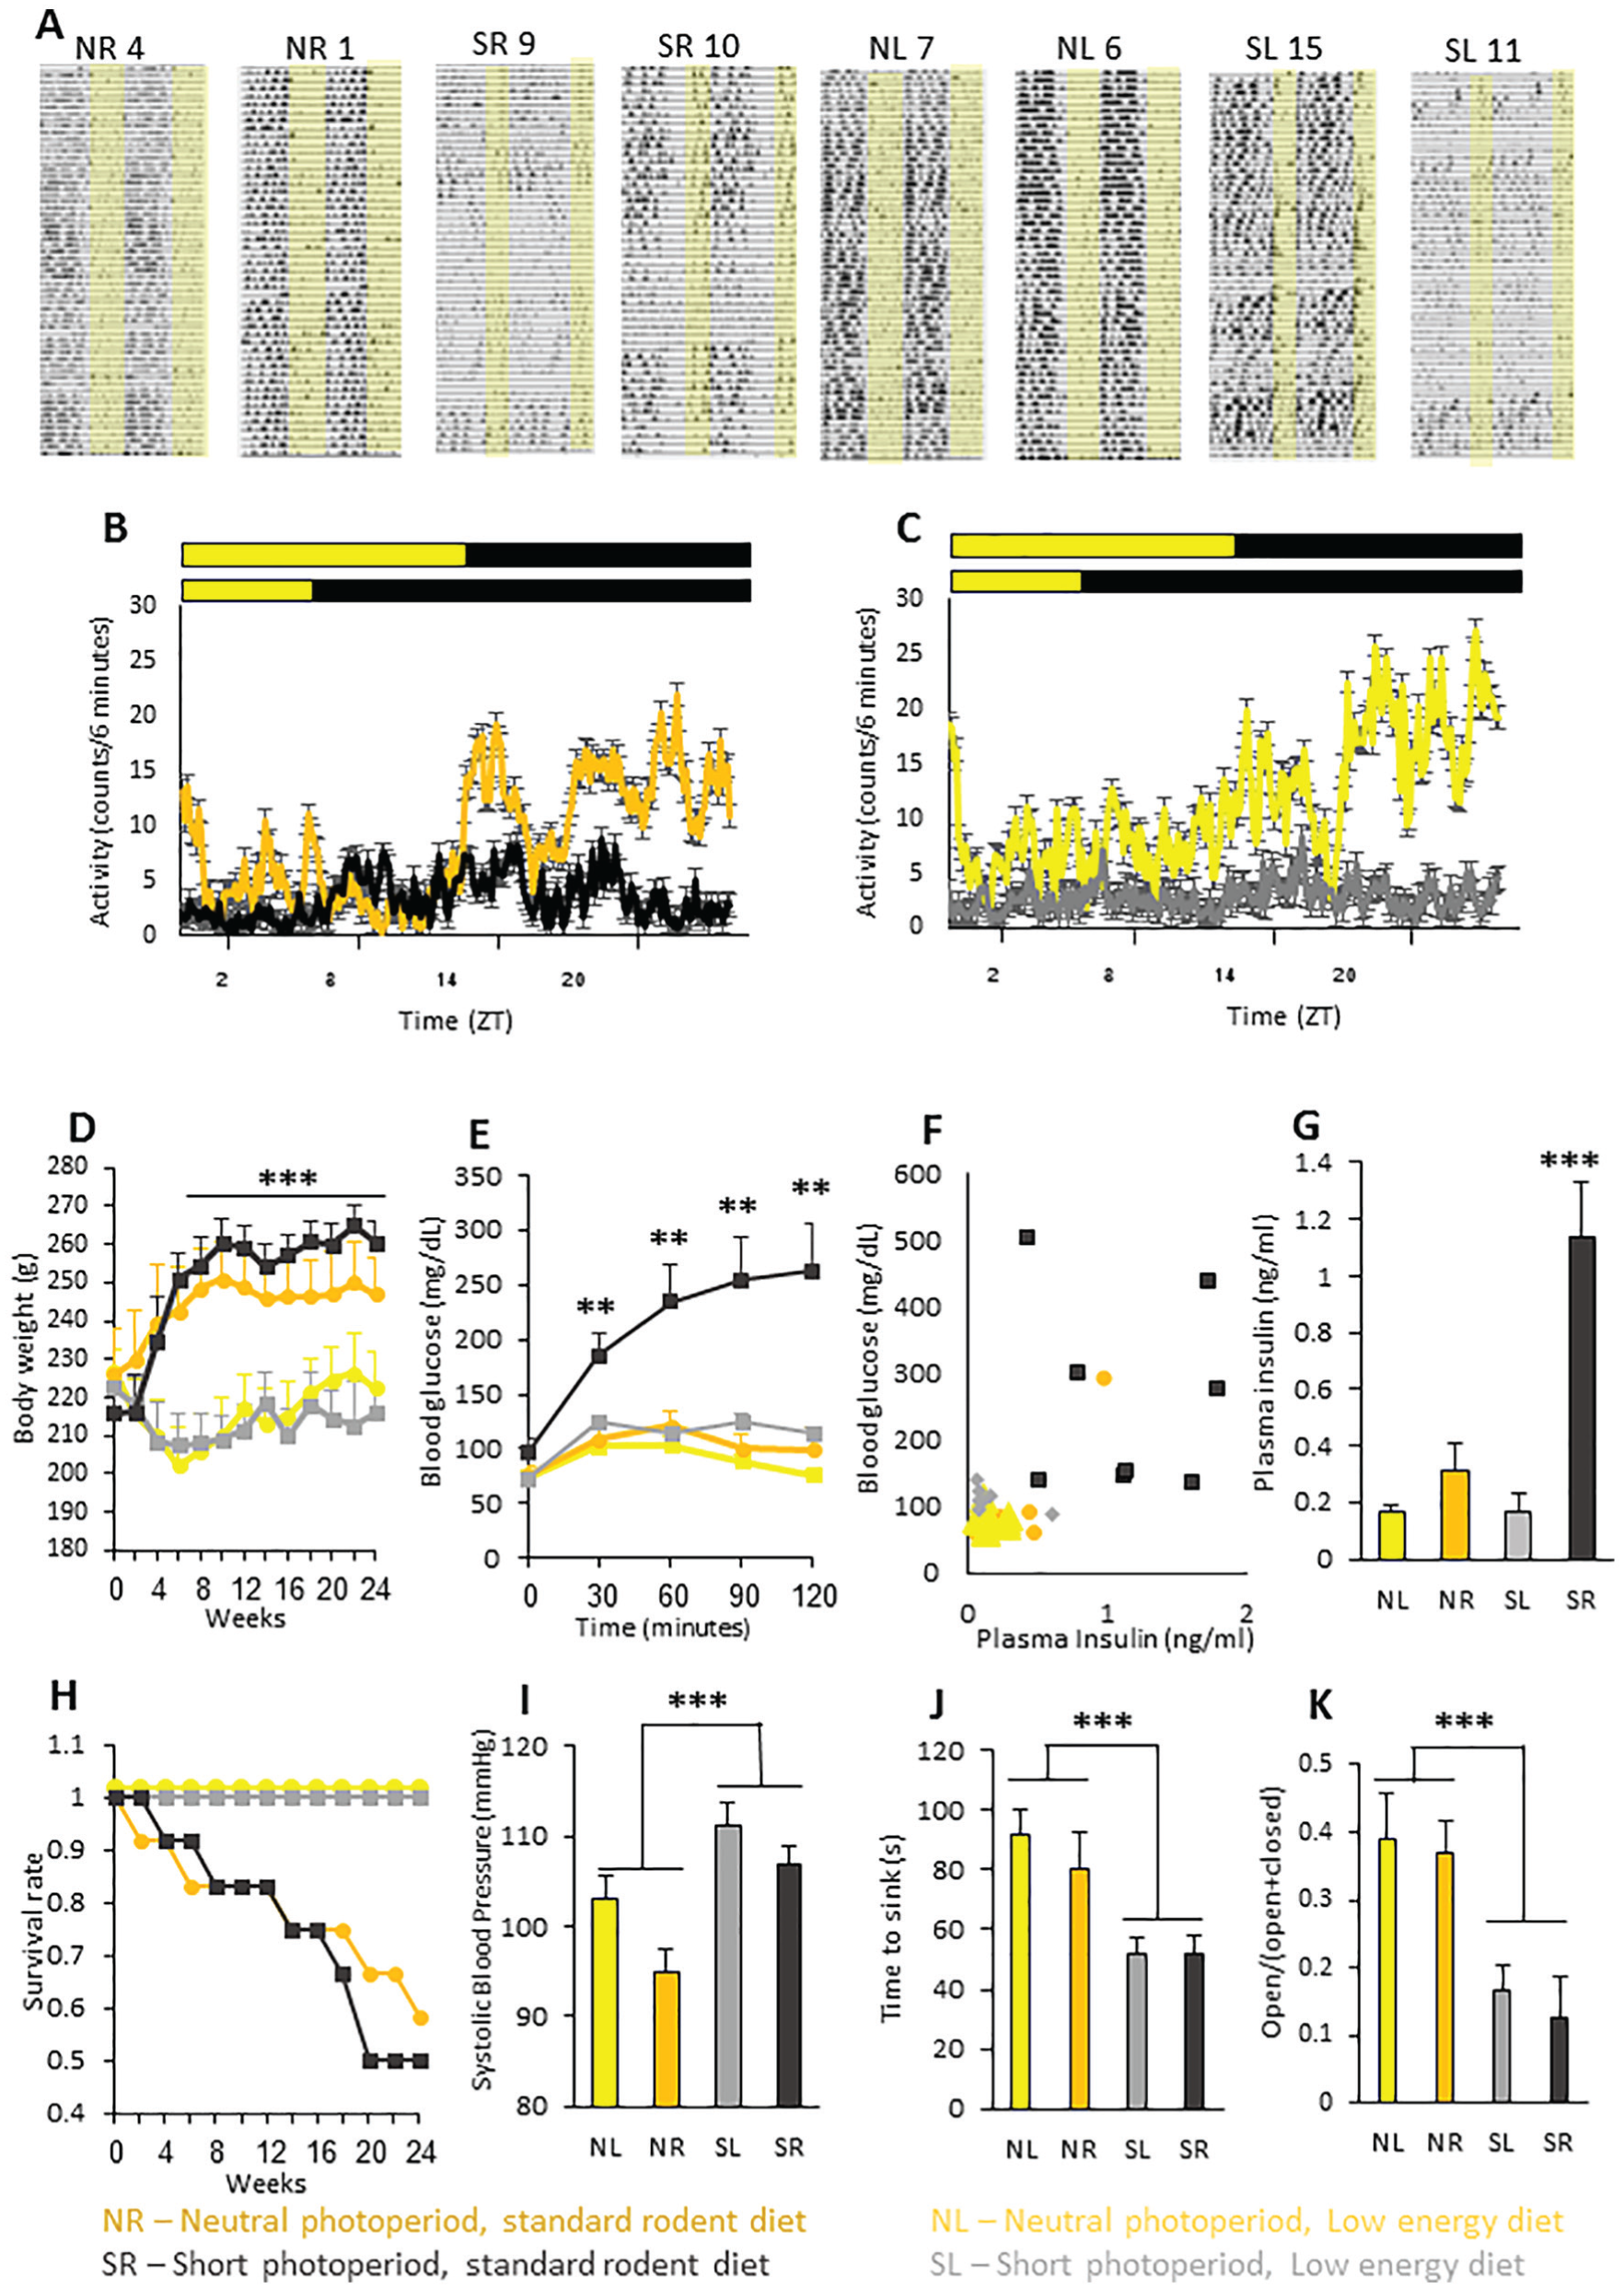
Long-term photoperiod × diet experiment with day length (Short Photoperiod 5:19 vs. Neutral Photoperiod 12:12 LD cycle) and diet (standard rodent diet or low-energy diet) as main factors. Yellow, neutral photoperiod low-energy diet (NL); orange, neutral photoperiod standard rodent diet (NR); grey, short photoperiod low-energy diet (SL); black, short photoperiod standard rodent diet (SR). (A) Representative double-daily plotted actograms of 2 sand rats from each experimental group: neutral photoperiod standard rodent diet (NR 1, 4), short photoperiod standard rodent diet (SR 9, 10), neutral photoperiod low-energy diet (NL 6, 7), short photoperiod low-energy diet (SL 11, 15). Each row represents 2 consecutive days, depicted one below the other. Yellow background represents light hours. (B, C) Activity rhythm. Average daily activity rhythm of animals in the 4 groups during the last week of the experiment for neutral- and short photoperiod-acclimated sand rats fed standard rodent diet (B) and neutral- and short photoperiod-acclimated sand rats fed a low-energy diet (C). Yellow background represents light hours. (D) The mean ± SEM body weight (n = 9 to 12 per group) was similar among groups at the beginning of the experiment. Starting from week 6, body weight of sand rats in the SR and NR groups was significantly higher than that of sand rats in the NL and SL groups. (E) Blood glucose levels (mg/dL) in the oral glucose tolerance test. SR sand rats had significantly higher blood glucose levels compared with NL, NR, and SL sand rats, measured at 30, 60, 90 and 120-min post-glucose administration. (F) Association between individual plasma glucose levels (mg/dL) and plasma insulin levels (ng/ml). (G) Plasma insulin levels: SR sand rats had significantly higher plasma insulin levels compared with NL, NR, and SL sand rats. (H) Cumulative proportion of surviving individuals. NL and SL sand rats had significantly higher survival rates than NR and SR sand rats (12/12 for NL and SL, 7/12 for NR and 6/12 for SR). (I) Systolic blood pressure (mmHg). Short photoperiod conditions and low-energy diet resulted in significantly higher blood pressure compared with neutral photoperiod conditions or standard rodent diet, with no interaction. (J) Forced swim test. Acclimation to short photoperiod conditions resulted in a significantly shorter time to second sink as compared with acclimation to neutral photoperiod conditions, with no effect of diet and no interaction. (K) Elevated-plus maze. Short photoperiod conditions resulted in a significantly shorter time spent in the open arms of the maze compared with neutral photoperiod acclimated sand rats, with no effect of diet and no interaction. *p > 0.05, **p < 0.01, ***p > 0.001.
Experiment 2: Statistical analysis results.
As repeatedly demonstrated, short photoperiod acclimation resulted in a significantly shorter time to the second sink in the FST as compared with animals acclimated to a neutral photoperiod, with no effect of diet and no interaction (Figure 2J, see Table 3 for statistical analysis), and a significantly shorter time spent in the open arms of the maze, in the elevated plus maze tests, with no effect of diet and no interaction (Figure 2K, see Table 3 for statistical analysis).
Experiment 3: Photoperiod × diet interaction (10 weeks)
Animals fed a regular diet gained significantly more weight compared with those fed a low-energy diet regardless of photoperiod length. Interestingly, there was no effect of time on weight but there was a significant time × diet interaction. As shown in Figure 3A, the lack of a general effect of time on weight was because the rats fed a regular diet gained weight across the 10-week experiment, whereas animals fed a low-calorie diet lost weight. The differences between the weights of the regular vs. low-energy diet groups became significant at week 6 and remained significant for the rest of the experiment (Figure 3A, see Table 4 for statistical analysis).
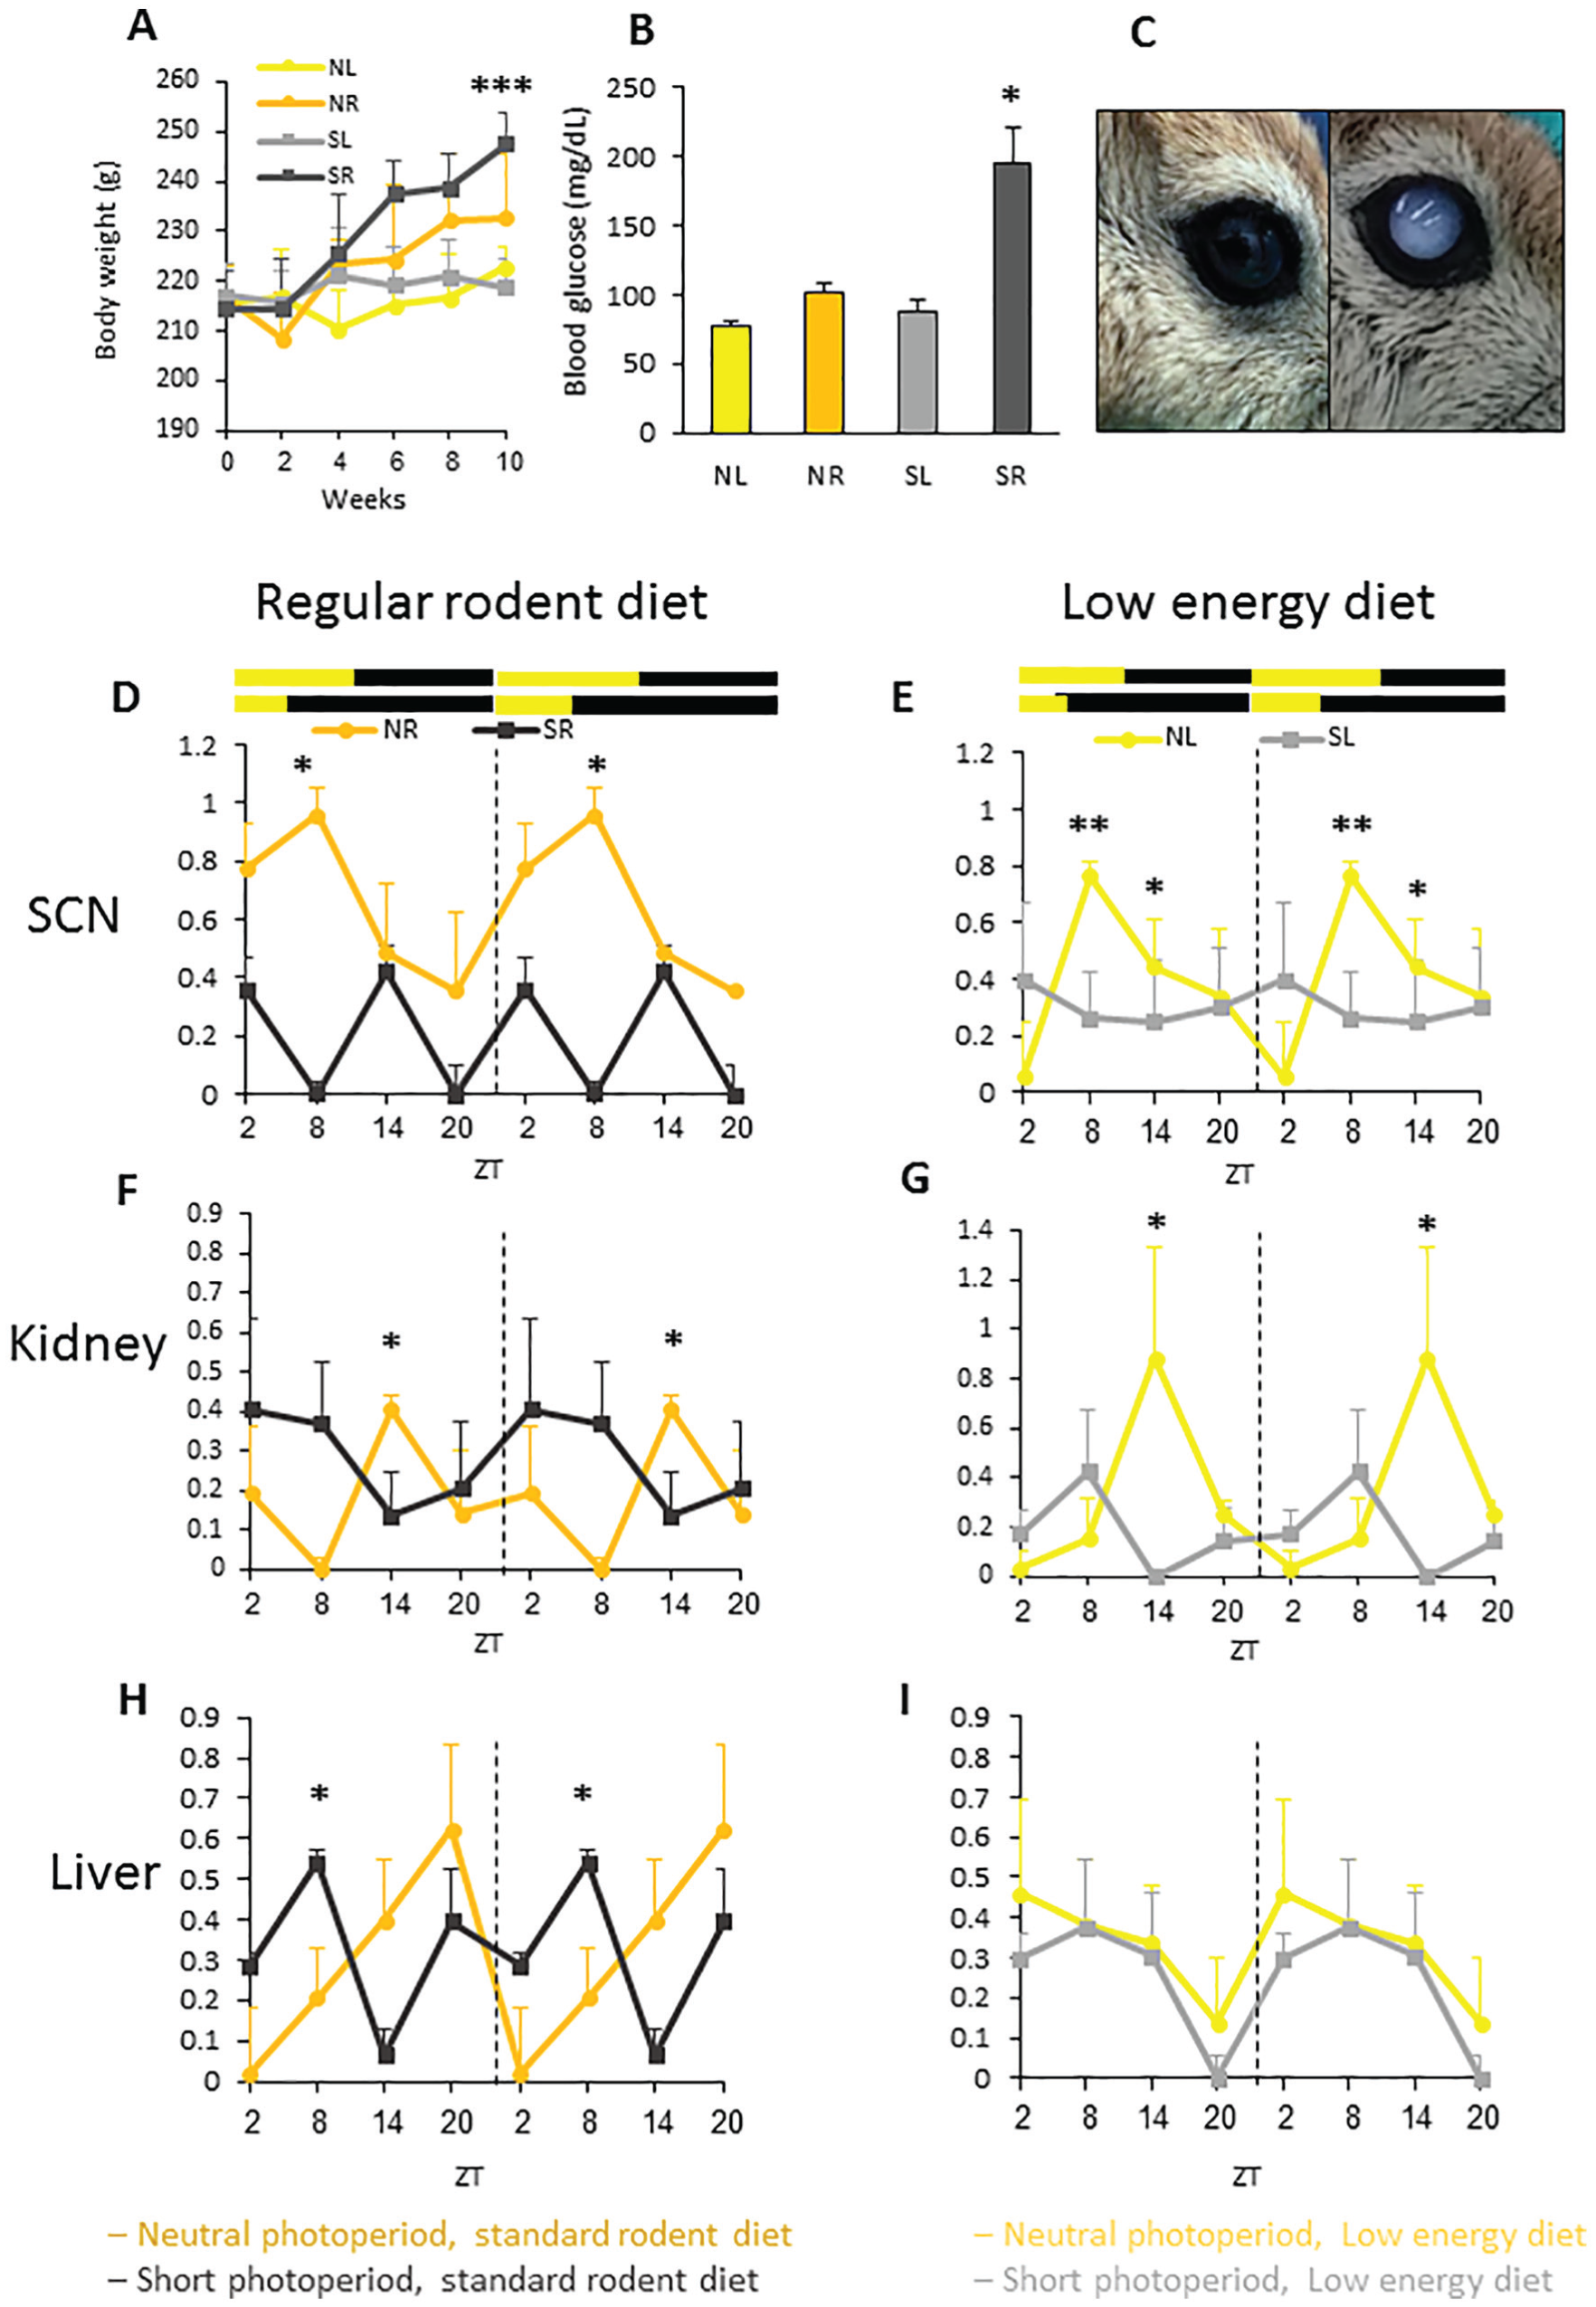
Short-term photoperiod × diet experiment with day length (Short Photoperiod 5:19 or Neutral Photoperiod 12:12 LD cycle), and diet (standard rodent diet or special low-energy diet) as main factors. Yellow, neutral photoperiod low energy diet (NL); orange, neutral photoperiod standard rodent diet (NR); grey, short photoperiod low-energy diet (SL); dark grey, short photoperiod standard rodent diet (SR). (A) Mean + SEM body weight (n = 24/group) was similar among the groups at the beginning of the experiment. By week 10, sand rats fed a standard rodent diet weighed significantly more than those fed a low-energy diet. (B) Blood glucose levels (mg/dL) in the oral glucose tolerance test measured 120-min post-glucose administration: SR sand rats had significantly higher blood glucose levels compared with NL, NR, and SL sand rats. (C) 37% of sand rats in the SR group developed mature cataracts (6/14) vs. none in the NL, NR, and SL sand rats. Left, healthy eye; right, eye with full cataract. (D-I) Circadian rhythm of mRNA levels of Per2 in the SCN, kidney and liver in sand rats kept under neutral (yellow and orange) or short (light grey and dark grey) photoperiods and fed a standard rodent diet (D, F, H) or a low-energy diet (E, G, I). Transcript levels were measured by qRT-PCR and normalized to β-actin. Results are the mean + SEM (n = 6 for each data point). Broken lines separate double-plotted data. (D) Per2 in SCN, regular diet groups: Per2 shows a significant daily rhythm in the NR group (ZT8 differs significantly from ZT20) but not in the SR group. (E) Per2 in SCN, low-energy diet groups: Per2 shows a significant daily rhythm in the NL group (ZT2 differs significantly from ZT8 and from ZT14) but not in the SL group. (F) Per2 in kidney, regular diet groups: Per2 shows a significant daily rhythm in the NR group (ZT8 differs significantly from ZT14) but not in the SR group. (G) Per2 in kidney, low-energy diet groups: Per2 shows a significant daily rhythm in the NR group (ZT2 differs significantly from ZT14) but not in the SL group. (H) Per2 in liver, regular diet groups: There are no significant differences in the NR group, but a significant daily rhythm is found in the SR group. (I) Per2 in liver, low-energy diet groups: Per2 shows no rhythm in the SL or NL group. *p > 0.05, **p < 0.01.
Experiment 3: Statistical analysis results.
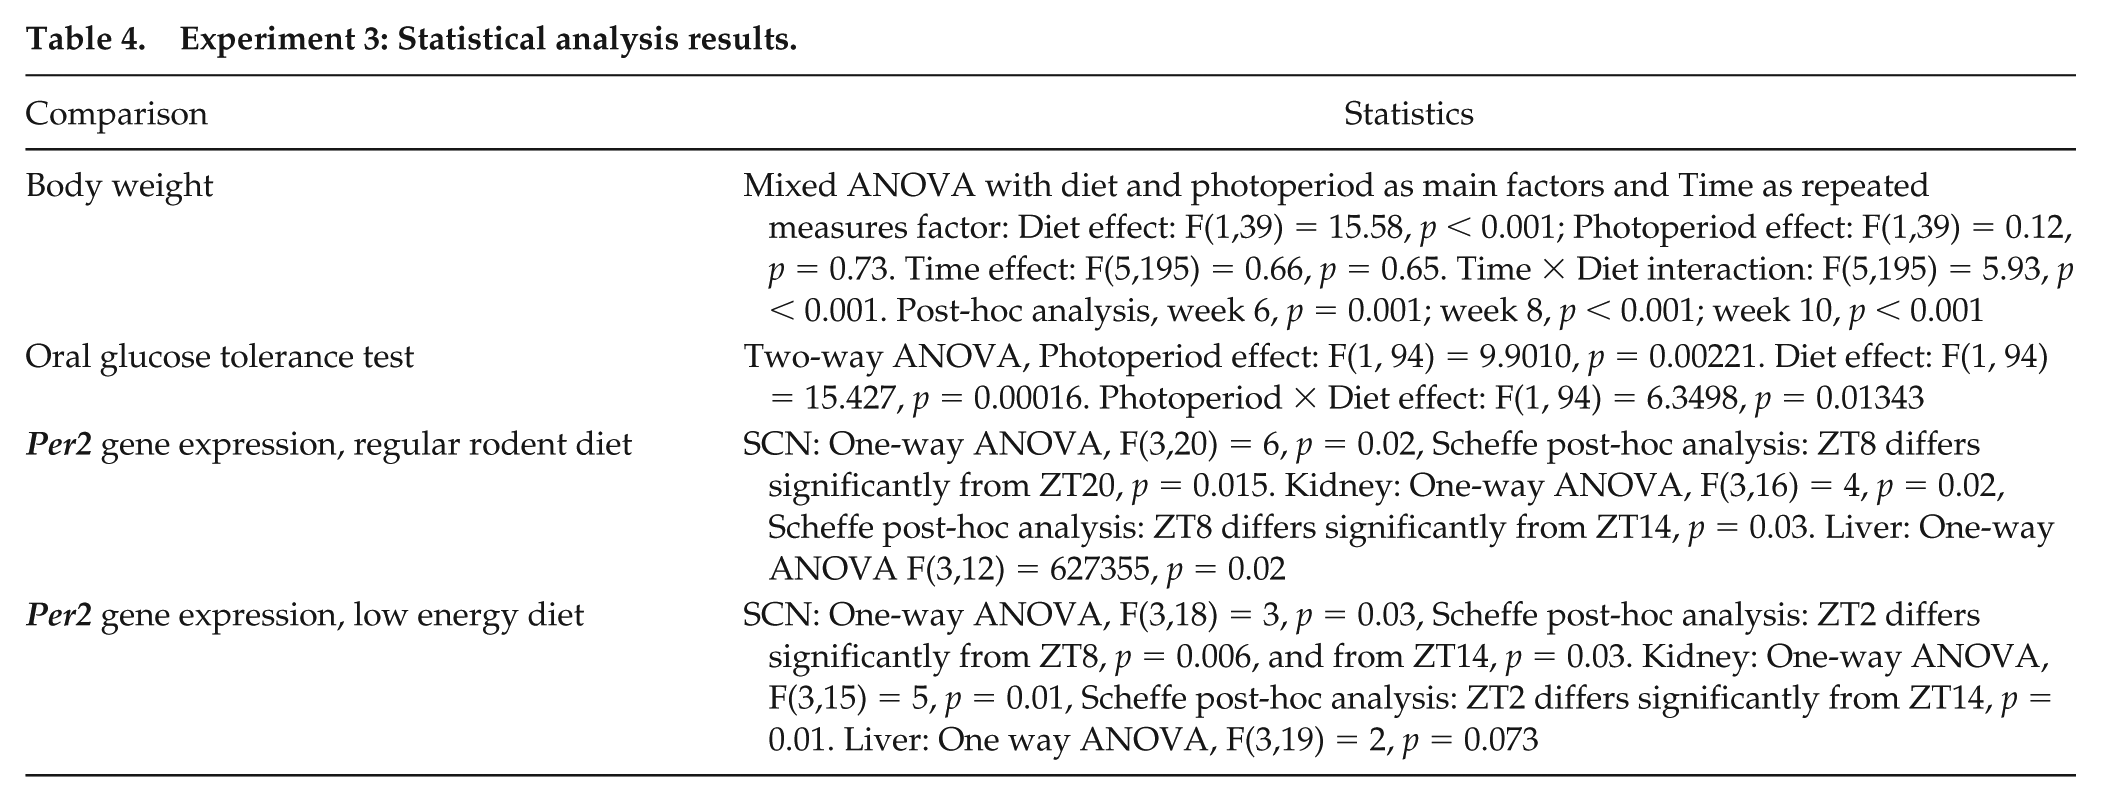
Sand rats kept under a short photoperiod and fed a standard rodent diet demonstrated significantly higher blood glucose levels (mg/dl) in the oral glucose tolerance test measured at 120-min post-glucose administration as compared with the other groups (Figure 3B, see Table 4 for statistical analysis). Cataracts were observed in 37% of the sand rats held under a short photoperiod and fed a normal rodent diet (6/14). No cataracts were observed in any of the other three groups (Figure 3C).
Regarding clock gene expression, Per2 had a significant daily rhythm in the SCN and kidneys of rats held under a neutral photoperiod and fed either diet, but not in the short photoperiod groups (Figure 3D-G, see Table 4 for statistical analysis). In the liver, Per2 showed a significant daily rhythm only for rats held under a short photoperiod and fed a normal rodent diet (Figure 3H, I see Table 4 for statistical analysis).
Discussion
Sand rats lose their diurnal activity pattern under laboratory conditions in which light is the only cycling environmental variable, in contrast to natural conditions in which a wealth of biotic and a-biotic variables cycle, and, in turn influence activity pattern (Barak and Kronfeld-Schor, 2013; Krivisky et al., 2012; Bilu and Kronfeld-Schor, 2013; Tal-Krivisky et al., 2015; Touati et al., 2018). These include different illuminance levels and spectra, moonlight, intra- and inter-specific interactions (e.g., other species’ sounds and odors), and ambient temperature fluctuations. For example, because the thermo-neutral zone of sand rats is 31°C ± 1.5°C (Frenkel and Kraicer, 1972), which occurred during the day throughout the research, thermoregulatory considerations could have promoted diurnal activity in the animals kept outdoors (Levy et al., 2012; van der Vinne et al., 2014).
In recent years, we have suggested that the sand rat presents an advantageous animal model for the study of seasonal affective disorder, and that circadian rhythm disturbances underlie their tendency to develop depressive and anxiety-like behaviors when held under short-photoperiod conditions as compared with neutral photoperiod conditions (reviewed by Bilu et al., 2016). In accordance, bright-light treatment and voluntary wheel running, which increase the rhythm amplitude and stability (Ashkenazy et al., 2009a; Krivisky et al., 2012; Tal-Krivisky et al., 2015), also ameliorate the depressive- and anxiety-like behaviors.
Sand rats have been used as a model for diet-induced T2DM since they were first collected by the US Naval Medical Research Unit in Egypt in the 1960s. They were sent to the laboratory of Schmidt-Nielsen at Duke University where they were fed a standard rodent diet and found to develop diabetes (Schmidt-Nielsen et al., 1964). The effect of feeding the rats a standard rodent diet has been characterized in numerous studies (reviewed by Kaiser et al., 2012; Kalman et al., 2012). In their natural habitat—East-Mediterranean and North-African semi-deserts—sand rats feed mainly on the low-calorie saltbush Atriplex halimis, and it was hypothesized that the rats develop diet-induced T2DM when fed standard rodent diet, which is a high-energy diet for this species. However, the basis for this tendency has remained unknown.
Here, we suggest that, similar to the development of the depressive-like behavior, the development of T2DM in this species under laboratory conditions stems from disturbances in their circadian rhythms. We show that, when kept outdoors in laboratory cages and fed a rodent diet ad libitum, sand rats are diurnal, consume much of their food during the day, have higher blood glucose levels during the day, and do not develop T2DM. This contrasts with sand rats kept indoors under similar conditions, which become nocturnal or arrhythmic, consume most of their food during the night, have constantly higher blood glucose levels, develop glucose intolerance; and, eventually, die earlier; in our study, 13 out of 30 sand rats kept indoors died within 14 weeks. Our findings also suggest that the development of T2DM and a depressive-like behavior constitute an independent manifestation of changes in the circadian system: (1) Previous research reviewed by us in Bilu et al. (2016) demonstrated that sand rats develop depressive-like behavior when kept under a short photoperiod and a fed low energy diet, conditions under which their glucose metabolism is not impaired; and (2) Depressive-like behavior appears within 3 weeks of short photoperiod acclimation, long before blood glucose and insulin levels increase (which occur after about 2 months, when fed a regular rodent diet).
We further show that keeping sand rats under a short photoperiod, which results in reduced rhythm amplitude (at both the behavioral and molecular levels) and the development of anxiety and depressive-like behaviors, also accelerates the development of T2DM. Although rats fed a standard rodent diet gained significantly more mass under both photoperiods, it was predominantly the rats fed a standard rodent diet and held under a short photoperiod that developed T2DM, as evident from their lower glucose tolerance and high plasma insulin levels. We suggest that these disturbed rhythms perturb the metabolic pathways controlled by feeding and the circadian system, as shown by Hatori et al. (2012), eventually resulting in the development of T2DM. In accordance, the daily rhythm in fasting blood glucose in humans changes before the development of T2DM, with no significant daily rhythm in fasting blood glucose levels found for patients with T2DM (Gubin et al., 2017).
Plasma glucose concentration results from a balance between glucose input (from food or hepatic glucose production) and its uptake by muscle and adipose tissue. The concentration is controlled by the SCN both indirectly, via feeding rhythms (which affect glucose and insulin rhythms), and directly, by affecting glucose production and utilization, and insulin sensitivity in tissues like liver, muscle, and pancreas (Jha et al., 2015; Panda, 2016). Plasma glucose concentration and glucose tolerance (la Fleur et al., 1999; Zimmet et al., 1974) show daily rhythms corresponding to the activity pattern of the species, and plasma glucose peaks just before activity starts. In laboratory mice, this rhythm is independent of food availability and depends on an intact SCN (Coomans et al., 2013; Jha et al., 2015; Kalsbeek et al., 2014). We suggest that, in diurnal species, switching to nocturnality or becoming arrhythmic under laboratory conditions disrupts the temporal order of processes controlled by the SCN both directly and indirectly, resulting in hyperglycemia (as seen in experiment 1), which eventually leads to the development of T2DM. Future treatments aimed at resynchronizing and stabilizing circadian rhythms in diurnal species will enable testing this hypothesis.
We further suggest that the same process occurs in the sand rats fed a low-energy diet. However, because the caloric density of the food is low, they are effectively calorie-restricted and therefore do not develop the T2DM phenotype. In accordance, we found that photoperiod, rather than diet, had a significant effect on systolic blood pressure, and depressive- and anxiety-like behavior, which were all elevated in the short photoperiod-acclimated animals. Interestingly, the systolic blood pressure of sand rats fed a low-energy diet was significantly higher than that of sand rats fed a standard rodent diet, under both photoperiods, even though the former weighed less. It is possible that the low-caloric density of the low-energy diet resulted in food restriction that, on the one hand, prevented the development of diabetes but, on the other, causes stress to the rats and resulted in their high blood pressure.
Another possible contributor to the accelerated development of T2DM in sand rats under the short photoperiod is that of seasonal changes. Indeed, seasonality in new incidences of T2DM in humans has been described, with a peak in March and trough in August (Doró et al., 2006). This coincides with the seasonality of hemoglobin A1c (HbA1c) values, which is indicative of the 3-month average plasma glucose concentration (Tseng et al., 2005), and with the seasonality of blood glucose values in healthy human subjects, which are highest in winter and lowest in summer (Behall et al., 1984; Fahlen et al., 1971; Jarrett et al., 1984). However, when we compared between rats housed indoors and outdoors under the same photoperiod and fed a standard rodent diet, we found that only the indoor rats developed glucose intolerance. This suggests that the change in daily rhythms under laboratory conditions are the main factor affecting the development of T2DM, with a short photoperiod accelerating the process.
A recent study by Touati et al. (2018) examining the connection between diet and the circadian clock in sand rats, found an effect of diet on insulinemia and insulin/glucose ratio, both of which were higher in rats fed a rodent diet compared with those fed a low-energy diet. However, there was no daily variation in glycemia or insulinemia in either groups, even though one-third of the rats (which were arrhythmic) were excluded from the study (Touati et al., 2018). They also found that hyperinsulinemic animals demonstrated circadian disturbances, including a longer free-running period under constant darkness, as well as the disappearance of daily rhythmicity in VIP, AVP, and CLOCK within the SCN. That study concluded that diet-induced insulin resistance resulted in disturbances in brain clock processes. However, it does not explain the tendency of the species to develop T2DM.
We suggest that the tendency of sand rats to develop T2DM under laboratory conditions results from their diurnality, leading to a reduced stability of the circadian system and, consequently, a disruption in their daily rhythms under laboratory conditions (Figure 4). If our hypothesis is correct, then all other diurnal species that lose rhythmicity under laboratory conditions will similarly develop a high susceptibility to T2DM under laboratory conditions. The findings from a literature survey we conducted strongly suggest that all diurnal rodents whose activity patterns undergo changes under laboratory conditions also develop T2DM, irrespective of their natural diet (Table 1). Despite the well-known fact that all these diurnal rodents develop T2DM under laboratory conditions, this has never been attributed to their activity pattern.
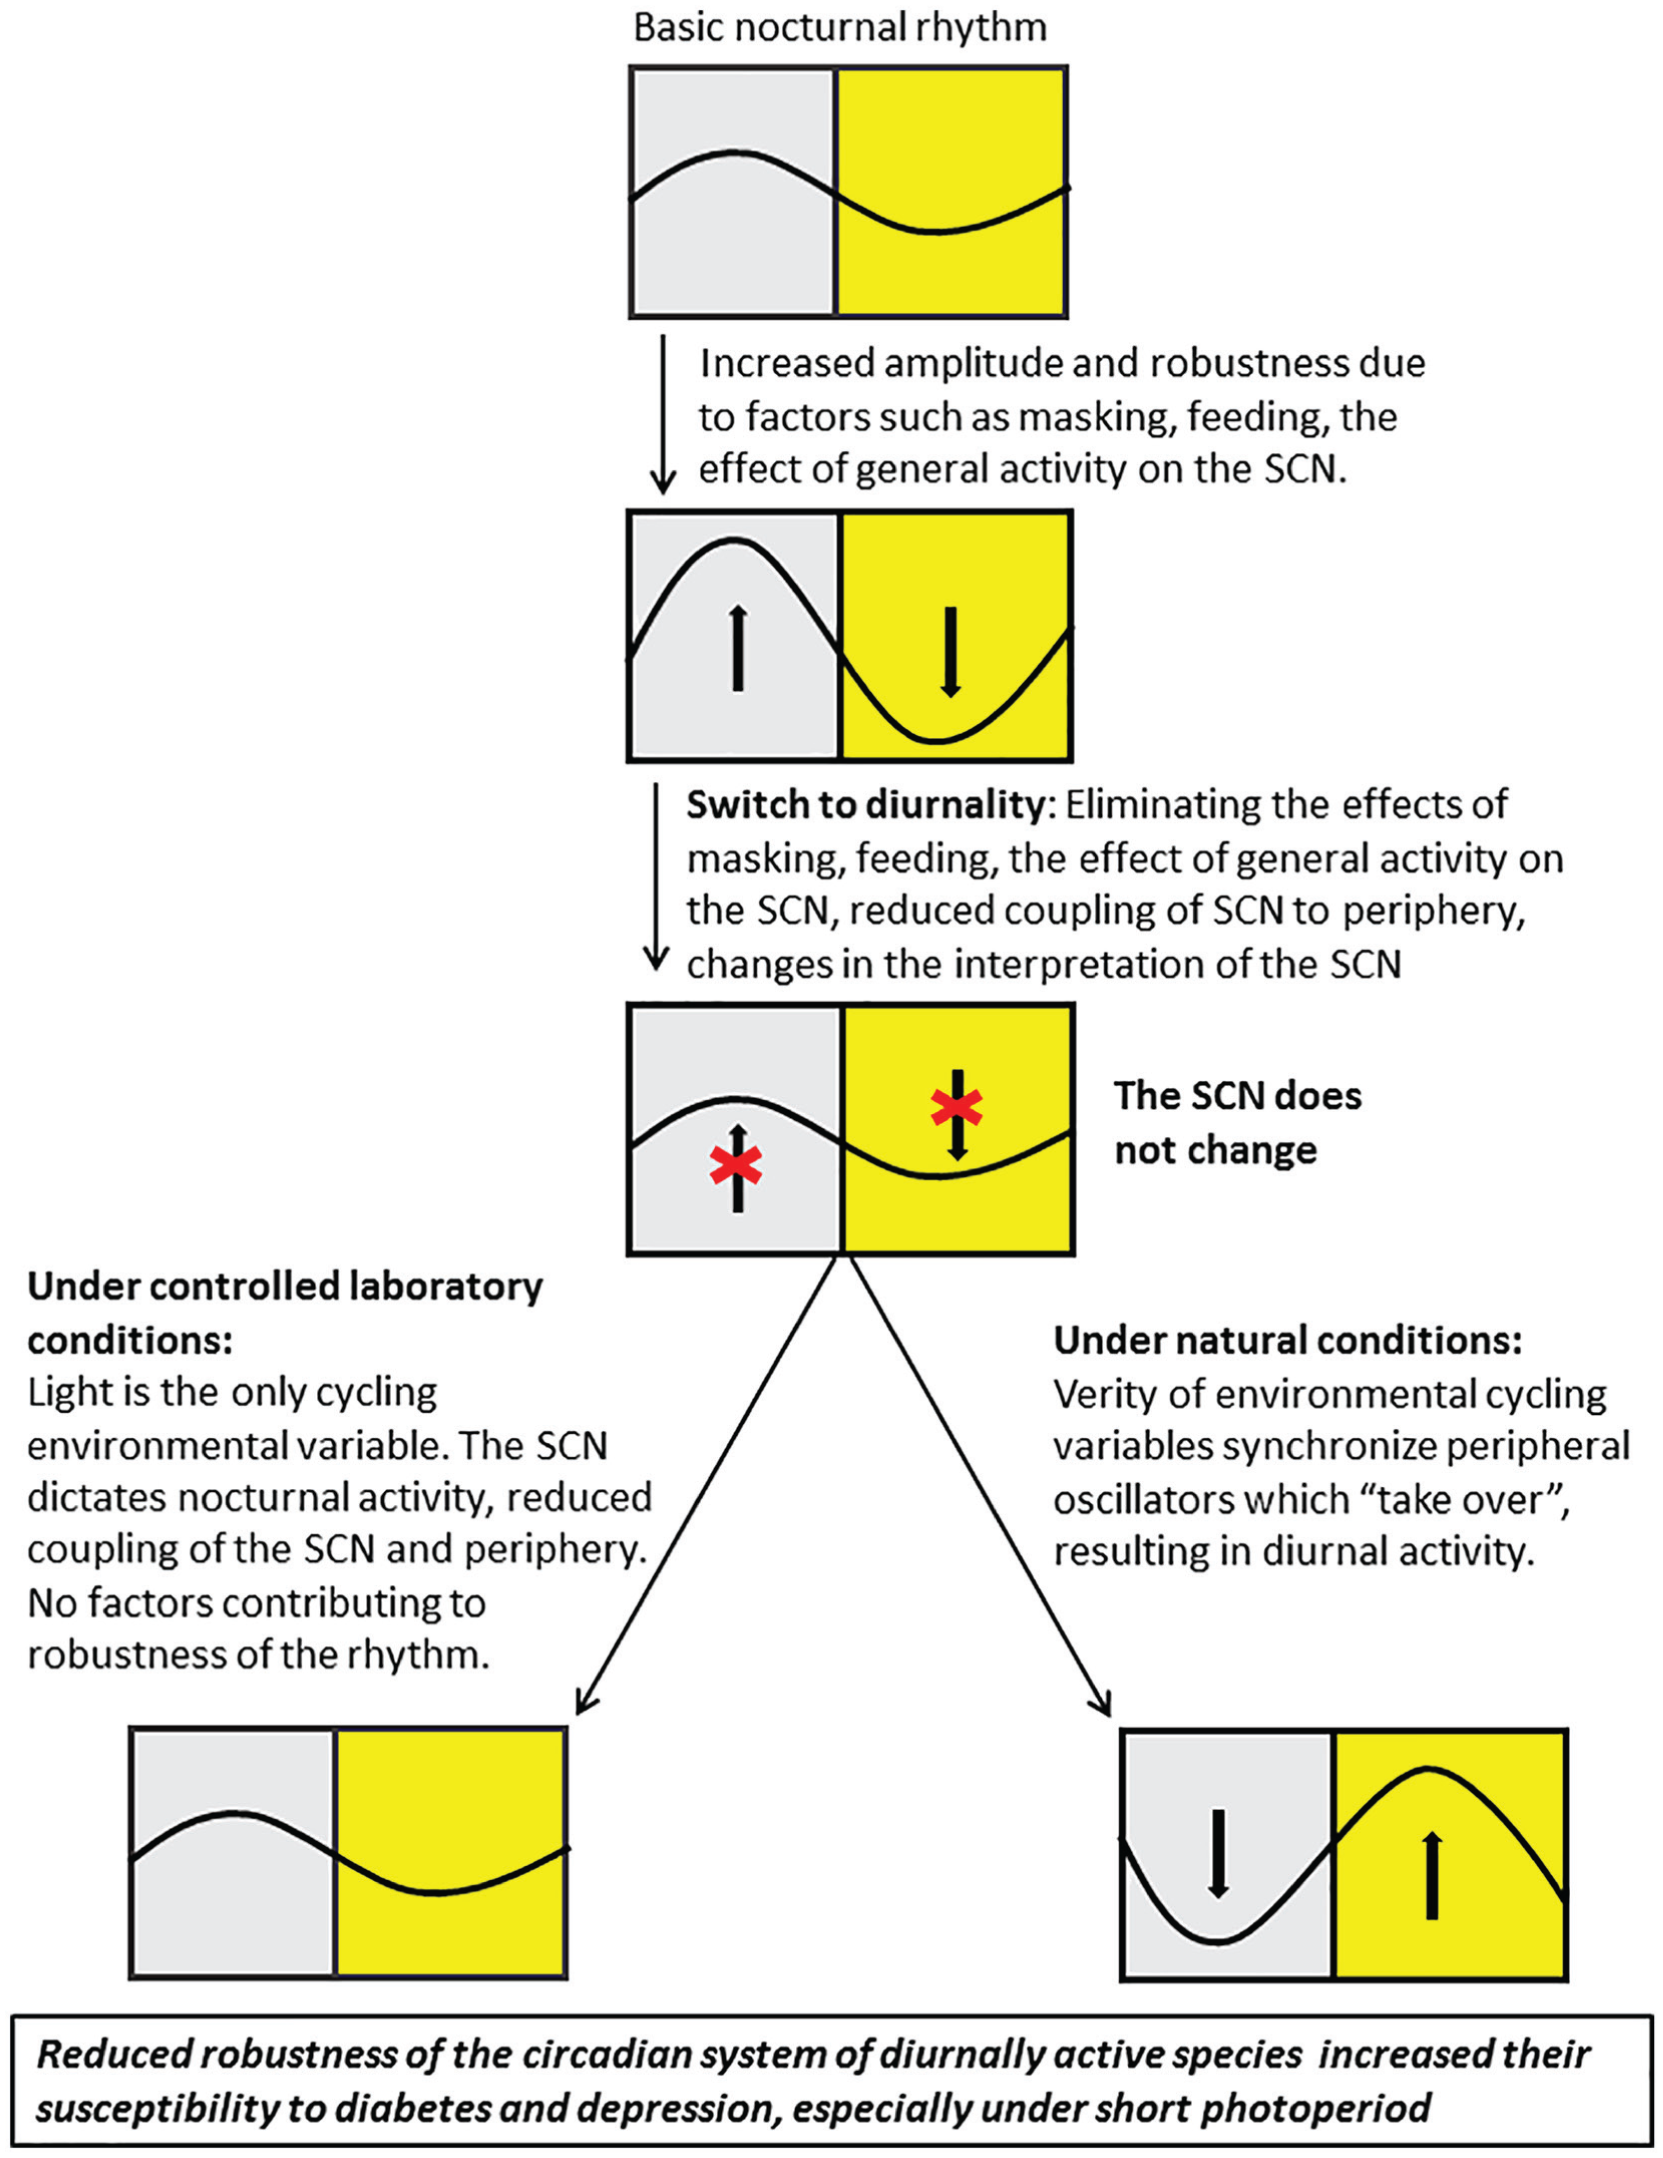
We hypothesize that the switch from the ancestral nocturnal activity pattern to the current diurnal one demanded reduced robustness of the circadian rhythms and resulted in increased susceptibility to circadian rhythm-related diseases in diurnal rodents.
Daily rhythms in behavior and physiology are controlled by the circadian system, which in mammals includes a central clock in the SCN and peripheral clocks in almost every cell of the body, which are synchronized to the SCN. It also includes positive feedback at different organizational levels (e.g., masking effect of light, anxiety rhythm, the effect of general activity on the SCN electrical activity, and the peripheral effects of melatonin, feeding, and temperature), which reinforce and enhance the daily rhythms of the species (reviewed by Bilu et al., 2016). This holds true for nocturnal mammals, which is the mammalian ancestral activity pattern (Kronfeld-Schor and Dayan, 2008). A shift from the ancestral nocturnal to a diurnal activity pattern requires morphological, physiological, and behavioral adaptations, including adaptations of the circadian system (Hut, 2012; Kronfeld-Schor and Dayan, 2008). The rhythmic function and activity of the SCN of diurnal and nocturnal species is similar (Cuesta et al., 2009; Smale et al., 2008) and melatonin is secreted during the night in both nocturnal and diurnal species (Cuesta et al., 2009; Vivanco et al., 2007). This means that to switch from the ancestral nocturnal activity pattern to a diurnal one, the downstream interpretation of the signals emanating from the SCN and melatonin needs to be reversed (Cuesta et al., 2009; Jha et al., 2015; Smale et al., 2008). Furthermore, to become diurnal, the species should, in the first stage, eliminate all those other functions that contributed to confining and synchronizing the activity of the nocturnal ancestor to the nocturnal phase and enhanced the robustness of the nocturnal activity pattern. In the second stage, reverse them to develop a high robustness of diurnal rhythms (as seen in nocturnal mammals). We have previously shown that these changes have occurred to a limited extent in various diurnal rodents (Barak and Kronfeld-Schor, 2013; Bilu and Kronfeld-Schor, 2013; Bilu et al., 2016; Cohen et al., 2010), resulting in a reduction in the robustness of the circadian system of diurnal species, which possibly increased their susceptibility to diabetes and depression (Figure 4).
Most biomedical research pertaining to diurnal humans is conducted on nocturnal mice and rats. We suggest that this may restrict research, especially when studying circadian rhythm-related diseases in humans, like depression and T2DM. Moreover, laboratory conditions are similar in many ways to the conditions under which we live in modern societies, in which we control our ambient temperature and light exposure, where food is available ad libitum and where we are unconnected to the rhythms of other species – food, competitors, or predators (Kronfeld-Schor et al., 2017). These unnatural environments, and especially the unnatural patterns of light exposure during both day (low-light levels indoors) and night (high-light levels) directly affect our circadian biology and health, including the development of T2DM and depression. We suggest that using diurnal model animals rather than nocturnal ones is therefore advantageous when seeking to study these processes.
Supplemental Material
Figure_5_suppl – Supplemental material for Diurnality, Type 2 Diabetes, and Depressive-Like Behavior
Supplemental material, Figure_5_suppl for Diurnality, Type 2 Diabetes, and Depressive-Like Behavior by Carmel Bilu, Paul Zimmet, Vicktoria Vishnevskia-Dai, Haim Einat, Galila Agam, Ehud Grossman and Noga Kronfeld-Schor in Journal of Biological Rhythms
Supplemental Material
Figure_6_suppl – Supplemental material for Diurnality, Type 2 Diabetes, and Depressive-Like Behavior
Supplemental material, Figure_6_suppl for Diurnality, Type 2 Diabetes, and Depressive-Like Behavior by Carmel Bilu, Paul Zimmet, Vicktoria Vishnevskia-Dai, Haim Einat, Galila Agam, Ehud Grossman and Noga Kronfeld-Schor in Journal of Biological Rhythms
Footnotes
Acknowledgements
This research was supported by the Israel Science Foundation (grant No. 866/17), The Israel Endocrine Society and The Gutwirth Research Prize in Diabetes Mellitus to NK-S.
Conflict of Interest Statement
The author(s) have no potential conflicts of interest with respect to the research, authorship, and/or publication of this article.
Note
Supplemental material for this article is available online.
References
Supplementary Material
Please find the following supplemental material available below.
For Open Access articles published under a Creative Commons License, all supplemental material carries the same license as the article it is associated with.
For non-Open Access articles published, all supplemental material carries a non-exclusive license, and permission requests for re-use of supplemental material or any part of supplemental material shall be sent directly to the copyright owner as specified in the copyright notice associated with the article.