
Abstract
Performing risk assessments (RA) on household use of flexible polyurethane (PU) foams requires access to reliable data about emission and migration of potential diamine impurities. A toluene diisocyanate (TDI) and a methylene diphenyl diisocyanate (MDI) based foam were thermally treated to enable measurements on samples with defined concentrations of the corresponding diamines, toluene diamine (TDA), and methylene dianiline (MDA). The thermally treated foams used for emission testing contained up to 15 mg.kg−1 of TDA and 27 mg.kg−1 of MDA. Those used for migration testing contained 5.1 mg.kg−1 of TDA and 14.1 mg.kg−1 of MDA. Stability of the thermally generated diamines was sufficient for testing over a 37-day period. Analytical techniques that did not decompose the polymer matrix were applied. Emission rates for TDA and MDA isomers were less than the limit of quantitation (LOQ) of 0.008–0.07 μg.m−2.h−1. Migration was studied using samples of the same thermally treated foams over a 35-day period. Quantifiable migration of MDA from the MDI-based foam was only observed on Days 1 and 2. From Day 3 onward, migration rates were less than the LOQ. Quantifiable migration of TDA from the TDI-based foam rapidly decreased with time and was only observed on Days 1 thru 3. From Day 4 onward, migration rates were less than the LOQ. Theoretically, the migration rate should be inversely proportional to the square root of time (t) as t−0.5. This relationship was confirmed by the experimental data and enables extrapolating migration values to more extended time periods to conduct RAs.
Keywords
Introduction
Flexible polyurethane (PU) foams made with diisocyanates like toluene diisocyanate (TDI) and methylenediphenyl diisocyanate (MDI) are widely used in manufacturing seating cushions and mattresses, applications that bring the finished PU foam into close contact with consumers. The diisocyanates, TDI and MDI, are sensitizers, and residual levels could be of concern regarding indoor air quality in homes. While care is taken in foam production to minimize them, the presence of some residual PU starting materials and the formation of impurities are possible and have to be considered and evaluated in exposure risk assessments (RA). To provide a solid basis for conducting a RA such as the one conducted by Arnold et al. (2012) for exposure to diisocyanate emission and migration while sleeping on a mattress, information from state-of-the-art detection and measurement methods is a necessity.
Analyzing foams for the presence of (diisocyanates and) diamines poses unique challenges to prevent generating erroneous data caused by the decomposition of the polymer matrix. Practices in PU recycling (Bhandari and Gupta, 2018), such as hydrolysis, glycolysis, and aminolysis, indicate that under specific conditions or use of certain solvents, the PU matrix will decompose (e.g., Ge and Sakai, 1998; Hall et al., 2001; Zahedifar et al., 2021). For the matter at hand, an extent of reaction that leads to mg/kg of error can be significant. Other authors have tested various amine-based isocyanate derivatizing agents and found that they too could decompose urethanes or cross-linking allophanates and biurets in the PU polymer matrix (Joel and Weiler, 1980; Joel et al., 1988; Schmidtkunz, 2012; Vangronsveld et al., 2013; West et al., 2022).1,2, 3 The biurets and allophanates are particularly sensitive since they can actually be quantitatively titrated by primary amines (Furukawa et al., 1977; Joel et al., 1988; Okuto, 1966). Extraction with alcohols (methanol, ethanol) causes less decomposition of urethanes or cross-links in the polymer matrix (Joel et al., 1988; Vangronsveld et al., 2013; West et al., 2022). A summary of some Schmidtkunz (2012) results is provided in Supplemental Information 6 for reference. Methods can also be prone to interference between diisocyanates and diamines if these are present simultaneously and immediate derivatization of the isocyanates to avoid hydrolysis is not ensured (HSE, 2014). Recently, analysis methods have been developed that have minimal effects on the PU polymer matrix and/or enable the simultaneous detection of diisocyanates and diamines in the same sample by including an isocyanate derivatizing agent in the acidic solution that is used for extraction of the diamines (Brunet et al., 2018; Donchenko et al., 2020; Johnson et al., 2010; Karlsson, 2023). For these reasons, this work employed very similar methods for the extraction, emission, and migration studies undertaken.
Aromatic diamines can be formed as impurities in water-blown foams and are of concern as potential human carcinogens (IARC, 1978, 1986). Toluene diamine (TDA) and methylene dianiline (MDA) have been detected in foams (Marand et al., 2004) and in curing PU (Karlsson et al., 2022) in the low mg/kg range. Voluntary quality certification programs like CertiPURTM (EUROPUR, 2021) have been established requiring the concentrations of aromatic diamines in foams to be <5 mg.kg−1 as measured by extraction of the foam into a 1% aqueous acetic acid solution. In many cases, concentrations in commercial products are much lower or not detectable (Hillier et al., 2001). To generate useful data as a basis for RA, however, foams with a defined level of diamines would be desirable to achieve measurable emission and migration rates that could then be correlated to the toxicologically relevant inhalation and dermal exposure scenarios. It is disruptive and costly to intentionally produce “off-specification” products in an industrial PU foam manufacturing facility. Direct spiking of foams with TDA or MDA has major drawbacks. Because of their abovementioned reactivity with the biuret and allophanate components of the foam, diamine recovery by extraction is generally poor. Hence, using the spiked quantity could lead to underestimating the emission and migration potentials. Furthermore, spiking is a surface addition technique that does not achieve good penetration and homogeneous distribution of the substances into the core of the foam. For these reasons, this work took advantage of the fact that diamines can be generated in foam by thermal treatment, using temperatures greater than 150°C with steam (Gerlock et al., 1980) or atmospheric moisture (Raffel, 2000), to thermally spike foams with diamines so that concentrations slightly exceeding the 5-mg.kg−1 limit could be produced and investigated.
Methods
Materials
Foams
Properties of the two polyurethane foams used for testing. MDI = methylenediphenyl diisocyanate; TDI = toluene diisocyanate.
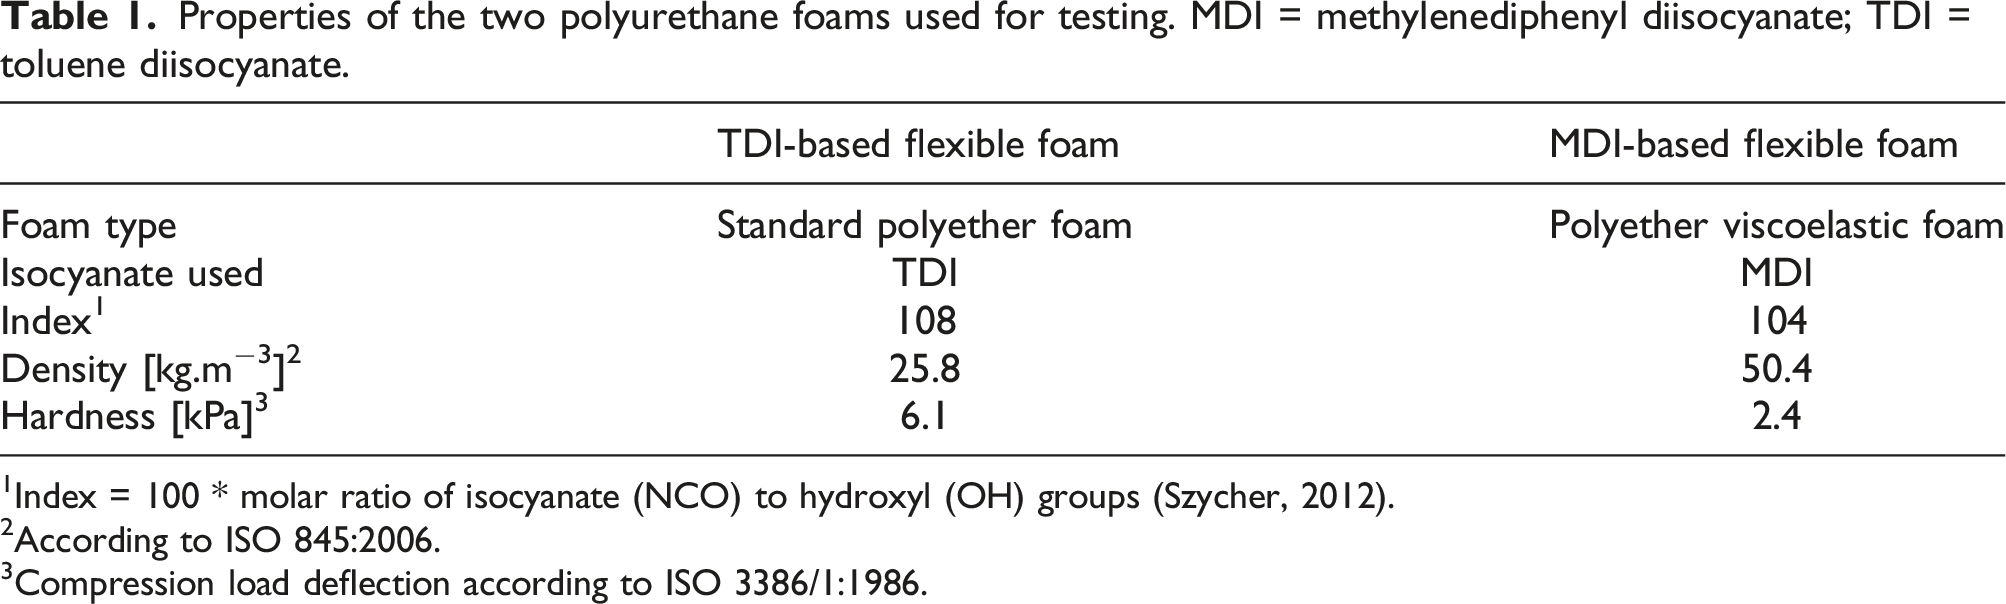
1Index = 100 * molar ratio of isocyanate (NCO) to hydroxyl (OH) groups (Szycher, 2012).
2According to ISO 845:2006.
3Compression load deflection according to ISO 3386/1:1986.
Chemicals
Acetic acid (AA), acetonitrile (ACN), ammonium formate (used as a pH 5.2 buffer, AFB), dibutylamine (DBA), dihexylamine (DHA), ethylchloroformate (ECF), formic acid (FA), KH2PO4 (used as a 1 mol.L−1 pH 7.5 solution), 4,4′-MDA, methanol, NaOH, pentafluoropropionic acid anhydride (PFPA), pyridine (PYR), TDI (75/25% mixture of the 2,4- and 2,6-isomers), toluene (TOL), and water were obtained from Merck (Darmstadt, Germany). Technical grade MDI (96/4% mixture of the 4,4′- and 2,4′-isomers) was obtained from Huntsman (Everberg, Belgium).
Deuterium-labeled di-(d9-DBA)-derivatives of the diisocyanates (isomers of TDI and MDI), di-deuterium labeled 4,4′-MDA [CD2(C6H4NH2)2], tri-deuterium-labeled 2,4- and 2,6-TDA [CD3C6H3(NH2)2], 2,2′-MDA, and 2,4′-MDA were obtained from Ramidus (Lund, Sweden).
Instrumentation and analysis
For all analyses, a triple quadrupole mass spectrometer (MS), Quattro Micro (Waters, Altrincham, Cheshire, UK), Shimadzu LC10ADVP micro-LC pumps (Shimadzu Corporation, Kyoto, Japan) with sample injections of 1 μL using an LC-Pal autosampler (CTC Analytics AG, Zwingen, Switzerland) on an Ascentis Express analytical column (5 cm × 2.2 mm, 2.7 μm C18; Supelco, Bellefonte, PA, USA) were used.
For all analyses, the MS instrument was operated with a capillary voltage of 3 kV. The temperature of the ion source was 130°C and the desolvation gas temperature was 250°C. The desolvation gas flow was set to 700 L/h. Argon was used as collision gas. Entrance cone voltage and collision energies were optimized individually for the different ions monitored.
For the isocyanate-DHA and amine-ECF derivatives, the MS instrument was monitoring multiple reactions in the positive electrospray mode. Quantitative measurements were made by monitoring the reaction [MH]+→[DHAH]+ for the isocyanate derivatives and [MH]+→[M-46]+ for the diamine derivatives and for the corresponding deuterium-labeled internal standards ([MH]+→[d9DBAH]+ and [d2MH]+→[d2M-46]+). For chromatographic separation of the derivatives, gradient elution was performed from 40/60/0.05% (v/v/v) ACN/H2O/FA to 95/5/0.05% (v/v/v) ACN/H2O/FA in 10 min at a flow rate of 0.4 mL/min.
For the amine-PFPA derivatives, the MS instrument was monitoring multiple reactions in the negative electrospray mode. Quantitative measurements were made by monitoring the reaction [M-H]-→[M-120]- for the amine derivatives and for the corresponding deuterium-labeled internal standards ([d3M-H]-→[d3M-120]- for the TDA isomers and [d2M-H]-→[d2M-120]- for the MDA isomers). For chromatographic separation of the derivatives, gradient elution was performed from 20/80% (v/v) ACN/H2O to 60/40% (v/v) ACN/H2O in 10 min at a flow rate of 0.4 mL/min.
For the underivatized amines, the MS instrument was monitoring selected ions in the positive electrospray mode. Quantitative measurements were made by monitoring the reaction [MH]+ for the amines and for the corresponding deuterium-labeled internal standards ([d3MH]+ for the TDA isomers and [d2MH]+ for MDA). For chromatographic separation of the derivatives, gradient elution was performed from 80/20/0.05% (v/v/v) ACN/H2O/FA to 40/60/0.05% (v/v/v) ACN/H2O/FA in 6 min at a flow rate of 0.4 mL/min.
Generation of MDA and TDA by thermal treatment of foams
Thermal treatment
The foams were subject to thermal treatment to generate the quantities of TDA or MDA needed for the study as described by Raffel (2000) for TDI-based and by Krämer-Lucas and Raffel (2000) for MDI-based foams. In brief, pieces of foam (ca. 0.2 × 0.2 × 0.1 m3) were heated to temperatures of 150–200°C in an oven for durations of 1–5 h. After treatment, they were allowed to cool down to room temperature. After cooling, the foam samples were cut to the required size for testing and subsequently stored at ambient temperature.
To establish the time and temperature conditions necessary to produce the desired levels of diamines in foam, a series of foam samples was thermally treated covering the range of time and temperature conditions mentioned above, then were extracted to determine resulting amine levels. The results were used for initial migration testing as well as for determining suitable conditions for the preparation of the foam samples used in the emission and time-course migration tests.
Stability of the thermally generated diamines over time
The stability of the TDA and MDA generated by thermal treatment was evaluated over a 37-day time period. Fourteen pieces from the TDI-based foam were thermally treated at 185°C for 5 h. Similarly, 14 pieces of the MDI-based foam were treated at 165°C for 1 h. Duplicate extractions using the method described below were performed on Days 1, 2, 3, 4, 5, 10, and 37 after the thermal treatment.
Extraction of foams
Extraction of the foams was performed to determine the amount of TDA or MDA present after thermal treatment. The method was similar to the one used by Johnson et al. (2010) and EUROPUR (2021). The method avoids creating artifactual results that would originate from decomposition of the foam polymer matrix. On the other hand, the method is conservative, since part of any migrated diisocyanate would be detected and measured as the corresponding diamine under the prevailing acidic and dilute conditions. A brief summary is given hereunder.
Foam samples of approximately 5 g were weighed in 250 mL glass beakers. Fifty mL of 1% (w/v) AA in water (1% AA) was added as the extraction medium. The foams were agitated by repeated squeezing with a glass rod for 3 min. The agitation procedure was repeated every 15 min for 1 h, followed by transfer of the extract to a fresh 250 mL glass beaker. A fresh 50-mL quantity of 1% AA was added to the foam sample and the above-described extraction procedure was repeated. The second extract was combined with the first and the combined extracts were filtered through 0.45-μm PTFE filters (VWR, Radnor, PA, USA). Deuterium-labeled TDA or MDA isomers were added as internal standards, and TDA or MDA were determined using LC-MS/MS. The limit of quantitation (LOQ) of the method was 1 mg.kg−1 foam for each TDA and MDA isomer.
Emission testing
Sample collection
Thermal treatment conditions were varied to produce three foam samples with different diamine content for emission testing. Emission testing was performed as described by Karlsson (2023). This method allowed for the simultaneous but separate detection of diisocyanates and diamines, so that the potential presence of diisocyanates would not distort the diamine measurement. The emission cell design featured a minimized wall surface area exposed to the emitted atmosphere to reduce adsorption losses of semi-volatile organic compounds (SVOCs) such as the diisocyanates and diamines considered in this work. Karlsson (2023) found that <12% of the emitted quantity was adsorbed to the cell wall surface. Cylindrical pieces of thermally treated foam (150 mm diameter, 100 mm height) were placed into a FLEC® FL-2001 sample holder (Chematec, Roskilde, Denmark). A sampling chamber containing a 150-mm DHA-AA-impregnated glass fiber filter was mounted on top of the sample holder. A controlled air flow of 200 mL.min−1 (50% relative humidity) (FLEC Air Control 1000; Chematec, Roskilde, Denmark) was supplied to the sample chamber for a duration of 8 h (total air flow 0.096 m3). Emission testing was conducted at room temperature. DHA was used instead of DBA (ISO:17734-1:2013a) to reduce volatility and loss of the derivatizing agent during the test. After completion of the test, the glass fiber filter was removed, cut into four equal pieces that were each placed into separate test tubes containing 5 mL of TOL. The inner wall of the sample chamber that was exposed to the emission atmosphere was wiped with a 5 × 5 cm glass fiber filter moistened with 1% AA. The wipe filter was then placed into another test tube containing 5 mL of TOL.
Sample work-up and analysis
To each test tube, 3 mL of 5 mol.L−1 NaOH, 100 μL of diisocyanate internal standards, and 50 μL of diamine internal standards were added. The test tubes were then shaken for 5 min, sonicated for 10 min, and shaken again for 20 min to extract the diisocyanate derivatives and the diamines into the organic phase. After centrifugation for 10 min at 3000 r/min (1800 ×g) (Jouan C312, Jouan Industries, Saint-Herblain, France), the TOL phase was separated and transferred to a fresh test tube. A second extraction was performed on the remaining aqueous phases by adding an additional 5 mL of TOL to each test tube. The extraction procedure was repeated, and the TOL phase from the first extraction was combined with that from the second extraction for each of the different samples.
Volumes of 3 mL of 5 mol.L−1 NaOH, 10 μL of PYR, and 50 μL of ECF (see ISO 17734-2:2013b) were added to the test tubes containing the TOL phase (combined extracts) to derivatize the diamines present. The test tubes were shaken for 10 min and subsequently centrifuged at 3000 r/min (1800 ×g) for 10 min. The TOL phase was separated and transferred into a fresh test tube. The TOL solutions were then evaporated to dryness using a vacuum centrifuge (Model SC210A, Savant Instruments, Inc., Holbrook, NY, USA), reconstituted in 0.1 mL ACN, and sonicated prior to LC-MS/MS analysis. Calibration data for the diisocyanate-DHA derivatives and the diamine-ECF derivatives are provided in Supplemental Information 1.
Based on the described sample work-up (filter quarters and wall surface wipe samples), the LOQ (in terms of mass emitted per foam sample) and the corresponding emission rates (in parentheses) were 1.2 ng (0.008 μg.m−2.h−1) for 2,4-TDA, and 4.0 ng (0.03 μg.m−2.h−1) for 2,6-TDA. The TDA isomers were reported separately because they have different toxicity profiles: the 2,4-isomer being considered a carcinogen while the 2,6-isomer is not. For the MDA-isomers, the individual LOQ were 10.0 ng (0.07 μg.m−2.h−1) for 2,2′-MDA, 4.0 ng (0.03 μg.m−2.h−1) for 2,4′-MDA, and 4.0 ng (0.03 μg.m−2.h−1) for 4,4′-MDA. While the 2,4′-MDA isomer was shown to be negative in three genotoxicity screening tests (Unterberger-Henig, 2022), there is currently no conclusive evidence about its potential carcinogenicity. Hence, for a RA, the combined MDA-isomers have to be considered. In aggregate, the overall LOQ for the MDA-isomers was conservatively set at 10 ng (0.07 μg.m−2.h−1) based on 2,4′-MDA being the predominant extractable isomer (see Results).
Migration testing
Foam pretreatment
Thermal treatment conditions for the foams designated for the time-course migration testing were selected to achieve or slightly exceed the target TDA or MDA concentration of 5 mg.kg−1 that is used as a quality marker under the CertiPURTM label (EUROPUR, 2021). On the basis of the extraction data, the treatment conditions selected were 175°C during 5 h for the TDI-based foam, and 150°C during 1 h for the MDI-based foam.
Experimental set-up and sample collection
Migration testing was performed as follows. Foam cylinders of 45 mm diameter and 100 mm height were placed between two glass plates with a piece of light cotton fabric (Åhléns, Stockholm, Sweden) and two glass fiber filters, each moistened with 400 μL of 0.1% (w/v) AA in water (0.1% AA), on either end (see Figure 1). The sample thus prepared was then placed between two stainless steel plates and compressed to approximately 75% of its initial height (25% compression). Preliminary testing in the vertical position and with increased wetting of the glass fiber filters had shown a systematic difference between top and bottom samples (dripping) (results not shown). Therefore, final testing was performed with the set-up in the horizontal position and the filter wetting level described above, which produced consistent results. The cotton was included to estimate the effect of a mattress cover or bed sheet on migration. Collection of the samples from either side of the test set-up allowed for duplicate measurements. Migration test set-up. PU = polyurethane.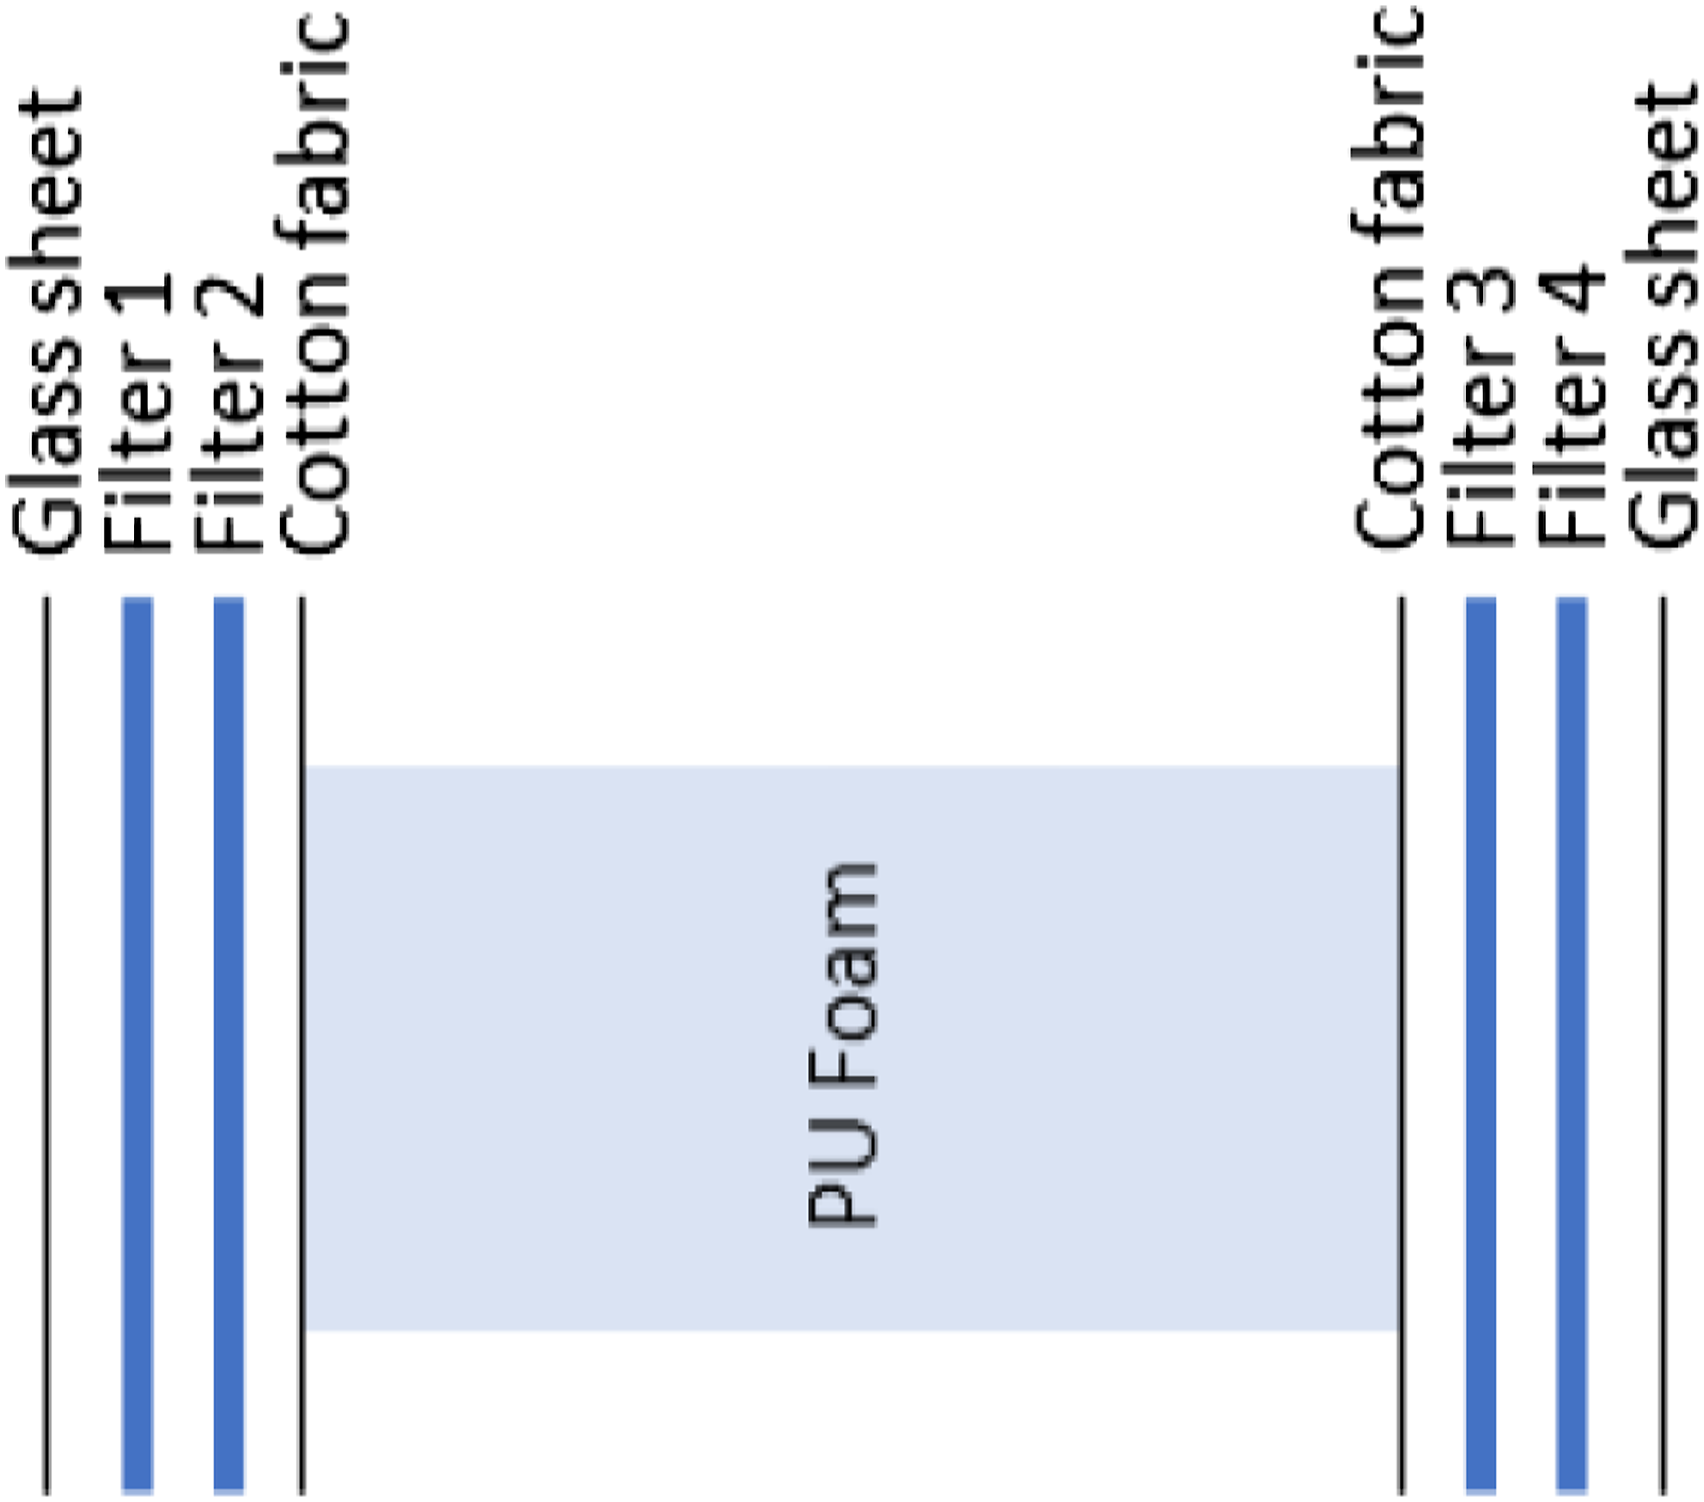
The migration test was performed for two consecutive 3-h periods. After the first 3-h period, the two glass fiber filters from either end were put into a vial containing 2 mL of 0.1% AA (2 samples). Similarly, the pieces of cloth from either end were put into a vial containing 0.1% AA (2 samples as well). Then, the test was continued for another 3-h period with fresh fabric and moistened glass fiber filters, after which the sample collection was repeated as described. The samples of each 3-h period were kept and analyzed separately.
Some preliminary tests were performed for 15 h on freshly prepared foam samples that were pretreated at temperatures between 150 and 200°C to verify that migration and diamine concentration could be correlated. For the preliminary tests, no cotton fabric was inserted.
Evolution of migration with time (“time-course” test)
Foam samples pretreated as described above were used to study migration of TDA or MDA from one foam sample over a more extended period of time. Using the same foam sample repeatedly, sequential migration tests were performed on Days 1, 2, 3, 4, 5, 10, and 35 after pretreatment for two consecutive 3-h periods as described above. In between test days, the samples were stored at room temperature.
Sample work-up and analysis
Sample preparation and analysis closely followed the procedure described by Marand et al., 2004. The vials containing the collected glass fiber filters or fabric were placed on a mechanical shaker for 30 min. The solutions were then filtered through 0.45-μm PTFE filters into fresh vials. An additional 2 mL of 0.1% AA was used to flush the filter and was collected in the same vial. A 1-mL aliquot of each sample was transferred into fresh glass vials, to which 100 μL of diamine internal standards, 5 mL of KH2PO4 solution, and 2 mL of TOL were added. The mixture was shaken for 10 min to extract the diamines into the organic phase. After centrifugation, the TOL phase was transferred into a fresh vial. The diamines were then derivatized by adding 20 μL of PFPA, followed by shaking the vial for a few seconds. Immediately thereafter, 2 mL of K2HPO4 solution was added and the vial was shaken for 10 min to extract the excess derivatizing agent into the aqueous phase. One mL of the TOL phase was transferred into a fresh vial, evaporated to dryness, and reconstituted with 0.1 mL of ACN prior to LC-MS/MS analysis. Calibration data for the diamine-PFPA derivatives are provided in Supplemental Information 1. The LOQ was 1 ng per sample for each diamine isomer, corresponding to a migration rate over each 3-h testing period of 0.2 μg.m−2.h−1.
Theoretical analysis
Emission
A plausibility check of the measured emission rates for TDA and MDA was performed based on their concentration in the thermally pretreated foam (extraction data) and vapor pressure (Macnab, 1999, 2000, 2001): • First, the molar fraction of TDA or MDA in the polymer, assuming a polymer molecular weight of 10,000 g.mol−1, was calculated; • Next, the saturated vapor pressure (assuming ideal behavior) was calculated using Raoult’s law.
The calculation sheet is available in Supplemental Information 2.
Migration
The plausibility of the evolution with time of the measured migration rates of TDA and MDA was performed based on a theoretical model based on Fick’s law of diffusion and two conservative assumptions: • The foam slab was considered to be infinite (i.e., there is an infinite reservoir of diamine available); • Migration to the receiving phase was assumed to be unhindered by any equilibrium or mass transfer phenomena (i.e., any diamine reaching the interface between the foam and the receiving phase would immediately be transferred into the receiving phase).
A description of the model is given in Supplemental Information 3. The model is similar to the one described by OECD (2009) for emission modeling.
Results
Formation of TDA and MDA from thermal treatment of the foams
Average concentrations of the TDA isomers generated in the foam after thermal treatment for 5 h at various temperatures are shown in Figure 2. Extractable TDA levels increased with the pretreatment temperature from ca. 6 mg/kg at 165°C to over 30 mg/kg at 200°C. Based on these data, the three samples for the emission testing were prepared by 5-h thermal pretreatment at 165–185°C to achieve a suitable range of TDA concentration and emission potential. Extractable amounts in the thus prepared foam samples were up to 9.2 mg.kg−1 of 2,4-TDA and 6.0 mg.kg−1 of 2,6-TDA (maximum 15.2 mg.kg−1 TDA in aggregate). The sample for the time-course migration test was prepared by 5-h pretreatment at 175°C, targeting extractable TDA concentrations at or slightly exceeding the 5 mg.kg−1 limit. Extractable amounts in this sample were 3.7 mg.kg−1 of 2,4-TDA and 1.4 mg.kg−1 of 2,6-TDA (total 5.1 mg.kg−1). The predominance of the 2,4-isomer is in agreement with the 60/40 distribution observed by Raffel (2000). The TDI-based foam which had not been thermally treated showed both TDA-isomers to be <1 mg.kg−1 foam (<LOQ). Concentration of TDA isomers in TDI-based foam samples treated at 165–200°C for 5 h * = average of two measurements; values < LOQ (limit of quantitation) included as ½ LOQ. TDA = toluene diamine; TDI = toluene diisocyanate.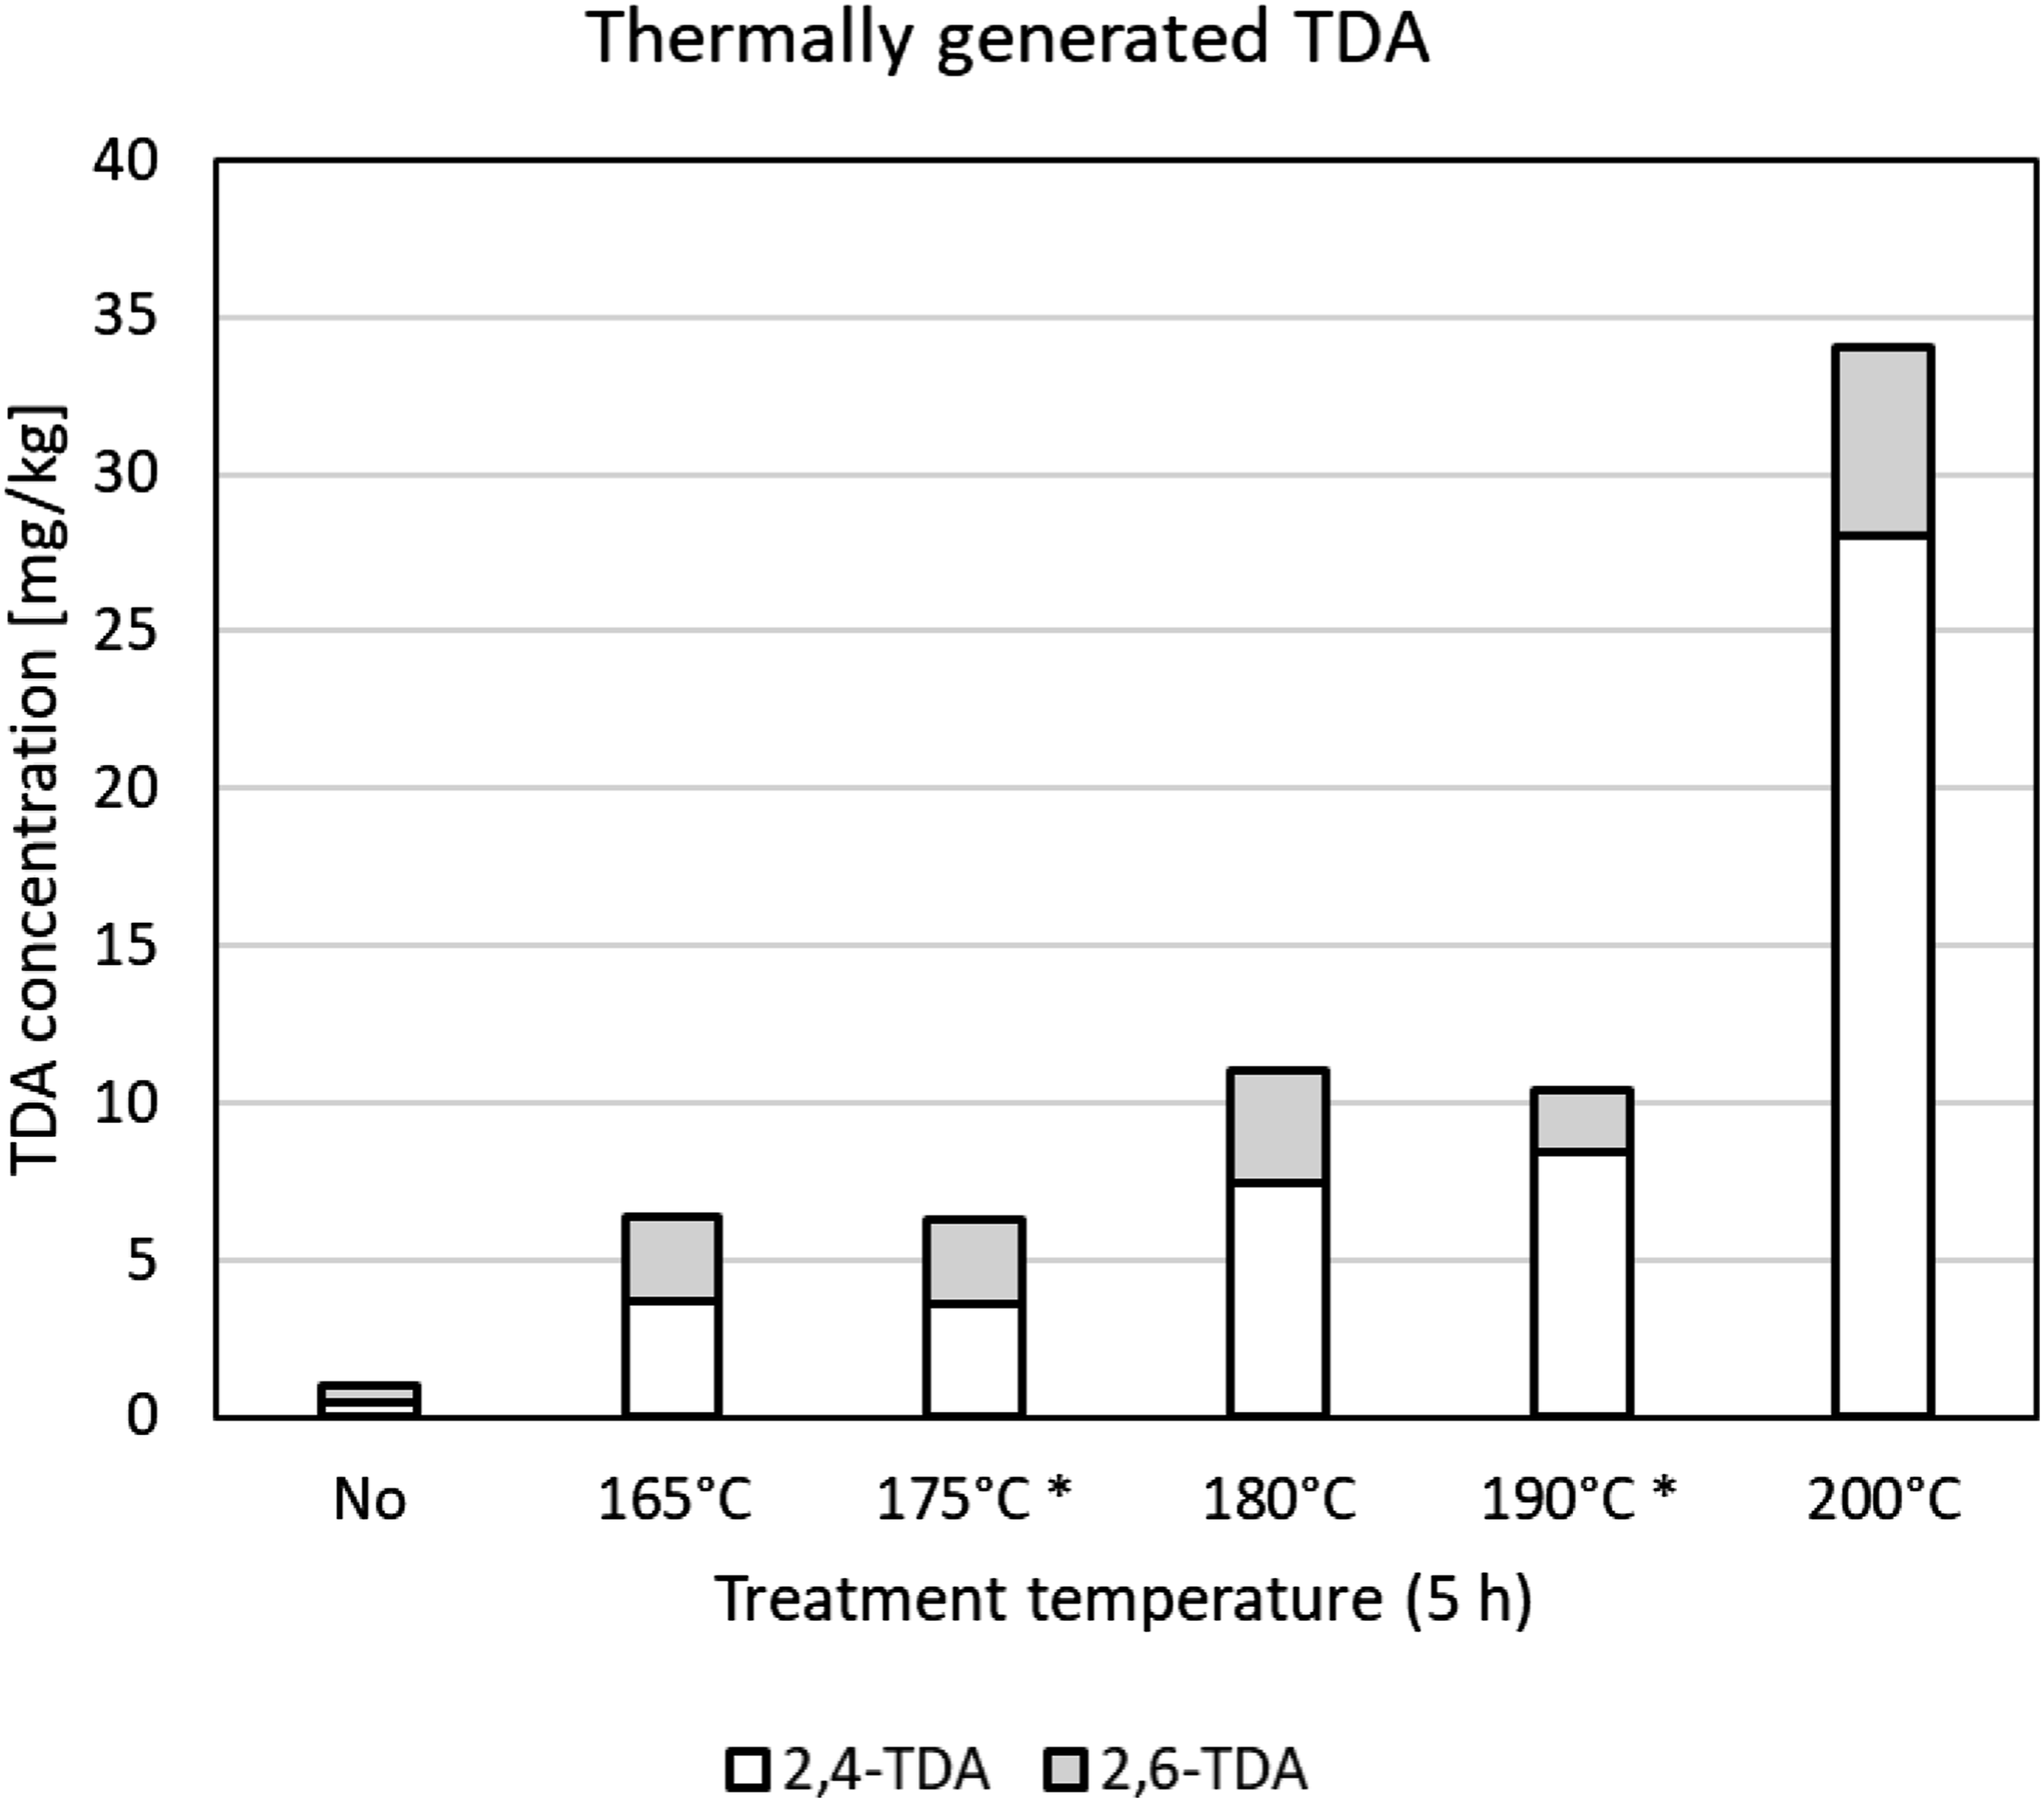
The concentrations of the MDA isomers generated in the foam after thermal treatment (typically for 5 h) at various temperatures are shown in Figure 3. At 165°C, total extractable MDA already reached an 85 mg/kg level. Pretreatment temperature and duration had to be reduced to arrive at MDA concentrations closer to the target of 5 mg.kg−1. Two foam samples for the emission testing were eventually made by a 1-h thermal treatment at 150–165°C to achieve a suitable range of extractable MDA content. Extractable amounts in the thus prepared emission test foam samples were up to 6.3 mg.kg−1 of 2,2′-MDA, 17.0 mg.kg−1 of 2,4′-MDA, and 7.6 mg.kg−1 of 4,4′-MDA (maximum 27.0 mg.kg−1 of MDA in aggregate
4
). The specific foam sample used for the migration testing was produced by a 1-h treatment at 150°C and contained 2.8 mg.kg−1 of 2,2′-MDA, 7.6 mg.kg−1 of 2,4′-MDA, and 7.6 mg.kg−1 of 4,4′-MDA (total 18.0 mg.kg−1) for the preliminary test, and 1.5 mg.kg−1 of 2,2′-MDA, 10.2 mg.kg−1 of 2,4′-MDA, and 2.4 mg.kg−1 of 4,4′-MDA (total 14.1 mg.kg−1) for the time-course test. The 2,4′-MDA isomer was the predominant one in all samples, in agreement with the observations of Krämer-Lucas and Raffel (2000) who, on average, found 62% the MDA to be the 2,4′-isomer. The MDI-based foam without thermal treatment was used for a third emission test and showed a total MDA concentration of 3.8 mg.kg−1. Concentration of MDA isomers in MDI-based foam samples treated at 165–190°C for 5 h * = 1 h treatment; values < LOQ (limit of quantitation) included as ½ LOQ. MDA = methylene dianiline; MDI = methylenediphenyl diisocyanate.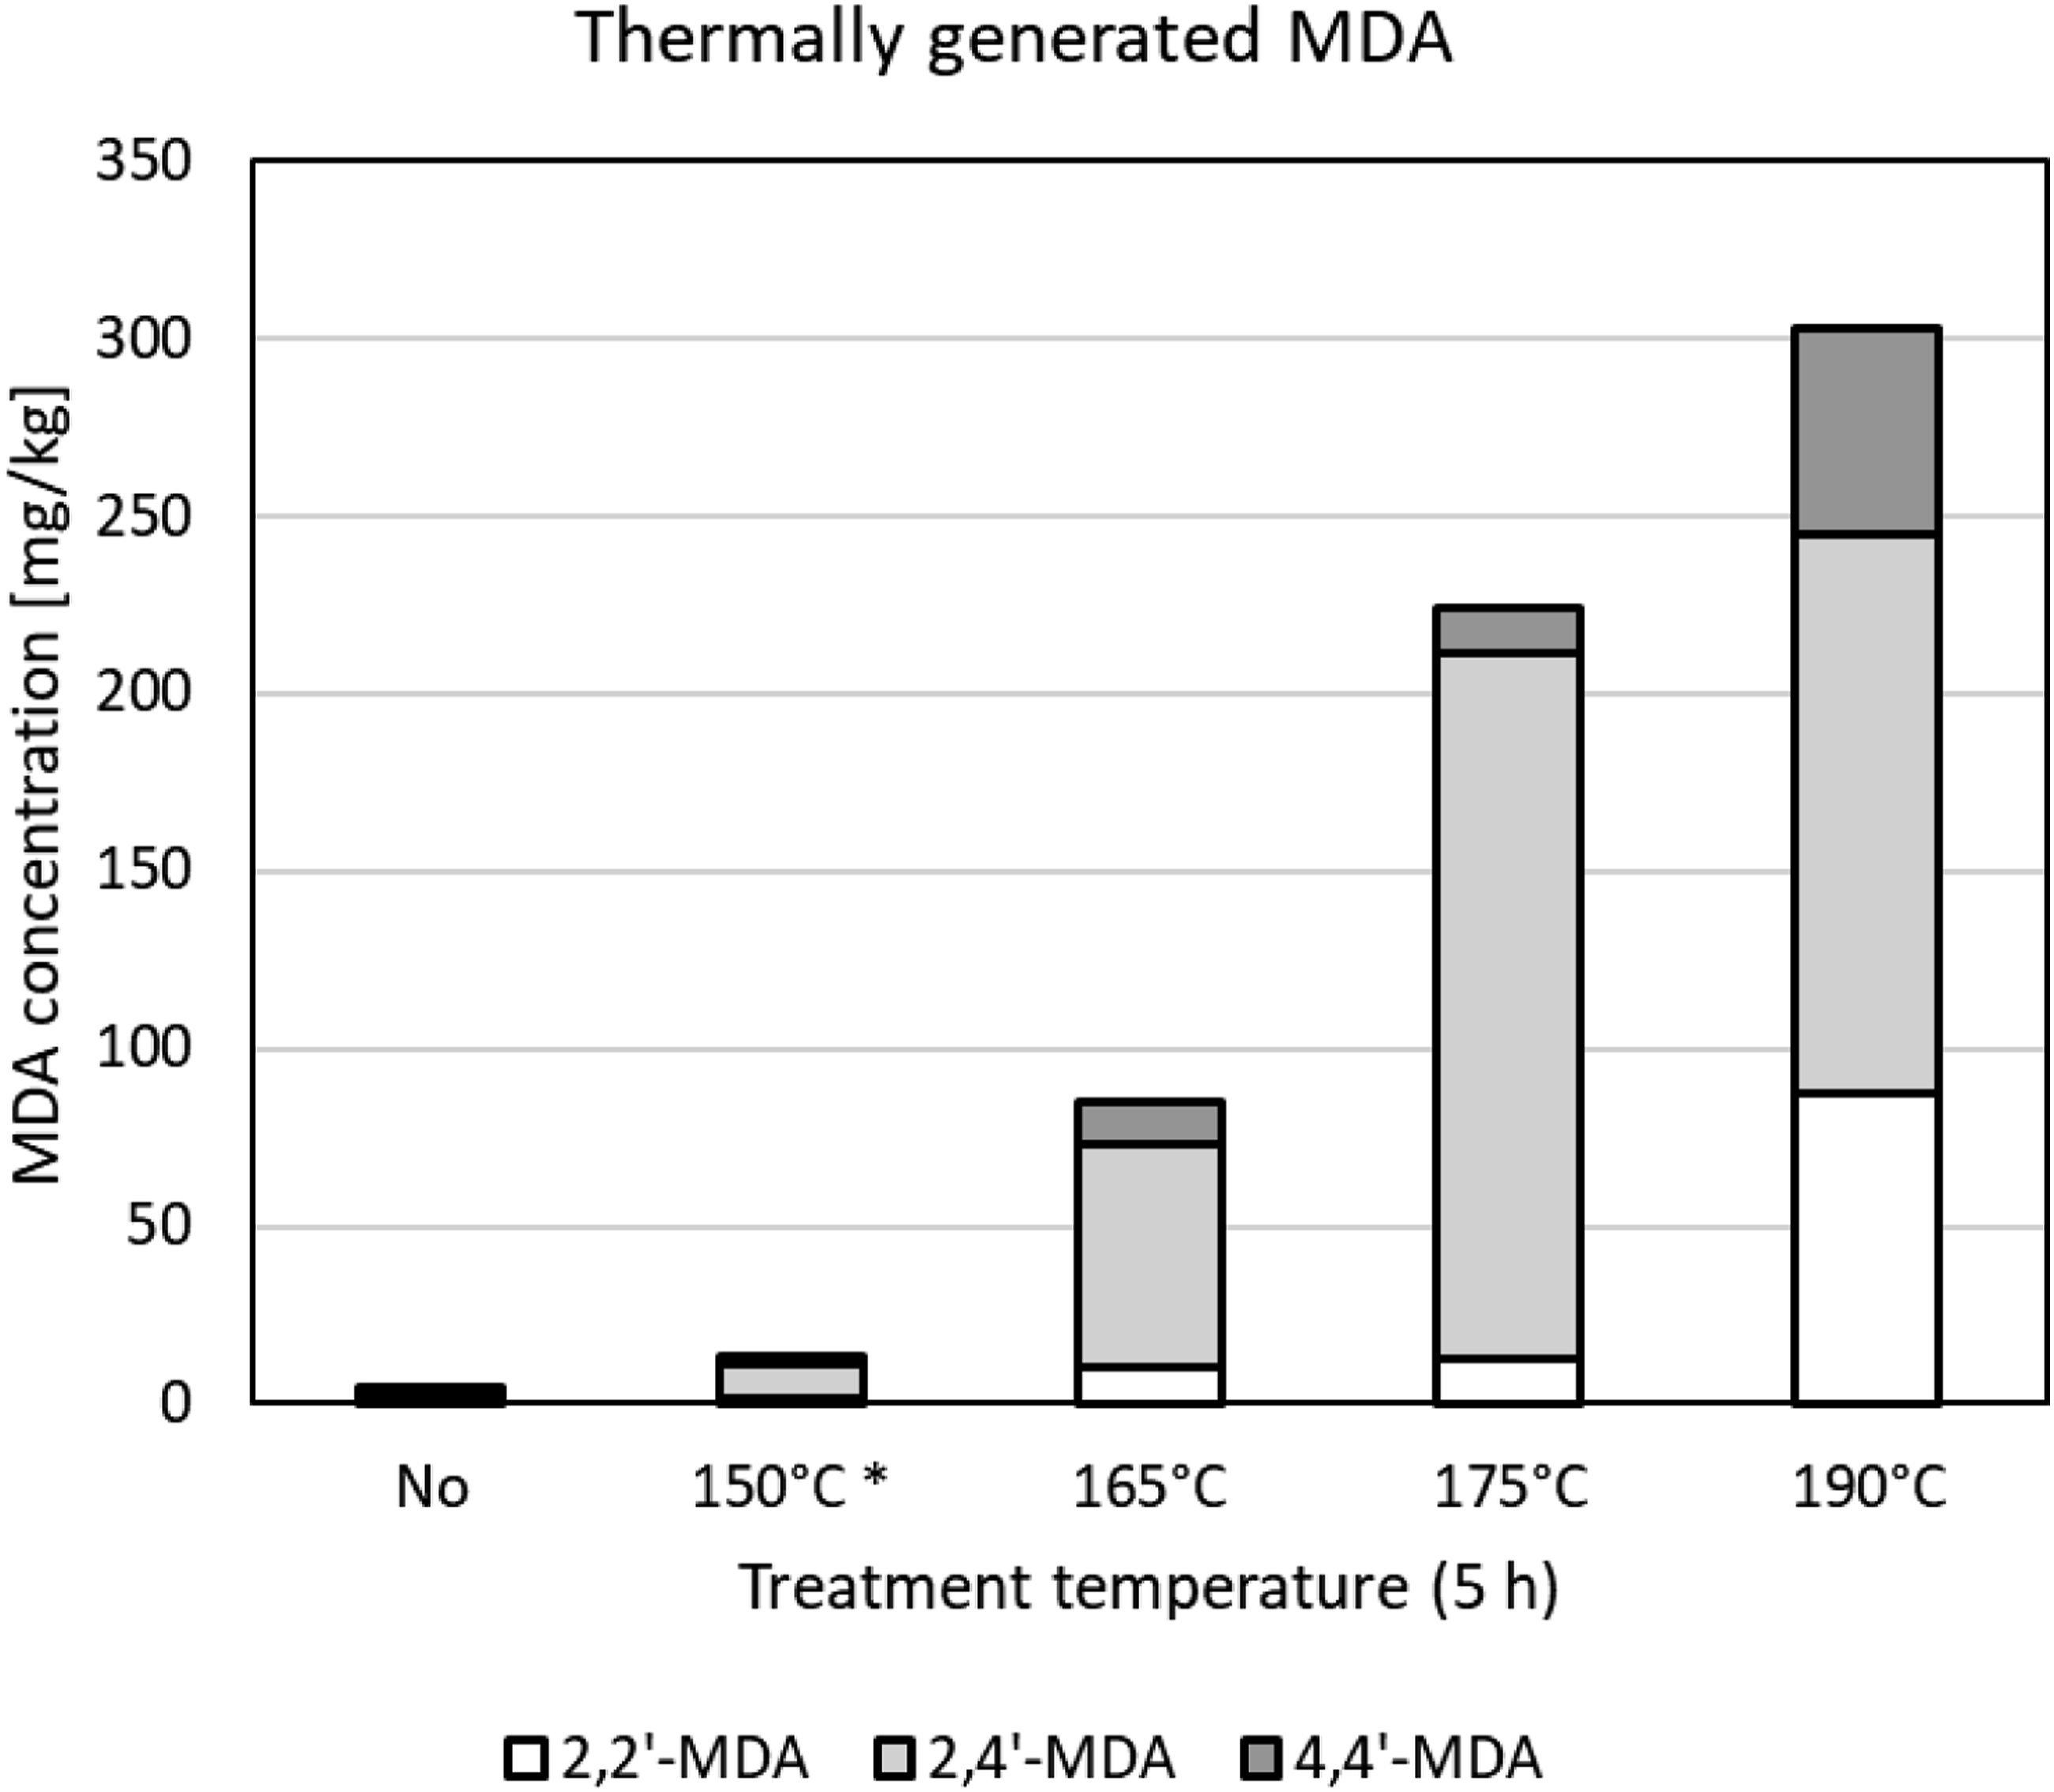
The concentrations of the thermally generated TDA and MDA were found to be sufficiently constant for the intended test purpose over a 37-day period, as shown by the example in Figure 4. The standard deviation on the 14 measurements was approximately 20% of the average value, similar to what was observed by Krämer-Lucas and Raffel (2000) and Raffel (2000). No outliers were identified. Regression coefficients (r2) of concentration versus time were 0.22 for 2,4′-MDA, 0.32 for 2,6-TDA, and ≤0.06 for the other diamines. Evolution of extractable concentrations of the TDA- and MDA-isomers as a function of time after thermal treatment. The TDI-based foam was heated at 185°C for 5 h to generate the TDA. The MDI-based foam was heated at 165°C for 1 h to generate the MDA. Foam samples were stored at room temperature prior to extraction. MDA = methylene dianiline; MDI = methylenediphenyl diisocyanate; TDA = toluene diamine; TDI = toluene diisocyanate.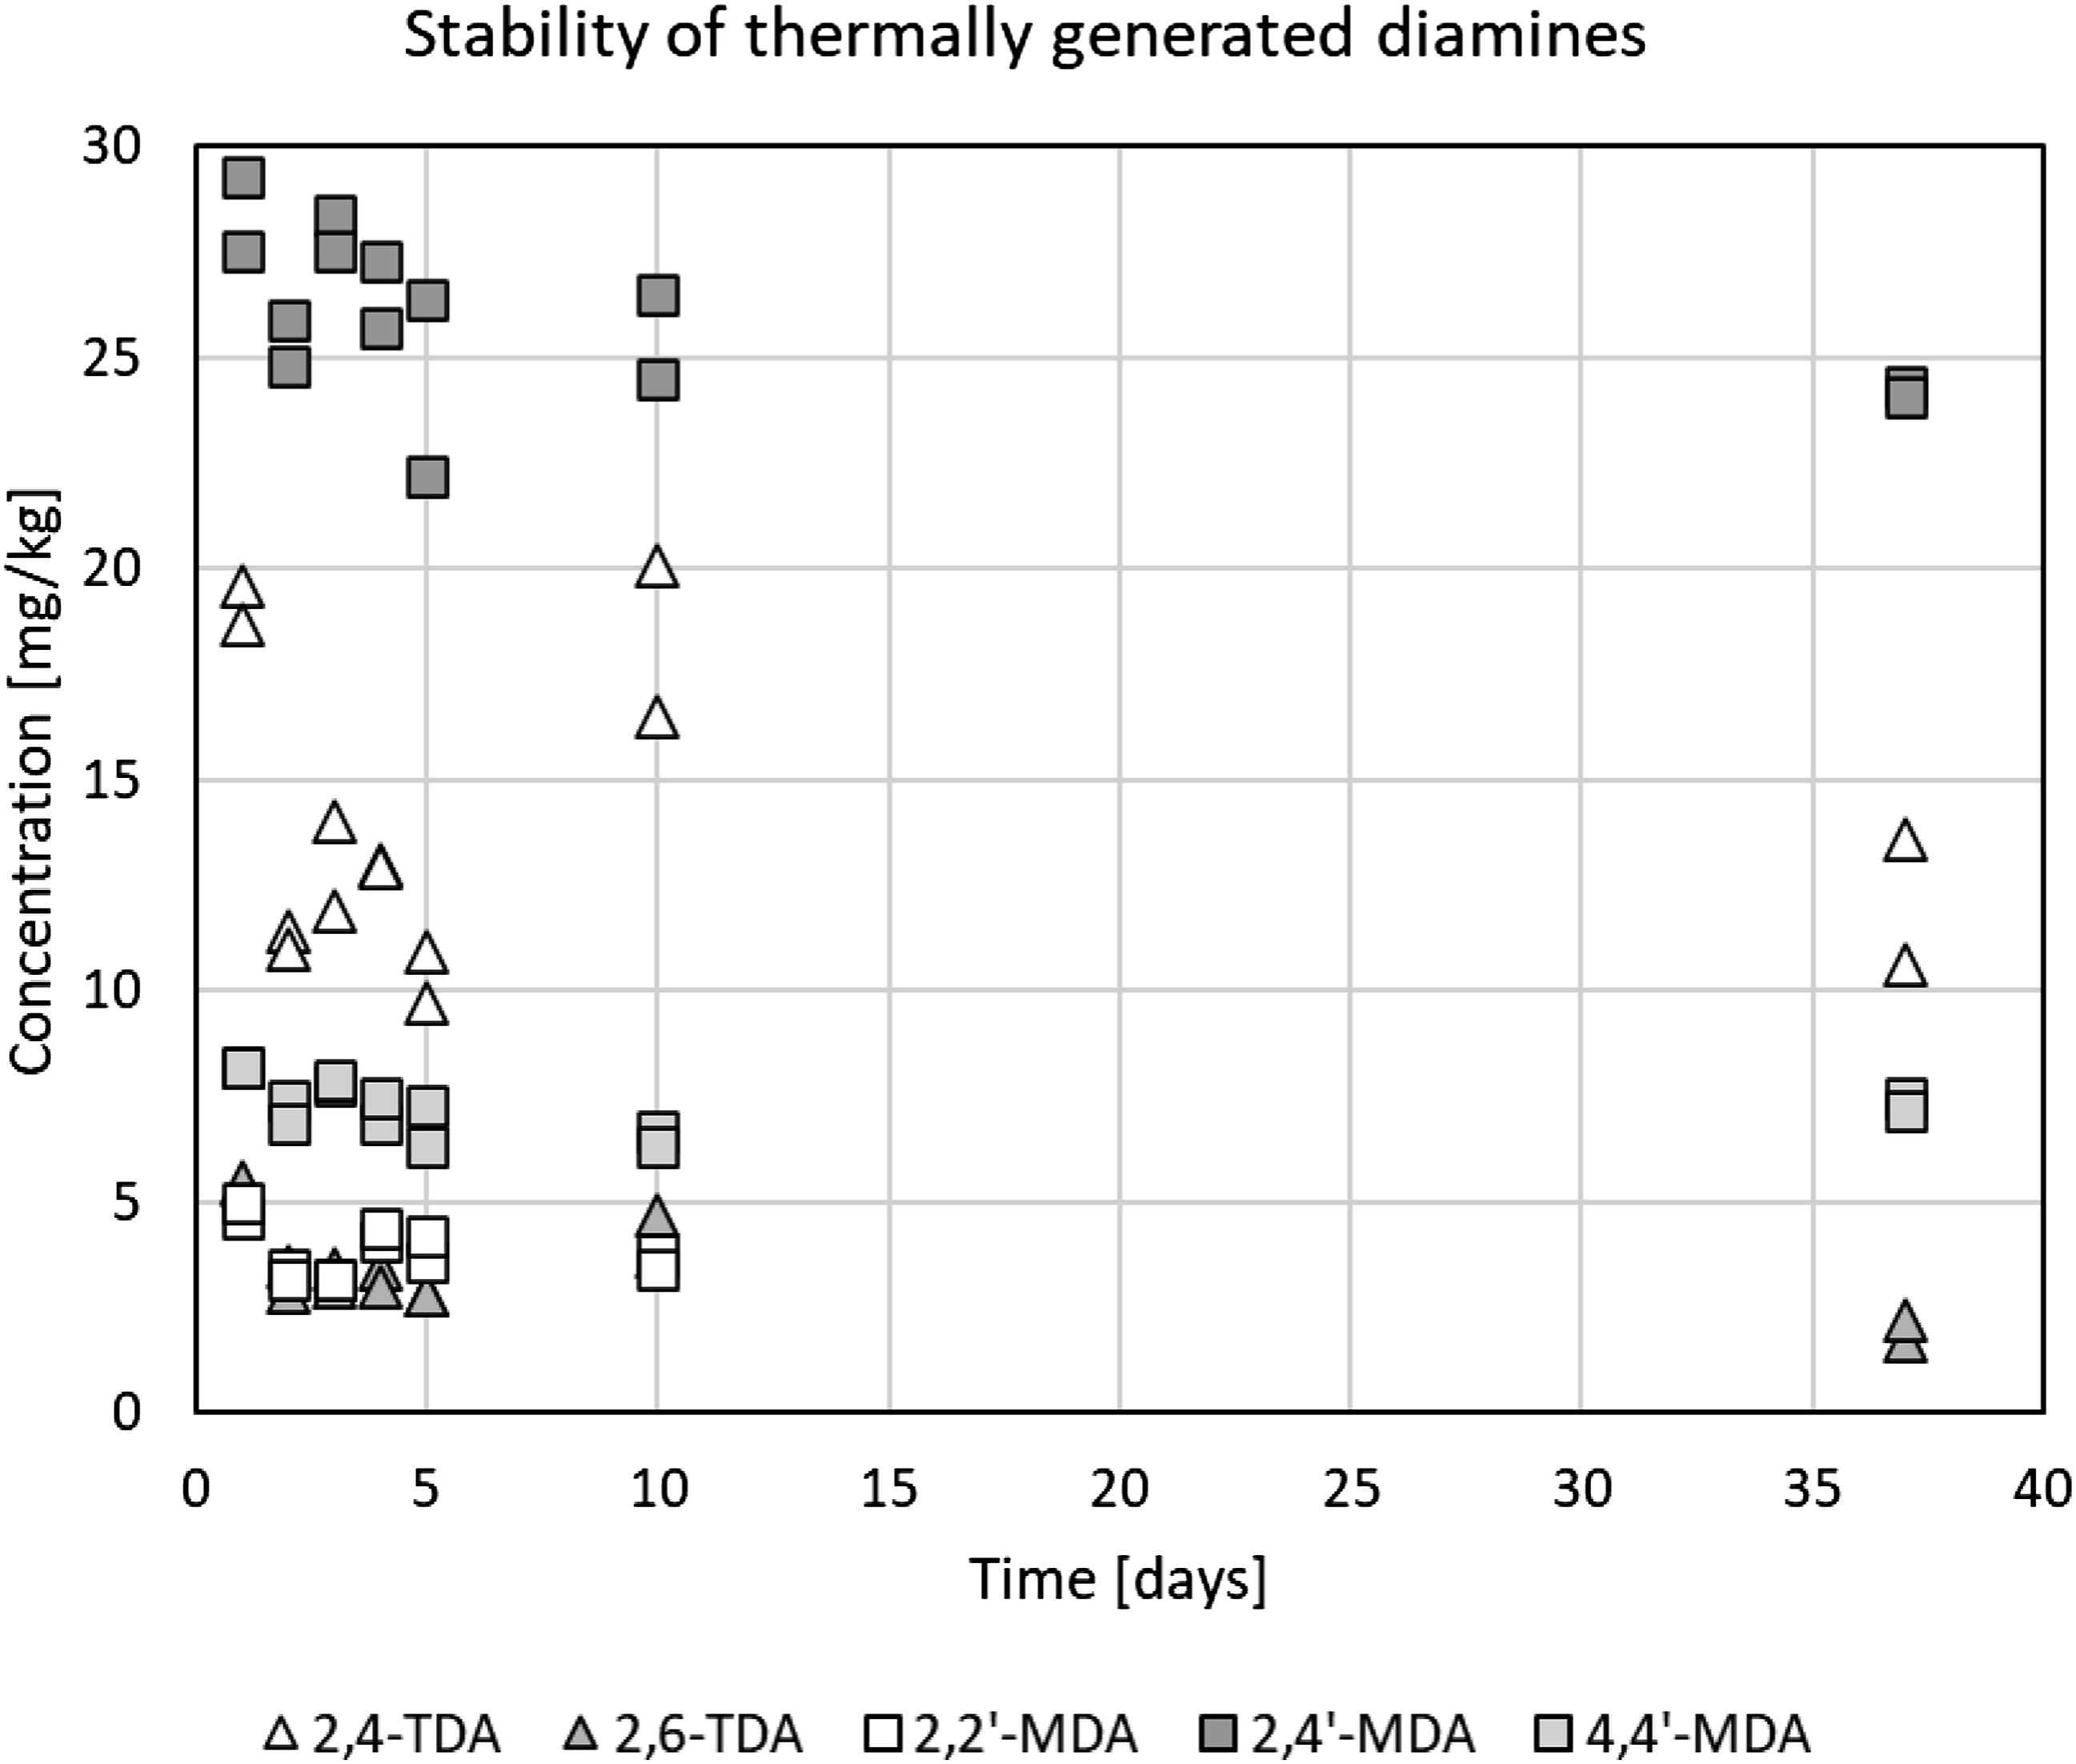
Emission testing
After 8 h of emission testing, none of the TDA or MDA isomers could be detected at their respective LOQ (see Methods). For 2,4- and 2,6-TDA, this corresponded to maximum emission rates of 0.008 and 0.03 μg.m−2.h−1 for samples containing up to 9.2 and 6.0 mg.kg−1, respectively. For the combined 2,2’-, 2,4′- and 4,4′-MDA isomers, this corresponded to a maximum emission rate of 0.07 μg.m−2.h−1 for samples containing up to a total of 27.0 mg.kg−1 of MDA.
While not the prime purpose of this work, some data on diisocyanate emission have been recorded as well. These are reported in Supplemental Information 4.
Migration testing
The results (average of top and bottom samples taken as one result) of the preliminary 15-h migration tests with TDI-based foams are shown in Figure 5. In line with theory (Supplemental Information 3) but subject to some variance, there is a linear relationship between migration rate and the concentration of thermally generated TDA in the foam samples (regression coefficients (r2) were 0.69 and 0.78). From the sample containing comparable total TDA (6.4 mg.kg−1) and the one used for the time-course test (5.1 mg.kg−1), an average of 11.5 ng of 2,4-TDA and 10.5 ng of 2,6-TDA migrated onto the glass fiber filters in the 15-h period. During the preliminary 15-h test with the MDI-based foam (thermally treated at 150°C for 1 h), an average of 3 ng of 2,4′-MDA migrated onto the glass fiber filters. The 2,2′- and 4,4′-MDA isomers were ≤1 ng (LOQ). MDA is obviously less mobile than TDA, and 2,4-TDA appears to be less mobile than 2,6-TDA. Quantity of TDA isomers migrated from thermally treated TDI-based foam samples. Average of top and bottom samples during 15-h migration tests on 45-mm diameter samples. TDA = toluene diamine; TDI = toluene diisocyanate.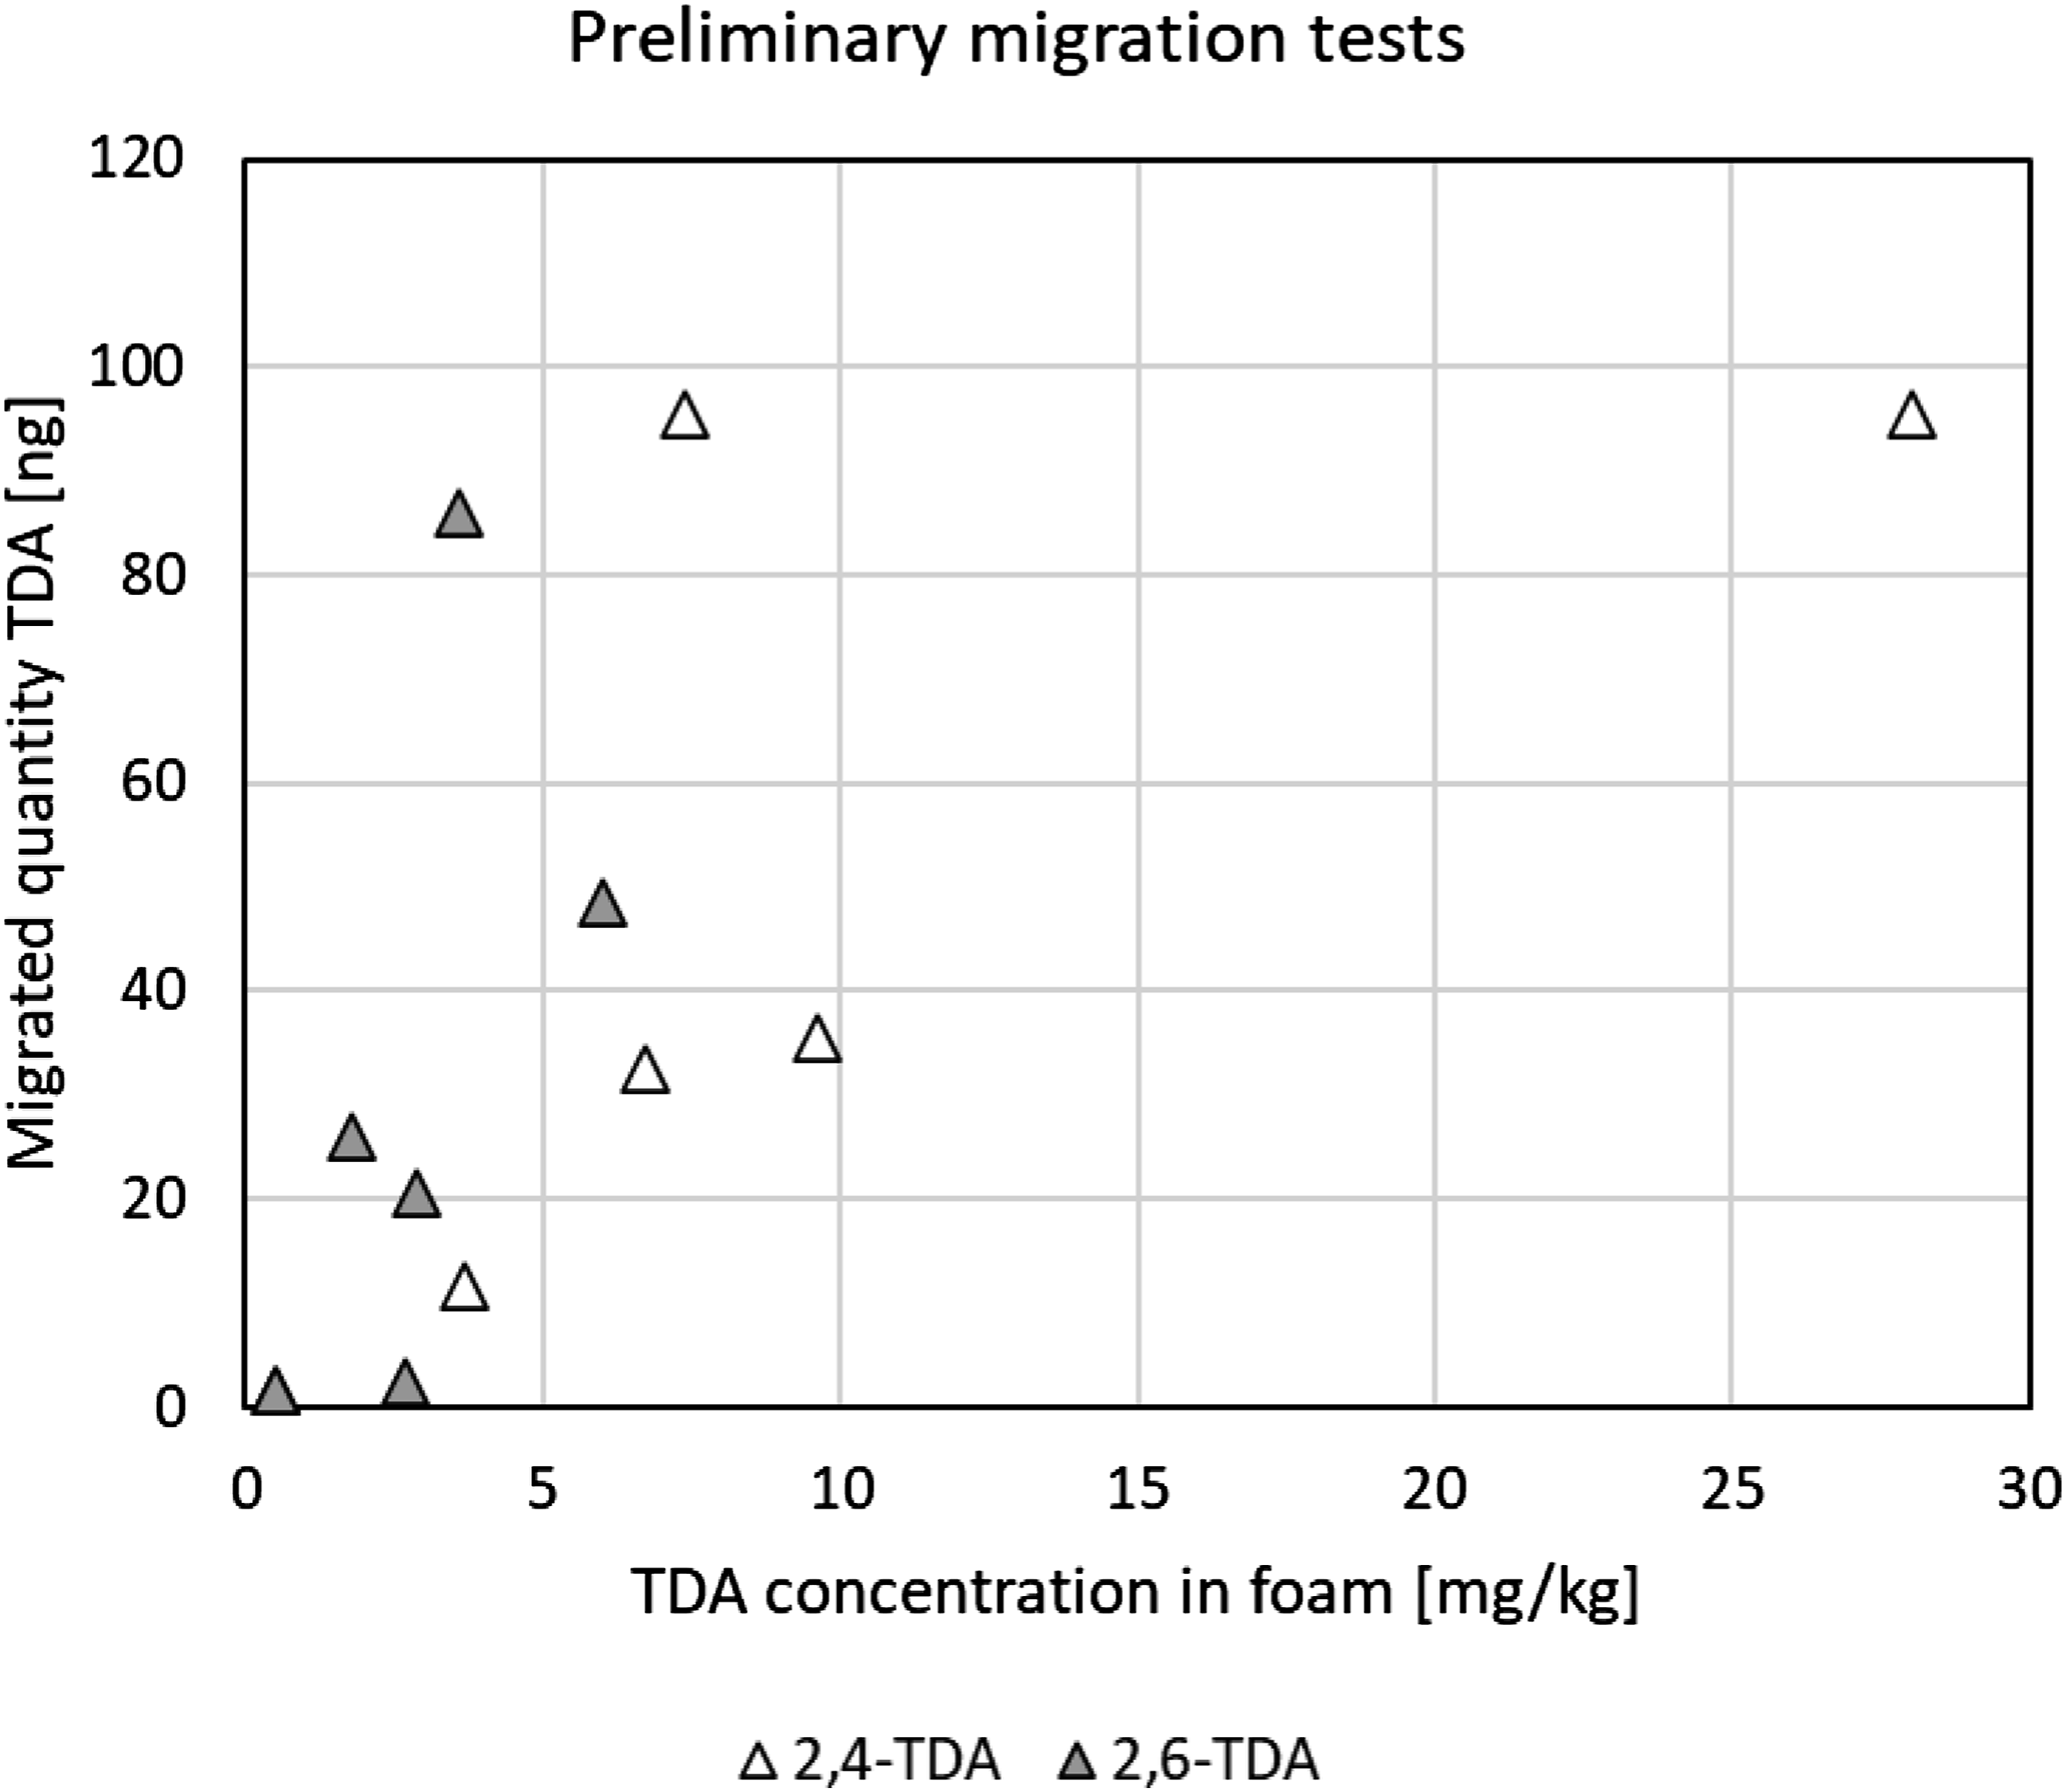
The time-course migration test with the MDI-based foam resulted in a maximum migration of 1 ng of 4,4′-MDA and 3 ng of 2,4′-MDA during the first 3-h period, and of 1 ng of 2,2′-MDA and 2 ng of 2,4′-MDA during the second 3-h period on Day 1. On Day 2, only 1 ng of 4,4′-MDA was detected in one the two test periods. All samples from the other test period and other isomers were <LOQ. On all subsequent days (Day 3–35), all three MDA isomers remained < LOQ for all samples. The total of 3–4 ng migrated MDA corresponds well with the 3 ng that migrated during the preliminary 15-h test. Of the detectable MDA, an average of 78% were found on the cloth and 22% on the glass fiber filters.
The results of the time-course test with the TDI-based foam are shown in Figure 6 for 2,6-TDA. After an initial peak of 15–18 ng of 2,6-TDA migrated during the first 3-h period, a quick drop in migration to 3 ng was observed already during the second 3-h period of testing on Day 1. The combined migration of ca. 20 ng corresponds well with the 21 ng observed during the 15-h preliminary test with a foam with comparable total TDA content. On Days 2 and 3, detectable migration was limited to 1–2 ng per test. For the 2,4-TDA isomer, traces at a level below but close to the LOQ could only be detected during the first 3-h test period. Other samples during Days 1–3 were clearly <LOQ. On Days 4–35, both TDA isomers remained <LOQ for all samples, confirming the rapid decrease in migration flow as time progresses. Of the detectable TDA, an average of 34% were found on the cloth and 66% on the glass fiber filters. Evolution of migrated 2,6-TDA (toluene diamine) as a function of time after start of the time-course test. All measurements were <LOQ (limit of quantitation) on Days 4, 5, 10 and 35. Values <LOQ were included as ½ of the LOQ (blue line). Three-hour tests on 45-mm diameter samples. The power curve represents the theoretical t−0.5 dependency (t = time).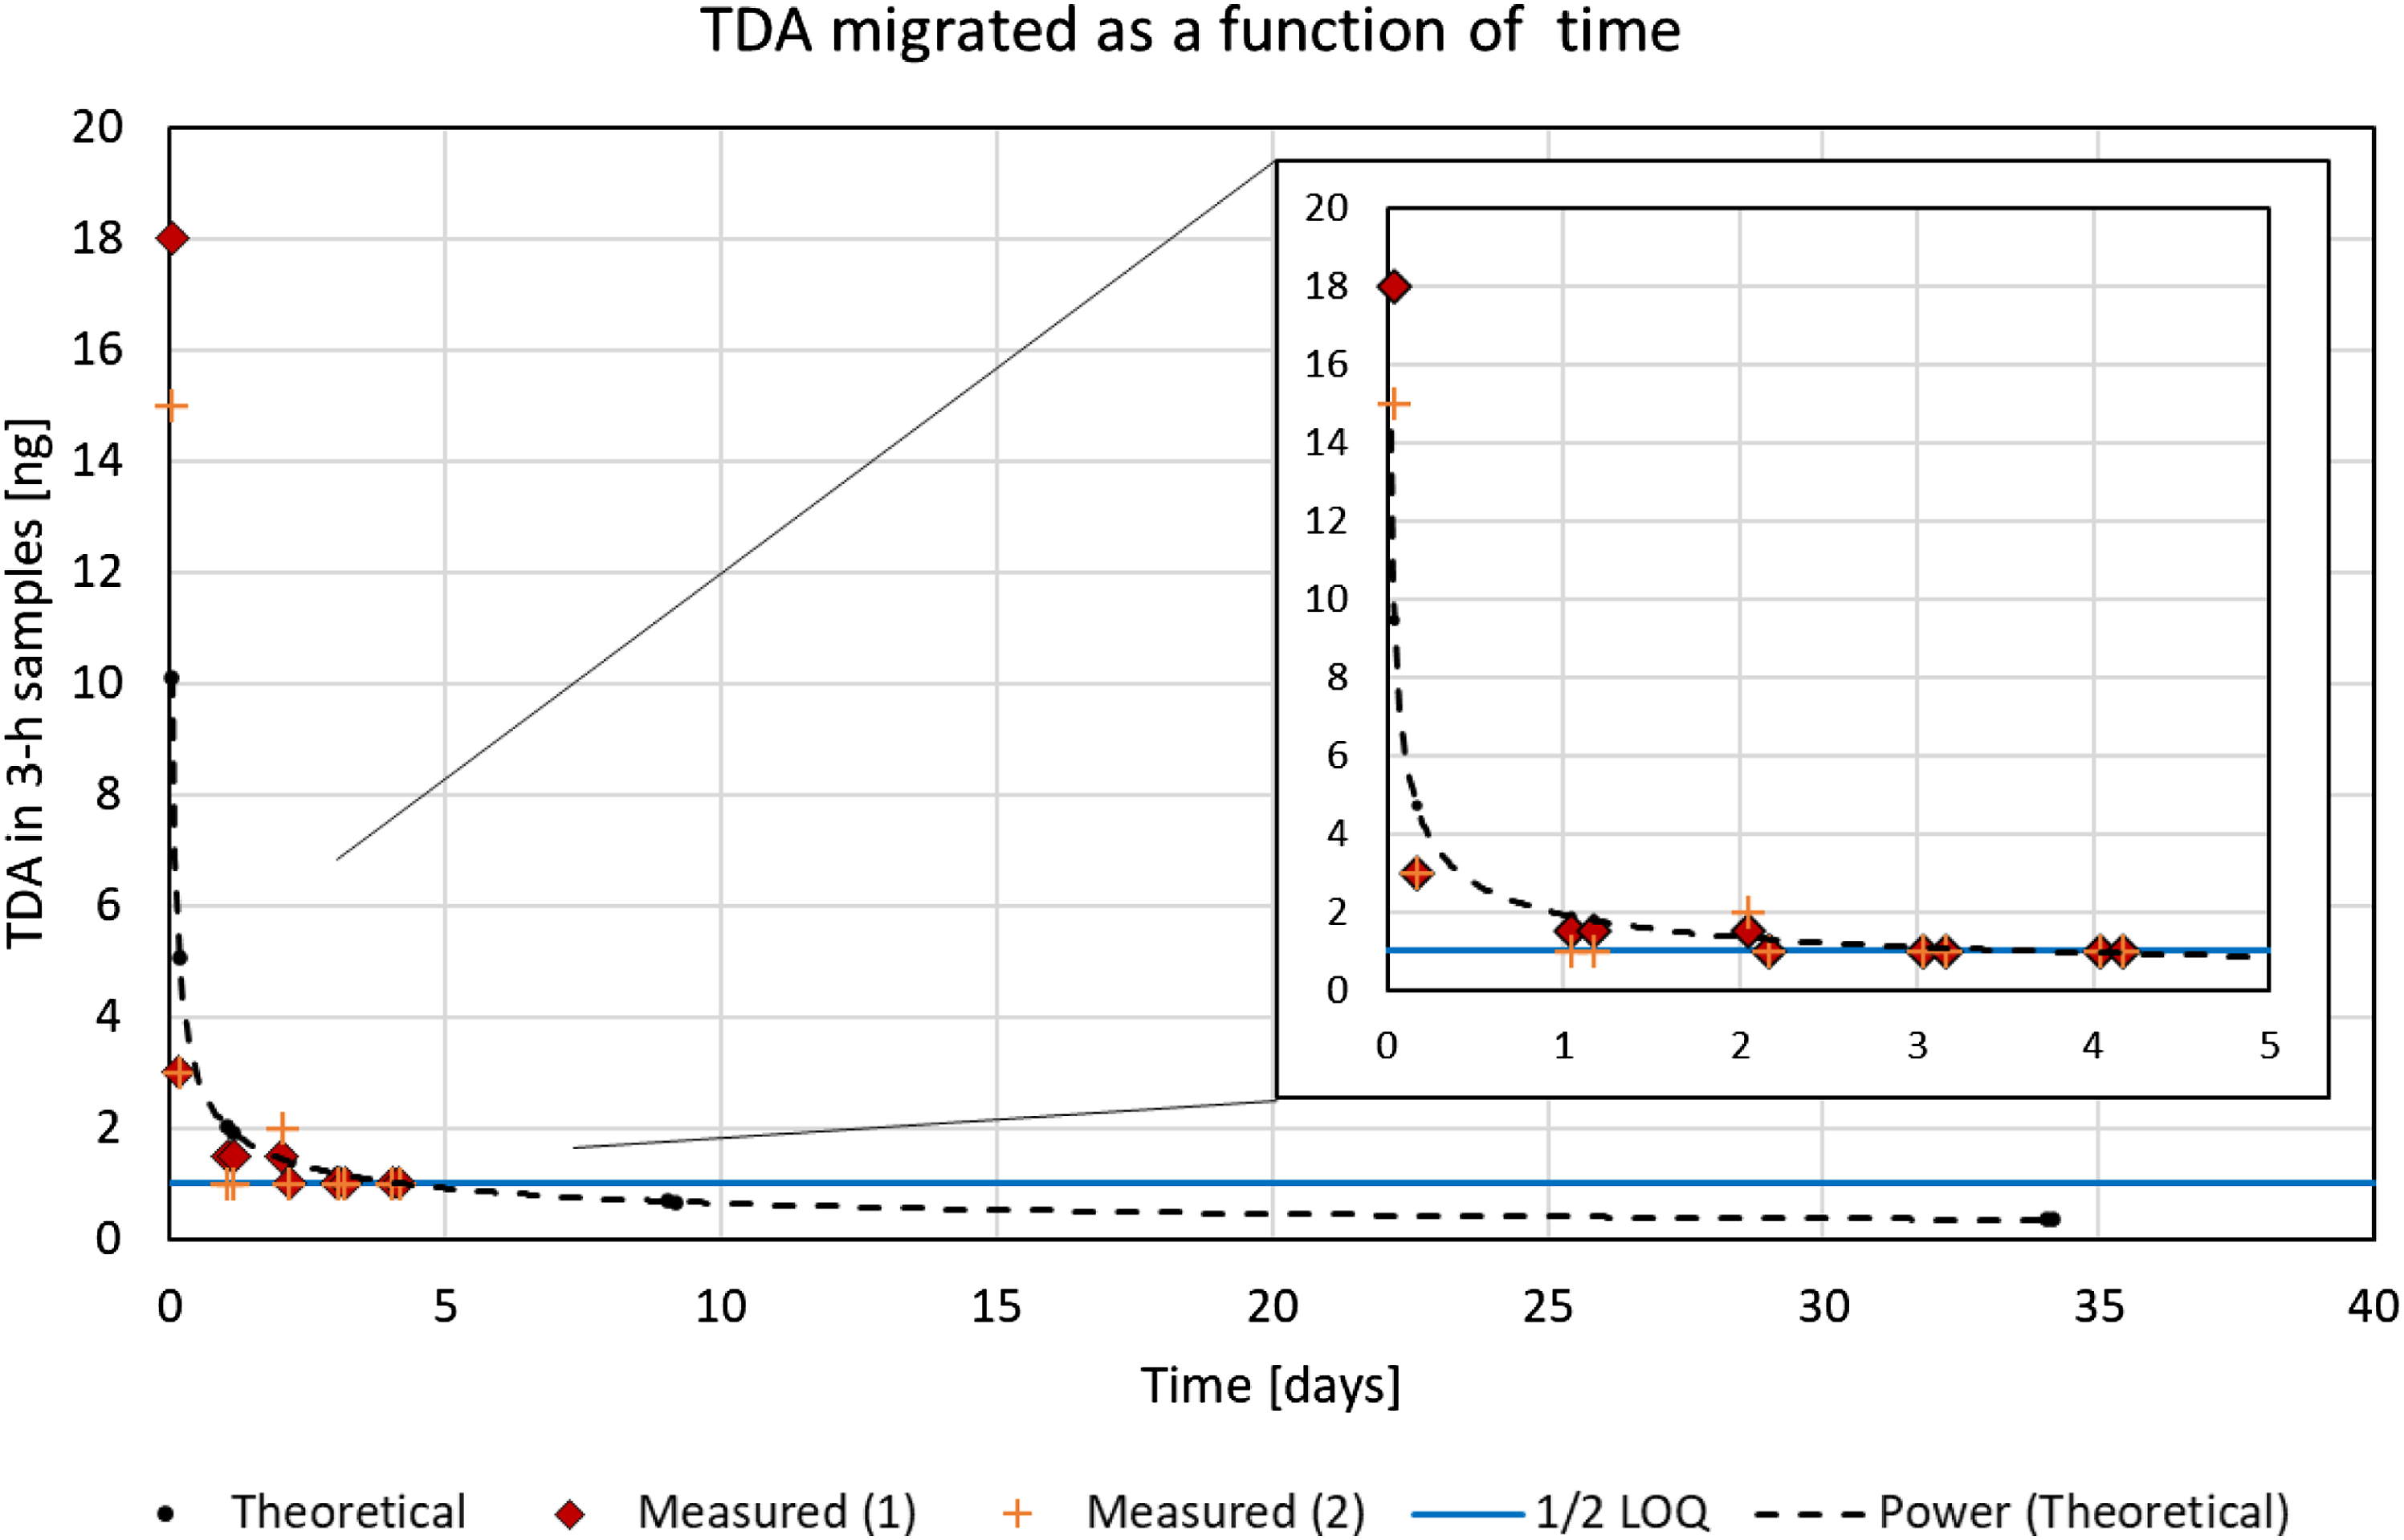
Discussion
Thermal generation of diamines
Diamines were generated by thermal treatment of the PU foams (Krämer-Lucas and Raffel, 2000; Raffel, 2000). Diamine formation is triggered by decomposition of allophanates (starting above 112°C according to Joel et al., 1984) followed by the scission of a urethane bond. For the final emission and migration tests, temperatures around the very onset of the decomposition of the urethane bonds were used (e.g., for MDI-based foams, 150°C according to Joel and Hauser, 1994) to target diamine levels of approximately 5 mg.kg−1 and to minimize affecting the PU polymer structure and consequently the migration properties of the foam samples. While thermal generation of diamines is prone to generate some isocyanate groups as well, it is well-known that these disappear very rapidly after administration, even when using solvent extraction techniques (Gagné et al., 2003; Jedrzejczak and Gaind, 1993). Schmidtkunz (2012) showed that recovery of deuterated TDI from a foam immediately after spiking was <10% for concentrations in the mg/kg range (see Supplemental Information 6). Donchenko et al. (2020) could not detect extractable isocyanate from foams using (acidic) artificial sweat solutions containing a derivatizing agent. Interference of any diisocyanates present with extracting the diamines with an aqueous extraction solution without derivatizing agent should therefore not be expected.
Extraction of foams
In this work, care was also taken to use sampling and analysis methods that did not cause decomposition of the polymer matrix (Brunet et al., 2018; Donchenko et al., 2020; Johnson et al., 2010). Two consecutive extractions were used, as was done by Hillier et al. (2001). The current CertiPURTM certification requires four consecutive extractions (EUROPUR, 2021). Hence, the method employed is conservative as it may underestimate extractable diamine concentrations and thereby overestimate the emitted or migrated diamine resulting from a given extracted diamine level. As shown by our measurements, diamines were detected in some cases as impurities at low levels in cured foam that had not been thermally treated (Figures 2 and 3). The CertiPURTM quality system requires aromatic amines to be < 5 mg.kg−1 foam. Assuming that indoor dust contains a significant fraction of PU particles, the TDA and MDA concentrations (LOQ-2.4 mg.kg−1) measured by Chinthakindi and Kannan (2021) and Chinthakindi et al. (2022) seem to indicate agreement, although other household articles such as cooking utensils, for instance, have been identified as potential sources of exposure to MDA as well (Trier et al., 2010; VKM, 2006).
Emission testing
It is quite costly and disruptive to intentionally produce out-of-specification foams with elevated diamine content in industrial manufacturing facilities. Therefore, to investigate emission and migration, recourse was taken to thermal induction of TDA or MDA in foam. While this method may constitute a potential limitation of this study, it is the only practical way to obtain foams with homogeneously distributed, elevated and controllable TDA and MDA concentrations. For emission testing, a TDI-based flexible polyether foam was subjected to thermal treatment at 165–185°C for 5 h, and an MDI-based viscoelastic polyether foam was treated at 150–165°C for 1 h. The TDI-based foam samples thus treated contained up to 9.2 and 6.0 mg.kg−1 of 2,4- and 2,6-TDA, respectively. The MDI-based foam samples contained up to 27.0 mg.kg−1 of MDA. The purposely generated TDA and MDA concentrations were shown to be stable over a 37-day period (Figure 4).
The emission testing employed a method suitable for the simultaneous measurement of diisocyanates and diamines (Karlsson, 2023) to avoid interference due, for instance, to diisocyanate hydrolysis on acid-treated filters used to detect diamines (HSE, 2014). All emission values were reported to be <LOQ, corresponding to emission rates between 0.008 and 0.07 μg.m−2. h−1 for the TDA and MDA isomers. For MDA, this is consistent with the results of Karlsson et al., 2022, who have shown that the saturated vapor concentration of MDA above a curing PU containing 2 mg.kg−1 MDA did not exceed 2 ng.m−3. In addition, the plausibility check presented in Supplemental Information 2 confirmed that no values >LOQ should be expected for MDA. Using Raoult’s law (Supplemental Information 2), TDA emission would be significantly overestimated compared to the values actually measured. This illustrates that TDA and MDA are not very mobile and are not easily released into the air from the solid polymer matrix in which they are embedded. The potential for H-bond formation between the amino groups of the diamines and the O-atoms of the urethane chains may be an important underlying factor.
Non-detectable emissions of diamines were also observed in a comprehensive survey of indoor air quality in an energy efficient “Passive House” project demonstrating a variety of possible PU applications (Ahrika, 2015; Vangronsveld, 2014). The concentrations of the TDA and MDA isomers in indoor air were all <LOQ of 20–30 ng.m−3. Again, this is not surprising given the low vapor pressure of TDA (2–3x10⁻² Pa) and MDA (2.5 × 10⁻⁴ Pa) (Macnab, 1999, 2000, 2001; Spence and Plehiers, 2022). The absence of measurable TDA and MDA emissions in the present work is consistent with these results as well.
Migration testing
The migration testing method used was designed to maintain the integrity of the PU polymer matrix by using an acidic aqueous extraction solution in lieu of solvents (see Introduction and Brunet et al., 2018, e.g.).
MDA migration from a thermally treated MDI-based foam containing 14.1 mg.kg−1 of MDA was found to be very low. Except for some detection at the very onset of testing, all values were <LOQ after 2 days. In case of MDA, it cannot be excluded that solubility limitations played a certain role: the solubility of pure MDA in water at pH 5 is only approx. 2.25 g.L−1 (Macnab, 1999), the saturation concentration corresponding to 14.1 mg.kg−1 of MDA in the solid phase would hence not be expected to exceed single μg.L−1 (ng per sample) levels. At the onset of testing, detectable TDA migration was observed. However, TDA migration quickly decreased with time (Figure 6). The trend for 2,4-TDA migration to diminish more rapidly than 2,6-TDA is in line with observations made in similar work (Kuck and Seel, 2001), wherein the higher reactivity of 2,4-TDA compared to 2,6-TDA was postulated as the cause. In hindsight and for future work, longer test durations at Days 10 and 35 might have been useful to lower the detectable migration rate per time unit.
The cotton cloth captured on average 34% of the migrated TDA and 78% of the migrated MDA. This illustrates the role of, for example, mattress covers and bed sheets in reducing potential exposure, an observation that has been considered by the US EPA in allowing a 50% reduction of exposure in its RA guidance (EPA, 2012).
In addition to the experiments, a theoretical analysis was used as a tool to assess the plausibility of the results (Supplemental Information 3). Theoretically, a linear relationship between migration rate and initial concentration of the migrating substance would be expected. With some experimental variability, this could be confirmed (Figure 5). In addition, a remarkable agreement between theoretical and measured values was noted based on the conservative assumptions listed in the last paragraphs of the Methods section and the following estimates for the most important parameters: D = diffusion coefficient of 2,6-TDA in the PU polymer; a realistic estimate of approximately 2 · 10−12 m2. s−1 for 2,6-TDA was derived from the upper range of the graphs provided by EPA (1990) and Reynier et al. (2001);
5
ε = foam solid fraction [m3polymer.m−3foam], approximated by the foam relative density (0.026, see Table 1, adjusted for the foam compression during testing) (Froment and Bischoff, 1979); τ = tortuosity [mpolymer.m−1foam], ratio of the length of the diffusion pathway in the polymer compared to the depth dimension in the foam; a standard value of √3 was assumed (Froment and Bischoff, 1979); C0 = initial concentration of 2,6-TDA in the PU polymer; measured value from this work was 1.7 mg.kg−1.
In Figure 6, the dashed line represents the theoretical values. The diamonds and crosses represent the measured migration data, whereby values <LOQ were included as ½ LOQ. The horizontal line shows ½ LOQ of the two samples (filters and cloth) taken during each 3-h testing period. Figure 6 illustrates that replenishment of TDA from inside the foam to the migration interface occurred only to a very limited extent and at a slow rate. The data match very well with the theoretically predicted evolution of migration with the inverse square root of time (t−0.5). This observation justifies migration risk assessment scenarios with exposure values strongly and continually decreasing over time. Performing such a risk assessment was not the subject of this work, however.
Supplemental Material
Supplemental Material - Emission and time-resolved migration rates of aromatic diamines from two flexible polyurethane foams
Supplemental Material for Emission and time-resolved migration rates of aromatic diamines from two flexible polyurethane foams by Daniel Karlsson, Mark W Spence and Patrick M Plehiers in Toxicology and Industrial Health
Footnotes
Acknowledgements
The authors appreciate the support of the European Association of Flexible PU Foam Blocks Manufacturers (EUROPUR) for providing test materials for this study.
Declaration of Conflicting interest
The author(s) declared the following potential conflicts of interest with respect to the research, authorship, and/or publication of this article: Mark W Spence and Patrick M Plehiers are employed by the International Isocyanate Institute, Inc. The Institute is funded by producers of TDI and MDI.
Funding
The author(s) disclosed receipt of the following financial support for the research, authorship, and/or publication of this article: The work reported herein was funded by the International Isocyanate Institute, Inc (Project 768). Any opinions expressed are those of the authors, not necessarily of the International Isocyanate Institute Inc. or its member companies.
Ethical approval
The work did not involve interaction with human study subjects and ethical approval was not required.
Supplemental Material
Supplemental material for this article is available online.
Notes
References
Supplementary Material
Please find the following supplemental material available below.
For Open Access articles published under a Creative Commons License, all supplemental material carries the same license as the article it is associated with.
For non-Open Access articles published, all supplemental material carries a non-exclusive license, and permission requests for re-use of supplemental material or any part of supplemental material shall be sent directly to the copyright owner as specified in the copyright notice associated with the article.