
Abstract
The sensitization potencies of twenty custom-designed monomer-depleted polymeric polyisocyanate prepolymer substances and their associated toluene diisocyanate (TDI), methylene diphenyl diisocyanate (MDI), hexamethylene diisocyanate (HDI), and isophorone diisocyanate (IPDI) monomer precursors were investigated by means of the mouse Local Lymph Node Assay (LLNA). These polymeric prepolymers were designed to represent the structural features and physical-chemical properties exhibited by a broad range of commercial polymeric polyisocyanate prepolymers that are produced from the reaction of aromatic and aliphatic diisocyanate monomers with aliphatic polyether and polyester polyols. The normalization of LLNA responses to the applied (15-45-135 mM) concentrations showed that the skin sensitization potency of polymeric polyisocyanate prepolymers is at least 300 times less than that of the diisocyanate monomers from which they are derived. The sensitization potency of the prepolymers was shown to be mainly governed by their hydrophobicity (as expressed by the calculated octanol-water partition coefficient, log Kow) and surfactant properties. Neither hydrophilic (log Kow <0) nor very hydrophobic (log Kow >25) prepolymers stimulated lymphocyte proliferation beyond that of the dosing vehicle control. The findings of this investigation challenge the generally held assumption that all isocyanate (-N=C=O) bearing substances are potential skin (and respiratory) sensitizers. Further, these findings can guide the future development of isocyanate chemistries and associated polyurethane applications toward reduced exposure and health hazard potentials.
Introduction
In many polyurethane (PU) applications, the diisocyanate monomer component is modified with high-molecular weight polyols that meet the definition of a polymer (OECD, 1993). The modification with such polymeric polyols generates so-called polymeric (polyisocyanate) prepolymers that offer a combination of improved handling characteristics, distinctive PU product properties, and reduced exposure potential (see also Spence and Plehiers, 2022). All polymeric prepolymers contain at least two isocyanate (-N=C=O, or NCO) functional groups and are therefore reactive substances.
West et al. (2022) have explored the aquatic exposure potential and acute toxicity effects to Daphnia magna of 10 generic monomer-depleted polymeric prepolymers. The present work was undertaken to provide insight into the dermal sensitization potency of the same and an additional 10 polymeric prepolymers.
From an occupational health perspective, the main concern associated with NCO-bearing substances is the risk of sensitization leading to occupational asthma and/or, in rare cases, allergic contact dermatitis. The hybrid adverse outcome pathway described by Kimber et al. (2018) provides a good background for qualitatively assessing the sensitization potential of chemicals via the dermal route and for identifying areas of convergence and divergence between skin sensitization and sensitization of the respiratory tract. Based on their work and that of others (Basketter et al., 2017; Cochrane et al., 2015; Griem et al., 2003; Kimber et al., 2001), the murine local lymph node assay (LLNA) was established as a good testing platform to quantitatively compare differences in dermal sensitization potency across groups of chemicals. There is currently no validated test for assessing sensitization via the inhalation route, although it has been generally observed that substances that are not dermal sensitizers are also not respiratory sensitizers (see, e.g., Hemming et al., 2019; North et al., 2016).
Under most regulatory schemes (e.g., EPA, 2010), NCO-bearing molecules are considered sensitizers by default because of their reactive nature. While such a precautionary approach based solely on the presence of a particular chemical functional group is understandable, it also reduces the incentive for innovation towards substances with similar function but reduced exposure potential or sensitization potency. To introduce or register newly developed prepolymers, (animal) testing is often requested for small molecular changes since there is at present no good information available upon which to predict sensitization potential based on variations in structure and properties of polymeric prepolymers.
Limited results obtained by Woolhiser et al. (2011) suggested that some polymeric prepolymers may not have sensitizing properties based on LLNA testing. The current work expanded on the work of Woolhiser et al. (2011) by systematically exploring variations in sensitization potency with polymeric prepolymer structure. The sensitization potency was investigated for 20 generic polymeric prepolymers, which span the variation in molecular structural features and physical-chemical properties of the vast majority of those currently available commercially. The substances tested were an expanded set of those tested for their aquatic effects by West et al. (2022), and they comprised prepolymers produced by reacting aliphatic polyether and polyester polyols with the aromatic diisocyanates toluene diisocyanate (TDI) and methylenediphenyl diisocyanate (MDI) as well as with their aliphatic counterparts hexamethylene diisocyanate (HDI) and isophorone diisocyanate (IPDI).
Others have attempted to derive boundaries to the physico-chemical properties of so-called low-molecular-weight substances (LMW—typically <1000 g/mol) to distinguish sensitizers from non-sensitizers; however, these limits appear less than definitive (Fitzpatrick et al., 2017a, 2017b). Chemical reactivity, on the other hand, seems to be a more reliable indicator for sensitization potential (see, e.g., Roberts, 2021). Whilst all NCO-bearing substances share the inherent capacity for acylation reactions (e.g., covalent binding to proteins), they exhibit a broad range of individual reactivities (see Spence and Plehiers, 2022), the effect of which on their sensitization potency is not well understood.
The work reported here evaluated polymeric prepolymers with number-averaged molecular weights (Mn) between 750 and 6600 g/mol, nominal functionalities between 2 and 4 NCO groups per molecule, and octanol-water partition coefficients (log Kow) ranging from −5 to +45, exploring a range of properties that is not typically associated with “LMW” chemicals and adding significantly to the knowledge in this field of research.
Methods
Experimental design and polymeric prepolymer test substances
Description of design factors used in the design-of-experiments (DOE) for defining the generic polymeric prepolymer test substances evaluated in the LLNA.
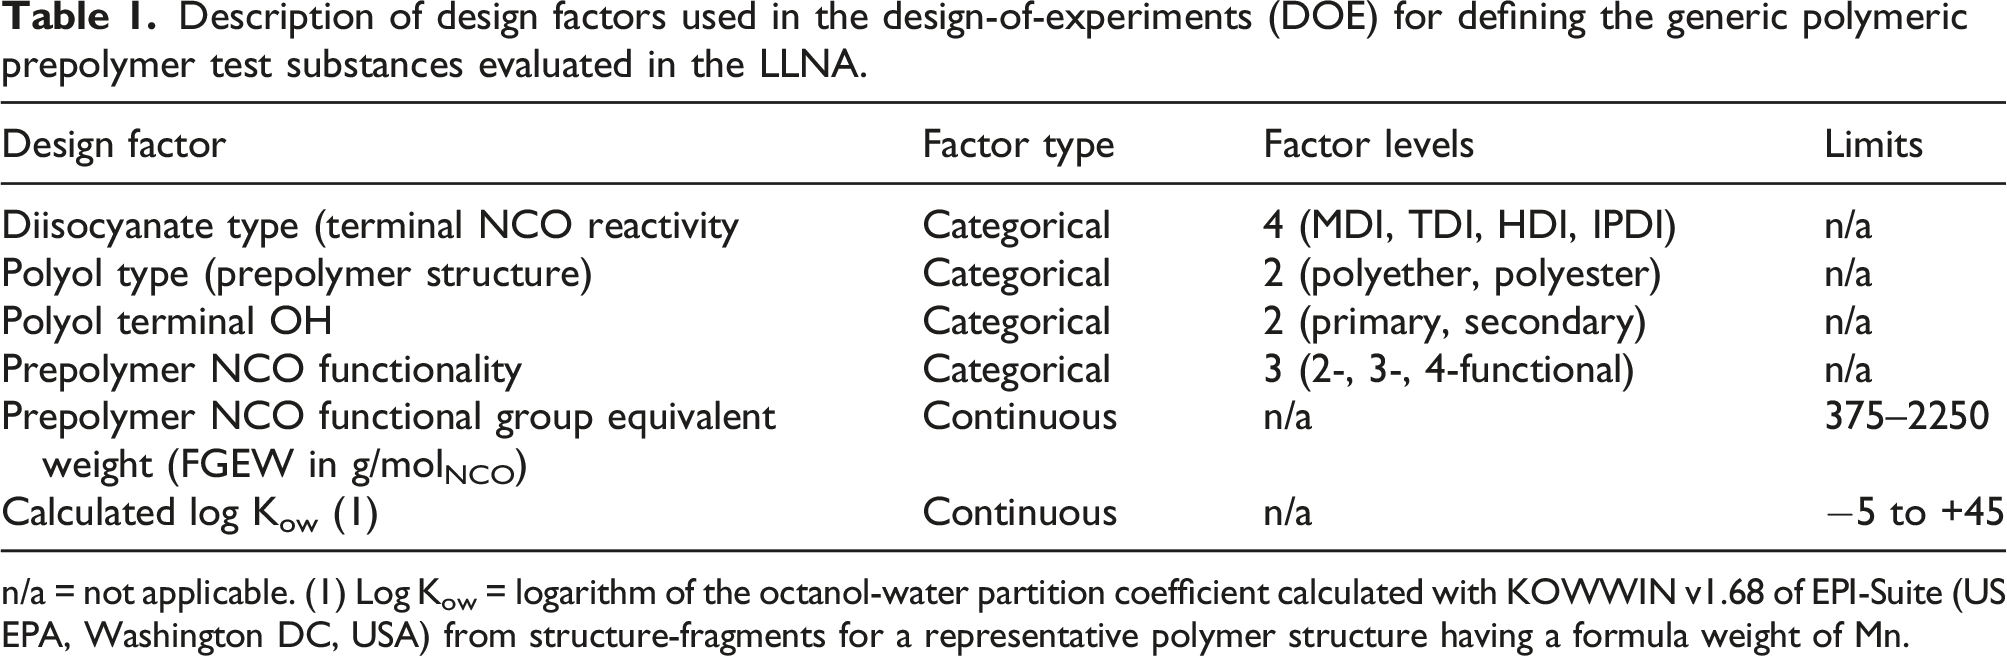
n/a = not applicable. (1) Log Kow = logarithm of the octanol-water partition coefficient calculated with KOWWIN v1.68 of EPI-Suite (US EPA, Washington DC, USA) from structure-fragments for a representative polymer structure having a formula weight of Mn.
Nomenclature of the generic polymeric prepolymers investigated and identification of the polyols used. The nomenclature of the polymeric prepolymers reflects the diisocyanate type, the polyol type, and the nominal molecular weight of the polymeric prepolymer.
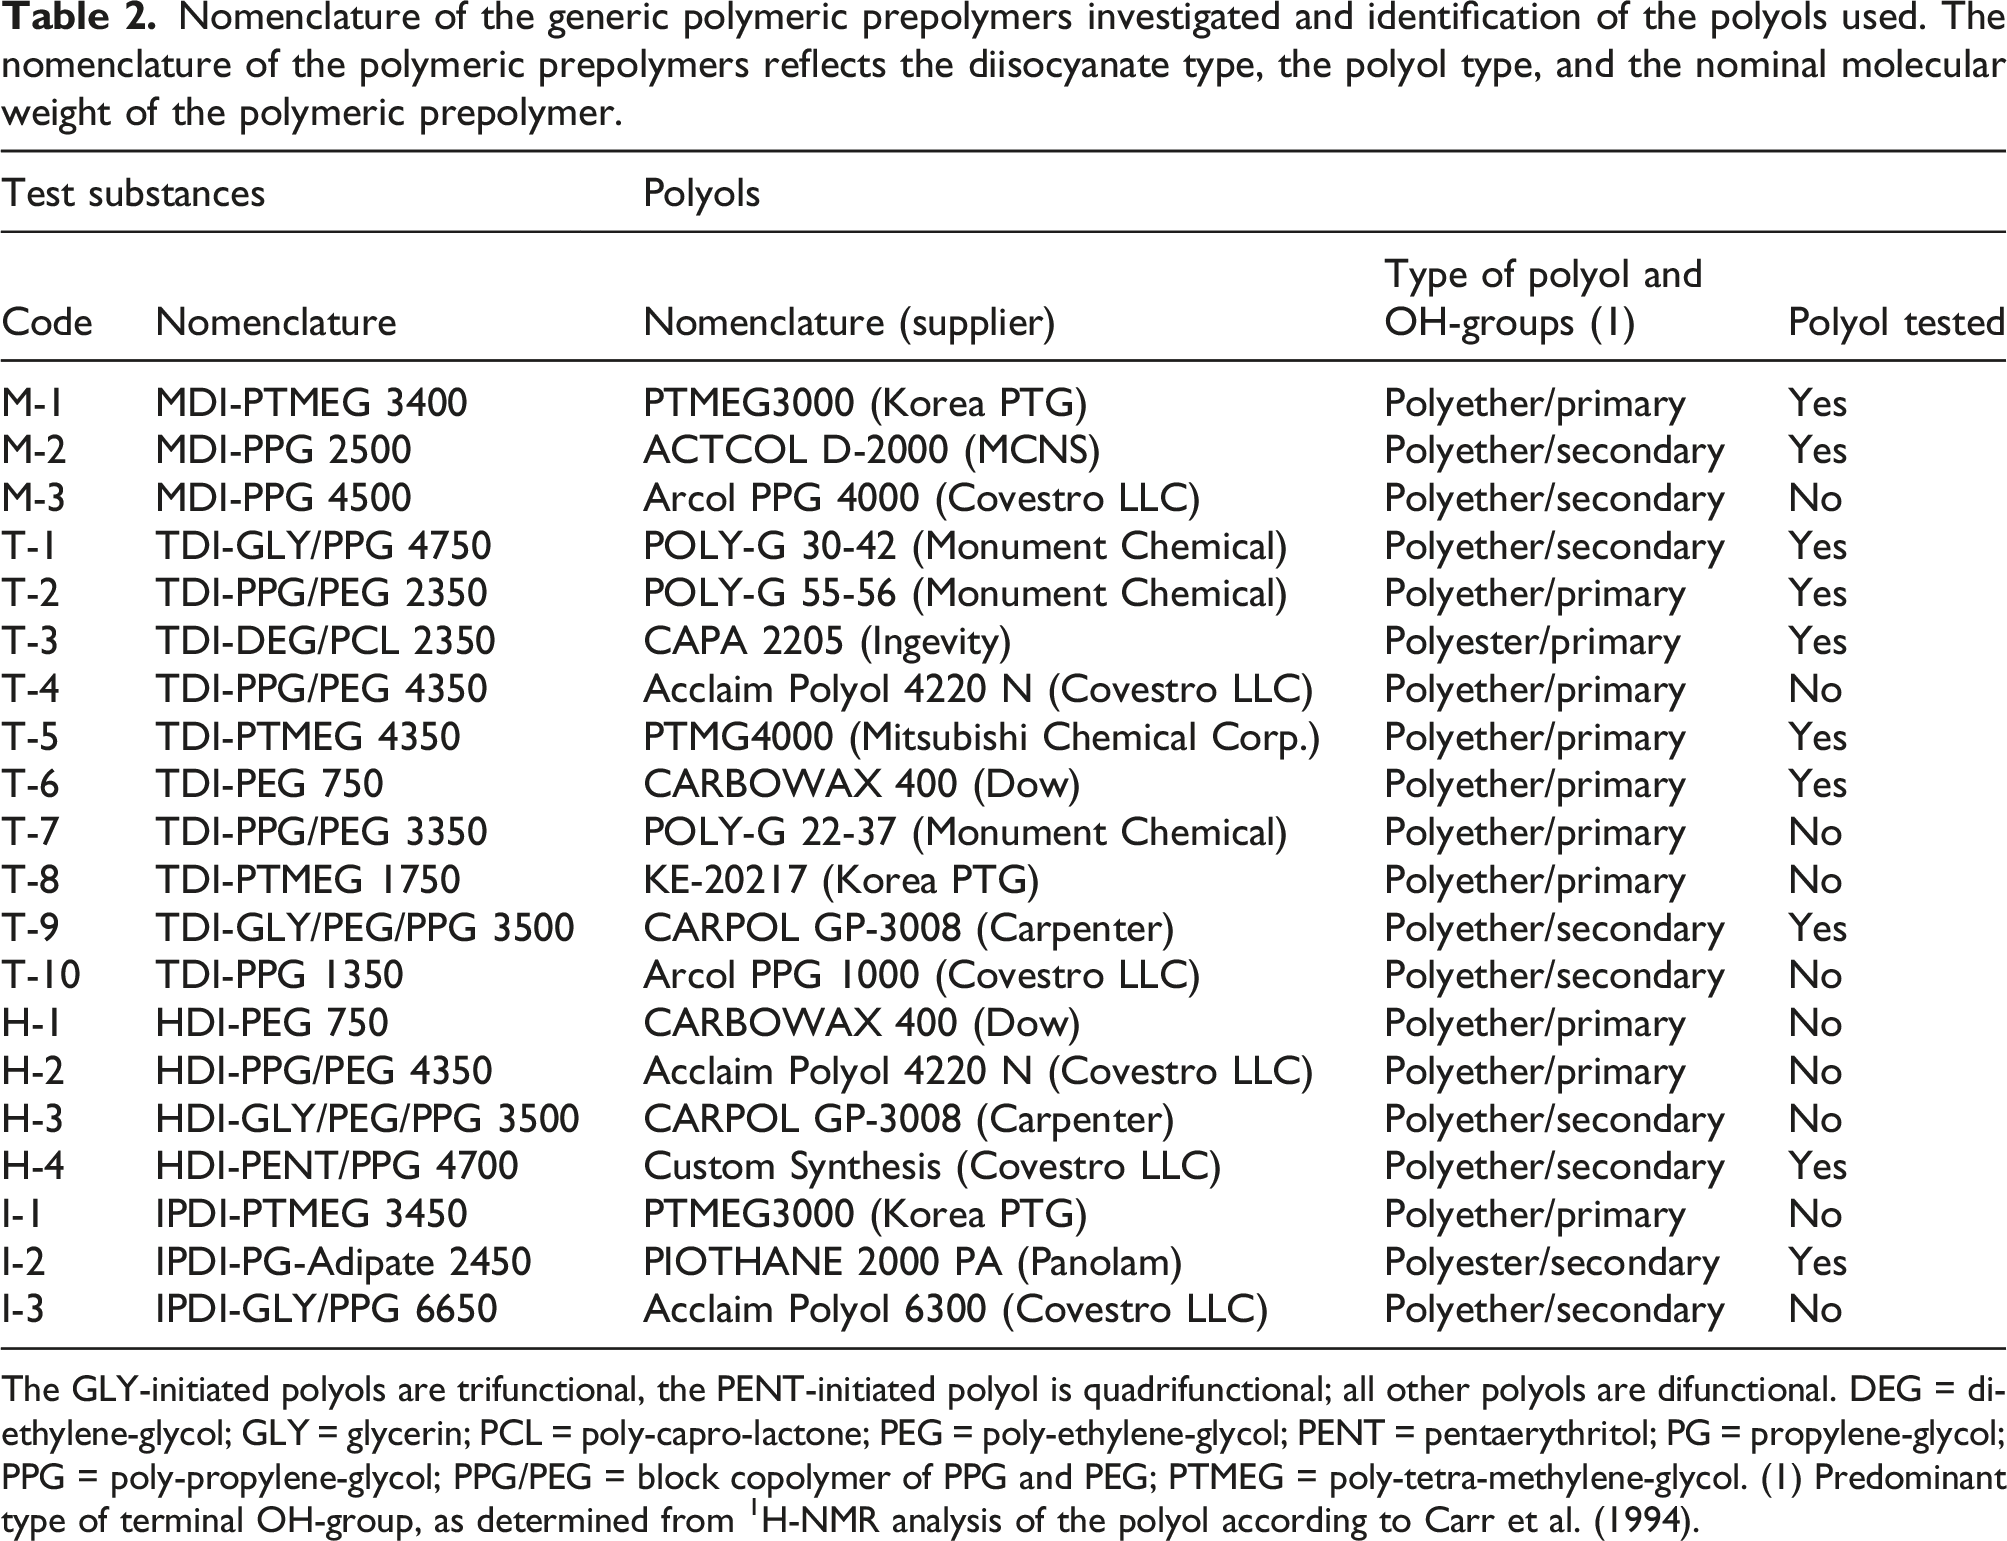
The GLY-initiated polyols are trifunctional, the PENT-initiated polyol is quadrifunctional; all other polyols are difunctional. DEG = di-ethylene-glycol; GLY = glycerin; PCL = poly-capro-lactone; PEG = poly-ethylene-glycol; PENT = pentaerythritol; PG = propylene-glycol; PPG = poly-propylene-glycol; PPG/PEG = block copolymer of PPG and PEG; PTMEG = poly-tetra-methylene-glycol. (1) Predominant type of terminal OH-group, as determined from 1H-NMR analysis of the polyol according to Carr et al. (1994).
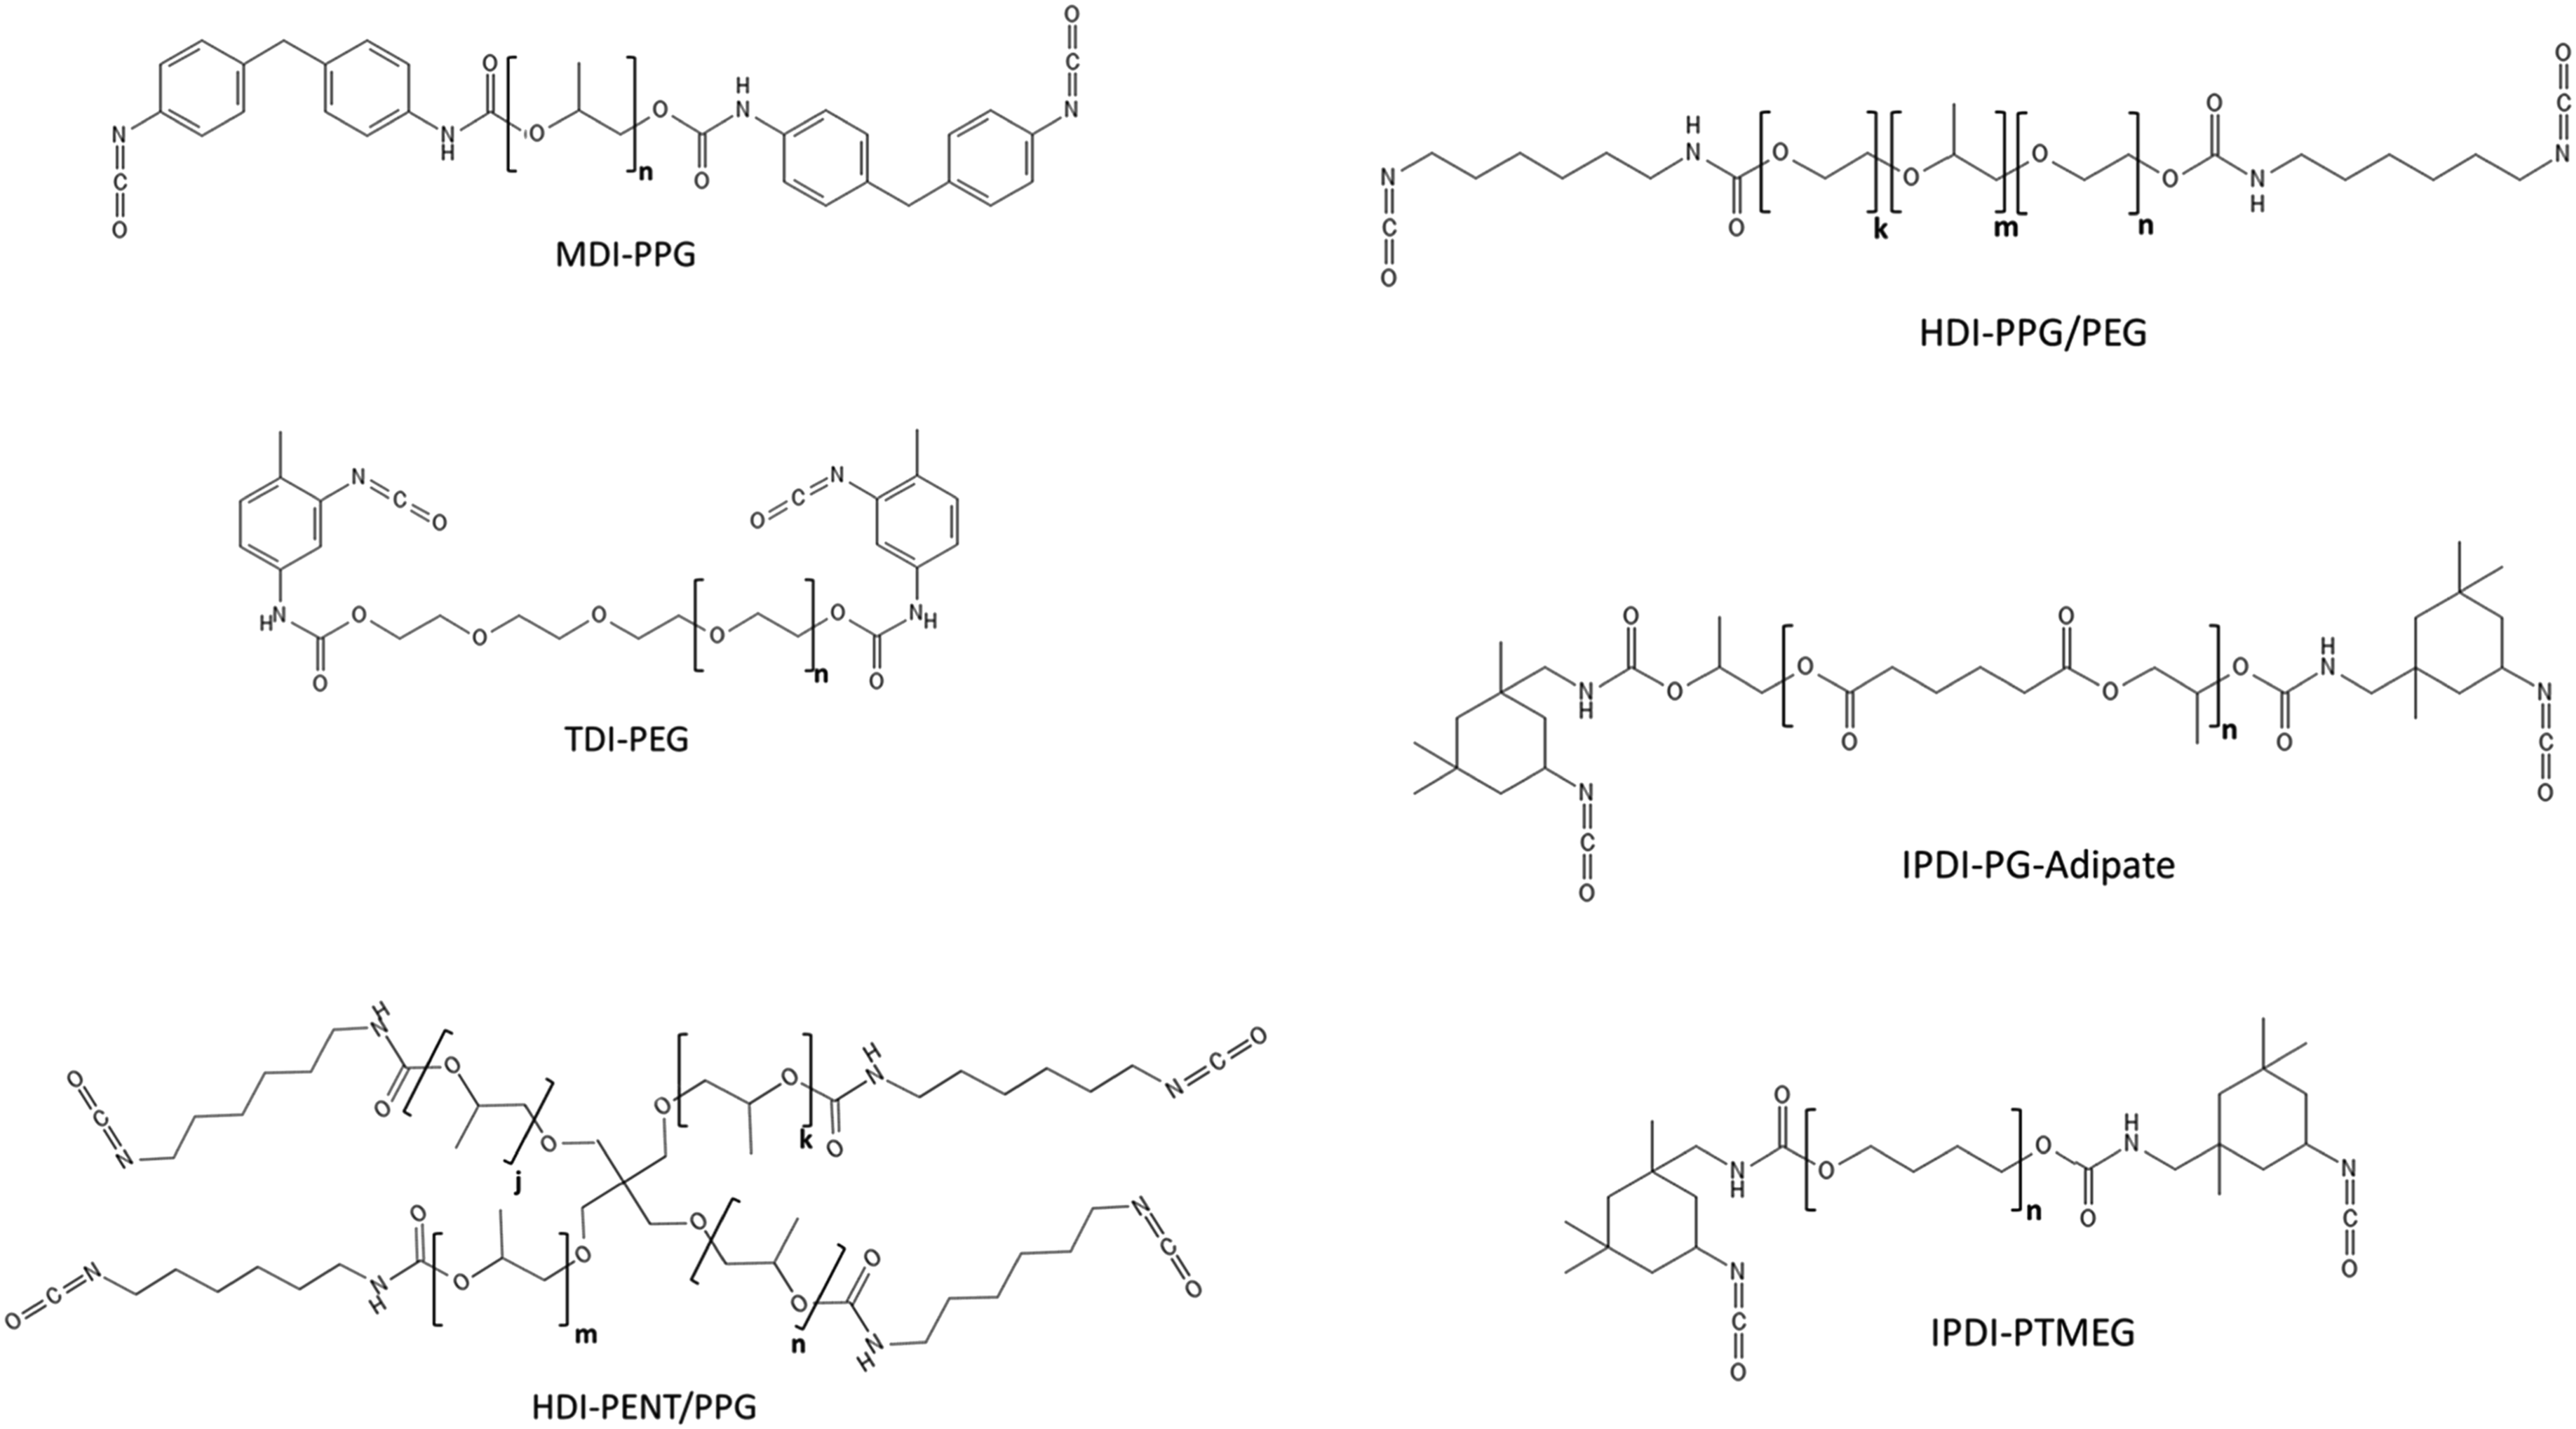
Generic structures of polymeric polyisocyanate prepolymer test substances prepared by reaction of 4,4′-methylene diphenyl diisocyanate (MDI), 2,4-toluene diisocyanate (TDI), hexamethylene diisocyanate (HDI), and isophorone diisocyanate (IPDI) with various polyol substances. Structures were drawn using PubChem Sketcher V.2.4. PEG = polyethylene glycol, PENT/PPG = pentaerythritol propoxylate, PG-Adipate = propylene glycol adipate, PPG = polypropylene glycol, PPG/PEG = polyethylene glycol-polypropylene glycol-polyethylene glycol tri-block copolymer, and PTMEG = polytetramethylene glycol.
Properties of the generic polymeric prepolymers. The nomenclature of the polymeric prepolymers reflects the diisocyanate type, the polyol type, and the nominal molecular weight of the polymeric prepolymer.
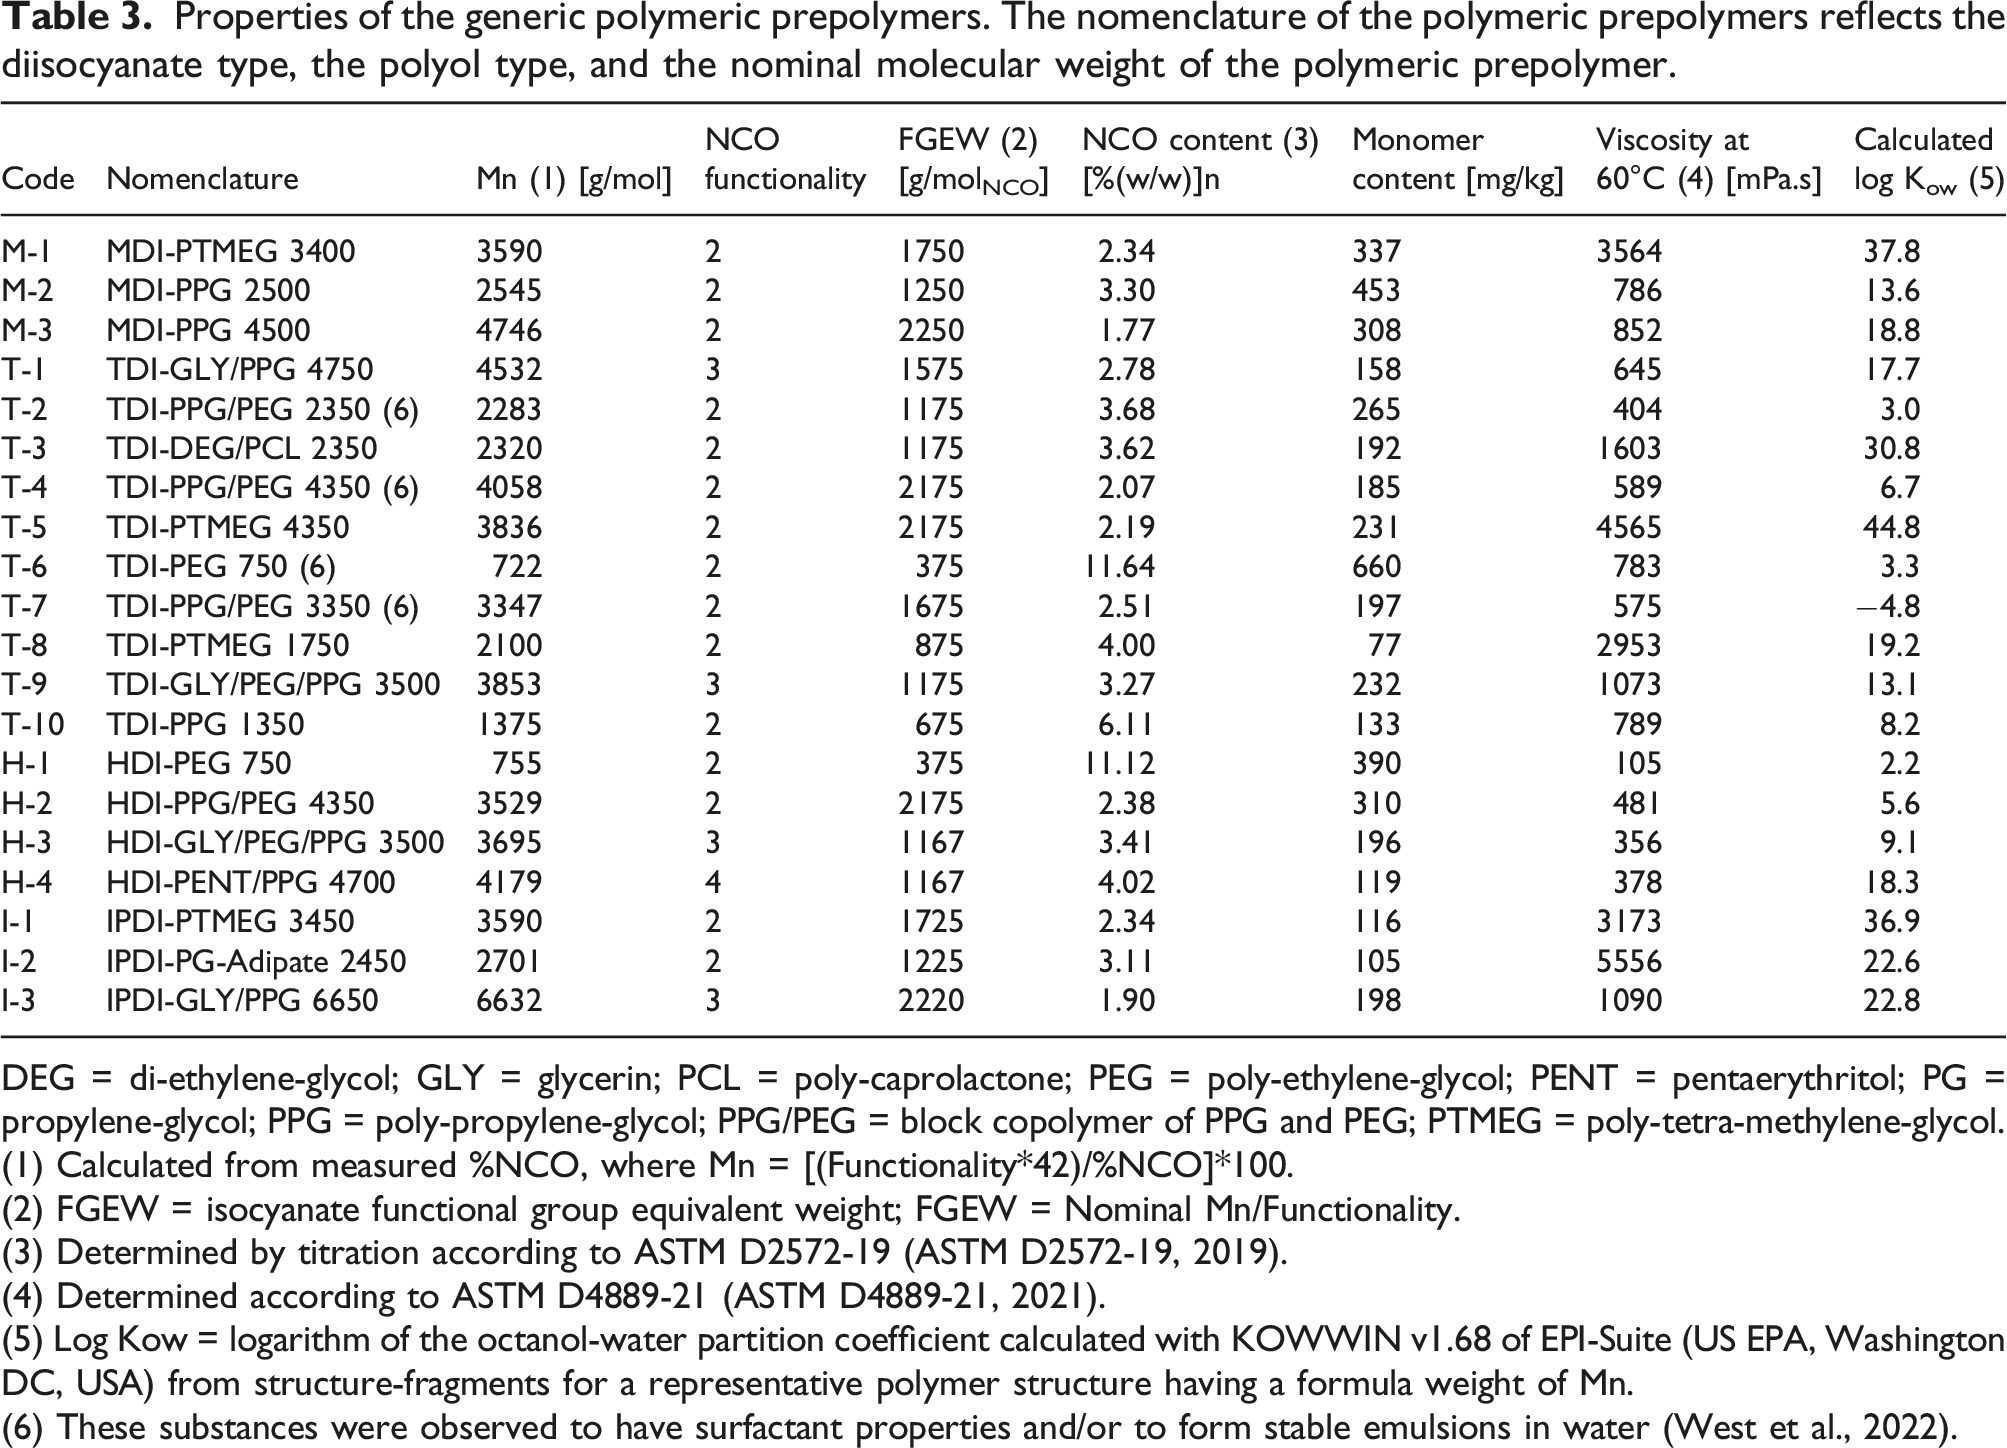
DEG = di-ethylene-glycol; GLY = glycerin; PCL = poly-caprolactone; PEG = poly-ethylene-glycol; PENT = pentaerythritol; PG = propylene-glycol; PPG = poly-propylene-glycol; PPG/PEG = block copolymer of PPG and PEG; PTMEG = poly-tetra-methylene-glycol.
(1) Calculated from measured %NCO, where Mn = [(Functionality*42)/%NCO]*100.
(2) FGEW = isocyanate functional group equivalent weight; FGEW = Nominal Mn/Functionality.
(3) Determined by titration according to ASTM D2572-19 (ASTM D2572-19, 2019).
(4) Determined according to ASTM D4889-21 (ASTM D4889-21, 2021).
(5) Log Kow = logarithm of the octanol-water partition coefficient calculated with KOWWIN v1.68 of EPI-Suite (US EPA, Washington DC, USA) from structure-fragments for a representative polymer structure having a formula weight of Mn.
(6) These substances were observed to have surfactant properties and/or to form stable emulsions in water (West et al., 2022).
The log Kow values shown in Table 3 were calculated for a representative prepolymer structure having a formula weight approximately equal to Mn, using the structure-fragment calculation method implemented by the KOWWIN v1.68 module of EPI-Suite (v4.11 − US EPA, Washington DC, USA). The analytical methods used to characterize the test substances have been described by West et al. (2022).
Chemicals
The diisocyanate monomers used in the additional prepolymer syntheses were from the same lot or batch used to prepare the monomer reference doses for the LLNA. TDI (65:35 2,4-:2,6-isomer molar ratio; MONDUR TD-65—purity ≥99.7%) and HDI (Desmodur H—purity ≥99.5%) were obtained from Covestro LLC (Pittsburgh, PA, USA), and IPDI (Vestanat IPDI—purity ≥99.5%) was obtained from Evonik Corporation (Parsippany, NJ, USA). With the one aforementioned exception, the polyols were commercial products sourced from various suppliers as indicated in Table 2. Prior to use in the prepolymer syntheses, water content of the polyols was verified to be <300 ppm by Karl-Fischer titration. Precautions were taken to avoid ingress of water during the synthesis and subsequent storage and handling of the test substances (see West et al., 2022).
Highly refined olive oil (CASRN 8001-25-0) and isoeugenol (CASRN 97-54-1—purity >98%) were from Sigma-Aldrich (Saint-Louis, MO, USA), and extra-dry acetone (CASRN 67-44-1—purity >99.75%, water <50 ppm) was obtained from Fisher Scientific (Fair Lawn, NJ, USA). 5-[125I]-iodo-2′-deoxyuridine (125IudR) was obtained from PerkinElmer Health Sciences Inc. (Shelton, CT, USA).
Derivatizing solutions for analyzing monomer content were made with LC/MS grade methanol (CASRN 67-56-1) from Fisher Scientific (Fair Lawn, NJ, USA), tetrahydrofuran UV grade (THF, CASRN 109-99-9) from Honeywell (Muskegon, MI, USA), and dibutyltin dilaurate (CASRN 77-58-7) from Evonik Corporation (Parsippany, NJ, USA).
Assessment of dermal sensitization potential by LLNA
Tested substances and general test design
In addition to the polymeric prepolymers listed, several polyols were tested as reference polyols to assess their potential contribution and that of any associated impurities/additives to skin irritancy and/or increased lymphocyte proliferation in the LLNA (see Table 2). In addition, MDI, TDI (mixture of 2,4- and 2,6-TDI in a ratio of 3.7:1 to match residual monomer composition in the test substances), HDI, and IPDI were tested as reference monomers in order to be able to assess the contribution to lymph node cell proliferation of residual monomer present in the test substances, and to compare the sensitization potency of the test substances with that of the corresponding diisocyanate monomer.
The polymeric prepolymer test substances and their corresponding reference polyols were divided into six test groups for practical animal handling reasons. Each of the test groups included a vehicle control (acetone-olive-oil (4:1 v/v)—AOO), a positive control (5% (v/v) isoeugenol in AOO), and the applicable reference monomer dissolved in AOO.
Test animals and animal handling
Female CBA/J mice (The Jackson Laboratory, Bar Harbor, ME, USA) were used as an accepted model for determining LLNA proliferative activity following topical administration of potentially sensitizing agents in accordance with OECD Guideline 429 (OECD Organisation for Economic Cooperation and Development, 2010).
Animals were housed up to five from the same treatment group per individually-ventilated cage. Permanent ink tail marking identified individual animals, while cage cards identified groups by treatment and dose. Room temperature was kept between 20 and 23°C and relative humidity was between 35-75%. A 12-hour light/12-hour darkness cycle was maintained, with temporary adjustments of limited duration to accommodate activities within the housing room. The animals were acclimatized for 13 days prior to testing. BioFresh Performance Bedding 1/8” (ScottPharma, Marlborough, MA, USA) was used. PMI LabDiet 5002 (Purina Mills, Richmond, IN, USA) and Town of Cary (NC, USA) drinking water were supplied ad libitum. All animal handling procedures were approved by the testing facility’s Institutional Animal Care and Use Committee.
Each vehicle control group consisted of eight animals. The test substance, reference polyol, reference monomer, and positive control groups each were comprised of five animals. Health status was observed and baseline lymph node proliferation was measured in at least 3 naïve animals prior to dosing for each test group. Animals were randomized upon receipt according to the standard procedure of the performing laboratory (Burleson Research Technologies, Morrisville, NC, USA). Animals were age-matched (8–9 weeks) before the start of dosing and were checked to be within +/− 20% of mean body weight of all animals within one day of the start of the studies.
During acclimatization, the mice were monitored daily for general health and absence of skin lesions. Once dosing started, mice were observed daily for local irritation at the application site and for signs of systemic toxicity.
Pre-screening tests and modified application procedure
Initial pre-screening tests were conducted with all polymeric prepolymer test substances on two animals each, in accordance with the OECD Guideline 429. None of the test substances produced signs of overt toxicity at any dose tested. Squinted eyes were observed across all aromatic diisocyanate-based test substances, and hair loss was observed in some groups. Both were likely caused by increased grooming behavior due to curing and hardening of the test substances on the ears. Squinted eyes and hair loss were not observed with test substances based on aliphatic diisocyanates. The presence of cured test material on the ears led to confounding results of ear thickness measurements. Therefore, excessive irritation was assessed based on erythema scores only.
At a 60% (w/v) concentration in AOO, treatment with TDI-based test substances resulted in erythema scores of “2” (well-defined erythema), below the exclusion score of “3”. All doses were considered non-irritating. Treatment with 80% (w/v) MDI-PTMEG 3400 resulted in maximum erythema scores of “2” as well. Treatment with 40% (w/v) MDI-PPG 2500 and 60% (w/v) MDI-PPG 4500 in AOO resulted in erythema scores of “3” (moderate to severe) on Day 3, which resolved beneath the exclusion threshold by Days 5 and 4, respectively.
Based on these observations, a modified administration procedure was developed to reduce the effects of the test substances curing on the ears. Mouse ears were pre-wiped with olive oil prior to each dosing (see Administration of test formulations section) and were wiped clean of cured material 2 hours post-dosing. Using 50% (w/v) of MDI-PPG 4500, the modified dosing procedure demonstrated reduced accumulation of cured test substance on the ears and resulted in erythema scores not greater than “1” (very slight, barely perceptible).
The same modified dosing procedure was used for the pre-screening tests with the HDI- and IPDI-based test substances. At 60% (w/v) concentration, none of these substances resulted in erythema scores greater than “1” (very slight, barely perceptible), and all showed erythema scores of “0” by Day 4. The modified dosing procedure was then used throughout the main investigation.
Dose selection, preparation, and verification of test formulations
For purposes of comparability, all test substances were evaluated at the same three molar concentrations (based on their respective Mn values) in AOO. Based on the pre-screening test results and solubility limitations 1 , a non-irritating high concentration could be set at 135 mM for all polymeric prepolymers. Selecting the high dose of 135 mM also provided a balance between testing sufficiently high NCO concentrations to detect sensitizing effects and avoiding monomer concentrations in the dosing solutions that would confound interpretation of the response. Two additional test concentrations were set at 45 mM and 15 mM.
Dosing levels for the reference monomers were chosen to cover the range of residual monomer concentrations in the prepolymer test substances and their respective dilutions in AOO, and they were also expected to span the concentrations associated with a 3-fold stimulation of lymphocyte production (EC3) of each reference monomer. Hence, reference monomers were tested at concentrations of 0.01, 0.03, and 0.1% (w/v) in AOO. These tests also served as a positive control for the sensitizing characteristics of TDI, MDI, HDI, and IPDI, and they allowed sensitivity of the assay to be compared across the six test groups.
Reference polyols were tested at approximately 135 mM in AOO, which was equivalent to their weight in the 135 mM dosing solutions of the corresponding prepolymer test substances.
All test substances, reference monomer, and reference polyol dosing solutions were prepared fresh daily and held at room temperature in amber vials under dry nitrogen gas atmosphere until administration. Test substances were dissolved at the 135 mM concentration first, and the two lower concentrations were prepared by serial three-fold dilutions.
Isoeugenol was dosed at 5% (v/v) in AOO, both as a positive control and as a basis for comparison with historical data. The isoeugenol dosing solutions were prepared fresh daily and held at room temperature until administration.
All test substance and monomer reference dosing solutions were verified by analysis of the diisocyanate monomer content, whereby the diisocyanates were derivatized with methanol (forming methyl urethanes) and quantified by HPLC-MS/MS. Preliminary experiments, which evaluated the time course for completion of the derivatization reaction with dibutylamine, had indicated a continued slow release of diisocyanate monomer that was attributed to aminolysis, such as employed in chemical recycling of polyurethanes (Bhandari and Gupta, 2018). Derivatization with methanol was shown to produce consistent results for monomer contents across sample concentrations, prepolymer types, and derivatization reaction times. A 25 μL aliquot of each dose formulation was added into HPLC autosampler vials containing 975 μL of a prepared derivatizing solution (ca. 340 μg of dibutyltin dilaurate as a catalyst with 4% methanol (v/v) in THF) and sealed and stored at room temperature until analysis. Samples were heated at 55°C for 30 minutes in an oven, allowed to cool at ambient conditions, diluted and analyzed by HPLC coupled with a triple-quad mass spectrometer. Calibration standards were similarly prepared, derivatized, and used for external calibration of the instrument response. The analyses were performed at Covestro LLC (Pittsburgh, PA, USA) using an in-house method for measuring “Aromatic and aliphatic monomer content in prepolymers.”
Administration of test formulations
As mentioned before, a modified administration procedure was used to minimize accumulation and associated grooming of cured test substances on the mouse ears. Mice were restrained by hand and the ears were gently extended with padded forceps. A cotton swab pre-wetted with olive oil was placed on the ears and spun in a circular motion to pre-wipe mouse ears prior to dosing. Subsequently, the vial containing the desired dosing formulation was homogenized in a vortex mixer, and 25 μL of the formulation was immediately applied to the dorsum of the ear by means of a calibrated positive displacement pipette. Two hours after dosing, the same ear wiping procedure was performed with a cotton swab pre-wetted with olive oil to remove as much of the previously applied (partly-cured) test substance as possible.
Conduct and observations during the LLNA assessment
The dosing procedure described above was performed daily for three consecutive days with 24 +/− 2 h between applications (Days 1–3). Days 4–5 were days of rest. On Day 6, mice were injected with 0.25 mL of an 8 μCi/mL stock solution of 125IudR with 10 μM of FudR into the lateral tail vein using a tuberculin syringe. Approximately 5 hours after the 125IudR injections for each test group were completed, the mice were euthanized by CO2 asphyxiation in accordance with AVMA Guidelines (AVMA, 2020). The auricular lymph nodes were collected per animal into a 15 mL conical tube containing Hanks’ balanced salt solution with HEPES (HBSS/H) (Life Technologies Corporation, Grand Island, NY, USA). The lymph nodes were macerated between the frosted ends of two glass microscope slides and the resulting cell suspensions were placed into centrifuge tubes containing HBSS/H, centrifuged and washed. Trichloroacetic acid (5%) was added to the tubes containing the final centrifugation pellet. The tubes were vortexed, wrapped in lead foil and stored refrigerated overnight. On Day 7, the cell suspensions were removed from the refrigerator, vortexed, and centrifuged. Total radioactivity from each tube was counted for 5 minutes on a Cobra II Auto-Gamma Counting System (Packard Instrument Company, Inc., Meriden, CT, USA), and the counts per minute (CPM) were converted into disintegrations per minute (DPM).
Animal weights were recorded on Days 1 and 6. Thickness measurements of both ears were made on Days 1–3 prior to dosing and on Day 6 prior to injection of the 125IudR solution. General health observations and erythema scores were recorded on Days 1 through 6.
Statistical analyses
The results from each cell suspension counted on the gamma counter were recorded as CPM. The CPM were converted to DPM by dividing by the gamma counter efficiency at the selected elevator position and multiplying by 100%. After the DPM values were calculated, the mean “blank” DPM was subtracted from each mouse DPM to obtain corrected DPM values. Questionable data points were evaluated by the Q-test prior to removal of “outliers” from the data set. The mean corrected DPM and standard error of the mean (SE) were determined for each group. The stimulation index (SI) was calculated by dividing the treated group mean DPM by the control (AOO vehicle) group mean DPM. A test substance was regarded as sensitizing if it had a group average SI value ≥3.
A one-sample t-test was performed to determine whether the untransformed SI values for the three dose groups of each test article and of isoeugenol were significantly greater than 3. The natural log transformed DPM values for each compound were compared against the AOO vehicle by performing a Bartlett’s Chi-Square test for variance homogeneity. If this test was found to be non-significant, the results of a one-way analysis of variance (ANOVA) and Dunnett’s test were used to compare all treated groups to the AOO control group. If the Bartlett’s Chi-Square value was found to be significant the results of the nonparametric Kruskal–Wallis test and the Dunn test were used to compare treated groups to the AOO control group. A statistical significance of p < 0.05 was used in these evaluations.
If the data points immediately greater and less than the SI value of 3 had the coordinates (a,b) and (c,d) respectively, then the EC3 value was calculated using [equation (1)] (Basketter et al., 1999):
The EC3 potency value was determined for the test articles and isoeugenol by multiplying the EC3 value (%) by 250 which converts the results to μg/cm2. To calculate this value, an assumed conversion of 1 mL = 1 g was made. Calculations were based on the dosing volume of 25 μL and an exposure area of 1 cm2 per mouse ear. Test substance potency values <100 μg/cm2 were classified as strong sensitizers; values between 100 and 1000 μg/cm2 were classified as moderate sensitizers; values between 1000 and 10,000 μg/cm2 were classified as weak sensitizers; and values >10,000 μg/cm2 were classified as extremely weak sensitizers (Gerberick et al., 2001).
All calculations were performed in Excel 2016 (Microsoft Corporation, Redmond, WA, USA), GraphPad Prism (V.6.01—GraphPad Software, San Diego, CA, USA), or JMP (V.12.2 or V.13.2.1—SAS Institute, Cary, NC, USA).
Identification of potential influence factors
A preliminary screening of the results was conducted using JMP, which identified combinations of the following test substance properties listed in Table 3 as potential factors influencing sensitization potency: diisocyanate monomer type (specific reactivity of the NCO group), monomer content, NCO content (or, equivalently, NCO group functional group equivalent weight [FGEW]), and the hydrophobicity (expressed as log Kow). These factors are evaluated and discussed in the corresponding Results and/or Discussion sections.
Results
Specific observations
The DPM values for one animal dosed with 15 mM of TDI-PPG/PEG 2350, one animal dosed with 135 mM of TDI-PEG 750, and one animal dosed with 15 mM of TDI-PPG 1350 were identified as statistical outliers and were removed from the respective data sets. Similarly, the DPM values for one animal dosed with 15 mM of HDI-GLY/PEG/PPG 3500, one animal dosed with 45 mM of HDI-PENT/PPG 4700, and one animal dosed with 135 mM of IPDI-PTMEG 3450 were identified as statistical outliers and were removed from the respective data sets. In addition, the DPM for one animal in each of the vehicle control groups of the cohorts testing HDI- and IPDI-based prepolymers were identified as statistical outliers and were not included in the analysis.
One animal dosed with 45 mM of TDI-GLY/PPG 4750 died prematurely while in the restrainer in preparation of the 125IudR injection. There were no unusual observations at necropsy.
The lymph node cell pellet of one animal dosed with 45 mM of MDI-PTMEG 3400 was inadvertently spilled. For that test group, only the four remaining samples were evaluated.
Clinical observations
Body weights for all mice on Day 6 were between 18.7 and 26.7 grams. Individual animal weight changes were between −1.1 and +4.9 grams. These were within expected ranges with no significant differences between the control and test substance groups.
Erythema scores were generally not greater than “1”, except for one animal dosed with 135 mM of MDI-PPG 4500 that reached a score of “2” on Day 3 only. Therefore, the test substances did not cause excessive irritation that might confound the interpretation of results.
Animals in all aromatic polymeric prepolymer test groups displayed squinted eyes during the study. This observation was likely caused by dosing solutions contacting the eyes as animals attempted to groom. No squinted eyes were observed in animals exposed to aliphatic polymeric prepolymers. Hair loss because of grooming was minimized by the modified application procedure and only occurred in the groups exposed to aromatic polymeric prepolymer test substances (3/3 MDI-based and 9/10 TDI-based) at the highest (135 mM) concentration and in a single animal exposed to the highest dose of one of the HDI-based prepolymers. Avoidance of contact with cage mates was observed in most of the 135 mM test substance groups (3/3 MDI-based, 8/10 TDI-based, 3/4 HDI-based, and 0/3 IPDI-based). A similar behavior was observed with four of the reference polyols.
Results of controls and monomer references
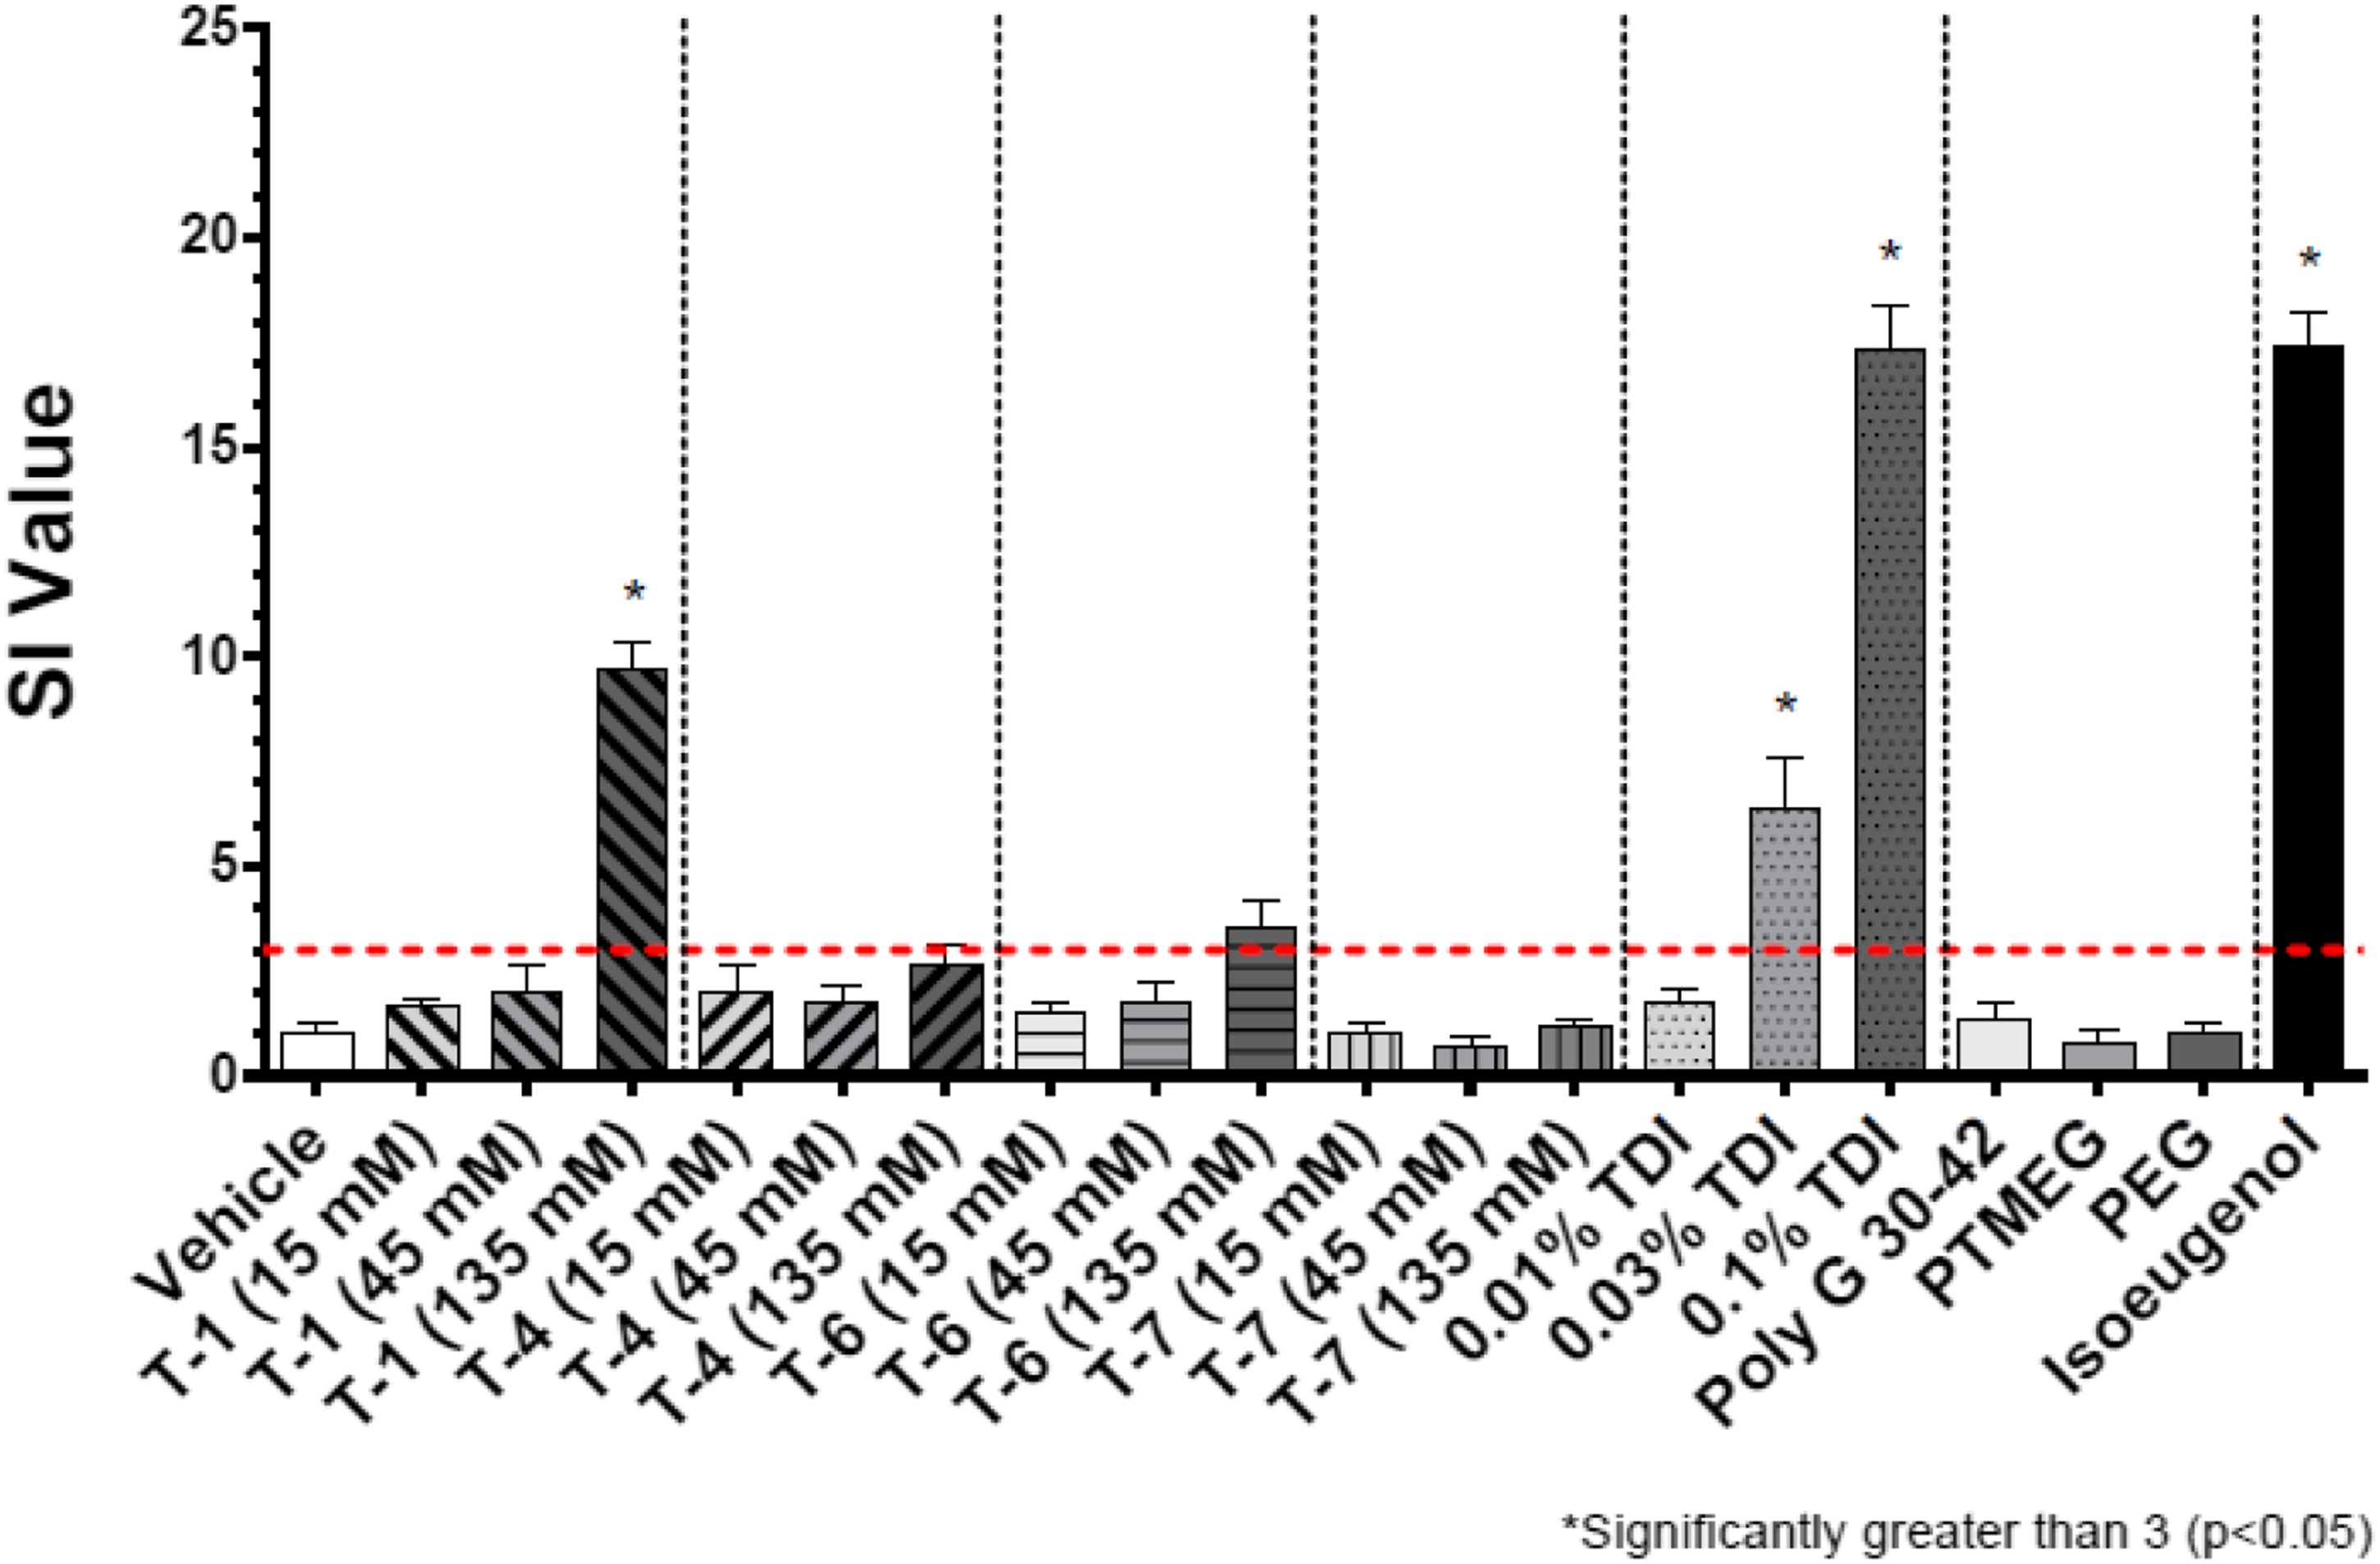
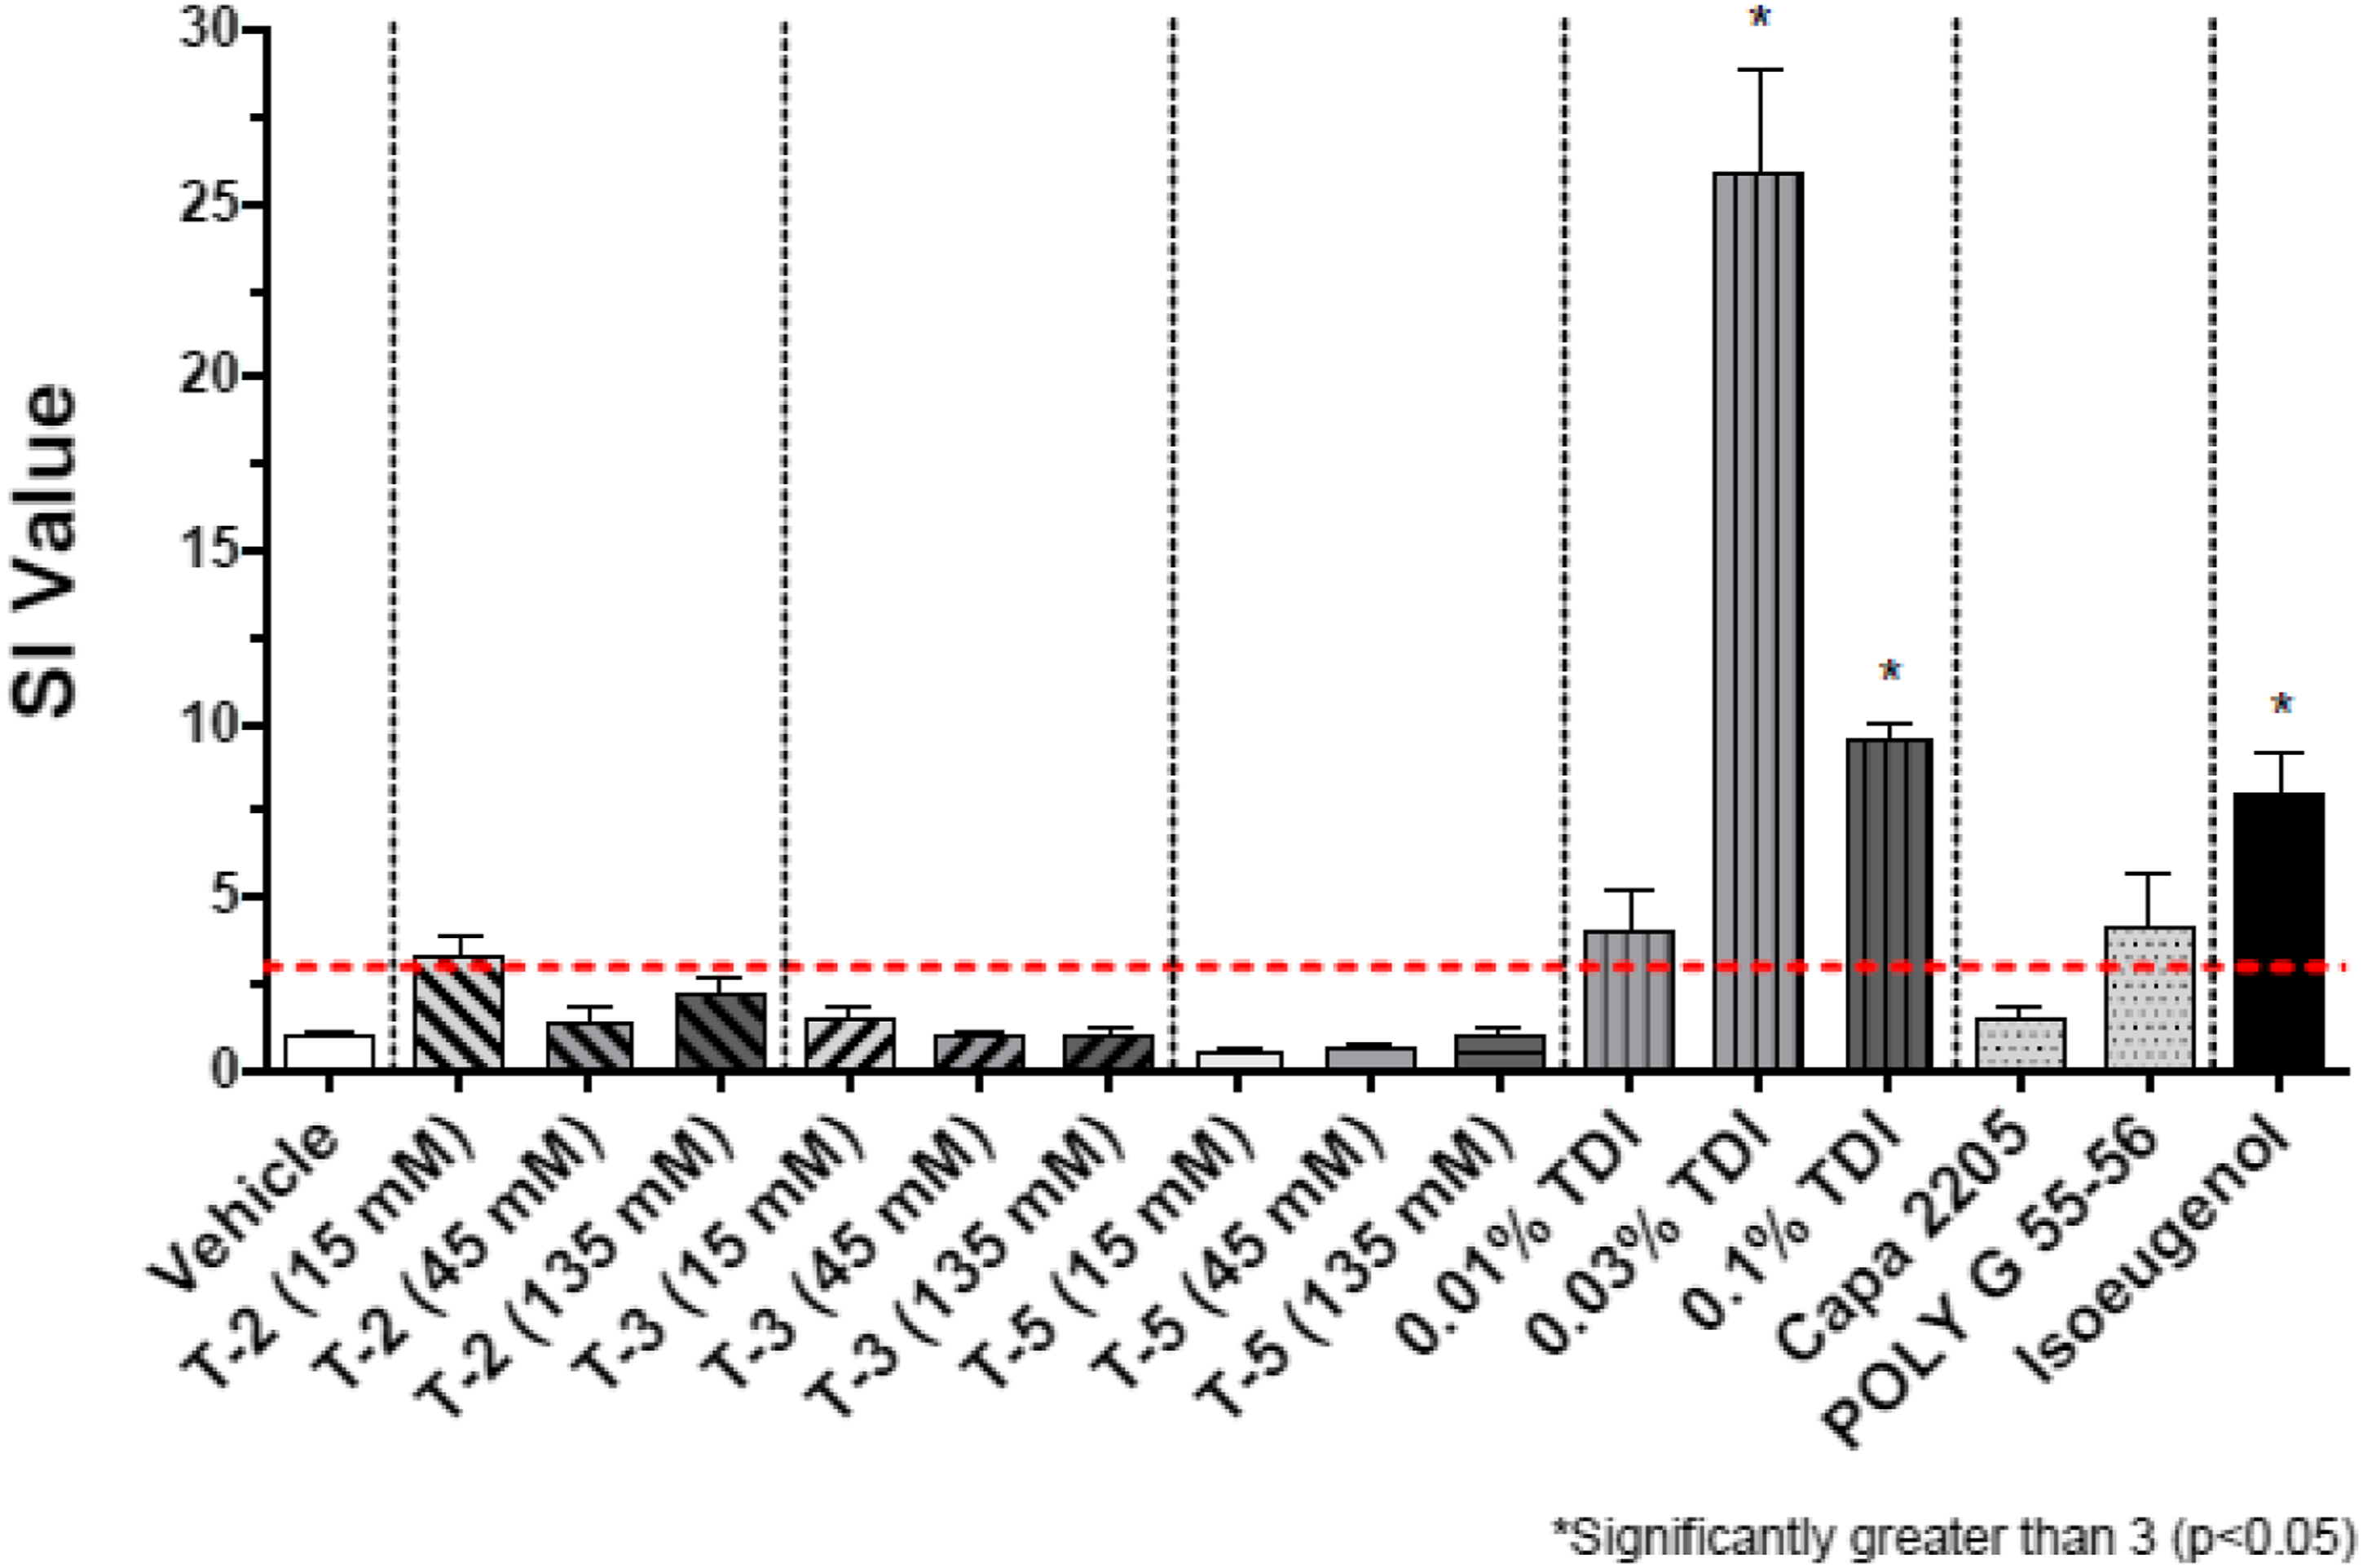
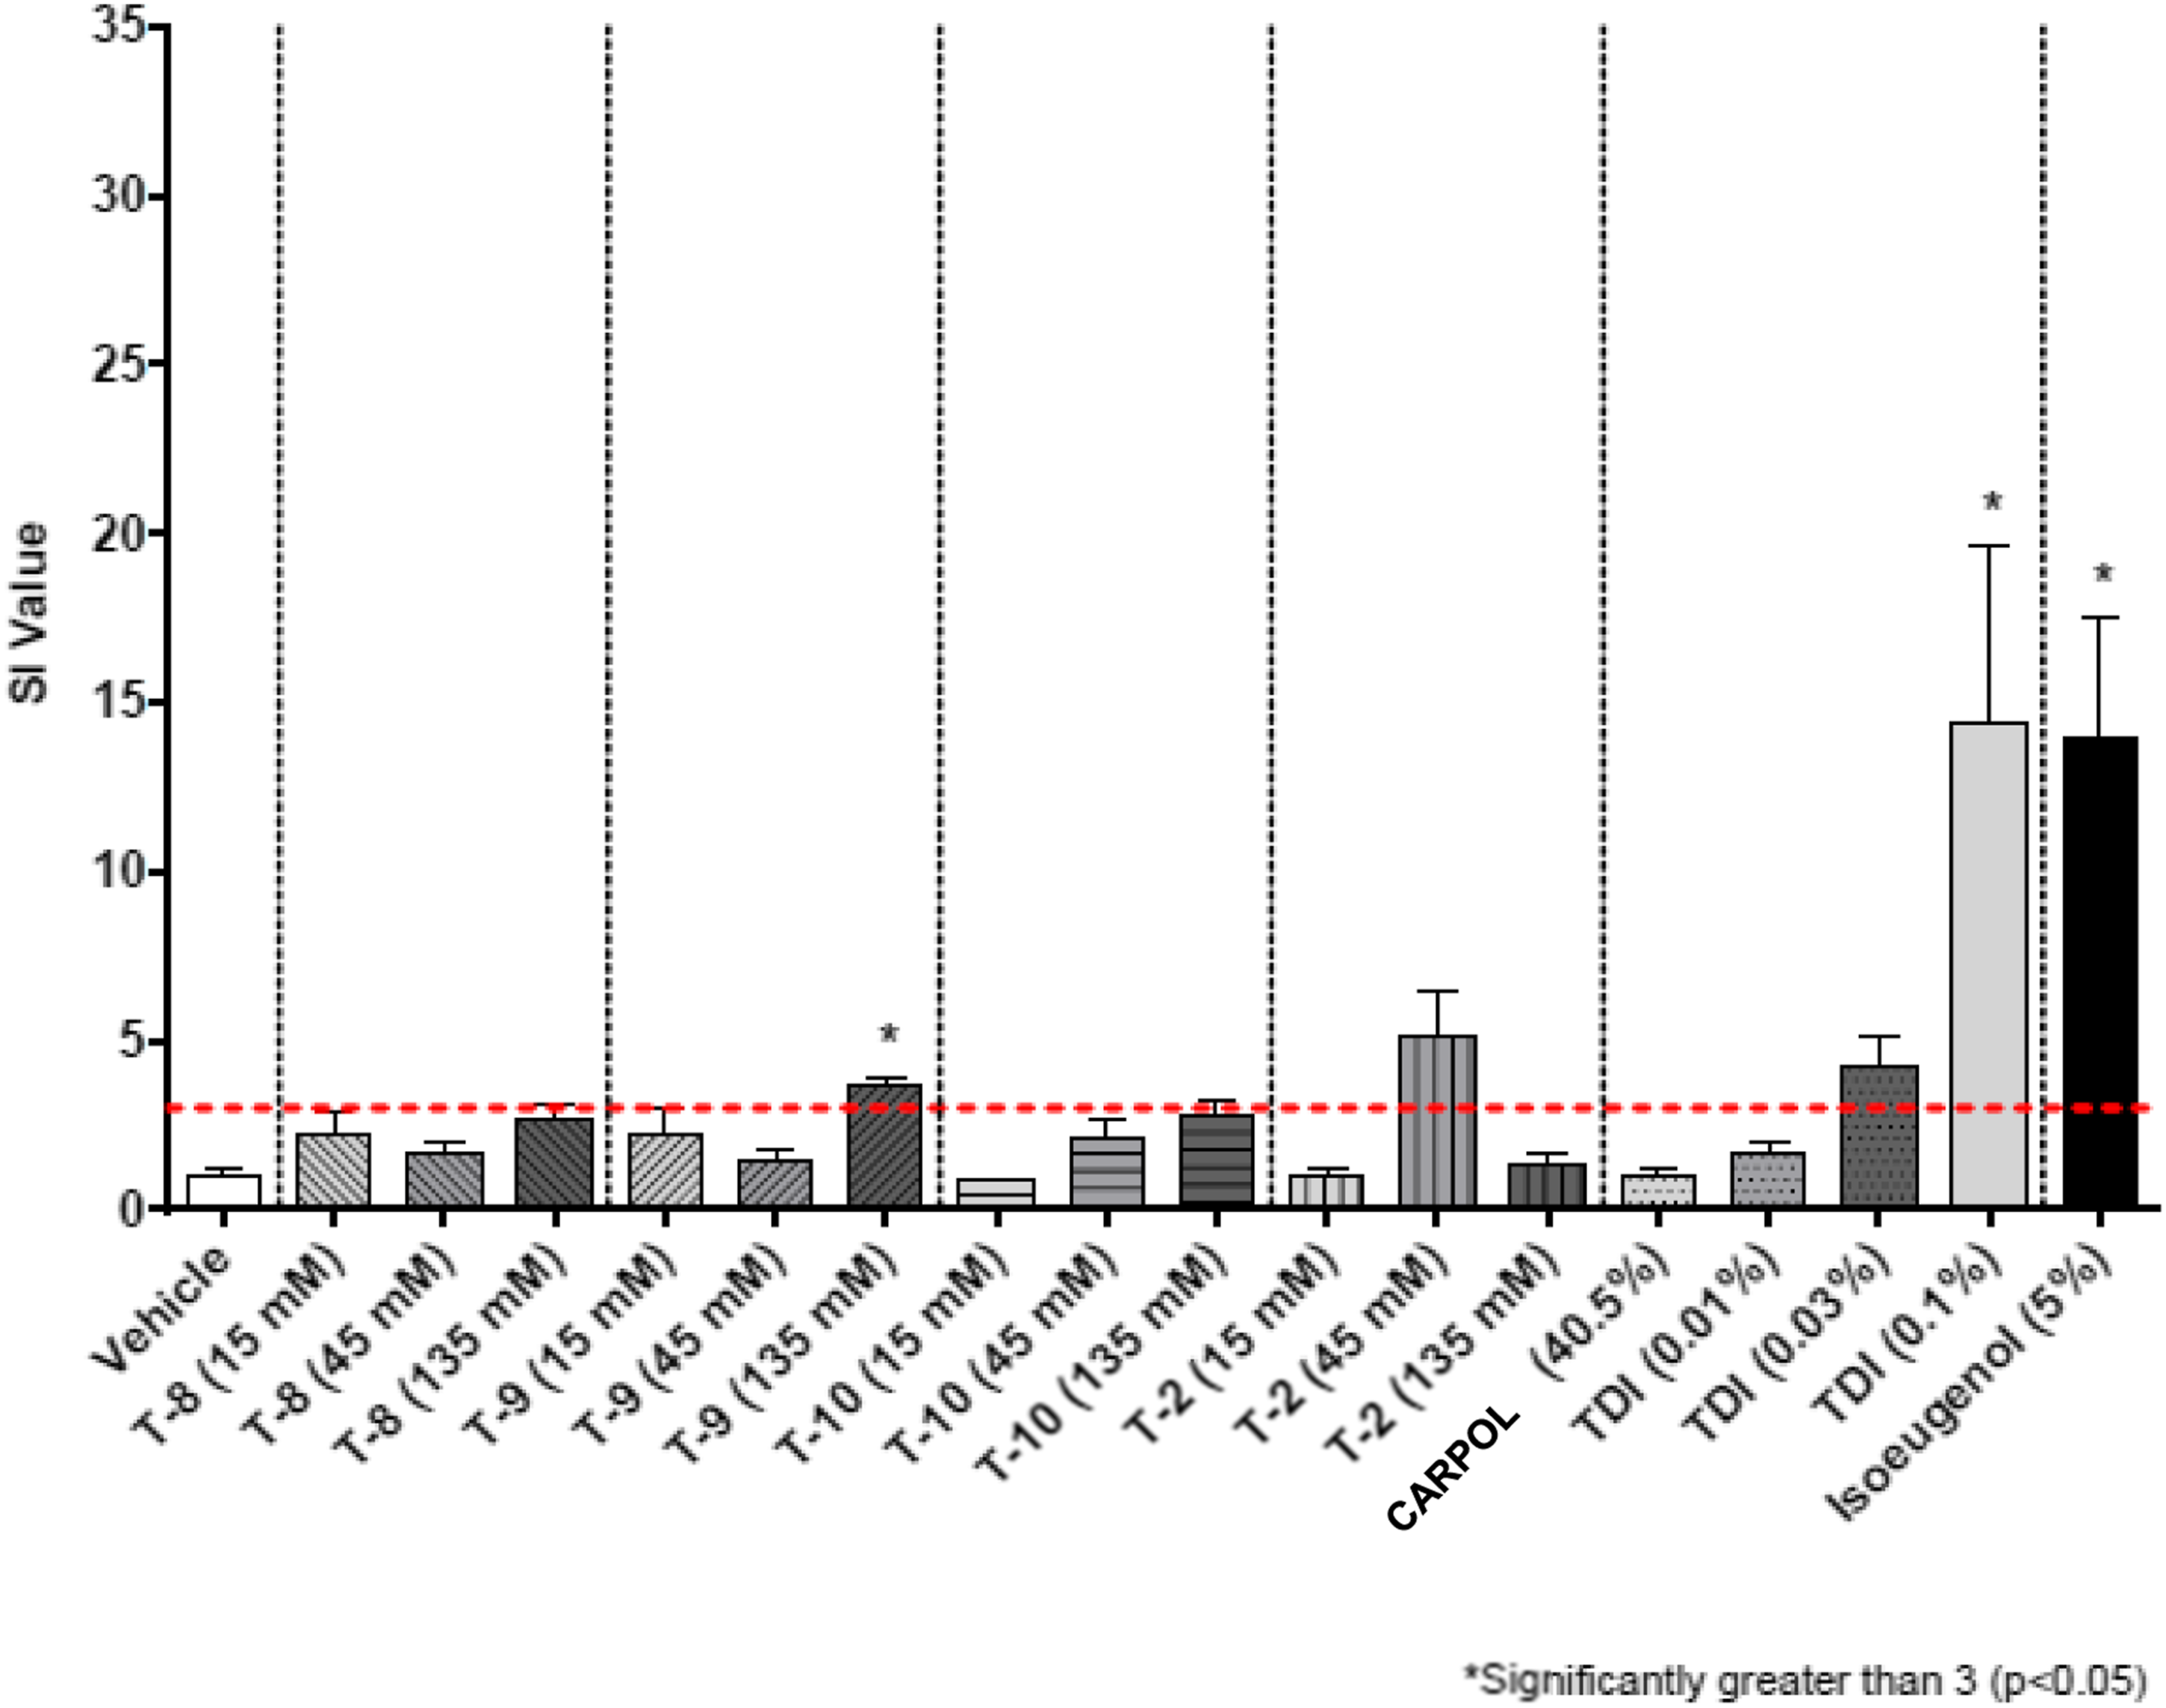
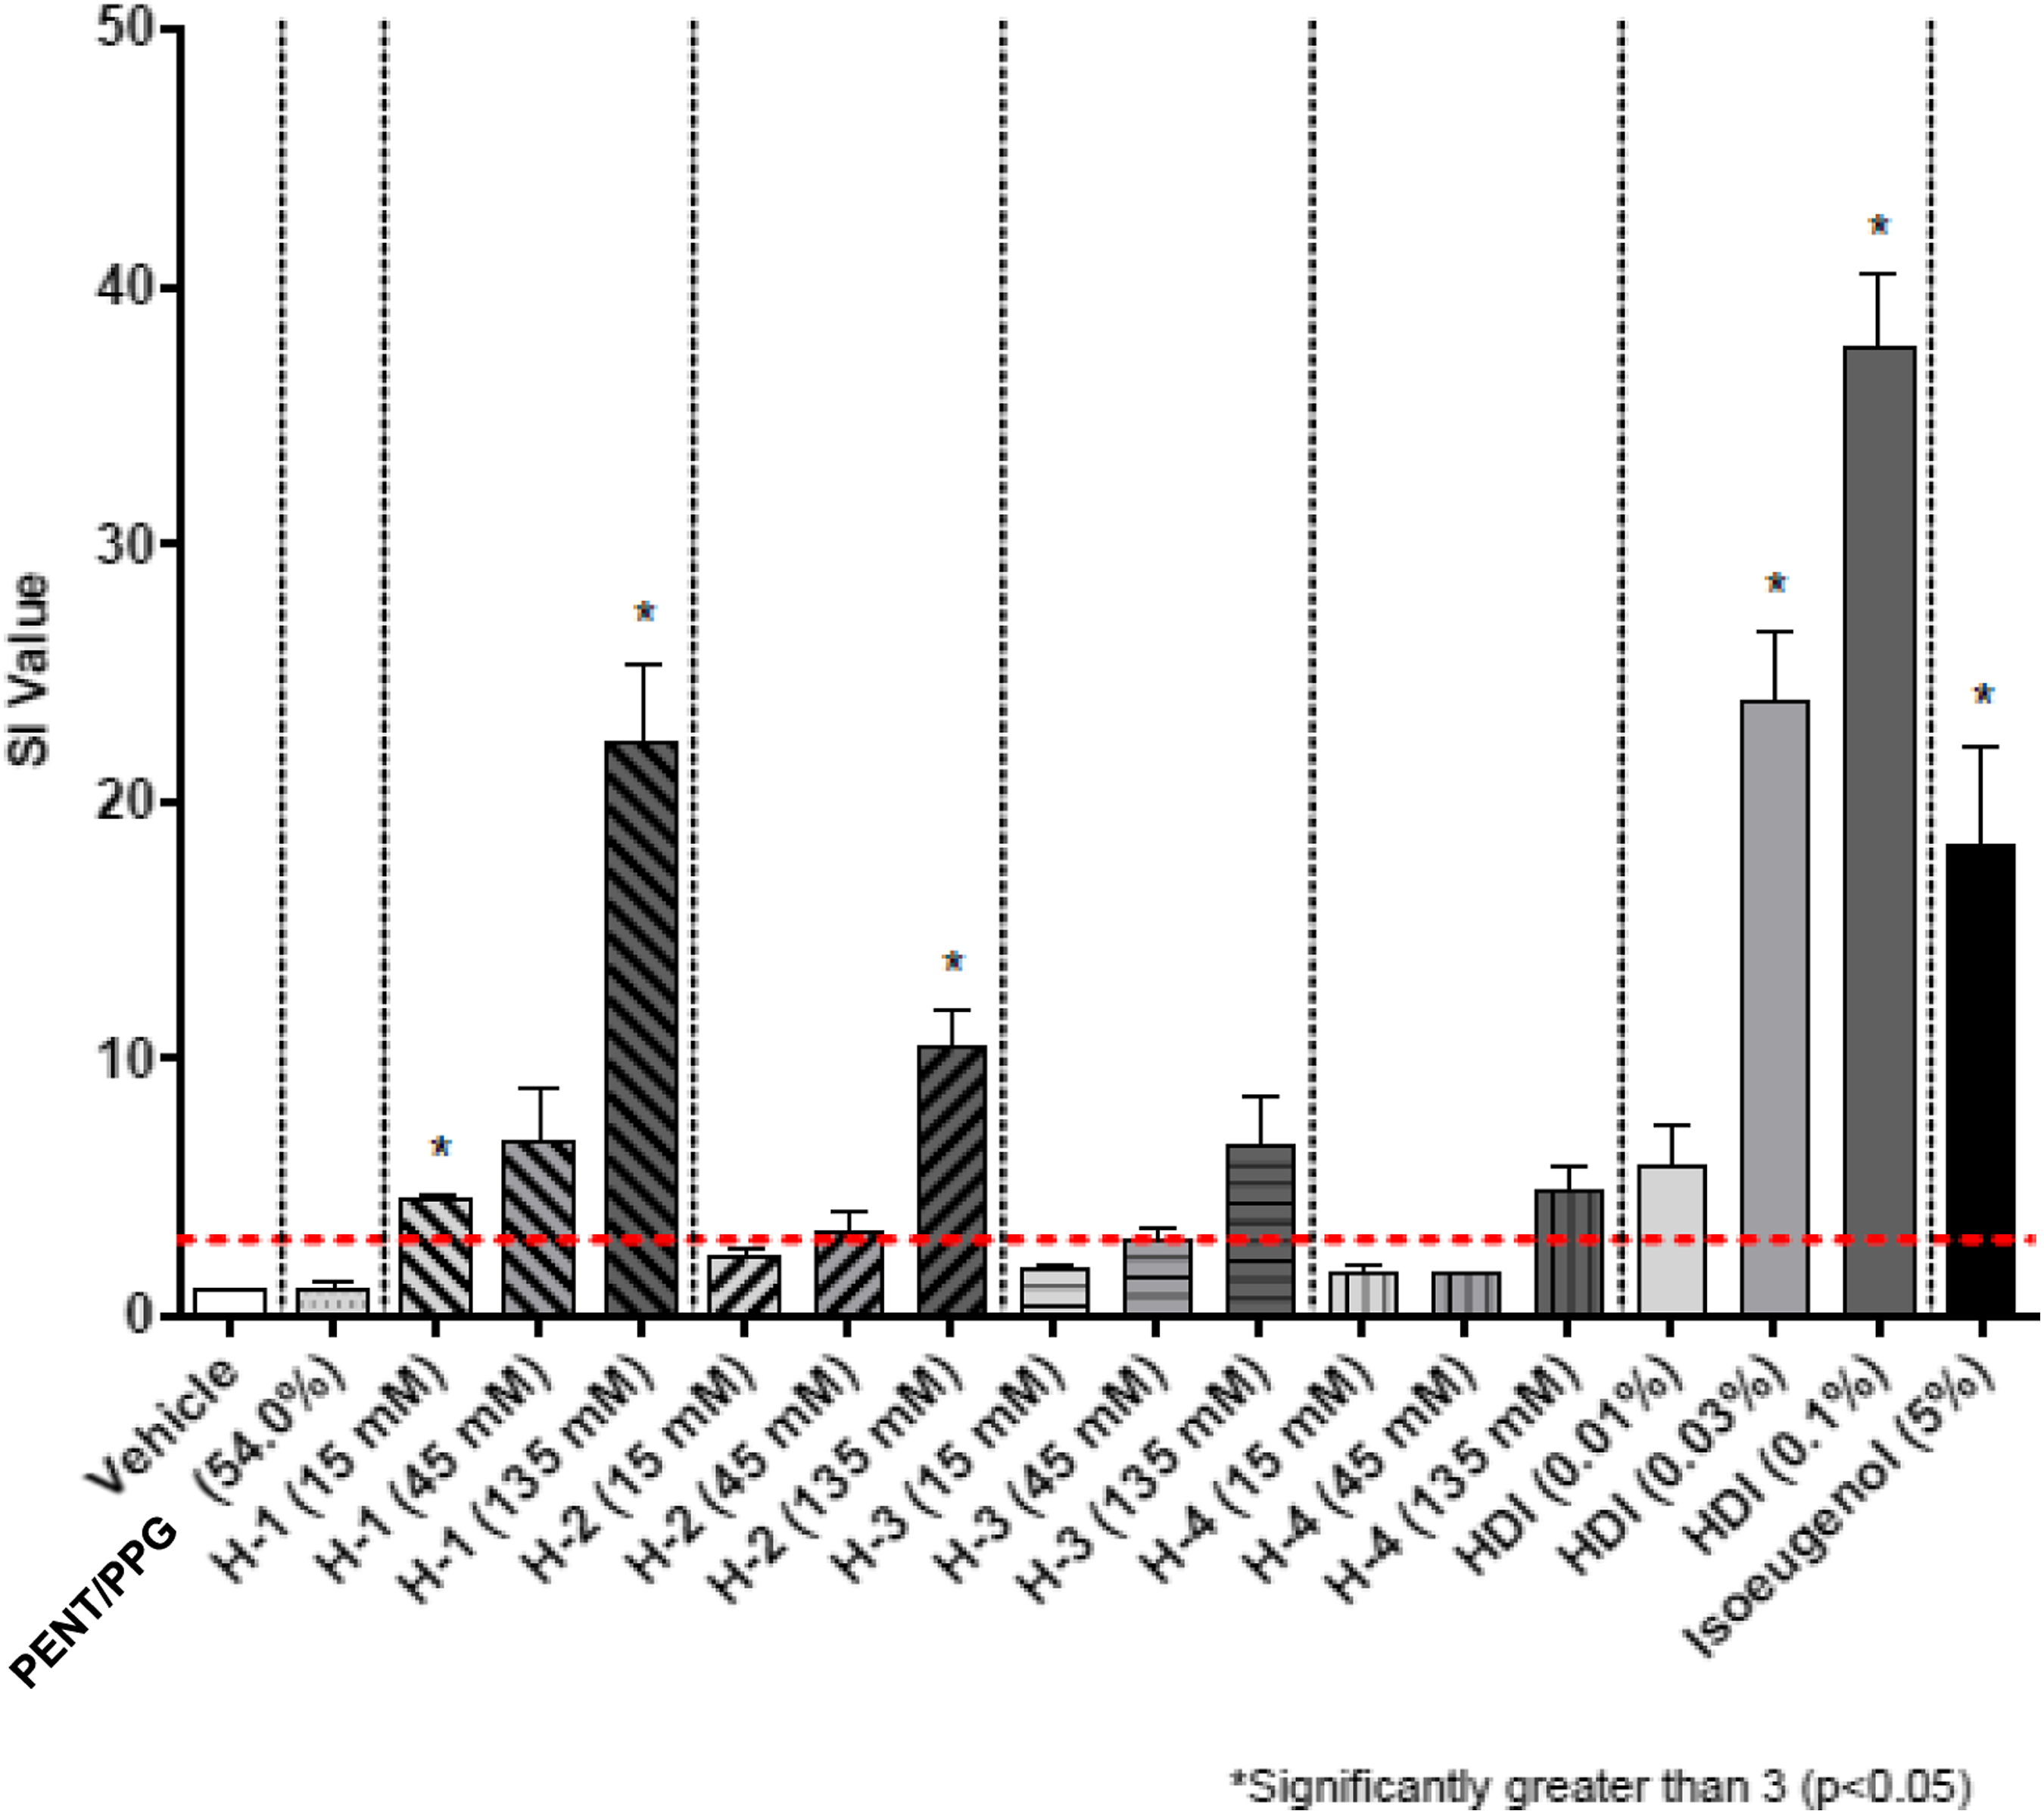
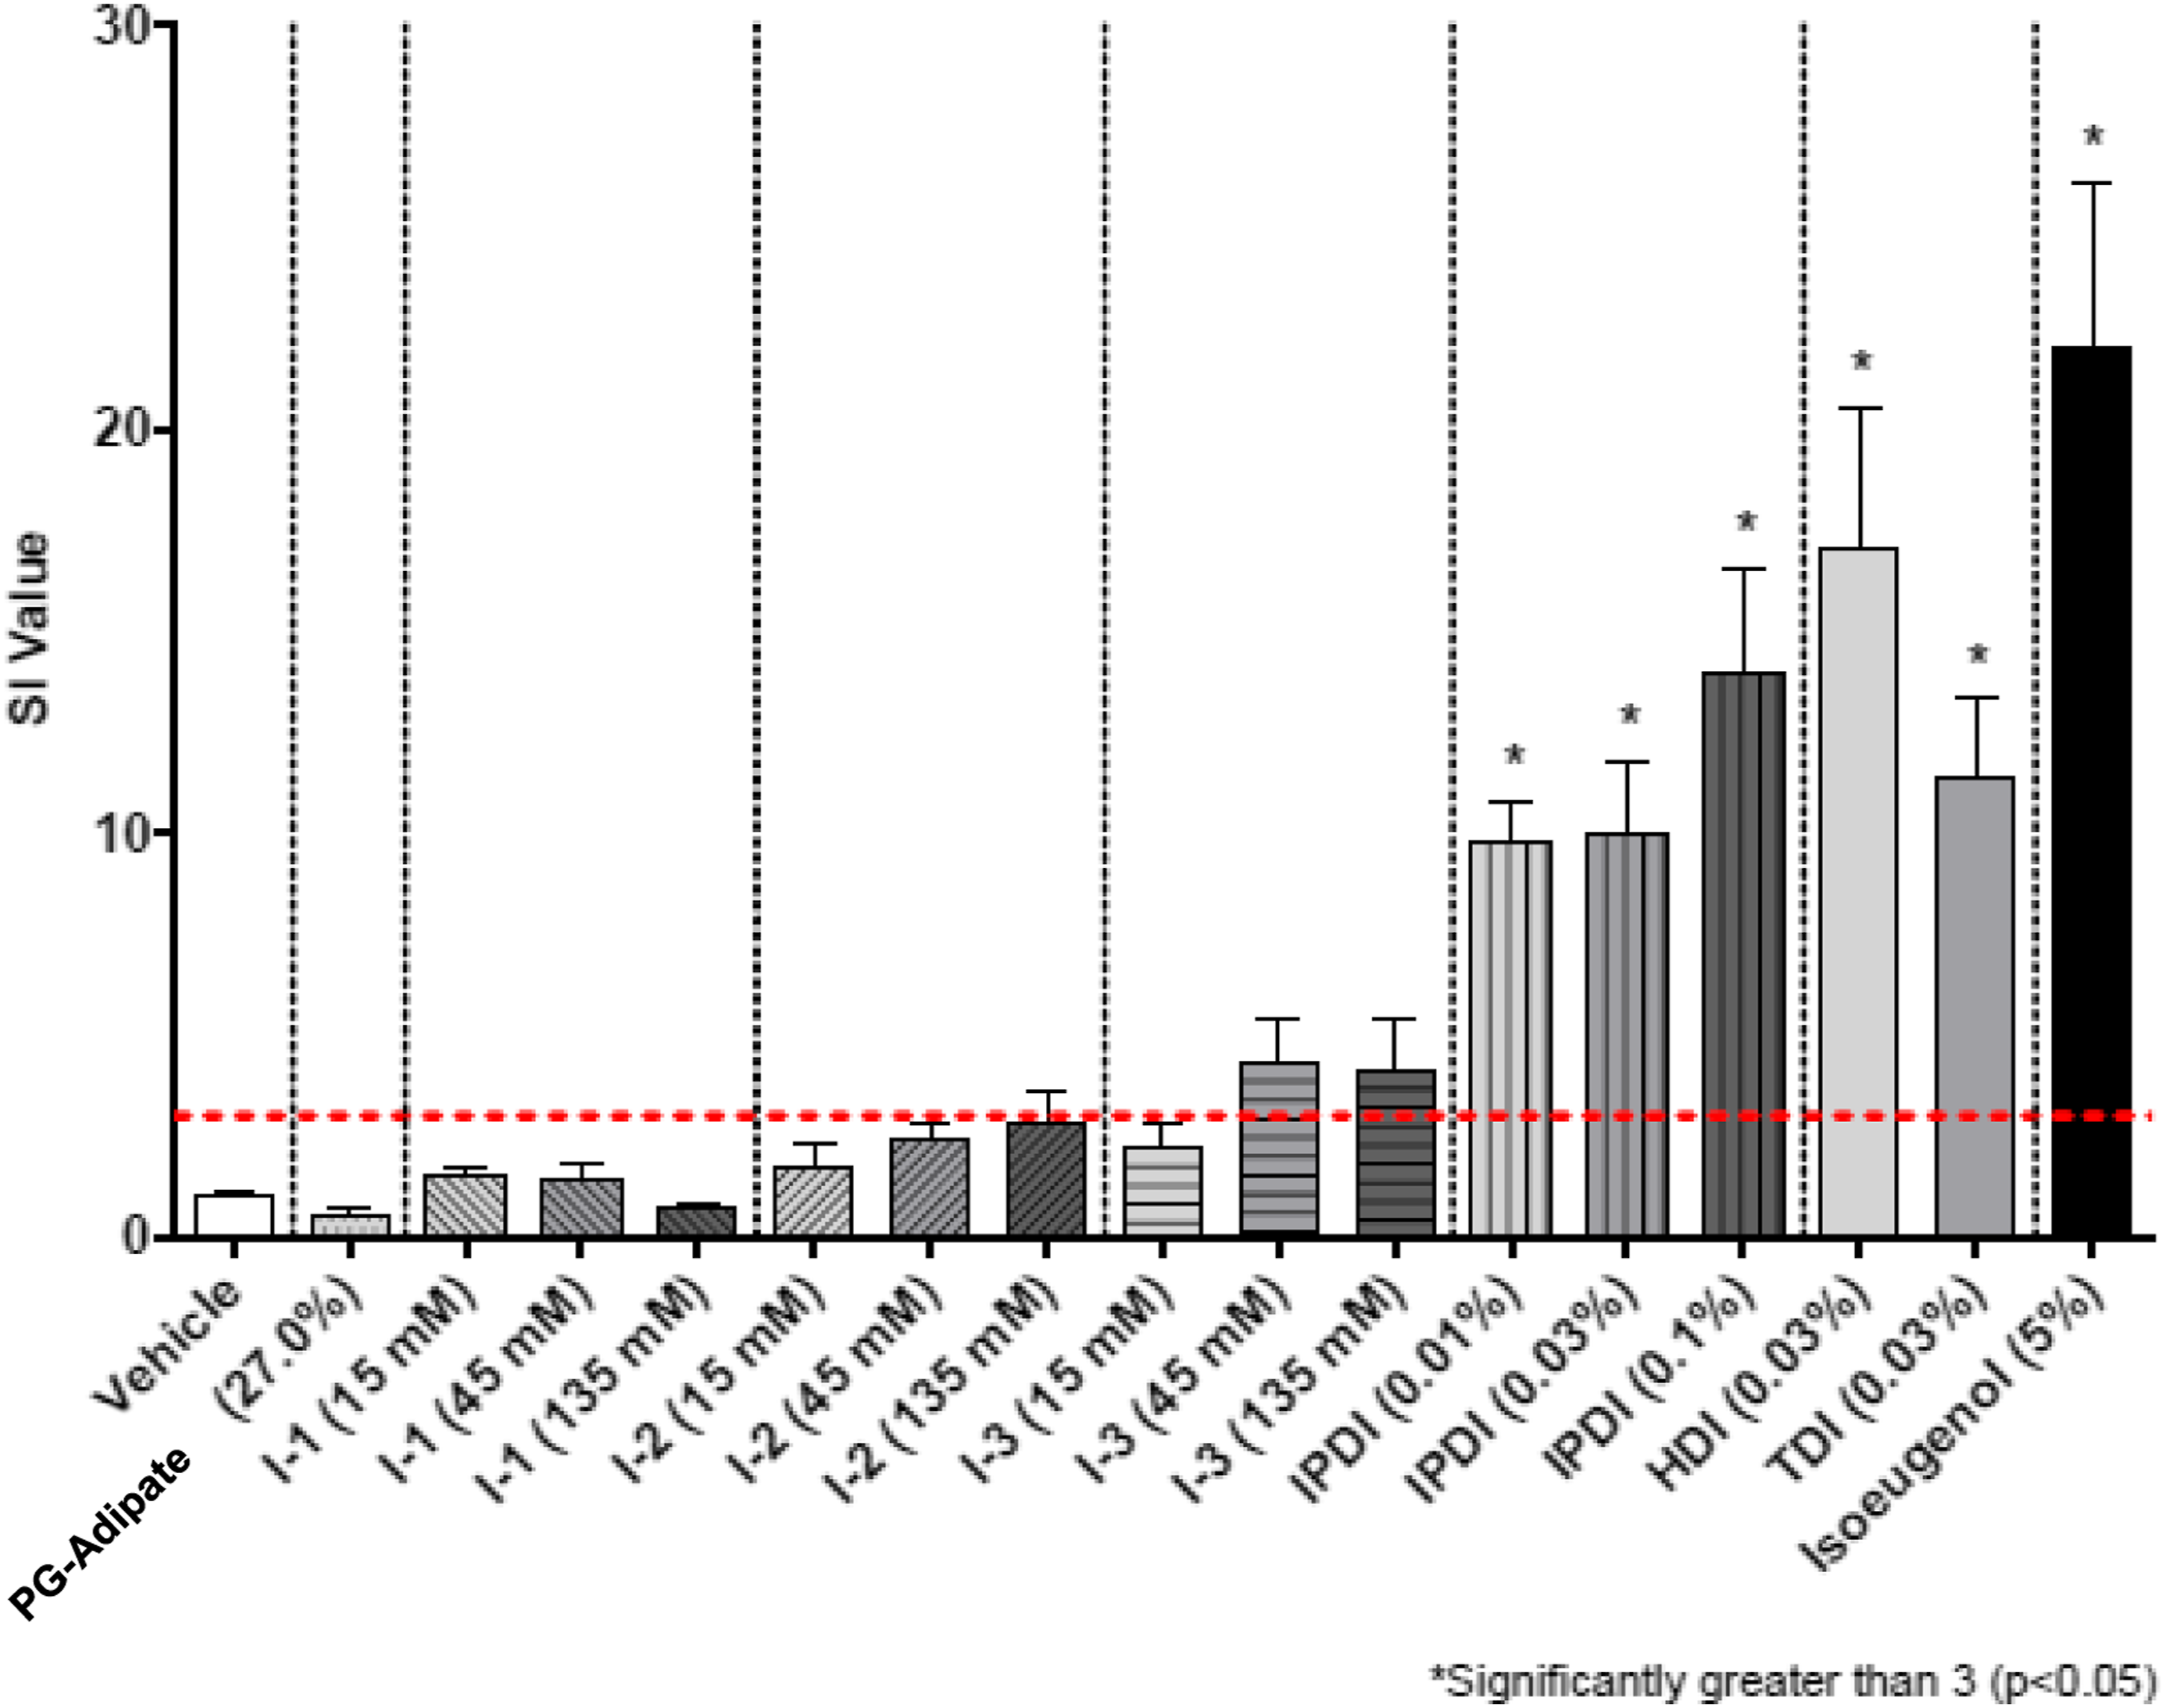
Results in the form of stimulation indices (SI) are shown in Figures 2–7 for all test groups. Sensitization (SI ≥ 3) was not noted in any individual animals in the vehicle control groups of the cohorts testing MDI-, TDI-, and HDI-based polymeric prepolymers. The one aforementioned individual animal in the vehicle control group of the cohort testing IPDI-based polymeric prepolymers that was identified as a statistical outlier, had an individual SI = 3.9 and was removed from the analysis. Sensitization (SI ≥ 3) was observed in all monomer reference and positive control (isoeugenol) groups, as expected. Stimulation index (SI) after dosing of the acetone-olive-oil vehicle, three MDI-based test substances, 4,4′-MDI monomer, two polyols, and 5% isoeugenol as a positive control. Bars represent the mean of the group stimulation index; flags represent the standard error of the mean. See Table 2 for test substance codes. The dashed horizontal line indicates SI = 3. Stimulation index (SI) after dosing of the acetone-olive-oil vehicle, four TDI-based test substances, mixed-TDI monomer, three polyols, and 5% isoeugenol as a positive control. Bars represent the mean of the group stimulation index; flags represent the standard error of the mean. See Table 2 for test substance codes. The dashed horizontal line indicates SI = 3. Stimulation index (SI) after dosing of the acetone-olive-oil vehicle, three TDI-based test substances, mixed-TDI monomer, two polyols, and 5% isoeugenol as a positive control. Bars represent the mean of the group stimulation index; flags represent the standard error of the mean. See Table 2 for test substance codes. The dashed horizontal line indicates SI = 3. Stimulation index (SI) after dosing of the acetone-olive-oil vehicle, four TDI-based test substances, mixed-TDI monomer, three polyols, and 5% isoeugenol as a positive control. Bars represent the mean of the group stimulation index; flags represent the standard error of the mean. See Table 2 for test substance codes. The dashed horizontal line indicates SI = 3. Stimulation index (SI) after dosing of four HDI-based test substances, the acetone-olive-oil vehicle, HDI monomer, one polyol, and 5% isoeugenol as a positive control. Bars represent the mean of the group stimulation index; flags represent the standard error of the mean. See Table 2 for test substance codes. The dashed horizontal line indicates SI = 3. Stimulation index (SI) after dosing of three IPDI-based test substances, the acetone-olive-oil vehicle, IPDI monomer, one polyol, and 5% isoeugenol as a positive control. Bars represent the mean of the group stimulation index; flags represent the standard error of the mean. See Table 2 for test substance codes. The dashed horizontal line indicates SI = 3.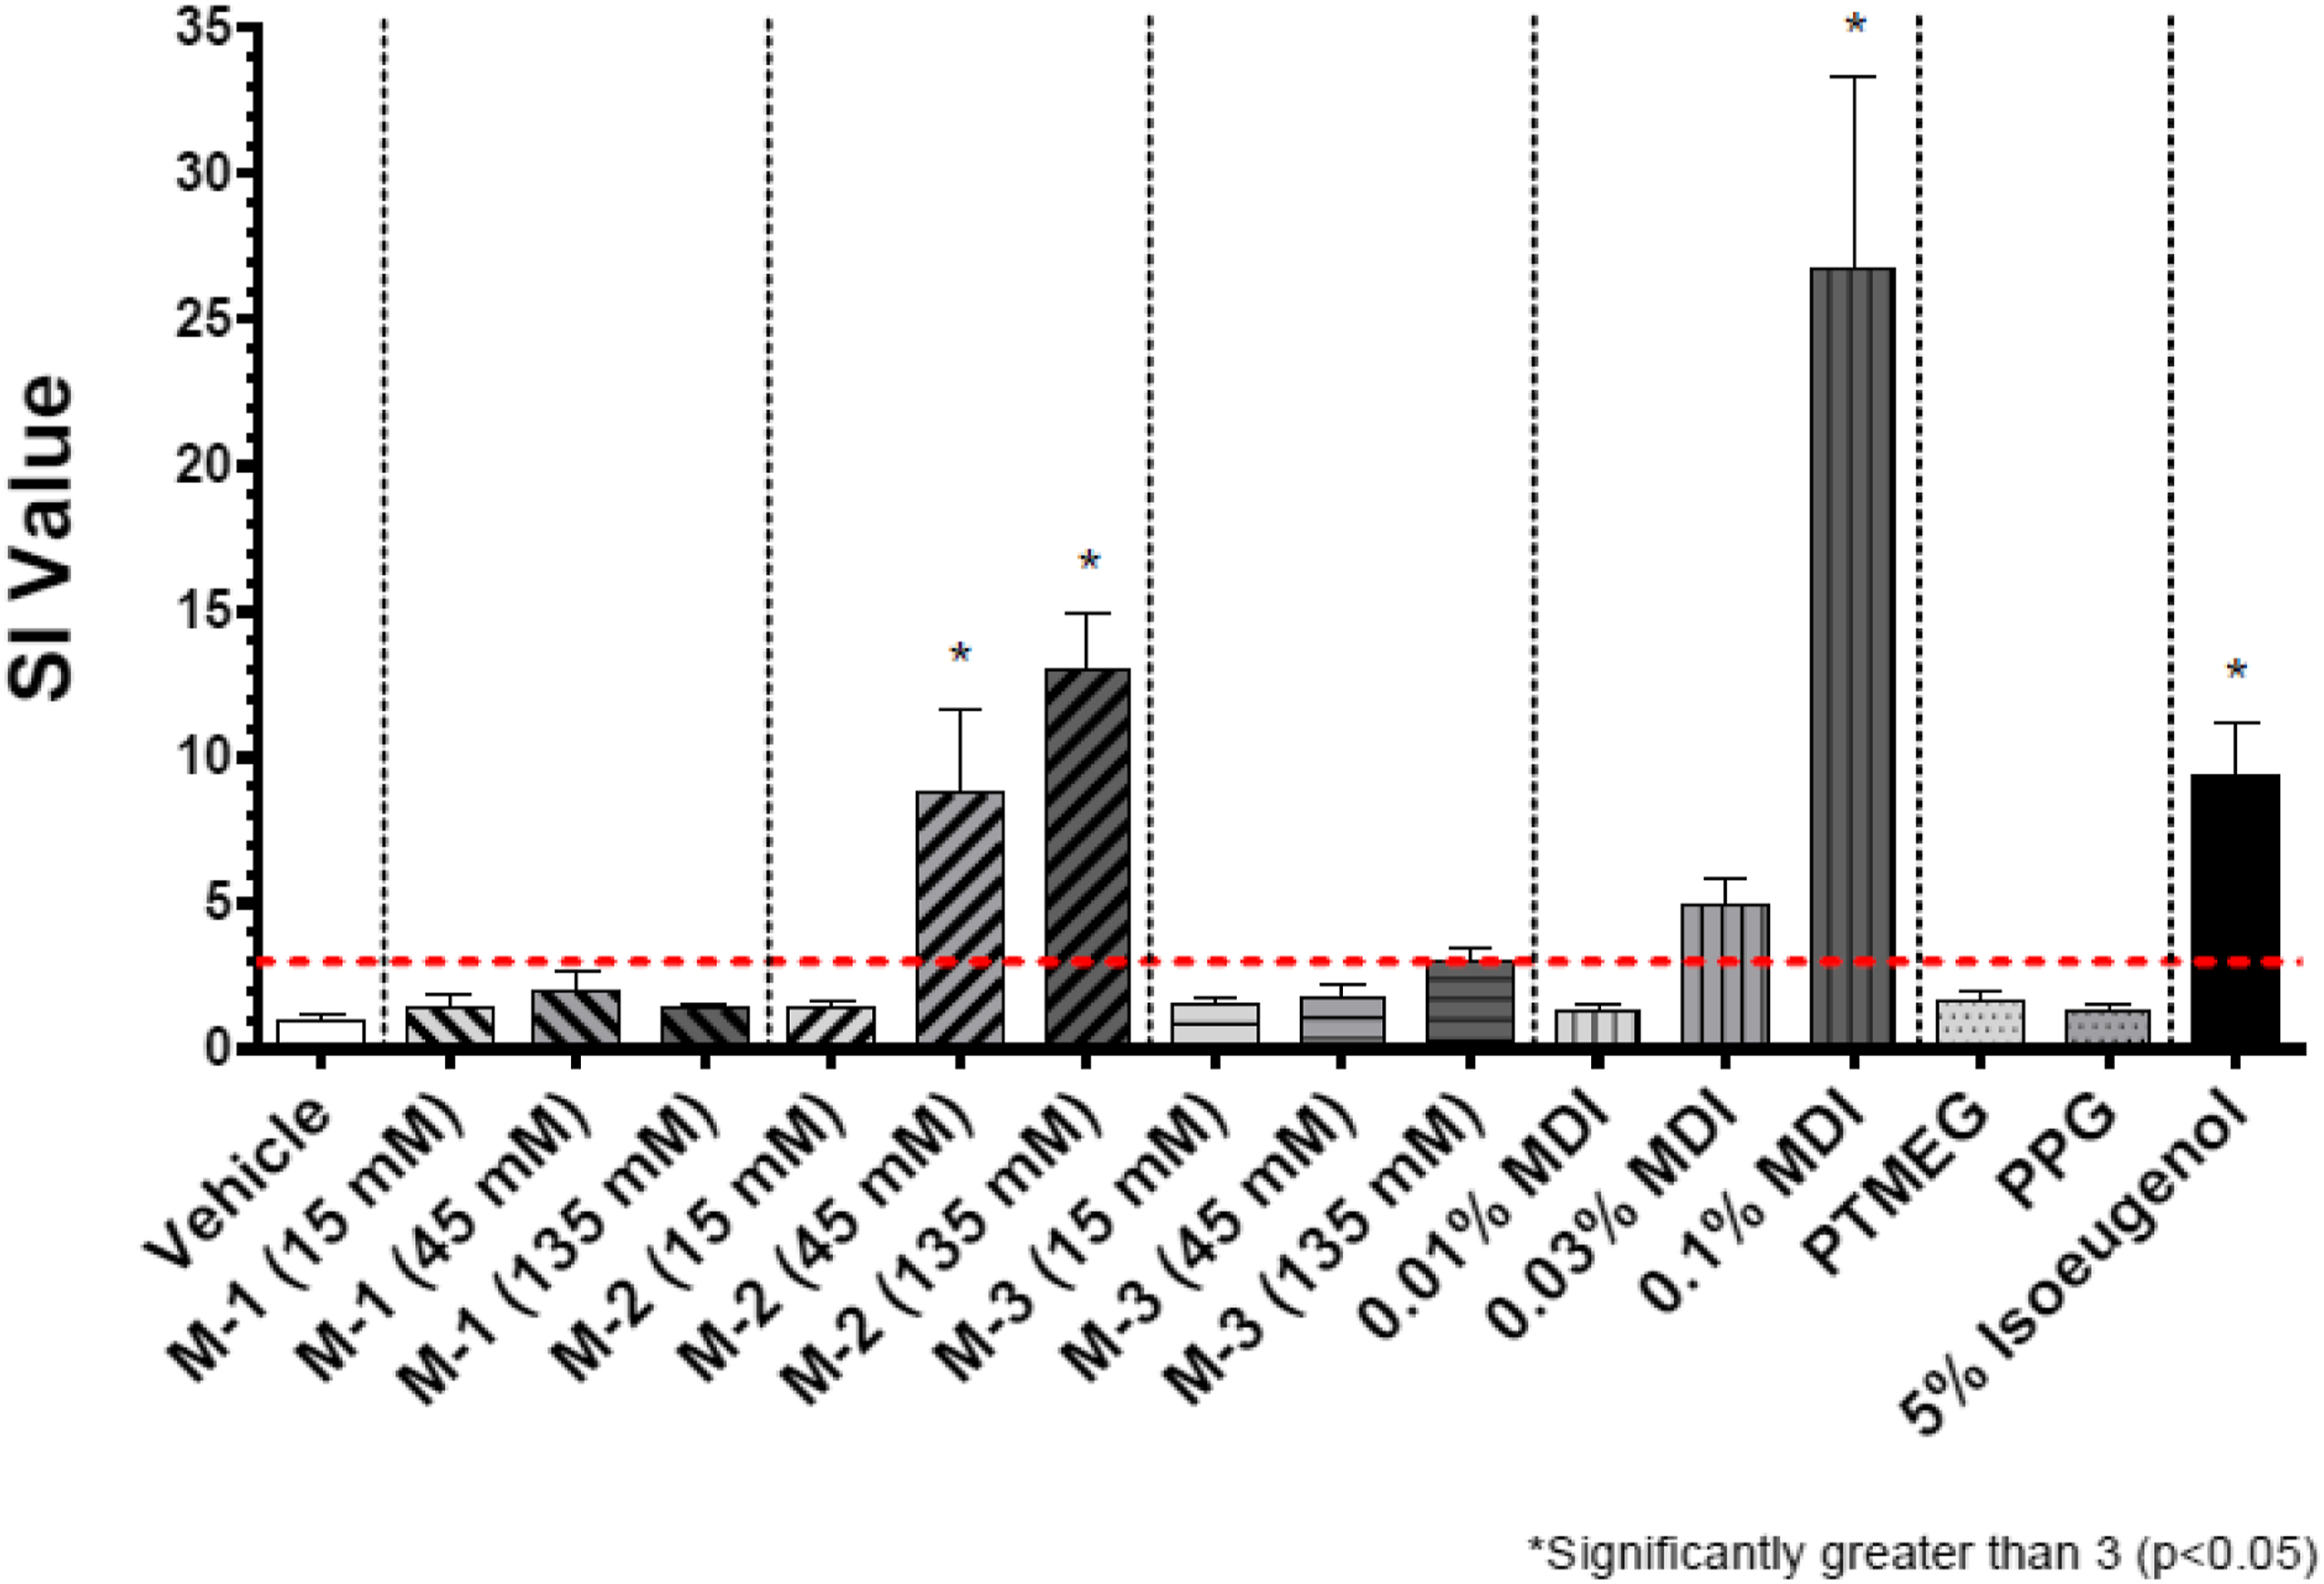
The group average SI values for all isoeugenol positive control groups were significantly greater than 3 (p < 0.05) and were consistent with historical reference data. The EC3 for isoeugenol was calculated as 0.5–1.4%, well within the 0.2–2.0% range of published EC3 values summarized by ECHA (2016). The corresponding EC3 potency value was between 120 and 300 μg/cm2, making isoeugenol a moderate sensitizer according to the criteria of Gerberick et al. (2001).
The SI for TDI monomer was significantly greater than 3 (p < 0.05) for groups exposed to 0.03 and 0.10% monomer. For MDI monomer, the SI was marginally greater than 3 (p = 0.10) for the group exposed to 0.03%, and significantly greater than 3 (p < 0.05) for the group exposed to 0.10%. The EC3 for MDI was calculated as 0.02% with an EC3 potency of 5 μg/cm2, making MDI a strong sensitizer. The EC3 for TDI was calculated as 0.017% with an EC3 potency of 4 μg/cm2, making TDI a strong sensitizer as well.
The SI for HDI was significantly greater than 3 (p < 0.05) for the groups exposed to 0.03 and 0.10% monomer. For IPDI, the SI was significantly greater than 3 (p < 0.05) at all three dose levels. The EC3 for HDI and IPDI were approximately 0.005 and 0.002%, respectively, and the corresponding EC3 potencies were at or below 1 μg/cm2, making HDI and IPDI strong sensitizers.
Stimulation indices for polyol references
The SI values for the reference polyols (135 mM) are included in Figures 2–7. Mean SI were <3 for all but one reference polyol. PPG/PEG 2000 which is a PEG/PPG/PEG tri-block copolymer (non-ionic surfactant) had a mean SI = 4.6 that did not significantly exceed the SI threshold of 3 (p = 0.42; one animal with SI = 11.2) but was significantly increased compared to vehicle controls. Based upon a calculated EC3 value of 17.4% and potency of 4355 μg/cm2, this polyol would be considered a weak sensitizer in the LLNA.
Stimulation indices for prepolymer test substances
The group mean SI values for nine polymeric prepolymer test substances were below the threshold of 3 for all concentrations tested: TDI-PPG 1350 (T-10), TDI-PTMEG 1750 (T-8), TDI-DEG/PCL 2350 (T-3), TDI-PPG/PEG 3350 (T-7), TDI-PTMEG 4350 (T-5), TDI-PPG/PEG 4350 (T-4), MDI-PTMEG 3400 (M-1), IPDI-PTMEG 3450 (I-1), and IPDI-PG-Adipate 2450 (I-2). For five of these test substances (TDI-DEG/PCL 2350, TDI-PTMEG 4350, TDI-PPG/PEG 3350, MDI-PTMEG 3400, and IPDI-PTMEG 3450), the SI was not significantly different from vehicle control. For TDI-PPG/PEG 4350 (T-4), TDI-PTMEG 1750 (T-8), and TDI-PPG 1350 (T-10), the respective SI (2.6, 2.7, and 2.7 at 135 mM) were significantly increased compared to vehicle control but did not cross the SI = 3 threshold. For IPDI-PG-Adipate 2450 (I-2), the SI at 135 mM (SI = 2.8) was marginally increased compared with the vehicle control (p = 0.08) but did not cross the SI = 3 threshold. For these nine test substances, no EC3 values could be calculated.
One additional test substance (TDI-PPG/PEG 2350 [T-2]) did not produce a dose-dependent response, whereby SI was <3 for the 45 and 135 mM test groups, but reached 3.7 for the 15 mM test group (one statistical outlier removed—result not significantly exceeding SI = 3) (Figure 4). The experiment was repeated (Figure 5). No response above vehicle control was observed at the 15 and 135 mM dosing levels, but SI reached 5.1 at the 45 mM dosing concentration (result not significantly exceeding SI = 3). From the repeat experiment, an EC3 of 7.0% was estimated.
For IPDI-GLY/PPG 6650 (I-3), the SI at the 45 and 135 mM dosing levels (4.3 and 4.1, respectively) were marginally increased compared to vehicle control (p=0.07) and exceeded the SI = 3 threshold, but not significantly (p=0.45). For this substance, the EC3 was calculated as 17.6%.
For four polymeric prepolymer test substances, the group mean SI was statistically increased compared with the controls for the 135 mM dose group but did not exceed the threshold of 3 statistically. For TDI-PEG 750 (T-6, SI = 3.6), the EC3 was calculated to be 7.7%. For MDI-PPG 4500 (M-3, SI = 3.1), the EC3 was calculated as 58.1%. For HDI-GLY/PEG/PPG 3500 (H-3, SI = 6.6; p = 0.14; wide range of individual responses), the EC3 was calculated as 15.8%. For HDI-PENT/PPG 4700 (H-4, SI = 4.9; p = 0.10; wide range of individual responses), the EC3 was calculated as 39.0%.
Five test substances resulted in SI values that significantly exceeded the threshold of 3 for the 135 mM dose group. For TDI-GLY/PPG 4750 (T-1, SI = 9.7), the EC3 was calculated as 26.6%. For TDI-GLY/PEG/PPG 3500 (T-9, SI = 3.6), the EC3 was calculated as 39.0%. For MDI-PPG 2500 (M-2, SI = 13.1), an EC3 of 5.5% was calculated. For HDI-PEG 750 (H-1, SI = 22.3), the EC3 was calculated as 0.61%. For HDI-PPG/PEG 4350 (H-2, SI = 10.4), the EC3 was calculated as 16.6%.
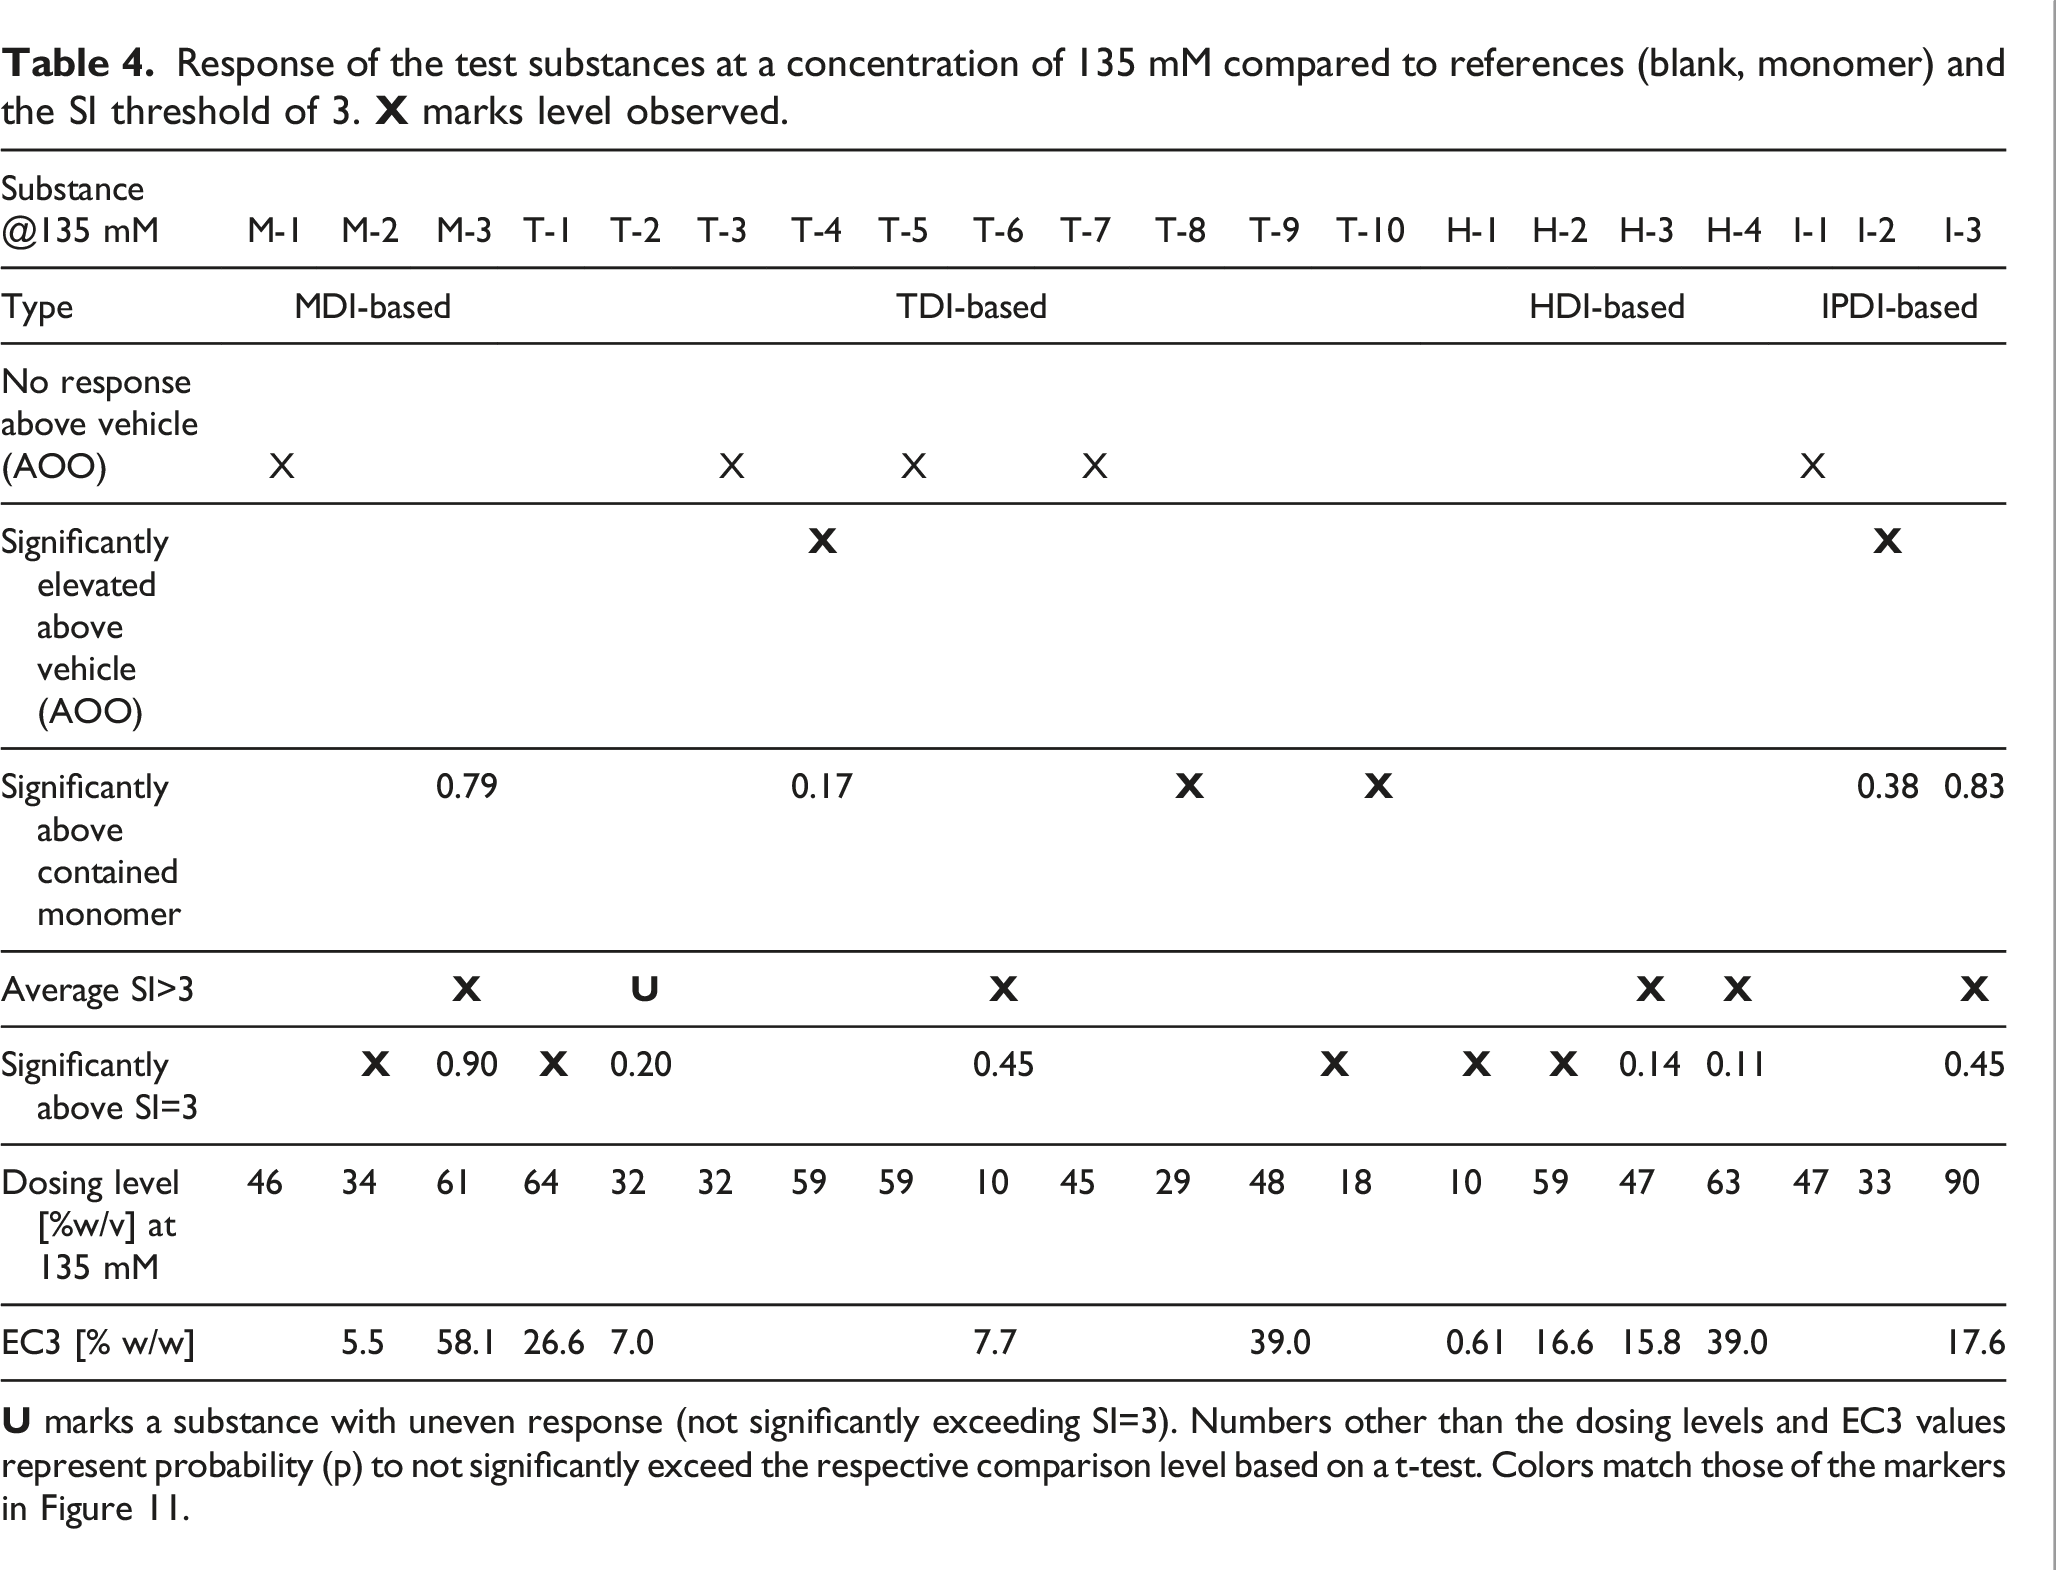
Response of the test substances at a concentration of 135 mM compared to references (blank, monomer) and the SI threshold of 3.
The polymeric prepolymers for which an EC3 value could be determined had EC3 potencies >1000 μg/cm2 and were considered weak sensitizers in the LLNA, except for HDI-PEG 750 (H-1), which was considered a moderate sensitizer in the LLNA (EC3 potency ca. 150 μg/cm2).
Contribution of diisocyanate monomer content
Figure 8 shows the group mean SI of every dosing group of the TDI- and MDI-based test substances plotted against the diisocyanate monomer concentration in the dosing solutions. The SI = 3 threshold is represented by the red line. The blue and green lines represent the best fit of the SI for the TDI and MDI monomers, respectively. Dosing group average stimulation index (SI) for aromatic polymeric prepolymers versus diisocyanate monomer content in the dosing solutions. Dosing vehicle: acetone-olive-oil. Squares: MDI-based test substances; circles, diamonds and triangles: TDI-based substances; cross (x): ambiguous dose response. Black-filled markers: SI at 135 mM significantly (p<0.05) exceeding the threshold of 3; gray- or color-filled markers: SI increased compared to controls, but not or not significantly exceeding the threshold; open markers: SI not significantly increased compared to vehicle control. The red line indicates the SI = 3 threshold. The blue and green dotted lines represent polynomial (2nd order) fits to the responses for the TDI and MDI monomers, respectively.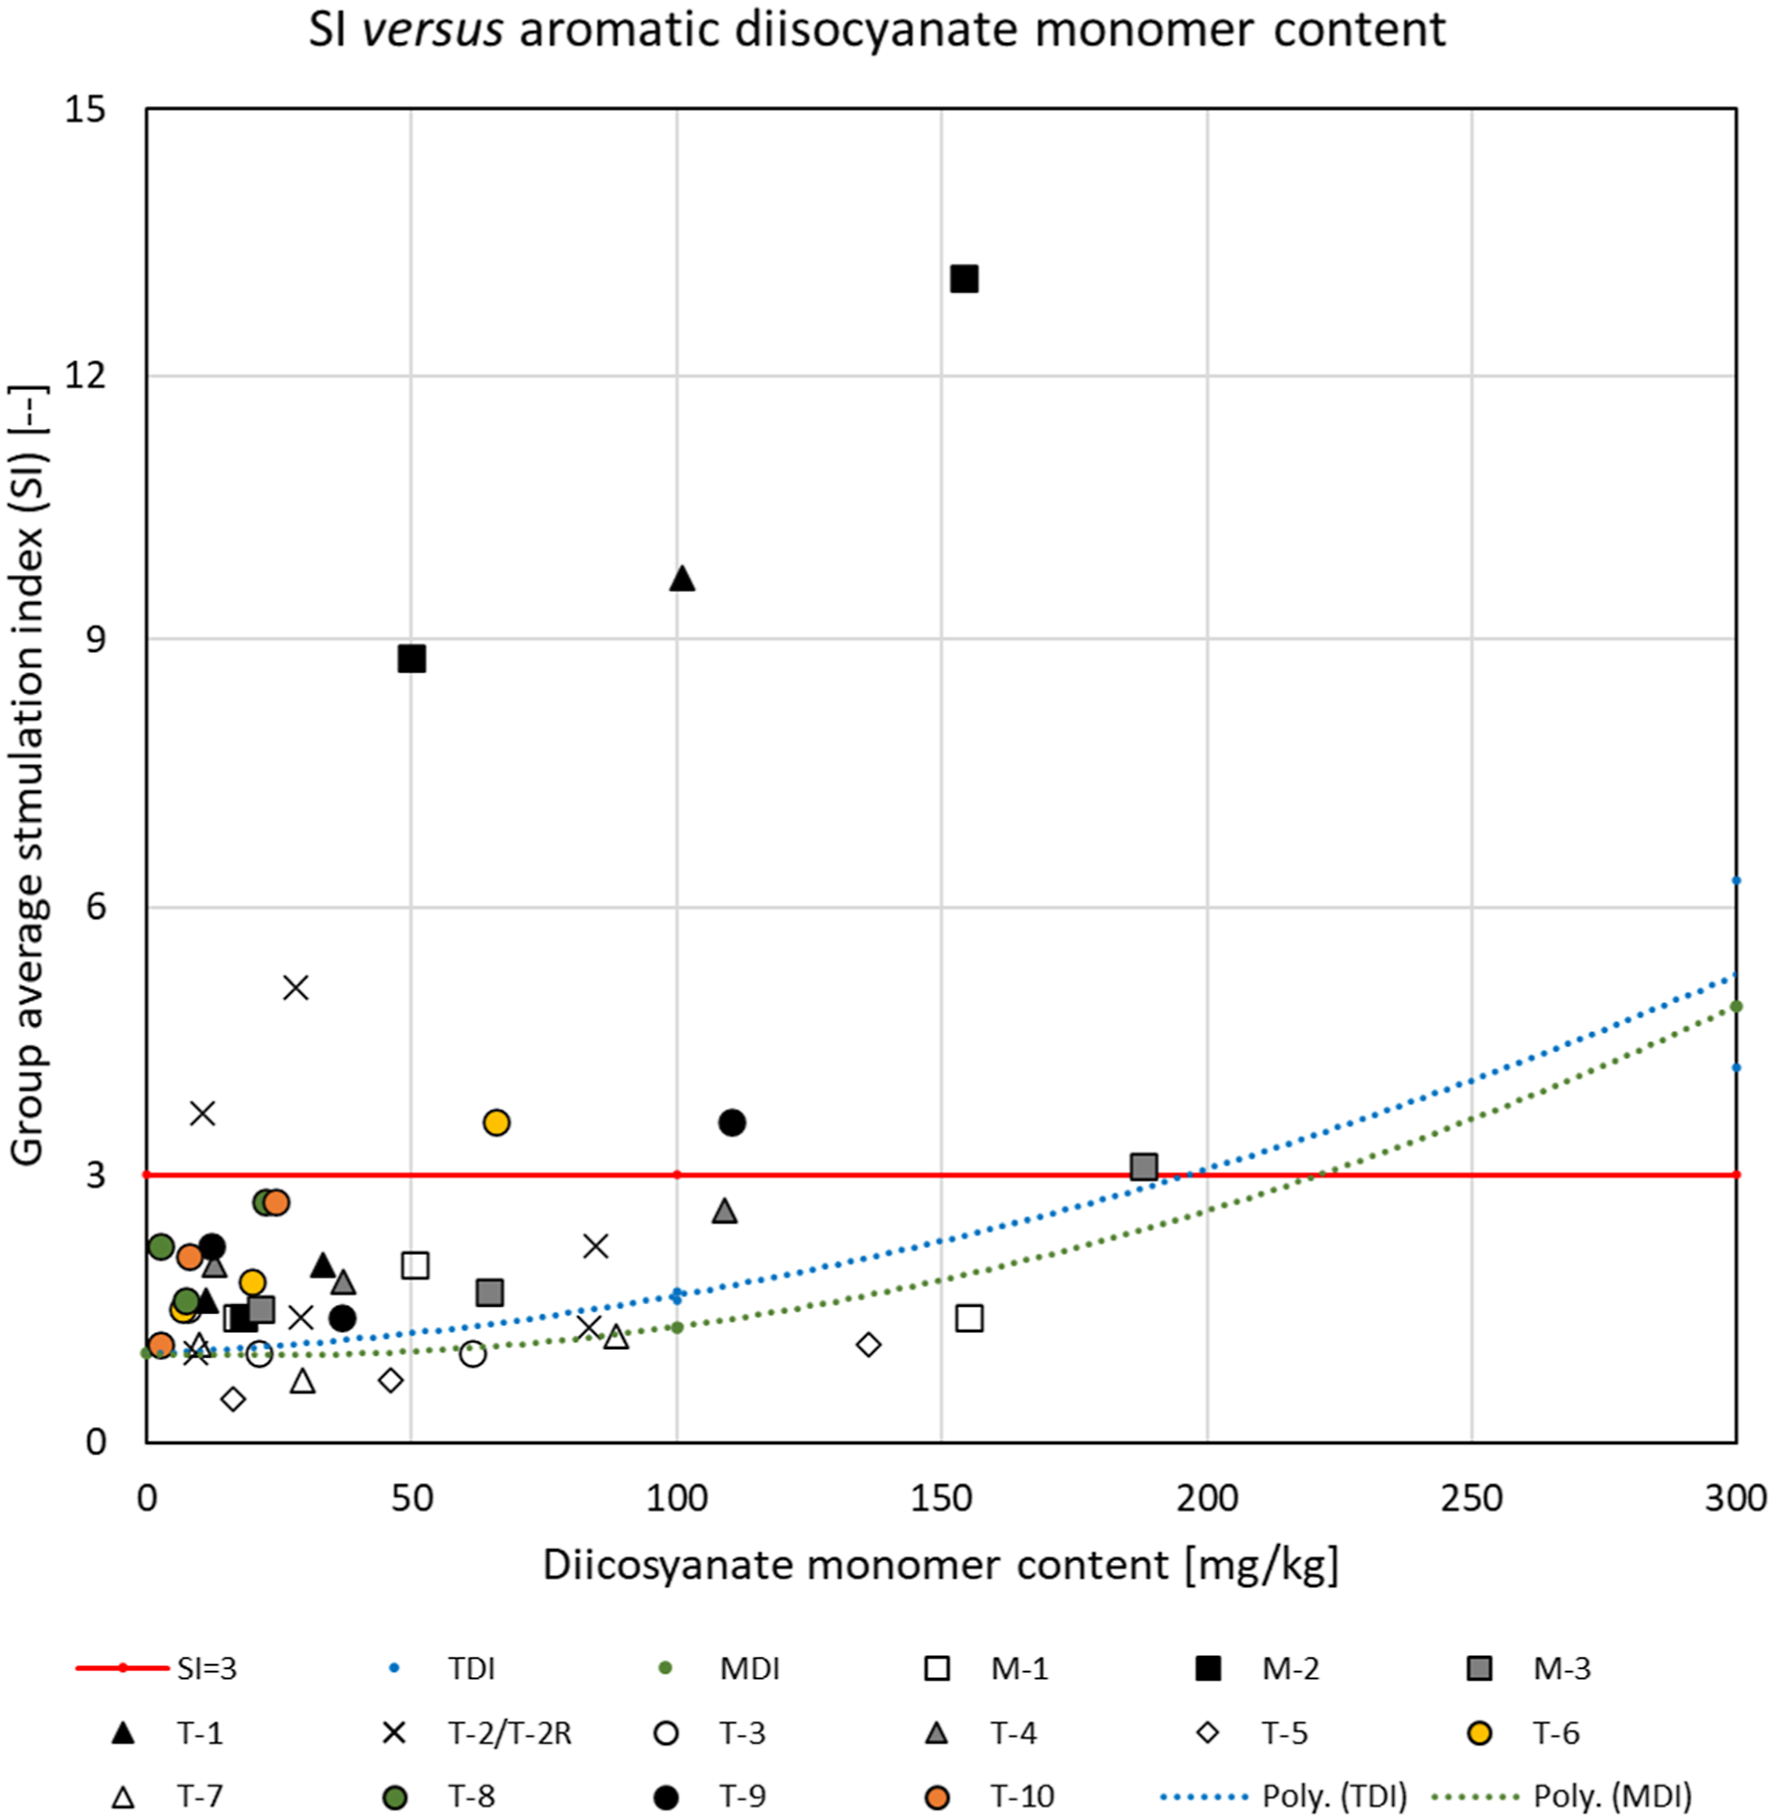
In the case of the four aromatic test substances for which the SI was consistently <3 and not greater than vehicle control (open markers in Figure 8), the SI was in general less than that attributable to the concentration of the corresponding diisocyanate monomer in the dosing solutions. For several test substances (black- and color-filled markers) a clear dose-response beyond that attributable to the corresponding monomer content could be observed. For other substances, the response could be considered equivocal (gray-filled markers) when the contribution of the monomer was considered. For instance, it appears that the sensitizing effect for MDI-PPG 4500 (M-3—gray squares) is mainly driven by the residual monomer content in the dosing solution (p=0.79—see Table 4 and Figure 8). For TDI-PPG/PEG 4350 (T-4—gray triangles), the SI was not significantly increased compared to that of the monomer level contained in the dosing solutions (p = 0.17—see Table 4 and Figure 8). Figure 8 also illustrates the equivocal dose-responses of TDI-PPG/PEG 2350 (T-2—marked with X).
Figure 9 shows a similar graph for the HDI- and IPDI-based test substances. The red line again represents the SI=3 threshold, and the blue and green lines represent the best fit of the SI for the HDI and IPDI monomers, respectively. Dosing group average stimulation index (SI) for aliphatic polymeric prepolymers versus diisocyanate monomer content in the dosing solutions. Dosing vehicle: acetone-olive-oil. Squares and circles: HDI-based test substances; diamonds: IPDI-based substances. Black-filled markers: SI at 135 mM significantly (p<0.05) exceeding the threshold of 3; gray- and pattern-filled markers: SI increased compared to controls, but not or not significantly exceeding the threshold; open markers: SI not significantly increased compared to vehicle control. The red line indicates the SI = 3 threshold. The blue and green dotted lines represent the polynomial (2nd order) or linear fit to the responses for HDI and IPDI monomers, respectively. Note: value for H-1 at 135 mM (SI=22.3) not shown.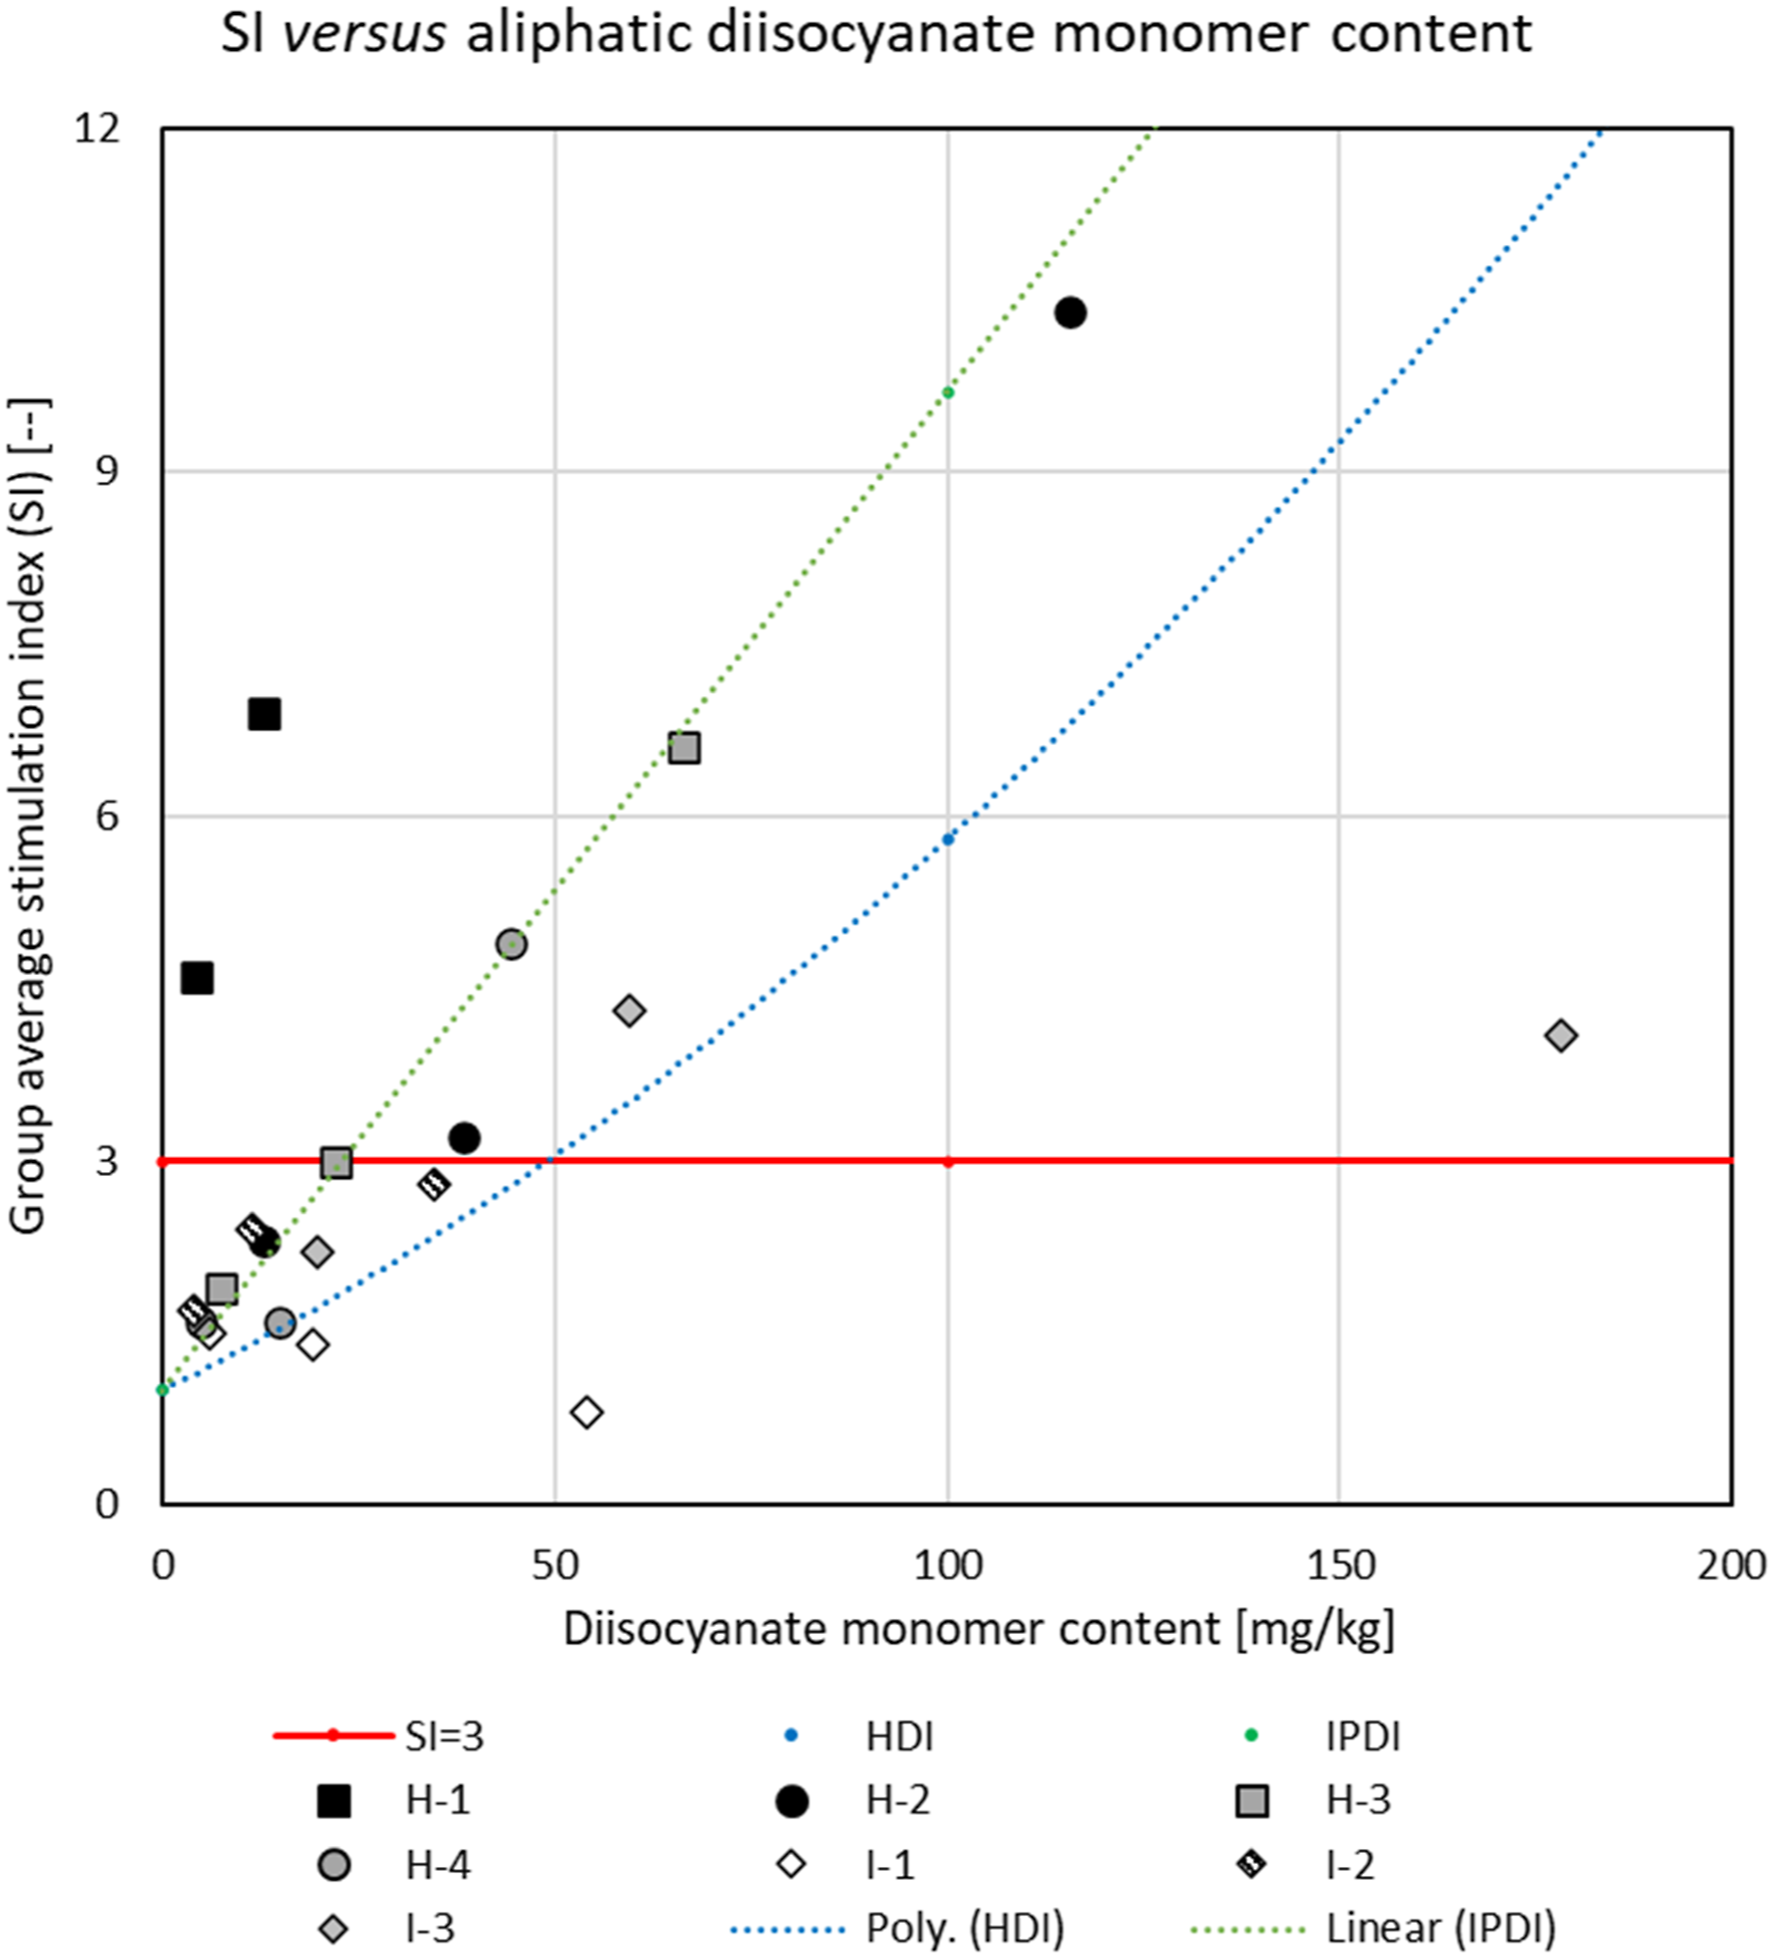
The SI values for all HDI-based polymeric prepolymers (square and circular markers) were, as a minimum, marginally increased (p ≤ 0.07) compared to that attributable to the monomer concentration in the dosing solutions. For the IPDI-based polymeric prepolymers (diamond markers), the SI-scores did not exceed those attributable to the monomer concentration. For the one aliphatic test substance for which the SI was not elevated compared to vehicle control (IPDI-PTMEG 3450 [I-1]—open diamond), the SI was less than that attributable to the monomer content in the dosing solutions.
Influence of test substance NCO content
Using the principles outlined in Basketter et al. (1999), EC3 values could be determined for 11 test substances. These EC3 values are listed in Table 4 and are presented graphically as a function of the FGEW in Figure 10. The FGEW is inversely proportional to the NCO content (%NCO) of a test substance. EC3 values for the polymeric prepolymers in relationship to the isocyanate functional-group-equivalent molecular weight (number-averaged molecular weight of the polymeric prepolymer divided by the NCO functionality [i.e., number of NCO groups per molecule]). Symbols: squares = TDI-based; circles = MDI-based; diamonds = HDI-based; triangles = IPDI-based; filled = bifunctional; open = trifunctional; pattern-filled = quadrifunctional; red-filled = diisocyanate monomers.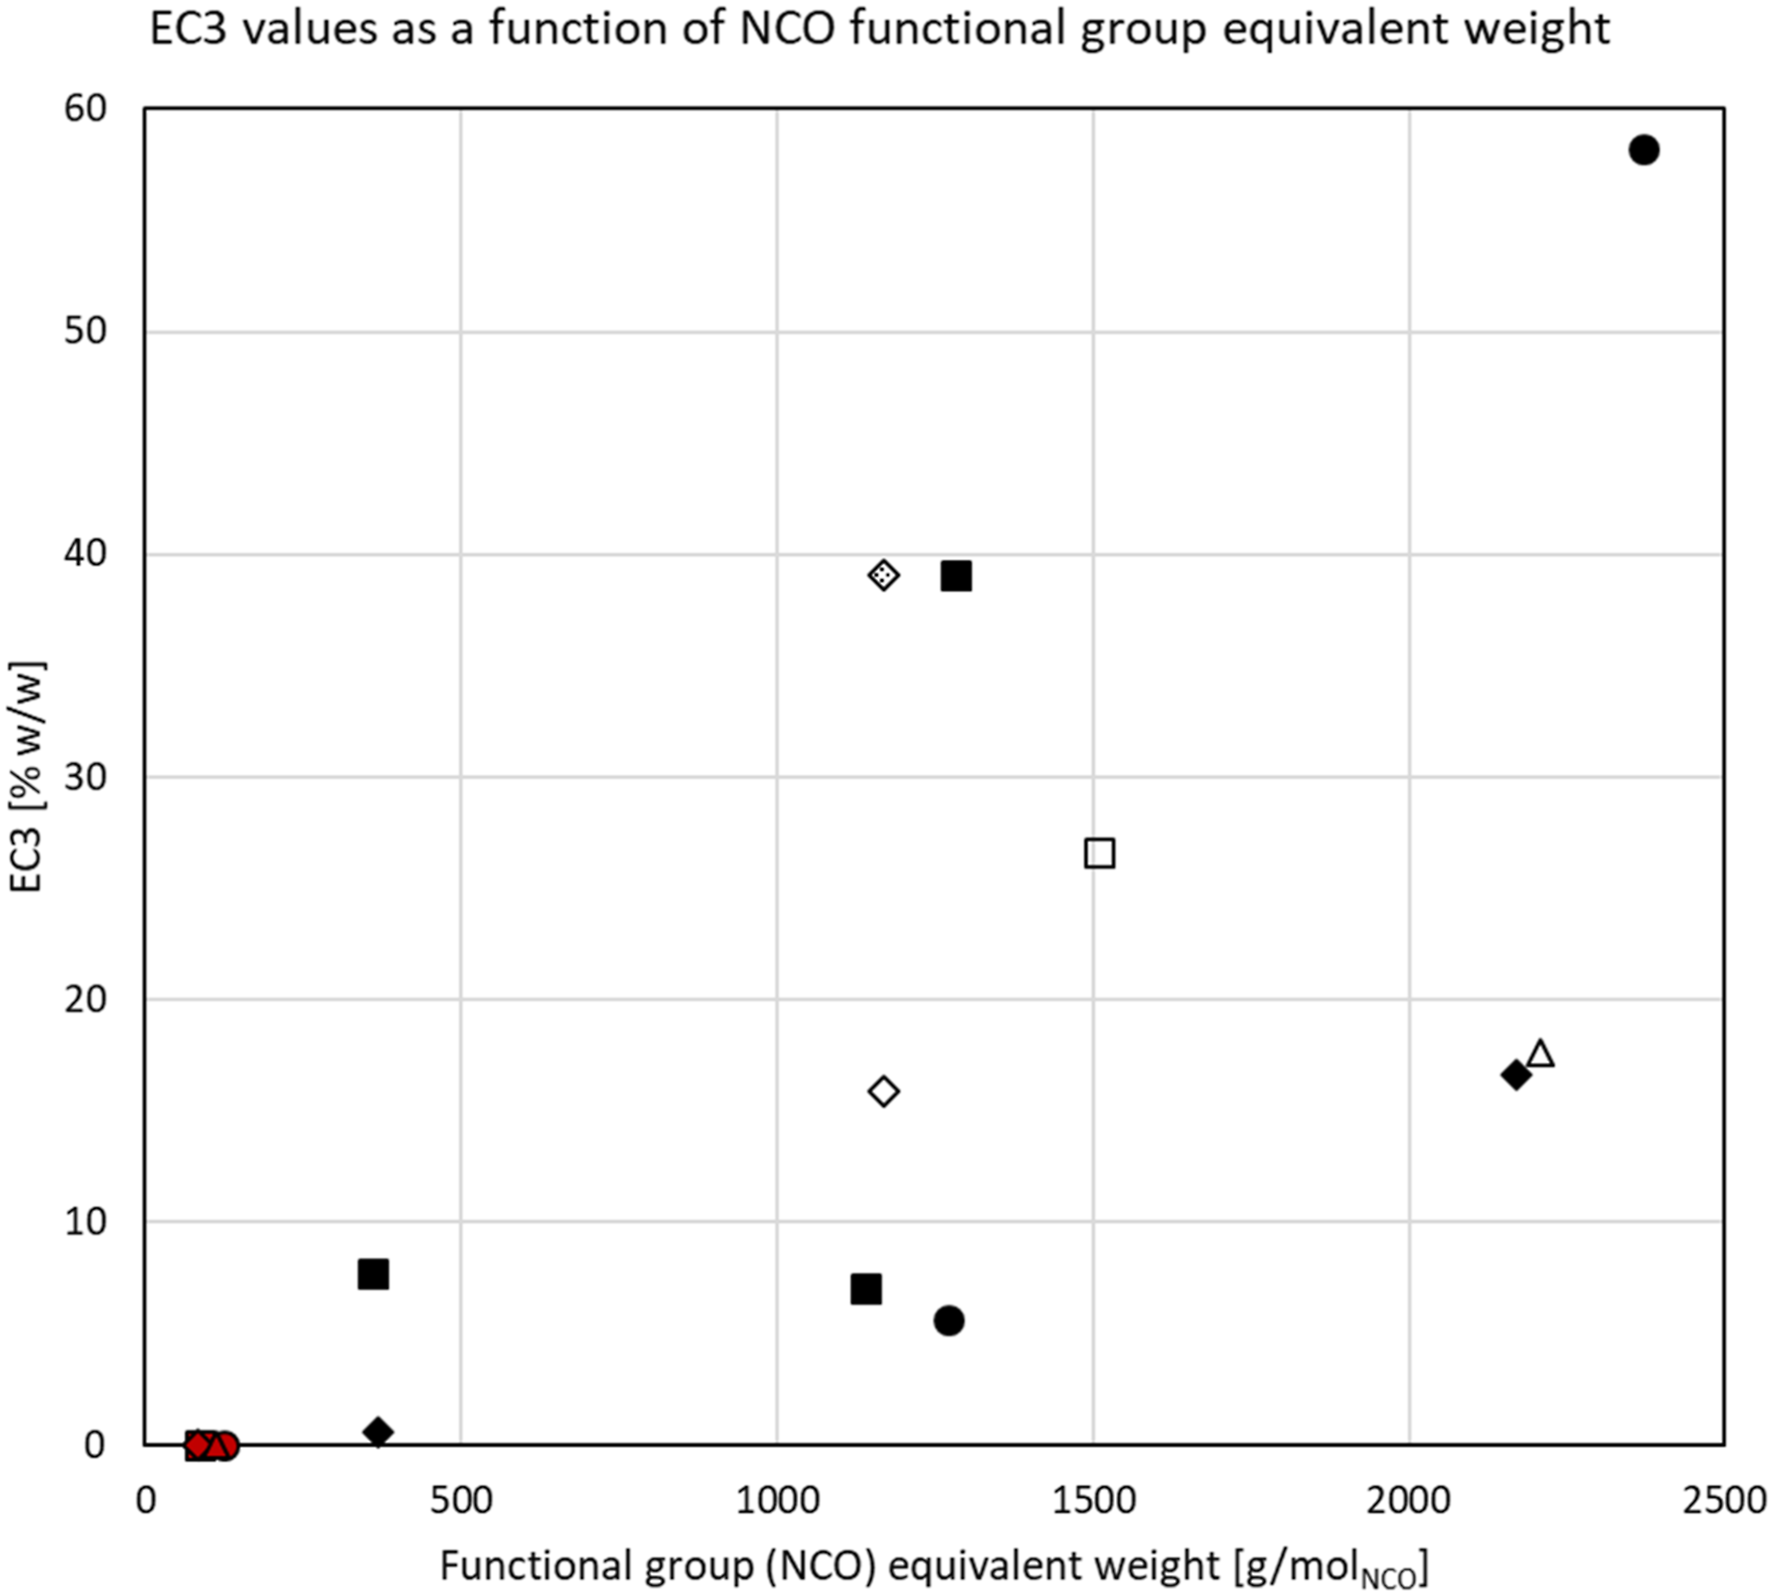
The 11 substances represented in Figure 10 have FGEW between 375 and 2250, and corresponding %NCO between 1.8 and 11.6%. The nine other test substances for which no EC3 value could be calculated (response not exceeding vehicle control or SI = 3 for any dosing concentration up to 135 mM), had FGEW between 1375 and 2175, and corresponding %NCO between 2.1 and 6.1%. From Figure 10 and the inability to differentiate between sensitizers andnon-sensitizers, the NCO content or FGEW of a test substance could not be used as a measure for the sensitization potency of the substance.
Effect of hydrophobicity
The average SI for the high dose groups of all test substances (tested at the same molar concentration of 135 mM) are shown as a function of the calculated log Kow in Figure 11. For both hydrophilic (log Kow <0) as well as strongly hydrophobic (log Kow >25) test substances, SI was not elevated above vehicle control (green markers). Consequently, these substances do not appear to exhibit any sensitization potential at 135 mM concentration in the dosing solutions. For substances with log Kow between 0 and 25, SI was generally increasing with decreasing log Kow. The results of Woolhiser et al. (2011) can be added and align well with this general trend: a TDI-PTMEG 950 substance (log Kow=11; 210 mM dosing concentration) resulted in an SI=6, and a TDI-PTMEG 2950 substance (log Kow=34; 169 mM dosing concentration) showed no contribution of the prepolymer beyond that predicted from the residual monomer content
2
. Considering that biological variability is proper to the assay and that some dispersity in the molecular weight of the polyols could not be avoided, the results are remarkably consistent. Sensitization potential (expressed as SI at 135 mM of test substance in dosing solution) as a function of the logarithm of the octanol-water partitioning coefficient (log Kow). Curves for illustration purposes only. Symbols: squares and x = TDI-based substances; circles = MDI-based substances; diamonds = HDI-based substances; triangles = IPDI-based substances. Fill colors: green = response not significantly increased compared to vehicle control; blue = response driven by residual monomer content; yellow = response significantly increased compared to vehicle control (p<0.05); orange = response exceeding the SI=3 threshold, but not significantly; red = response significantly exceeding the threshold; x = ambiguous response.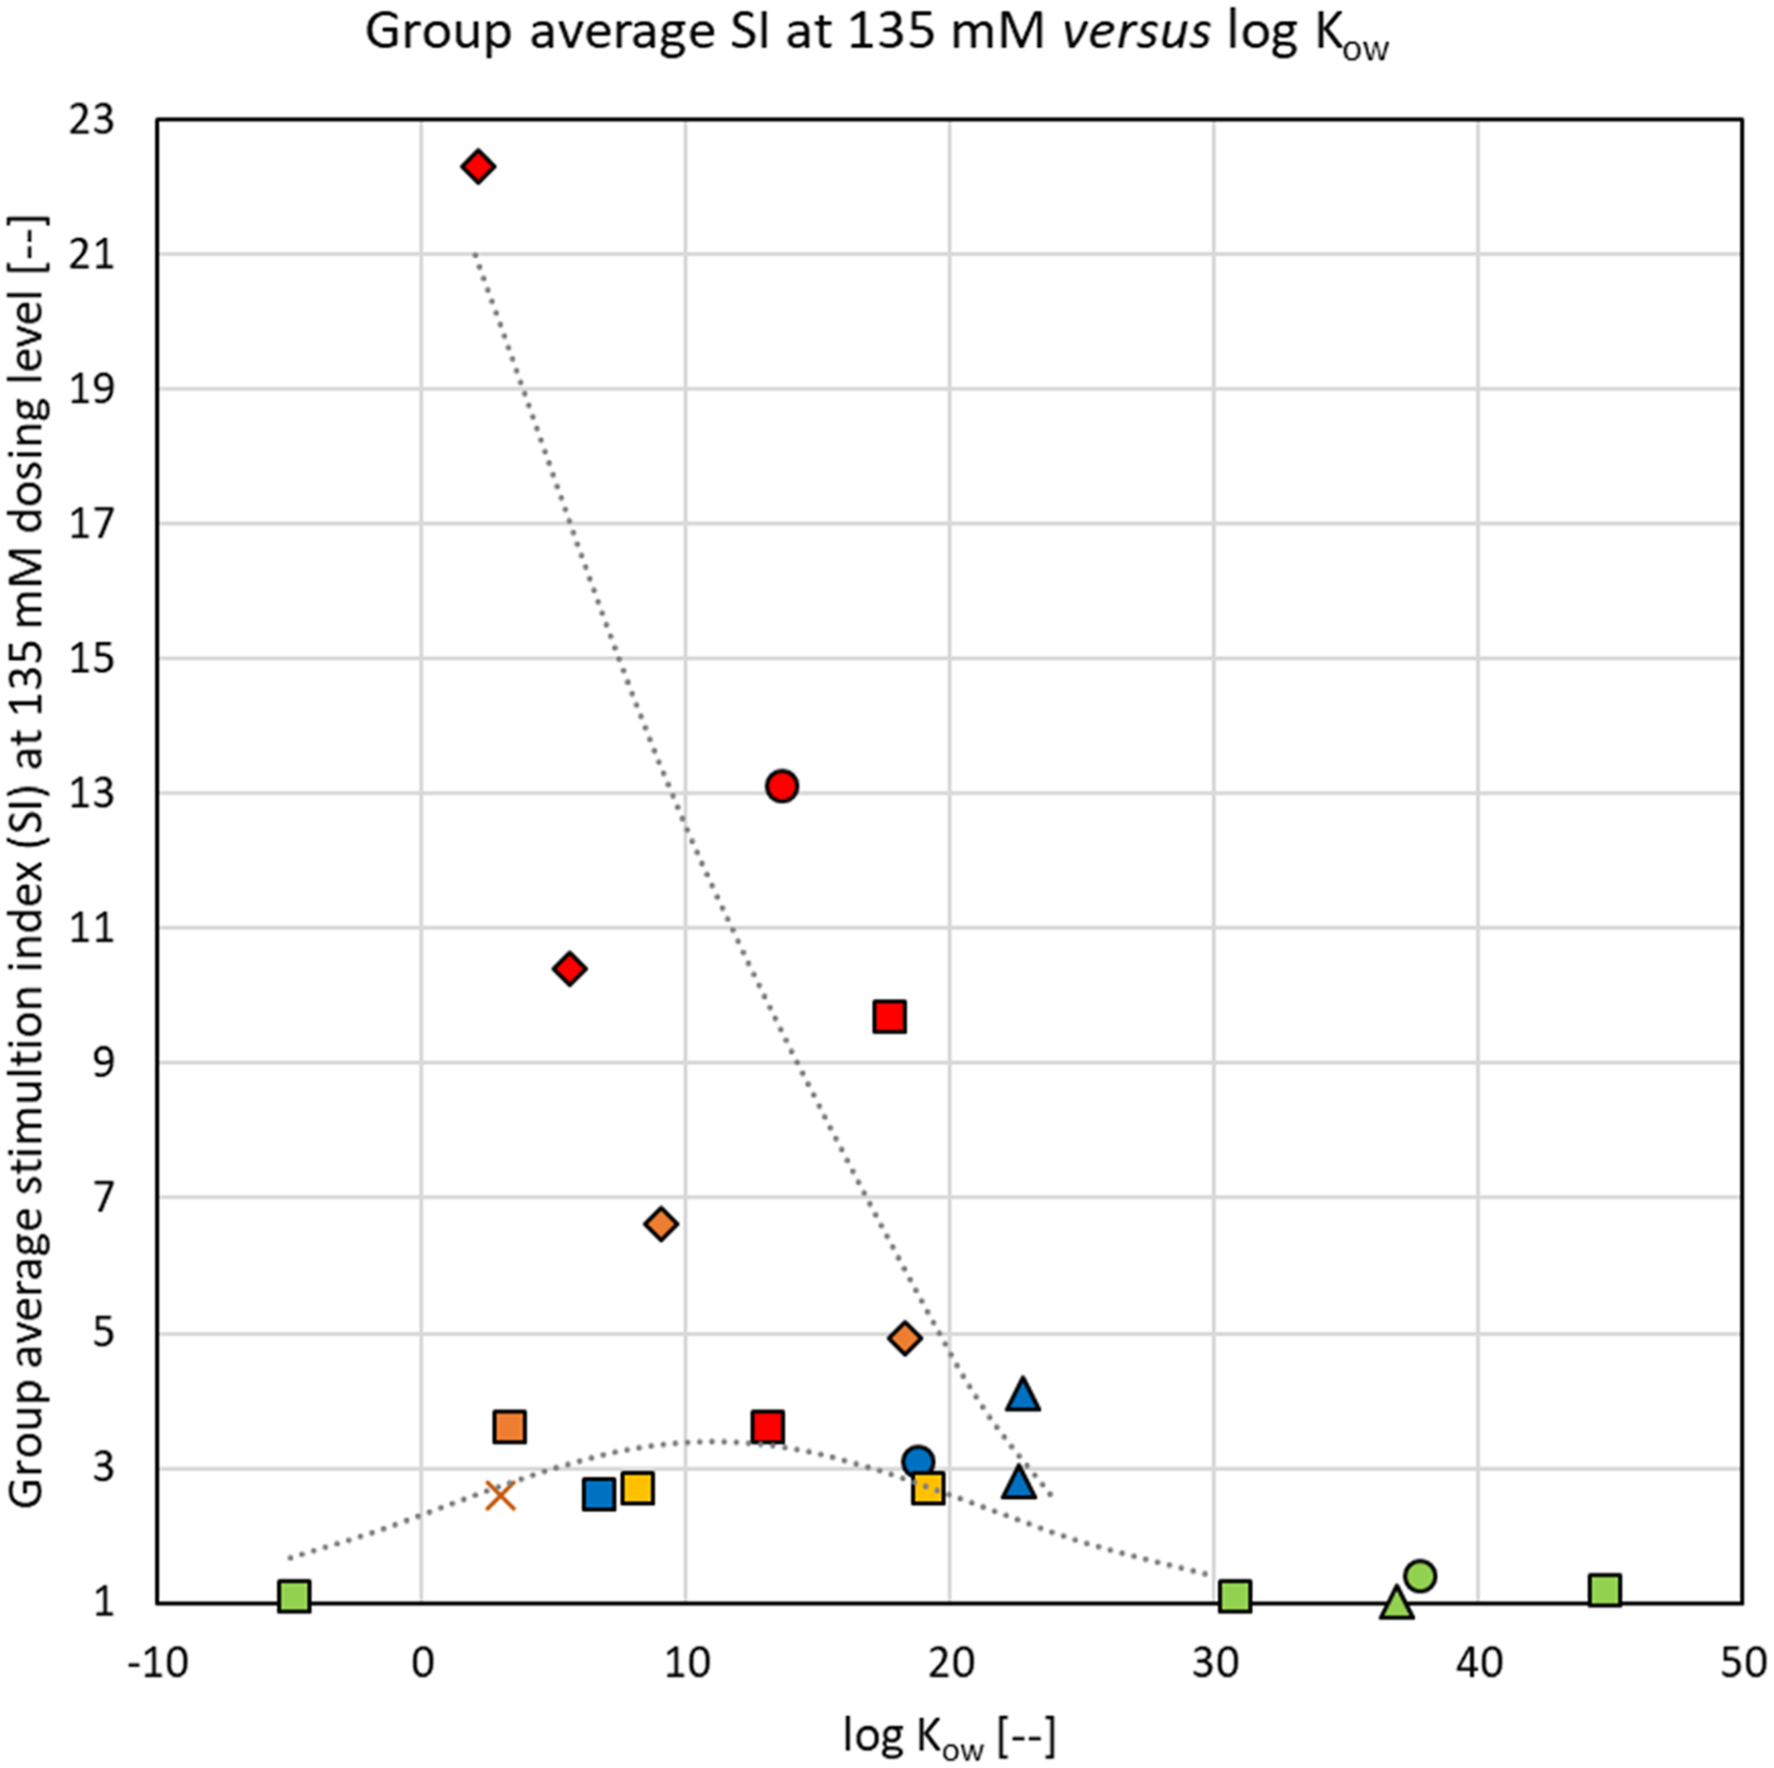
For the two substances for which log Kow was between 20 and 25 (I-2 and I-3—blue markers in Figure 11), the observed SI was driven by the diisocyanate monomer content with no significant contribution by the prepolymer itself. These two prepolymers should therefore not be considered as sensitizers.
As reported by West et al. (2022) (see Table 3), three of the TDI-based substances showed surfactant-like foaming behavior when shaken in water at 0.1% (T-7, log Kow = −4.8; T-6, log Kow =3.3; and T-4, log Kow =6.7) and one also formed an emulsion in water (T-2, log Kow =3.0). The tensio-active substances seem to exhibit SI values that fall below the general trend, as illustrated by the bell-shaped curve in Figure 11. Such effect was not observed with other test substances, and it appears to be associated with a combination of the compact, less hydrophobic aromatic diisocyanate TDI, and polyols terminated by hydrophilic PEG-units, which, as a structural feature, brings the NCO groups in close proximity to polyol chains with significant H-bonding potential (see Figure 1).
Discussion
The purpose of this work was to explore structure/property relationships of polymeric polyisocyanate prepolymer substances that could be used in human health hazard and risk assessments. Molar concentration-normalized dose solutions were used to generate SI and EC3 values in the LLNA. Testing based on molar concentrations allowed to investigate the polymeric prepolymer substances at similar concentrations of NCO in the dosing solutions, thus enabling a comparison of the potency of the NCO group in the various molecular structures 3 . Testing based on mass concentrations (as is typically performed for LLNA studies) would result in dose solutions with large differences in NCO content because of the varying molecular weights of the polyols. Mass concentrations of each polymeric prepolymer substance at the high dose of 135 mM are shown in Table 4. The potencies of TDI, MDI, HDI and IPDI and a set of 20 associated polymeric prepolymers were investigated. In addition, 10 of the polyols used to produce the prepolymer substances were tested.
Polyol and monomer references
For 9 out of 10 polyols tested, the SI both clearly and consistently did not exceed the SI=3 threshold and, therefore, they would not be classified as sensitizers. This observation is in line with the absence of sensitizing effects, for instance, for shorter-chain ethoxylate or propoxylate polyethers and for a trimethylolpropane-started polycaprolactone polyester (ECHA, 2022). The 10th polyol (PPG/PEG 2000) exhibited a group mean SI=4.6, which although elevated compared to controls, did not exceed the SI threshold of 3 in a statistically significant manner. The prepolymer test substance prepared with this polyol (TDI-PPG/PEG 2350 [T-2]) exhibited an irregular dose-response.
Substances with surfactant properties similar to those of PPG/PEG 2000 (e.g., Ryan et al., 2002) have been validated as a component of an alternative aqueous-based dosing vehicle for use in the LLNA by Boverhof et al. (2008) and were found to be non-sensitizers. Other investigators have suggested that the LLNA may tend to produce “false positive” results for some surfactant materials when compared to the guinea pig maximization test (Ball et al., 2011, and references included therein), an effect that seemed to correlate with markers of irritation in various in vitro tests. The combined evidence suggests that the polyol portion of the molecules contributed little to the sensitization potential of polymeric prepolymers. The result for the single reference polyol (PPG/PEG 2000) with SI ≥ 3 was not considered as an attenuating factor in the further interpretation of this study.
As expected, LLNA testing with the aromatic diisocyanate monomers, TDI and MDI, showed low EC3 values of approximately 0.02%, confirming that TDI and MDI are strong and essentially equipotent sensitizers in the LLNA. These values are consistent with the EC3 values reported by Hilton et al. (1995) (0.03%) and Woolhiser et al. (2011) (TDI: EC3=0.016%), which further supports that the modified dosing procedure applied in this work did not significantly alter the SI responses. The aliphatic diisocyanate monomers, HDI and IPDI, both showed an EC3 ≤0.005%, suggesting that HDI and IPDI are more potent sensitizers in the LLNA than their TDI and MDI counterparts, even though their log Kow are similar. For HDI and IPDI, only a single EC3 value could be found in the published literature for comparison (HDI: EC3=0.03%; Hilton et al., 1995).
General potency of polymeric prepolymers
Compared to the diisocyanate monomers they were produced from, all prepolymers tested were at least 300 times less potent based on their EC3 values in the LLNA. With the lowest EC3 value for the aromatic prepolymers being 5.5% (EC3 potency >1000 μg/cm2), the aromatic prepolymers were at most weak sensitizers, and four of them exhibited no effect different from vehicle control. Except for HDI-PEG 750 (EC3 ca. 0.6%; EC3 potency ca. 150 μg/cm2, i.e., a moderate sensitizer), the aliphatic prepolymers would also be described as weak sensitizers at most, with one exhibiting no effect different from vehicle control.
The aliphatic diisocyanate monomers are about two orders of magnitude less reactive than their aromatic diisocyanate counterparts (see Spence and Plehiers, 2022), but exhibited a lesser EC3 (i.e., greater sensitization potency). Combined with the fact that the reactivity of the NCO group is not that much affected by polyol modification (Muuronen et al., 2018), this suggests that the sensitization potency of the polymeric prepolymers is not directly associated with the specific reactivity of the NCO group. This will be discussed in more detail in the subsequent section.
Influence of diisocyanate monomer type
The scatter in Figure 10 illustrates that the potency of the polymeric prepolymers is not strongly associated with the type of diisocyanate monomer they were produced from. At first sight, this seems somewhat unexpected. According to the adverse outcome pathway described by Kimber et al. (2018), the initiating molecular event for dermal sensitization is the reaction of a substance with proteins. It would therefore seem plausible to hypothesize that differences in potency (i.e., the inverse of EC3) between TDI- and MDI-based prepolymers, and between IPDI- and HDI-prepolymers, could be associated with the different reactivities of their NCO groups. As shown in the subsequent paragraphs, however, this does not seem to be the case.
For aromatic prepolymers, in which one NCO group of the capping diisocyanate has reacted with the polyol, the reactivity of the remaining aromatic NCO group is reduced (Nagy et al., 2015). In MDI, that effect is rather small, a factor of ca. 1.5, since the methylene bridge dampens the electronic effects caused by the conversion of the NCO group (electron withdrawing) into a urethane (neutral to slightly electron donating) (Brock, 1959). In TDI prepolymers, however, the unreacted NCO group is typically in an ortho-position to the methyl group and therewith doubly disadvantaged: the ortho-position has a lesser reactivity to begin with (by a factor 6) and after conversion of the first NCO group on the same aromatic ring its reactivity is further reduced (by a factor 5) since the two NCO groups are on the same aromatic system and the corresponding changes in electron densities are more pronounced (Nagy et al., 2015). Even though TDI is overall somewhat more reactive than MDI, the remaining NCO groups in the TDI-based prepolymers should be expected to have a reactivity about one order of magnitude less than that of MDI-based NCO groups. This difference in reactivity is not reflected in the EC3 values reported in this work or in that of Woolhiser et al. (2011).
For HDI, both NCO groups are attached to a primary C-atom and have similar reactivities. IPDI, on the other hand, contains a primary and a secondary NCO group, the latter being less reactive than the former (see Spence and Plehiers, 2022). In HDI-based prepolymers, the remaining NCO groups are on primary C-atoms. In contrast, in IPDI-based prepolymers, the polyol preferentially reacts with the more reactive primary NCO group, leaving the secondary NCO-group as the reactive entity in the prepolymer (see Figure 1). For the polymeric prepolymers produced from aliphatic diisocyanates, the difference in reactivity of the NCO groups is not reflected in the reported EC3 values either.
Overall, it appeared that the hypothesis that sensitization potency is linked with the level of reactivity of the NCO groups in the prepolymer is not consistent with the observations of this work. We therefore conclude that this hypothesis should be rejected.
Skin permeation
For a substance to induce sensitization by the dermal route (expressed, for instance, by the proliferation of lymphocytes in the LLNA), it must effectively gain access to the viable epidermis. Therefore, not only dermal uptake but also systemic absorption have to be considered. Because of the reactivity of the NCO group, systemic absorption of diisocyanates takes place in the form of protein adducts (Bartels et al., 2022). This is supported by numerous studies, as reviewed by Schupp and Plehiers (2022), demonstrating that unreacted NCO groups are not systemically available after inhalation or dermal administration.
Based on the hybrid adverse outcome pathway described by Kimber et al. (2018) and the combined influences of the reactive and physical-chemical properties of the polymeric prepolymers, this section aims at evaluating which dermal absorption pathway may be the more effective. In general terms, the stratum corneum (SC) constitutes the vast majority of the available skin surface area but absorption via that pathway may be strongly impeded by the abundant availability of NCO-reactive sites in this non-viable layer of the skin. On the other hand, sebaceous glands and hair follicles readily absorb chemicals but are usually considered the minor pathway since they only represent 0.1–1.0% of the available surface area. Notwithstanding, to NCO-bearing substances, they could offer a route of absorption that effectively bypasses the reactive capture of NCO in the SC, allowing these substances to gain access to and react with proteins that are much more mobile, thus, enabling the formation of haptenated proteins that can easily be absorbed and subsequently recognized and processed by the immune system.
Following topical administration of 14C-TDI and 14C-MDI in rats, Hoffmann et al. (2010) reported that <1% of the administered dose was systemically absorbed. Through modeling with the Gastroplus® software, Bartels et al. (2022) compared the dermal absorption of MDI monomers with that of MDI modified with a variety of short-chain diols. The model predicted that dermal absorption strongly decreased with increasing molecular weight of the substances. Since Bartels et al. (2022) only evaluated MDI substances modified with short-chain (i.e., non-polymeric) diols, there was a strong intercorrelation between molecular weight and hydrophobicity.
Nayak et al. (2014) demonstrated that after dermal administration as part of a sensitization protocol, TDI-haptenated proteins, which could be immunologically active (e.g., Hettick and Siegel, 2011; Hettick et al., 2018; Mhike et al., 2016; Wisnewski et al., 2013), can be visualized within the SC (not the epidermis) as well as within the skin appendages (follicles). These results support that the SC is an effective barrier against uptake of diisocyanates, which is not unexpected, since NCO groups readily react with moisture and the abundantly-available cysteine-rich proteins in the SC. More importantly, Nayak et al. (2014) also demonstrated that sebum-rich follicles can act as a reservoir for diisocyanate-modified proteins by visualizing co-localization with immune cells by means of immunochemistry. TDI-haptenated proteins were observed in follicles up to 9 days post exposure, and in the SC up to 15 days post dosing. This demonstrates that dermal uptake of haptenated proteins and their subsequent presentation to immune cells via hair follicles is more likely to serve as an effective absorption pathway.
Contrary to long-held assumptions that only substances with Mn<500 would efficiently penetrate the skin, or that log Kow >1 would be a requirement for a substance to be a sensitizer, there are no hard cut-off criteria (molecular weight or log Kow) to differentiate sensitizers from non-sensitizing molecules (Fitzpatrick et al., 2017a, 2017b). This is corroborated by the inability to differentiate between sensitizing and non-sensitizing prepolymers based on FGEW as observed in this work (Figure 10). Several authors have investigated partitioning and diffusion rates of chemicals and pharmaceuticals through artificial sebum into an aqueous receiving compartment and have found the net transfer to be inversely proportional to the molecular weight or log Kow of the substance considered (Valiveti and Lu, 2007; Valiveti et al., 2008; Yang et al., 2019). Yang et al. (2019) also noted that the diffusion of very lipophilic large molecules was very slow, so that a steady-state may not necessarily be easily achieved. This general trend of decreasing dermal absorption with increasing molecular weight matches with the results of Bartels et al. (2022). In addition, computer modeling has suggested that transdermal transport through the SC would be size restricted at ca. 1.6 nm (Kasting et al., 2019), an observation that lends additional support to the observed general trend. The general trend of decreasing sensitization potency with increasing hydrophobicity observed in this study (Figure 11) is in close agreement with these observations.
However, some tensio-active prepolymers show sensitization potencies that deviate from the general trend (Figure 11). To reconcile this with the presence of a reactive group being regarded as the determining factor for sensitization (Roberts, 2021), it was hypothesized that these substances may be altered in part during the absorption process. Computer models have been of great aid in assessing the importance of transappendageal processes. In particular, the follicular pathway has been modeled in more detail (Kasting et al., 2019; Kattou et al., 2011; Yu et al., 2021), showing that the follicular pathway becomes increasingly important for substances that are either very hydrophilic (Kasting et al., 2019; Mohd et al., 2016) or capable of forming emulsions (Wu et al., 2001). The polymeric prepolymers based on a combination of TDI and polyols terminated with hydrophilic PEG-chains, which have surfactant properties (see Table 3), satisfy these criteria. Specifically, their structure enables making the NCO groups accessible to water through multiple opportunities to form H-bridges with the hydrophilic polyol chain. Compared to diffusion of the prepolymers, the hydrolysis of the aromatic NCO group is a fast process (Neuland et al., 2021), so that it can be expected that the interaction of these specific prepolymers with water most likely effectively “neutralizes” the reactive NCO groups by hydrolysis, thus limiting or even precluding formation of the haptenated proteins that lie at the origin of the adverse outcome pathway for sensitization (Kimber et al., 2018). As a result, it appears to be plausible that the surfactant-like substances showed reduced or no sensitizing potential in the LLNA compared to the other polymeric prepolymers investigated.
Summary and conclusion
This study investigated the sensitization potential and potency of 20 polymeric prepolymers of TDI, MDI, HDI, and IPDI largely depleted of residual diisocyanate monomer using the LLNA. The results suggested that prepolymers with a log Kow between 0 and 25 may exhibit dermal sensitization potential. Within this range, the ability to induce sensitization depends to some extent on the type of diisocyanate but is not directly linked with the specific reactivity of the NCO groups. As a general trend, the sensitization potency decreases with increasing hydrophobicity of the prepolymer. Prepolymers with surfactant or emulsifying properties have a lesser sensitization potency, which was attributed to their more facile access to and subsequent reaction with moisture or aqueous media. The data generated constitute valuable information for hazard assessment purposes and could also provide direction for designing substances with lower dermal sensitization potential. Finally, the data provided evidence that the general assumption that every molecule containing isocyanate (NCO) groups is a sensitizer is an oversimplification and may need to be reconsidered in the context of health hazard assessment and classification.
Footnotes
Acknowledgements
The authors are grateful to (in alphabetical order) W. Dayoub (Vencorex US Inc.), S. Franyutti (BASF Corp.), S. Grace (Covestro LLC), C. King (Evonik Corp.), C. Phanopoulos (Huntsman Corp.), T. Willumstad (Dow), and T. Yu (Wanhua) for providing insight on the prepolymer chemistry design of experiments, polyol starting materials, and analytical characterizations, and to S. Seneker (retired from Anderson Development Company, Adrian, MI, USA) for synthesizing the test substances.
Declaration of conflicting interests
The author(s) declared the following potential conflicts of interest with respect to the research, authorship, and/or publication of this article: AH Chappelle, RJ West, and PM Plehiers are employed by the International Isocyanate Institute, Inc. The Institute is funded by producers of TDI and MDI. S Burleson and T Gulledge declare no conflict of interest. S Krieger is employed by The Dow Chemical Company, a producer of MDI. C Graham is a consultant for Huntsman Corporation, a producer of MDI. J Miller and S Snyder are employed by Covestro LLC, a producer of TDI, MDI, HDI, and IPDI. G Simon is a consultant for Vencorex US, Inc., a producer of HDI and IPDI.
Funding
The author(s) disclosed receipt of the following financial support for the research, authorship, and/or publication of this article: The work reported herein was funded in part by the International Isocyanate Institute, Inc., and in part by the American Chemistry Council. Any opinions expressed are those of the authors, not necessarily of Burleson Research Technologies, Covestro LLC, The Dow Chemical Company, Huntsman Corporation, Vencorex US, Inc., the International Isocyanate Institute and its member companies, or the American Chemistry Council and its members companies. The Institute is funded by producers of TDI and MDI.