
Abstract
This research analyzed six value-weight-elicitation techniques that are commonly used in participatory planning. It compared the techniques via measures of (1) accuracy (within-subjects user-derived assessments and quantitative weight comparisons) and (2) accessibility (time to complete, difficulty, and “boringness”). Visual sliders performed best across assessments. Pairwise comparison, visual sliders, and swing weighting were the most accurate, while visual sliders and vertical visual scale were the most accessible. Point allocation and the popular Likert-type method performed poorly across assessments. All methods produced similar weights, highlighting the importance of accessibility when choosing scales. This research can inform participatory planning and survey design techniques.
Introduction
Planning has evolved over many decades to be more inclusive, with broad community and stakeholder consultation or participation often involved in all aspects of the planning process (Crawford et al. 2008; Pan, Kwak, and Deal 2022; Wheeler 2000). This turn toward participatory planning practice reflects the rise of communicative planning in the late twentieth century, which continues to dominate planning theory and practice today (Allmendinger 2005; Fischler 2000; Flacke, Shrestha, and Aguilar 2020; Zhang et al. 2019). Communicative planning argues for collective decision making that involves those who will be affected by the decision and sees planning as an interactive process where values are identified and conflicts are mediated (Allmendinger and Tewdwr-Jones 2002; Sager 2017). Its promise is the realization of the democratic potential of planning in diverse societies, making decisions together while living distinctly (Healey 1992; Sager 2017).
Communicative planning has been critiqued for relying too heavily on deliberation and consensus building while failing to call attention to and address systemic inequities that influence participation in and application of planning processes and outcomes (Jon 2020; Kaika 2017; Meyer and Oranje 2005). Participatory planning in the communicative model does not necessarily result in equitable outcomes, for example, when dominant groups advocate against the needs of equity-seeking communities (Sager 2012). Nonetheless, inclusive planning that welcomes and supports a diversity of experiences and views is the gold standard of professional practice and can have various benefits, including greater public buy-in and plans that more accurately reflect the needs of those affected by decisions (Cooke and Kothari 2001; Ryder, Rostas, and Taba 2014). Despite these benefits, it can be challenging to engage community members in complex decision-making processes (Crawford et al. 2008; Lock, Bain, and Pettit 2021), although the literature suggests some approaches (Pan, Kwak, and Deal 2022; Stewart and Sinclair 2007).
Values-Based Planning
A key aspect of planning in the communicative tradition, and one which can help address the critiques of consensus mentioned above, is eliciting public preferences or values and understanding their relative priorities or weights (Failing, Gregory, and Higgins 2013; Gregory et al. 2012; Keeney 2004). In this context, “values” refers to assigned values, where the relative importance of an object results from a preference relationship (Brown 1984). Assigned value does not refer to the character or nature of an object but rather its standing in relation to other objects. A thorough understanding of values and their relative weights within the planning context helps focus deliberation, highlight divergent views, and generate more creative alternatives, leading to better, more transparent, and robust planning decisions (Keeney 2004; Philpot et al. 2022). Planning participants have diverse values to offer to planning processes that reflect their individual histories and experiences (Bohman 2006).
Capturing the range of these values, articulating them, measuring them, and understanding their relative importance often requires engagement with a broad and diverse selection of people (Nabatchi 2012). While theoretically simple, the challenges associated with engaging large numbers of diverse people are well documented (Crawford et al. 2008; Philpot et al. 2022). Busy lives can leave little room for involvement in planning processes, especially if those processes are time-consuming or uninteresting. These challenges can be magnified among under-resourced populations, arguably some of the most important communities to engage. Low-income people or racialized 1 minorities are commonly underrepresented in planning processes because they face higher barriers to engagement, such as time or financial constraints or feelings of isolation (Buijs et al. 2016; Heynen 2016; Nesbitt et al. 2018). In addition, decision processes themselves and the tools they use may be exclusive in their design (Pan, Kwak, and Deal 2022). As discussed above, there is some concern that decision processes that seek consensus rather than pluralism, for example, can marginalize minority views, compounding existing inequities (Heynen 2016).
Value-Weight-Elicitation
A critical aspect of multifaceted planning processes involves assessing the assigned values or weights that an individual applies to different attributes of a plan (Srivastava, Connolly, and Beach 1995). Value-weight-elicitation (also called preference elicitation or criteria weight elicitation) is a process whereby a participant is asked to directly express importance weights for each attribute (Keeney 2004; Riabacke, Danielson, and Ekenberg 2012). This process typically occurs following the definition of objectives and the development of alternatives, which have certain attributes. Value-weight-elicitation can also help refine objectives and alternatives as part of an iterative planning cycle. Value-weight-elicitation can be done in person but these techniques are also commonly delivered via surveys and have been used extensively in participatory decision making across multiple domains, including environmental management (Ananda 2007; Gregory et al. 2012), energy policy (Keeney, von Winterfeldt, and Eppel 1990), health care (Frazão et al. 2018), and spatial planning (Ferretti and Montibeller 2016).
The challenging nature of public engagement combined with the complexity of decision making points to the need to develop value-weight-elicitation methods that are both accurate and accessible. Here, we define accurate as producing data that are a correct reflection of each individual participant’s views and accessible as meaning the elicitation process is relatively enjoyable to use and efficient, so as not to create an undue burden on participants. Despite the importance of these techniques in planning, the literature informing approaches to value-weight-elicitation is dominated by research from the decision sciences, which is focused on reproducibility as a measure of accuracy (Chrzan and Golovashkina 2006; Doyle, Green, and Bottomley 1997), leaving planners with limited guidance as to how participants experience these techniques and the weights they produce.
The focus of this research is the application of stated-preference, also called direct, value-weight-elicitation techniques (Keeney, von Winterfeldt, and Eppel 1990; Rambonilaza and Dachary-Bernard 2007). There are various types of survey questions and scales that can be used to elicit value preferences (ranks and/or weights) from planning participants, and it can be difficult to decide which to employ. When collecting preference data, survey designers must use questions and scales that provide accurate data and are accessible to multiple survey participants. It is important to note here that accessibility is also an important part of accuracy. A survey that is inaccessible and receives a low response rate will produce less reliable data that are less representative of participants’ values (Fasolo and Bana e Costa 2014; Ryder, Rostas, and Taba 2014). In addition, participants’ preferences may not be stationary, and community preferences derived from value-weight-elicitation may have a short shelf-life in communities with rapid population change. Techniques that can be easily employed to inform planning over multiple periods may better reflect participants’ changing needs (Ananda 2007).
Research Objectives
This research examines six commonly used value-weight-elicitation methods or scales: Likert-type scale, visual sliders, point allocation (constant sum), vertical visual scale, pairwise comparison (Analytic Hierarchy Process), and swing weighting (see “Method” section and supplementary materials for descriptions of each scale). These scales are capable of generating interval data (weights) that allow for a fine-scale examination of public preferences and values across multiple attributes. While not an exhaustive list, these techniques are commonly used in planning practice (e.g., Gregory et al. 2012) and represent a range of complexities and interfaces. The study assesses and compares the accuracy and accessibility of each method. It evaluates the techniques according to five metrics: (1) within-subjects user-derived accuracy of the method, (2) comparison of the weights produced by the method, (3) time required to complete the method, (4) user rating of difficulty of the method, and (5) user rating of the “boringness” of the method. Metrics 1 and 2 seek to evaluate the accuracy of the method while metrics 3, 4, and 5 seek to assess accessibility.
Some research in the field of multi-criteria decision analysis argues that value weights cannot be directly compared because the weights produced by different methods have different mathematical meanings and must thus be interpreted within those different meanings (Choo, Schoner, and Wedley 1999; Cinelli et al. 2020). This is true within a strictly mathematical context, and such comparisons are not the focus of this paper. While these mathematical concerns are valid, they do not account for the fact that multiple methods are commonly selected and used side-by-side in planning practice, to provide decision makers with greater insight and more robust outcomes (Gregory et al. 2012; Zheng and Lienert 2018). In addition, the necessity to interpret weights within their mathematical contexts does not preclude the users of value-weight-elicitation methods from assessing which methods provide more accurate measures of their relative preferences.
The six value-weight-elicitation techniques were tested within the context of community planning, a type of planning within which diverse values and priorities must be understood, prioritized, and brought together (Wates 2014). Accurate and accessible value-weight-elicitation techniques are clearly important for participatory community planning, where preferences need to be elicited from the public to inform the planning process, and prioritize community actions and investments, helping to shape how people will live together. To the best of our knowledge, this is the first study to evaluate a wide range of techniques for accuracy and accessibility using multiple user-derived measures. It is intended to inform methods chosen to support decision making and trade-offs assessment in planning, which are increasingly important as societies attempt to adapt to changing conditions, enhance social well-being, and reduce their environmental impact.
Method
Scales
This research analyzed six value-weight-elicitation methods or scales (Figure 1): Likert-type scale—users indicate importance on a scale of one to ten; visual sliders—an adaptation of the Likert-type scale that uses continuous vertical sliders instead of discrete horizontal buttons or boxes; point allocation (also called constant sum)—points are allocated out of one hundred; vertical visual scale—colored circles are placed along a vertical scale to indicate relative importance; pairwise comparison (also called Analytic Hierarchy Process)—users make multiple pairwise comparisons including magnitude of difference; and swing weighting—users rank and then weight options in two steps. Detailed descriptions of each method and their uses in planning can be found in the supplementary materials.
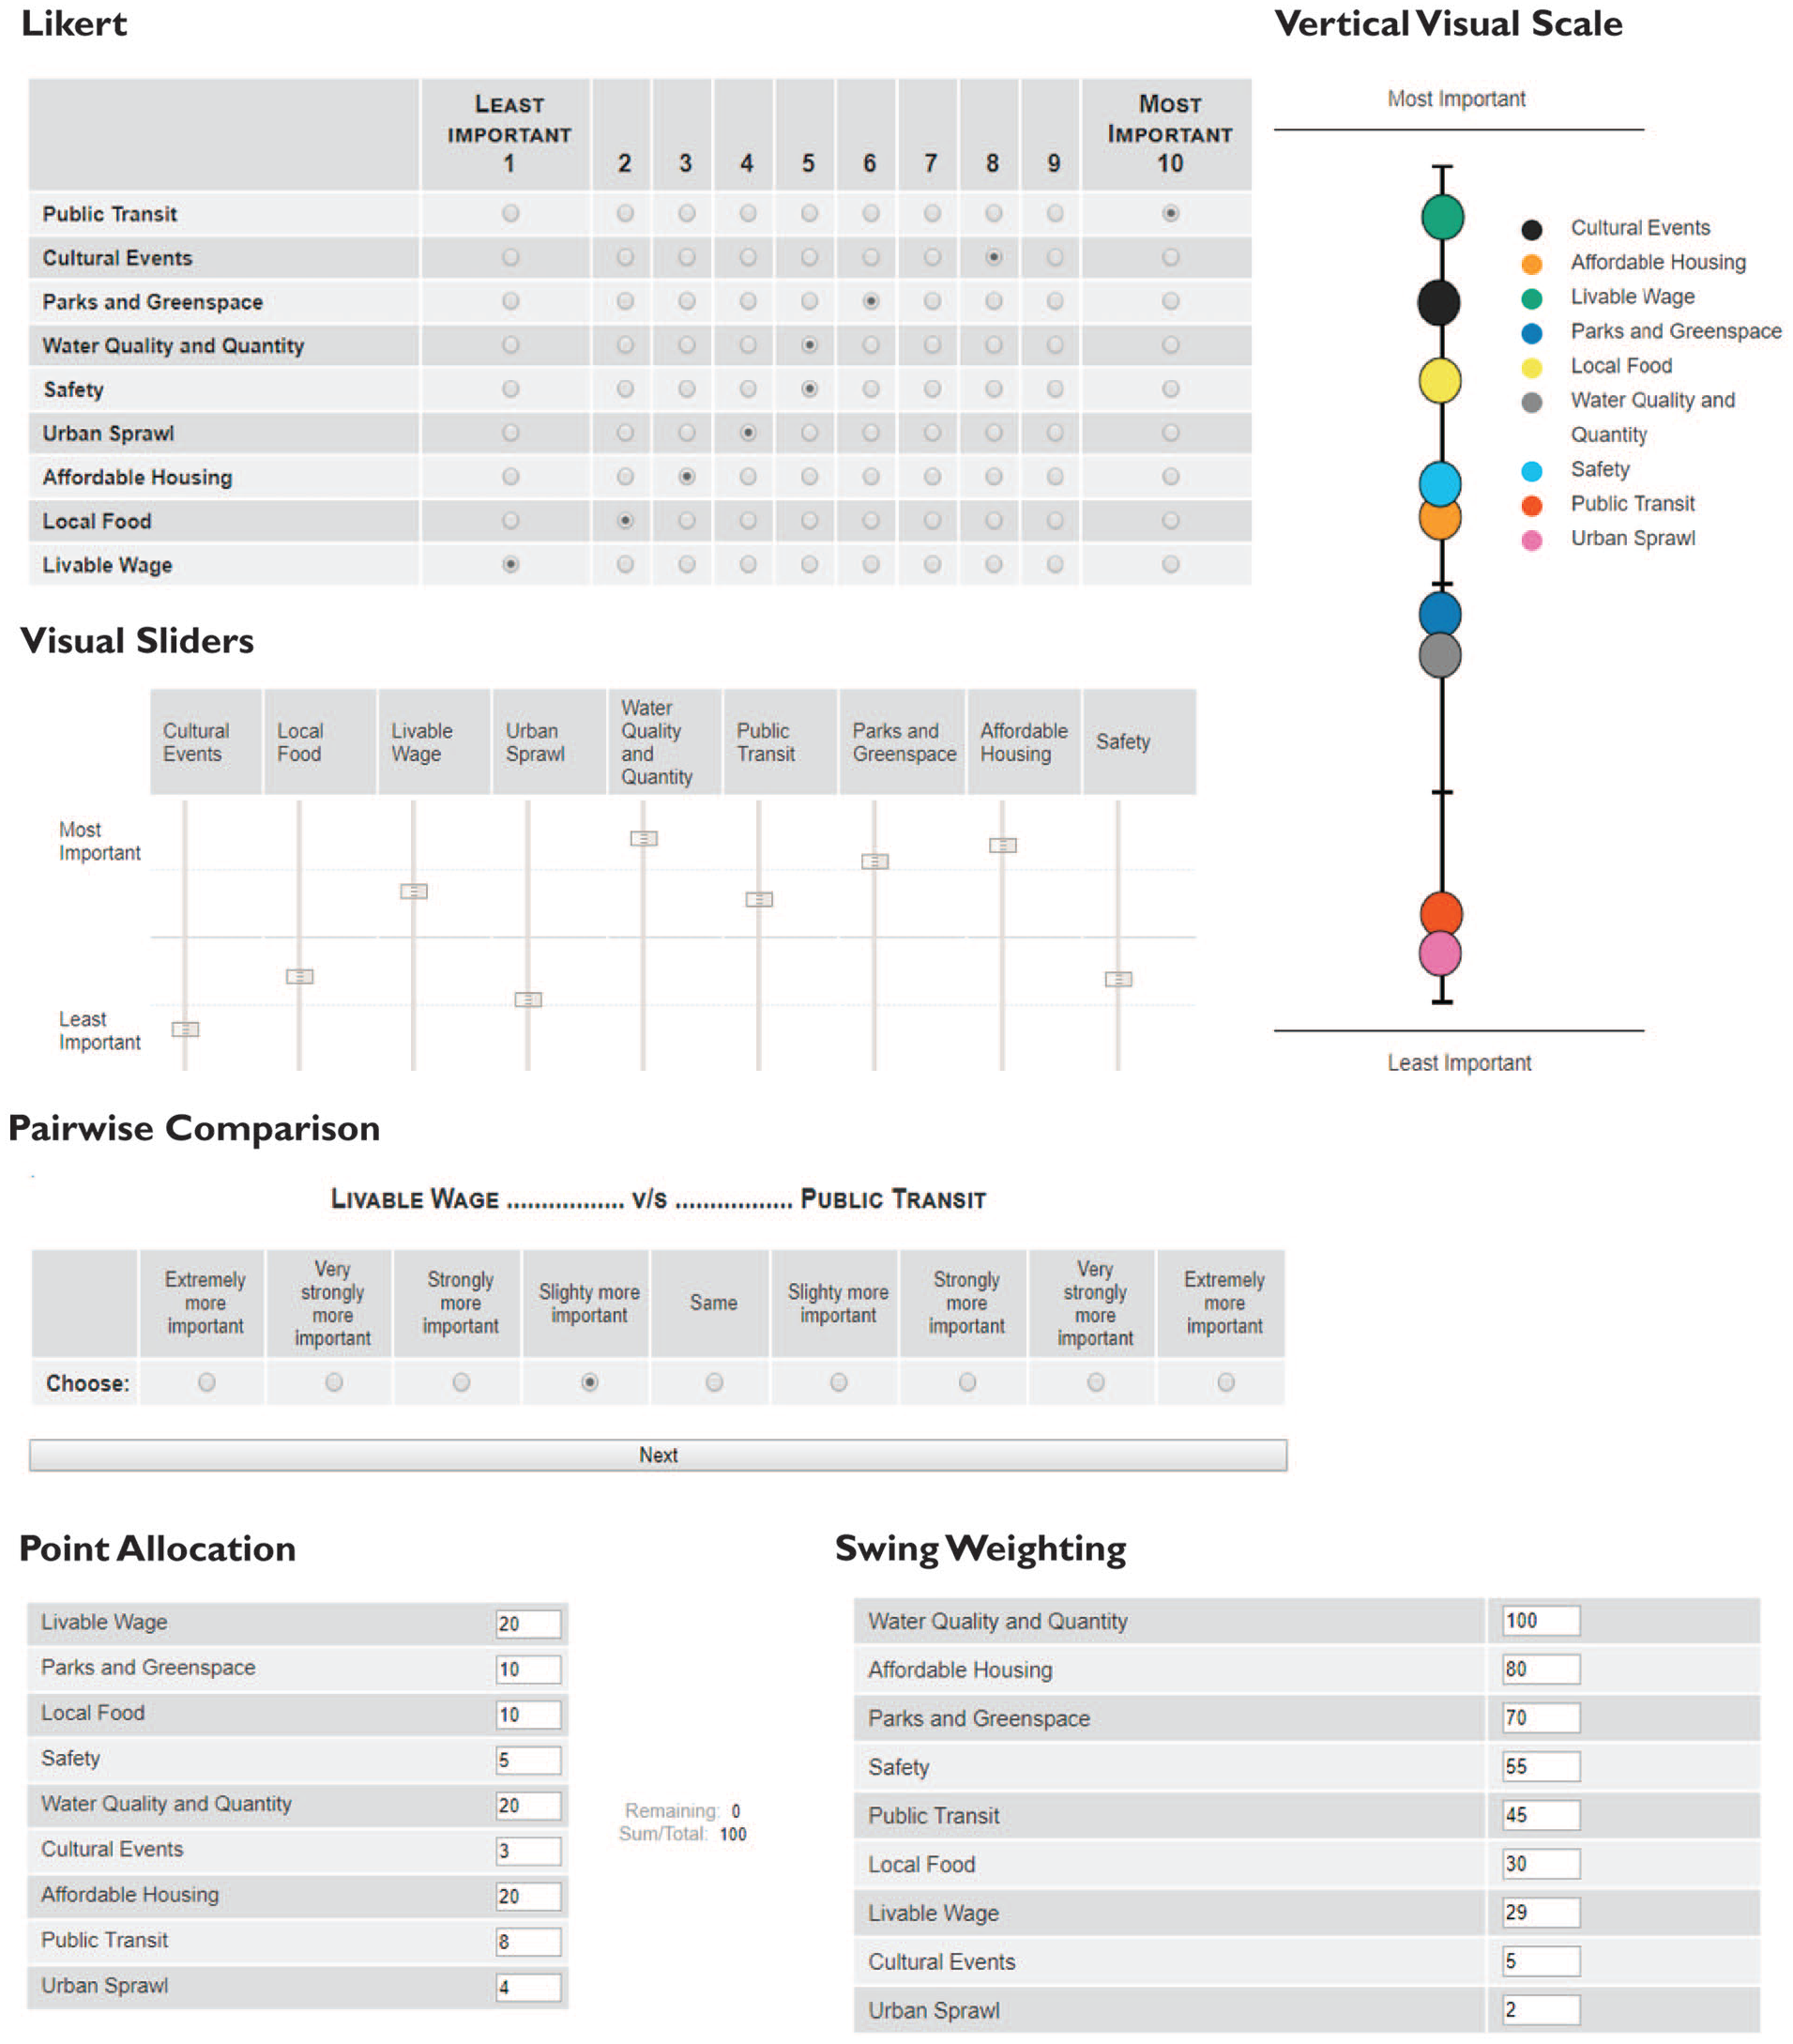
Visualization of each method from the computer interface.
Decision Context
We conducted a qualitative academic and gray literature review focused on issues that are often included in community planning and drew on our professional experience in planning as well as informal interviews with planning practitioners to construct a realistic community planning decision context. This process generated a list of nine community livability issues or attributes, including (1) affordable housing, (2) cultural events, (3) livable wage, (4) local food, (5) parks and greenspace, (6) public transit, (7) safety, (8) urban sprawl, and (9) water quality and quantity. These nine attributes represent diverse areas of community planning and action (Roseland 2000; Wheeler 2000) that are often considered and prioritized using value-weight-elicitation techniques in regional or land use planning processes (e.g., City of Vancouver 2022; Regional District of North Okanagan 2019).
Participants
We recruited a total of eighty-nine participants via paper and online advertisements from among the faculty, staff, and students at the University of British Columbia, with a student population more than 70,000, as well as the general public. Participants were male (n = 40), female (n = 48), or other (1) and were born between 1949 and 1997 (median age = 26). Fifty-three percent of participants identified as white, 45 percent as racialized, and two percent as Latinx. Fifteen percent of participants had completed high school as their highest level of education, 23 percent had completed some university, 26 percent had completed a bachelor’s or associate’s degree, and 36 percent had completed a graduate degree. The sample population is younger than that of the local census metropolitan area (metro area median age = 40.9 vs. 26 in the sample), shows similar racial diversity (metro area 48% visible minority population as defined by Statistics Canada vs. 45% racialized in the sample), and is more highly educated (metro area 37% with a bachelor’s degree or higher vs. 62% in the sample; Statistics Canada 2017).
Procedure
We administered the experiment in spring 2015 in the IDEAL Laboratory, UBC (Certificate Approval Number H14-01827). The experimental interface was web-based and password protected. The laboratory was equipped with four experimental computers, facing toward the wall on the same side of the room, and isolated from one another by dividers. We pre-recruited participants and determined eligibility via phone or email prior to scheduling the experimental session. The only eligibility restriction was poor eyesight, which would prevent the participant from accurately perceiving the experimental interface. No participants were excluded due to eligibility restrictions.
We asked all participants to assess the relative importance of each of the nine community livability issues using each of the six survey scales. Participants were shown a brief description of each livability issue/attribute before starting the experiment and could access those descriptions at any time during the survey. The order of scales was randomized for each participant, and all participants completed all methods. Time required to complete the assessment using each scale was recorded by the computer interface. After completing the assessments using the scales, participants were shown a graph of their assessment results using each method and were asked to (1) identify which method most accurately reflected their values, (2) adjust the position of each issue on the graph of their chosen method so that it more accurately reflected their values, (3) rate each method according to how difficult it was, and (4) rate each method according to how boring it was.
Analysis
We assessed user-defined accuracy in two ways: (1) a frequency count of the number of respondents who chose each method as the most accurate method, including a chi-square test to assess significant differences in the frequency with which users chose each method as the most accurate (variables were count and method), and (2) the number of positive and negative adjustments performed for each method by those users who chose it as their most accurate method, including a one-way analysis of variance (ANOVA; variables were total number of adjustments—both positive and negative—and method) and Tukey’s post hoc test to identify significant differences in the total number of adjustments by method. The weights generated by the six value-elicitation methods were also compared via two-tailed Pearson correlations. All analyses were completed in R 2.4.1 GUI 1.18.
We examined accessibility in three ways: (1) time to complete each method, (2) user ratings of difficulty, and (3) user ratings of boringness. Time to complete each method was assessed as the average number of seconds required by participants to complete each method, as measured by the computer interface. Participants were supervised while using each method and were not allowed to leave and return to the task later. Difficulty of each method was assessed as the average user-defined rating for each method on a scale of one (easy) to ten (difficult). Boringness of each method was assessed as the average user-defined rating for each method on a scale of one (easy) to ten (difficult). Time to complete each method and ratings of difficulty and boringness were compared via one-way repeated-measures ANOVA and post hoc pairwise t tests with Bonferroni correction to identify significant differences among scores for each method. Variables for the time analysis were computer time and method, variables for the difficulty analysis were difficulty rating and method, and variables for the boringness analysis were boringness rating and method.
We used linear regression to examine the influence of (1) time to complete value weighting on boringness ratings, (2) time to complete value weighting on difficulty ratings, and (3) difficulty ratings on boringness ratings. All analyses were conducted in R 2.4.1 GUI 1.18.
Results
Table 1 summarizes the results for each of the accuracy and accessibility measures, and provides global assessments of accuracy and accessibility using a scale of low to high.
Summary of Results across Accuracy and Accessibility Measures for Each Method.
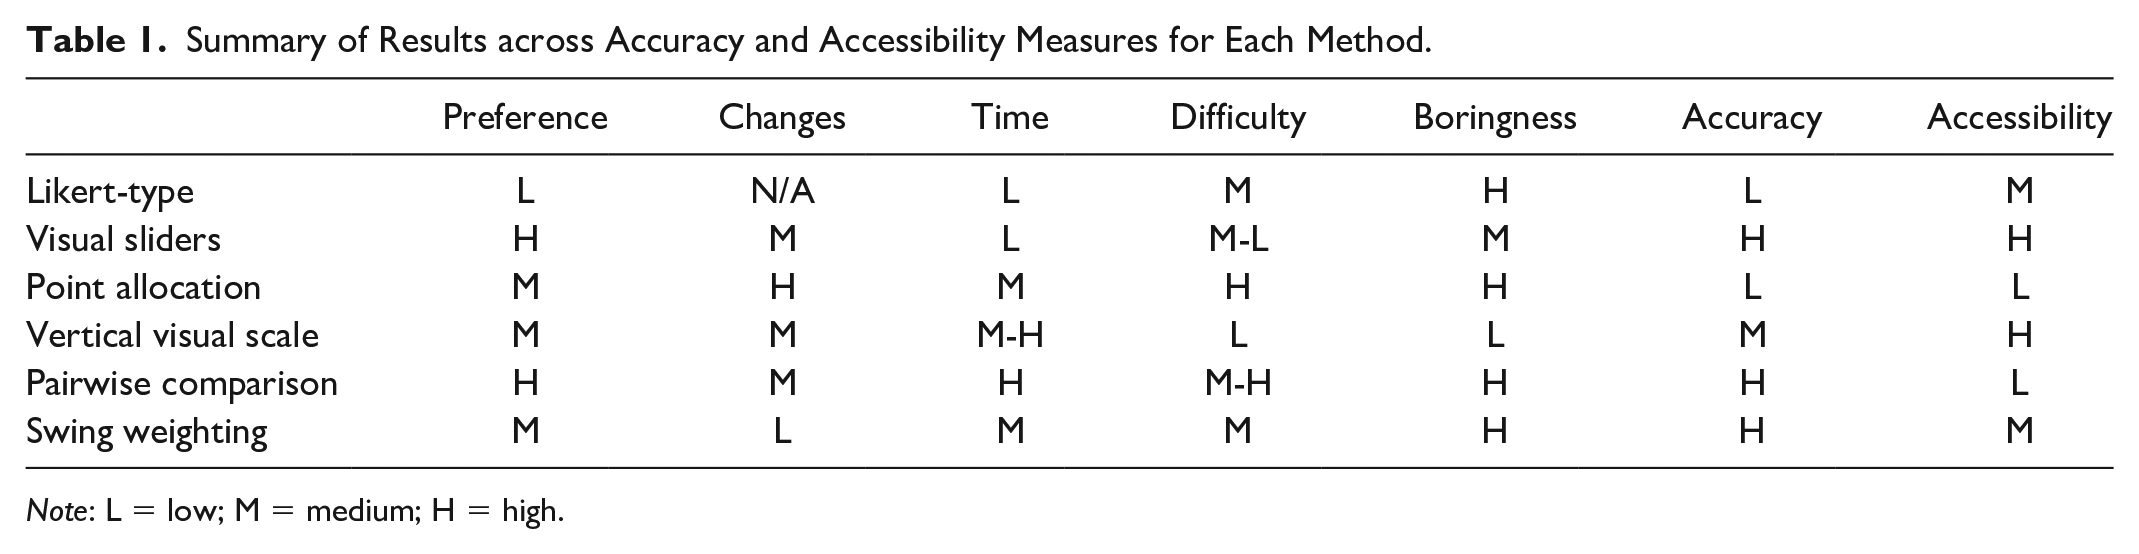
Note: L = low; M = medium; H = high.
Accuracy
User assessments of accuracy for all methods are shown in Figure 2A. Results of the chi-square test confirmed statistically significant differences in the frequency with which the methods were selected by respondents, χ2(5, 84) = 11.714, p < .05. Examination of the residuals confirmed that Likert-type and pairwise comparison contributed most strongly to the significant results, with Likert-type accounting for 39 percent of the test statistic and pairwise comparison for 49 percent. Only six respondents selected Likert-type as the most accurate method, and it was thus removed from the analysis of post-selection adjustments. ANOVA results indicated that total adjustments differed significantly among the remaining five methods, F(4, 73) = 2.854, p < .05, with an η2 of 0.135. Positive and negative adjustments were not significantly different among the methods. Full results are shown in Figure 2B, including the results of Tukey’s post hoc test.
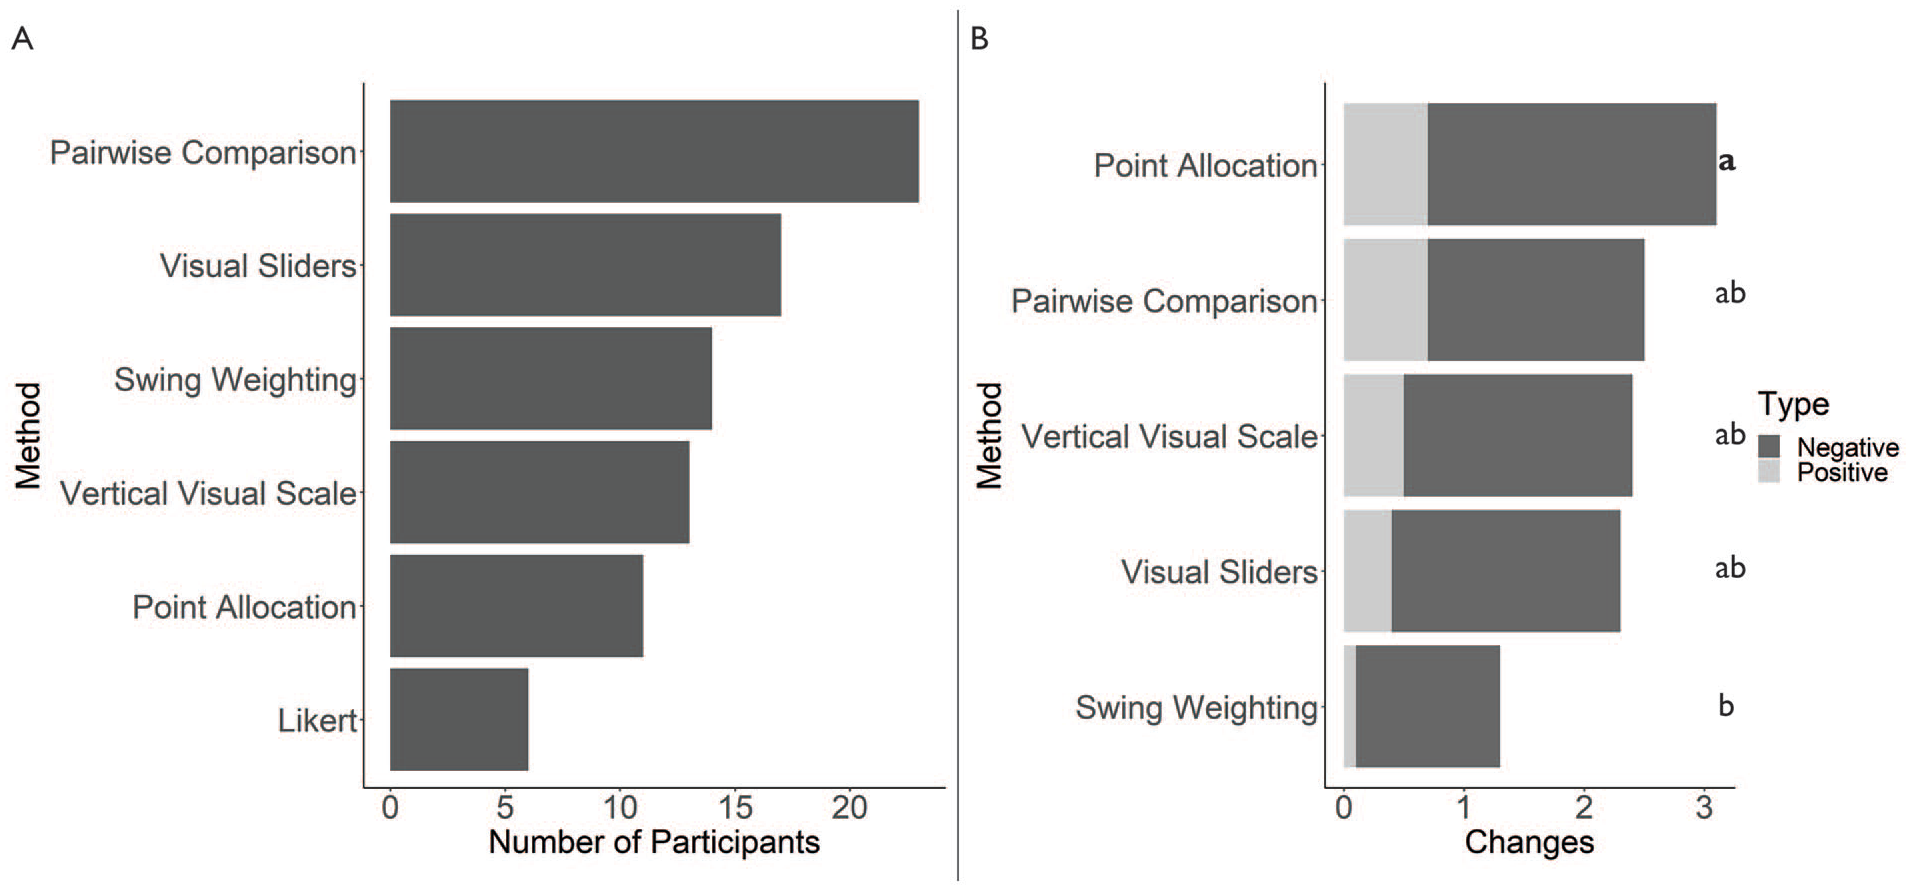
(A) Number of participants who chose each method as the most accurate (n = 84) and (B) total, positive, and negative changes per method, adjusted for the number of respondents who chose each method as the most accurate (n = 78).
The weights produced by all methods were highly correlated with each other, and correlations were significant at p < .01 (Figure 3A).
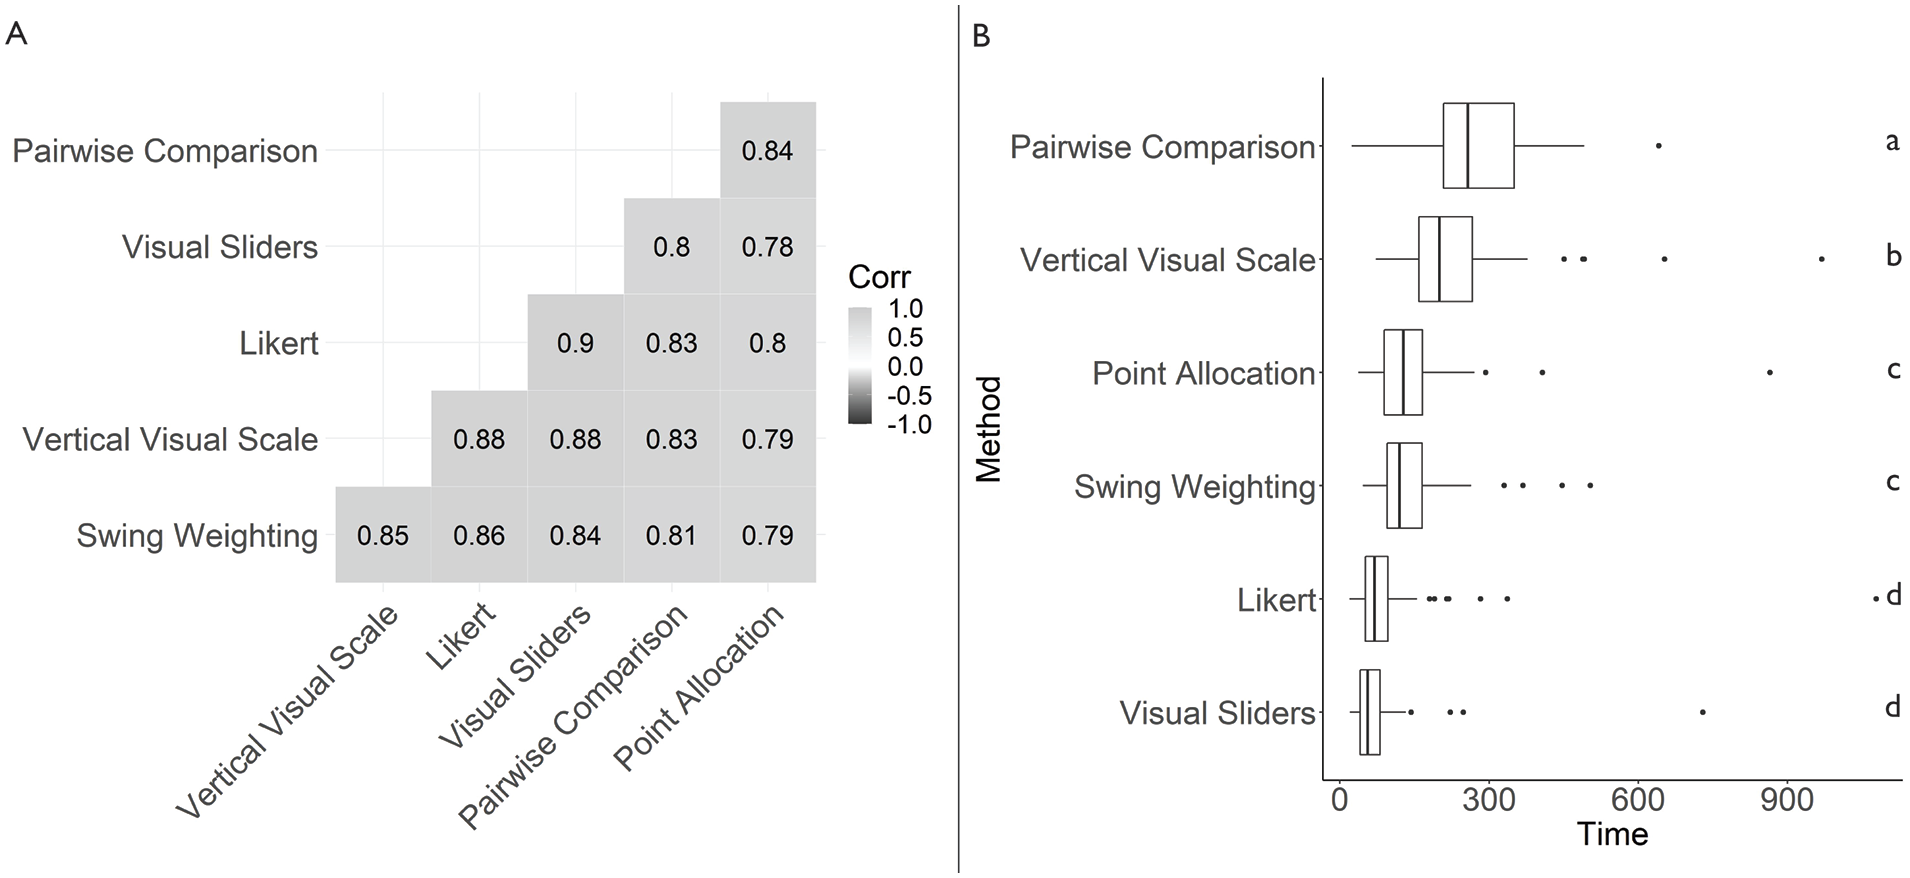
(A) Pearson correlations among the weights produced by all methods (all correlations were significant at p < .01) and (B) boxplots of time to completion (in seconds) for each method (n = 76).
Accessibility
ANOVA results indicated that time differed significantly among the six methods, F(3.67, 257.08) = 64.79, p < .000, with an η2 of 0.314. Boxplots of time and results of paired t tests with Bonferroni correction for each method are shown in Figure 3B. Twelve participant records were removed from time analyses due to a computer error that resulted in missing data, and one was removed as it was considered to be an outlier.
ANOVA results indicated that difficulty differed significantly among the six methods, F(3.64, 320.19) = 17.01, p < .000, with an η2 of 0.125. Boxplots of difficulty ratings and results of paired t tests with Bonferroni correction for each method are shown in Figure 4A.
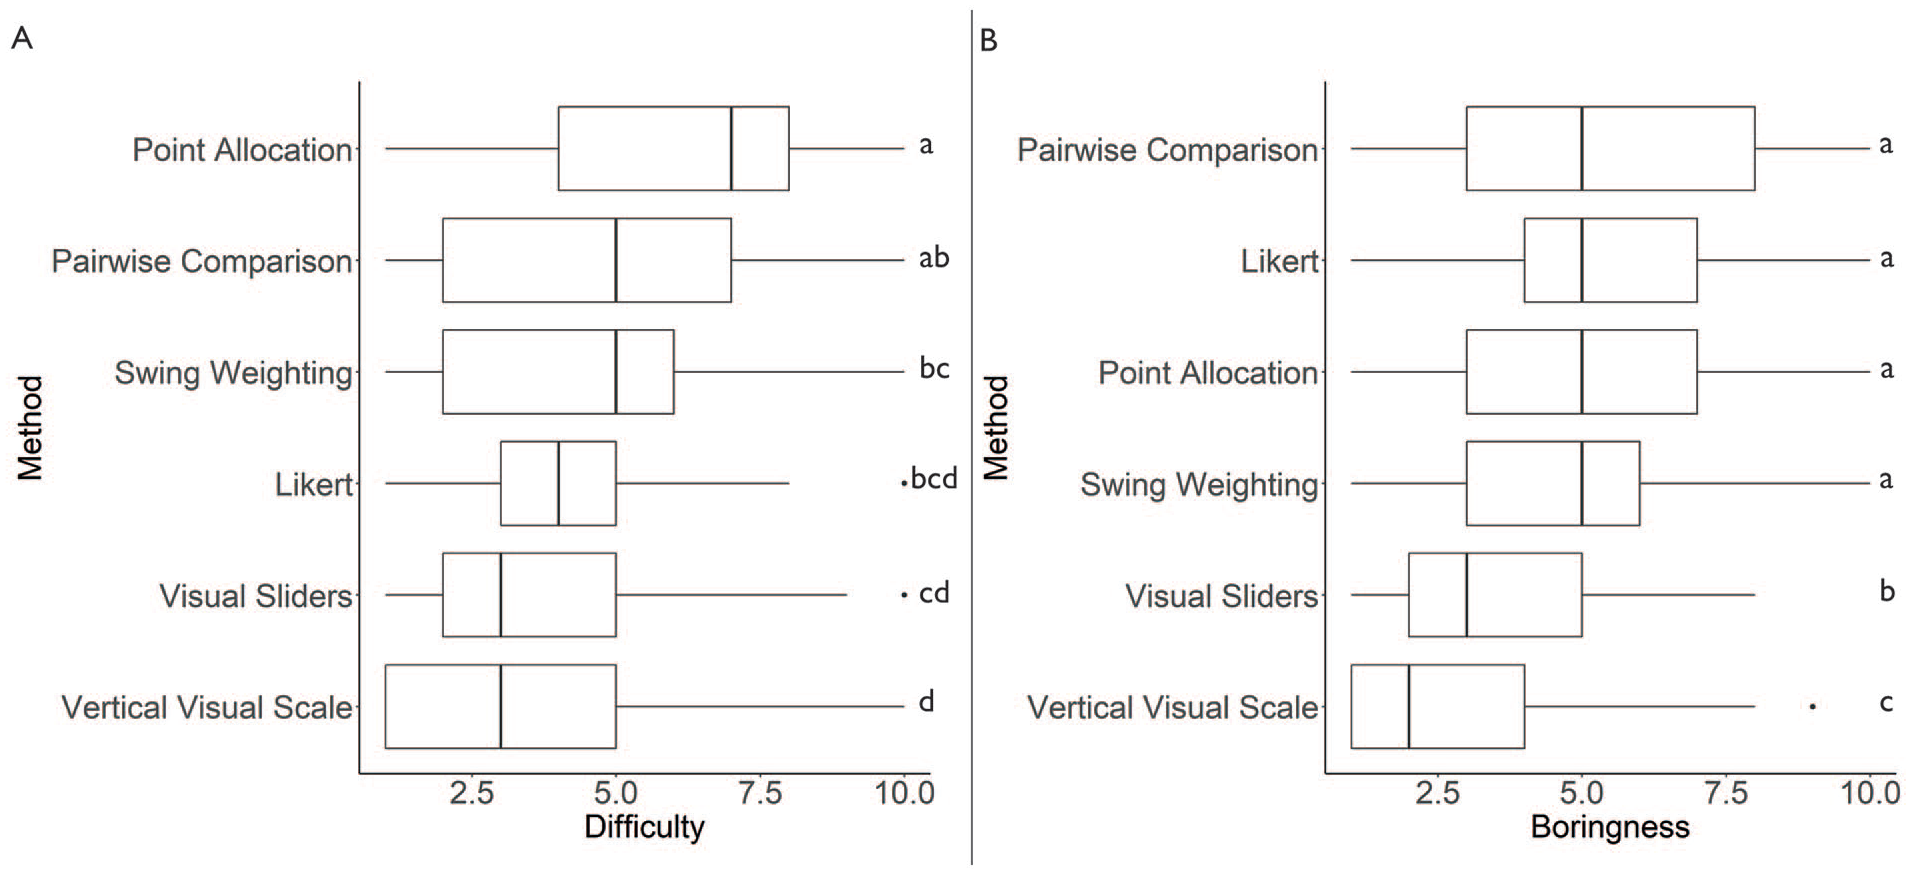
(A) Boxplots of difficulty ratings, on a scale of one to ten (n = 89) and (B) boxplots of boringness ratings, on a scale of one to ten (n = 89).
Linear regression showed that time required to complete each method was a significant predictor of difficulty ratings, F(1, 519) = 4.71, p < .05, with an R2 of .007. Difficulty is equal to 4.14 + 0.002 (time) seconds when difficulty is rated on a ten-point scale.
ANOVA results indicated that boringness differed significantly among the six methods, F(3.58, 315.01) = 26.91, p < .000, with an η2 of 0.183. Boxplots of boringness ratings and results of paired t tests with Bonferroni correction for each method are shown in Figure 4B. Linear regression showed that time was not a significant predictor of boringness ratings. However, difficulty was a significant predictor of boringness ratings, F(1, 532) = 82.07, p < .000, with an R2 of .132. Difficulty is equal to 2.80 + 0.36 (boringness) rating when difficulty is measured on a ten-point rating scale.
Discussion
This study evaluated six stated-choice value-weight-elicitation methods for accuracy and accessibility. Participants assessed the visual sliders, pairwise comparison, and swing weighting methods as most accurate, while Likert-type and point allocation were deemed least accurate. Visual sliders and vertical visual scale were assessed as most accessible, while point allocation and pairwise comparison were least accessible. This research provides important insights into appropriate value-weight-elicitation methods that provide accurate results while remaining accessible to a range of users.
Accuracy
The pairwise comparison method, or Analytic Hierarchy Process, was selected by participants as the most accurate method, followed by the visual sliders and swing weighting. However, swing weighting received the fewest total post hoc changes by those who chose it as the most accurate method, and could thus also be considered most accurate. These two methods are also those that most explicitly help users think through trade-offs among options in a step-wise manner and are typically used in multi-criteria decision analysis (Frazão et al. 2018; Roszkowska 2013; Srivastava, Connolly, and Beach 1995). These accuracy assessments align with previous research showing that decision-support methods that help users differentiate among options can increase the reliability and credibility of chosen solutions (Ferretti and Montibeller 2016; Frazão et al. 2018; Youngkong et al. 2012).
The finding that the visual sliders method was accurate while the Likert-type was not is of particular interest. Likert-type scales are widely used in planning practice (and across many other disciplines; Hartley 2014; Willits, Theodori, and Luloff 2016), and yet participants did not feel that this method accurately represented the relative weights of their values. The visual sliders method is simply a modified version of a Likert-type scale that uses continuous sliders and was considered to be quite accurate. The user interface and continuous scale likely allowed participants to express their preferences more accurately using this method.
The finding that all methods were highly (but not perfectly) correlated with one another highlights the importance of method accessibility. If all methods produce broadly similar results, user accessibility becomes an important quality metric, that is, the most inaccurate response is the one that is never given.
Accessibility
The most rapid and least difficult methods were those that did not force users to make trade-offs or allocate fixed resources and were cognitively easier for participants to complete (Keeney 2004). This aligns with previous research (Chrzan and Golovashkina 2006; Ferretti and Montibeller 2016; Louviere and Islam 2008). The vertical visual scale method is a form of rating method that does not force trade-offs but was still time-consuming, likely due to the time required to use the interface. The pairwise comparison method was also time-consuming because users had to make multiple paired comparisons. This can cause problems in practice, as users may become overwhelmed by the task and fail to complete the method (Harker 1987). Time to complete the method was a significant predictor of difficulty ratings, although this is not a strong relationship; clearly other factors contribute to users’ difficulty ratings.
Difficulty was a significant predictor of boringness ratings, with an R2 value of .13, suggesting that difficulty is somewhat important in determining boringness. Interestingly, time was not a significant predictor of boringness ratings, suggesting that it is possible to design a relatively long value-weight-elicitation process that engages users. The two least-boring methods were also those that used more interactive interfaces. It would thus appear that boringness is influenced by both difficulty and interface type. We note that participants may have experienced boringness differently than those involved in a real planning process, as they may be less invested in the outcome. Further research should investigate opportunities to increase the interactivity of more boring methods, to improve their user appeal.
Although there is limited literature on the boringness of value-weight-elicitation methods, some decision-science literature has argued for simpler elicitation methods to increase “usability” (Edwards and Barron 1994). While the argument for simplicity is more clearly associated with difficulty, it can also be understood to relate to attention span and a user’s ability to complete a task. There is also literature on the gamification (Seaborn and Fels 2015) of online surveys and planning-support systems (Maleki et al. 2020), with the goal of increasing engagement (Harms et al. 2015). Although gamification research has discovered that respondents tend to find the experience of using gamified surveys to be more enjoyable and are often willing to spend more time on gamified surveys, the outcomes of these positive findings are unclear, with lower response rates in some cases and questions as to the accuracy of responses (Harms et al. 2015; Keusch and Zhang 2017).
Applications in Practice
Although this research is exploratory and should be replicated in additional contexts, our findings have implications for communicative planning practice. If communicative planning is to support democratic decisions that meet the needs of diverse populations, planners need input from a broad range of participants. Techniques that are both accurate and accessible offer the promise of increased engagement in decision making, producing more informed decisions and overcoming some of the criticism of communicative planning as being so consensus-based as to exclude divergent views, rendering them invisible and reproducing inequities (Meyer and Oranje 2005; Pan, Kwak, and Deal 2022).
Visual sliders and, to some degree, swing weighting and vertical visual scale emerged from this experimental analysis as the “Goldilocks” options: receiving high or medium ratings across accuracy and accessibility measures. However, each of the six methods has its limitations, and their appropriate use in practice will depend on the context and goals of the planning or decision process. Likert-type received low accuracy ratings and relatively low accessibility ratings, despite its wide popularity in practice. Options similar to the visual sliders, which is a simple method to implement, may provide better results, although this may vary by context.
Given that all methods produced statistically similar weights, the results suggest those leading decision processes should prioritize accessible scales, particularly in cases where a survey or value-weight-elicitation exercise seeks to gather the feedback of a large group of respondents. This aligns with research on planning-support systems that highlights user-friendliness and efficiency as key characteristics of accessible planning-support apps (Lin and Benneker 2022). More accurate/less accessible scales, such as pairwise comparison and swing weighting, might be appropriate in cases where a smaller group of participants needs to make hard trade-offs (Ferretti and Montibeller 2016), but we reiterate that they may not produce results that are meaningfully different from more accessible methods, such as visual sliders.
It can also be helpful to employ multiple methods and outline their limitations to increase trust in the planning process and help participants feel heard (Pan, Kwak, and Deal 2022). This is supported by our findings that users chose various different methods as the most accurate and that there was variation in accessibility ratings; users do not all experience value-weight-elicitation methods in the same way.
Limitations and Future Research
The prioritization exercise simulated in this research would normally take place within a larger decision-making process, where participants would have carefully considered the planning context, their goals, and the options available. Participants would also normally be invested in the prioritization outcome, as they would have to live with the consequences of their decisions. Although our survey platform described each community planning option and asked participants to carefully consider their choices, it did not accurately simulate a full decision process, and the participants were not likely to be invested in the outcome. This may have changed how participants used the value-weight-elicitation techniques, and different results might be observed in practice. In addition, this research employed a within-subjects design, which may have resulted in more consistency across measures than might typically be seen in practice.
The participant population also represents a limitation of the research, as described in the “Method” section. This is to be expected for a survey which was administered in a university environment. These value-weight-elicitation techniques should thus be tested in different contexts in the general population. Participants in this study may have had less trouble using more complex methods and may have completed them more quickly and rated them as less difficult than participants from the general population.
A key limitation is the examination of the value-weight-elicitation process as a discrete step within or separate from the wider decision-making process. In particular, conducting value weight elicitation as an individual exercise and separating it from a deliberative process represents an analytic or linear approach to decision making rather than a holistic approach (Li et al. 2018; Spencer-Rodgers, Williams, and Peng 2010). Given that this research includes a focus on accessibility, we acknowledge the analytic worldview underlying this research. Analytic or linear approaches to decision making may be appropriate and welcoming to many decision-making participants, in particular, those from Western European cultures, but may exclude the worldviews of other participants who take a more holistic approach to decision making (Weber and Morris 2010). Further research on accessible decision making should seek to broaden the scope of decision-making approaches and techniques under analysis, and interrogate more holistic value-elicitation and decision-making approaches. Research that conducts such investigations in partnership with diverse communities and decision makers would be particularly useful.
Conclusion
Planning is a process of decision making that must integrate the values and needs of diverse populations (Ling, Hanna, and Dale 2009). This research provides guidance on the application of value-weight-elicitation techniques to gain maximum benefit from their characteristics and include more voices and perspectives in planning, in support of a more equitable and democratic communicative planning paradigm. Visual sliders, and to some degree swing weighting and vertical visual scale, emerged as techniques that offer an optimal balance of accuracy and accessibility. Given that all techniques produced statistically similar results, more accessible techniques may be most appropriate across planning contexts. Importantly, point allocation and Likert-type performed poorly across measures and should likely be avoided. Practitioners should assess the planning context and their decision-making objectives when choosing which scales to implement in community planning.
Supplemental Material
sj-docx-1-jpe-10.1177_0739456X231155069 – Supplemental material for A Comparison of Value-Weight-Elicitation Methods for Accurate and Accessible Participatory Planning
Supplemental material, sj-docx-1-jpe-10.1177_0739456X231155069 for A Comparison of Value-Weight-Elicitation Methods for Accurate and Accessible Participatory Planning by Lorien Nesbitt, Michael J. Meitner, Brent Chamberlain, Julian Gonzalez and William Trousdale in Journal of Planning Education and Research
Footnotes
Acknowledgements
The authors wish to thank staff at EcoPlan International and members of the IDEAL Laboratory, UBC, for testing and providing feedback on the survey instrument. They also wish to thank Dr. Robin Gregory for early methodological guidance.
Declaration of Conflicting Interests
The author(s) declared no potential conflicts of interest with respect to the research, authorship, and/or publication of this article.
Funding
The author(s) disclosed receipt of the following financial support for the research, authorship, and/or publication of this article: Financial support for this research was provided by Mitacs, the Department of Landscape Architecture at Kansas State University, and the Utah Agricultural Experiment Station, Utah State University (Project #1440).
Supplemental Material
Supplemental material for this article is available online.
Notes
Author Biographies
References
Supplementary Material
Please find the following supplemental material available below.
For Open Access articles published under a Creative Commons License, all supplemental material carries the same license as the article it is associated with.
For non-Open Access articles published, all supplemental material carries a non-exclusive license, and permission requests for re-use of supplemental material or any part of supplemental material shall be sent directly to the copyright owner as specified in the copyright notice associated with the article.