
Abstract
The ability of EfficientDet, a framework developed in 2019 for object detection, to automatically detect smoke plumes at a distance of several kilometers is demonstrated. Recent articles have raised concerns about the effectiveness of EfficientDet in fire detection applications, with over 40% of false positives reported. The proposed EfficientDet model achieved a true detection rate of 80.4% and a false-positive rate of 1.13% on a testing set. The data set used in this study, which includes 14,125 smoke and 21,203 non-smoke images, is one of the largest, or even the largest, of its kind reported in the literature for images containing smoke plumes. Our results surpass those of a previous study that used the same data set and are more reliable and realistic than those reported by others, which may seem better, but were calculated using smaller and less representative data sets.
Introduction
Large wildfires remain a major threat to people and their property despite all the advances in technology. One of the best ways to combat wildfires is to detect them early when they are small and easy to extinguish. This can be achieved by installing surveillance systems that cover large areas and training operators to locate and report the early signs of fires. Various types of systems have been proposed in the literature, including LIght Detection And Ranging (LIDAR),1,2 spectrometers, 3 wireless sensor networks,4,5 satellite- and drone-based surveillance, 6 crowdsensing supported by specific applications, 7 and watchtowers with human observers 8 or towers equipped with surveillance cameras operating with visible or infrared light. 6 Barmpoutis et al. 6 and Fernandes et al. 18 gave reviews of these methods. The authors believe that the use of towers equipped with visible-light cameras is the most well-established method. It is also more cost-efficient while providing improved resolution in terms of time and space. Such cameras are resilient and can function 24/7 in all weather conditions. This gave rise to several technical solutions existing in today’s market: FireWatch, 9 ForestWatch, 4 SmokeD, 10 High Performance Wireless Research & Education Network (HPWREN), 11 and CICLOPE. 12 Alkhatib 4 reports that FireWatch and ForestWatch systems are installed in 186 and 138 towers, respectively. CICLOPE site mentions that the system already covers an area superior to seven million acres. After installing visible-light cameras, a potential next step is to attempt to automate the detection process, allowing each operator to control a larger number of cameras. This article discusses the development of an automated wildfire detection system that is specifically designed to detect smoke plumes that rise above obstacles such as trees or houses, making them visible from many kilometers away.
From reading the literature, one may assume that everything has already been done and tested and that the widespread use of high-performance automatic systems for wildfire detection is a present-day reality. However, in our opinion, this is not the case. While there are several examples of automatic detection systems that have been deployed in the field,4,9–12 we believe, from our experience, that a significant number of false positives (FPs) still prevent their widespread acceptance. Unfortunately, it is difficult to confirm this concern from the limited information provided by technology vendors. A way to validate our perception is to note that recent articles continue to mention the problems associated with FPs. For example, Zhao et al.
13
stated that “There are major problems in the field of image-based forest-fire smoke detection, including the low recognition rate … and the high false alarm rate…” Another example is Peng and Wang
14
who noted that …the existing fire detection algorithm development process often focuses only on the fire recognition ability increased, while ignoring the false alarm rate and generalization ability of the algorithm, which causes the algorithm to be eventually deprecated by users due to a large number of false positives.
In addition, the authors are confident that the number of automatic detection systems that are deployed and operational is still small, given the amount of damage that forest fires cause every year around the world. All this opens up the opportunity to develop new reliable automatic detection systems with smaller false alarm percentages.
The literature contains frequent reports of automatic detection algorithms with small FP percentages and large true detection percentages, such as those of Frizzi et al. 15 and Yin et al., 16 with 96.6% and 96.37% of true detections along with 1.2% and 0.6% of FPs, respectively. Both works focus on automatic fire and smoke detection and have reported better results than ours. However, it should be noted that some of their images depict events that occur at close range while ours only capture distant landscapes. In addition, their data sets are likely less representative than the one we use due to their smaller size, which makes their results less reliable. Frizzi et al. 15 and Yin et al. 16 use, correspondingly, only 63% and 40% of the number of smoke images in the data set that we use, while the percentages of images without smoke are 55% and 87%, respectively. The smaller the data sets used, the less confidence that the performance of these systems will match the good laboratory results in a real-world environment. Smaller data sets are more prone to being inadequate at describing reality than larger ones, which is why the Big Data approach is becoming so popular. To address this issue, we used a data set containing 14,125 and 21,203 images with and without smoke, respectively, which is seemingly one of the largest, if not the largest, reported in the scientific literature regarding the number of smoke images taken from large distances of many kilometers. We are aware of other data sets 17 that have more images without smoke than the one we use; however, their fewer images with smoke result in a less stringent evaluation of the automatic system’s performance than ours.
The current working data set has already been used in a previous publication of Fernandes et al., 18 and this article continues the work of Fernandes et al., 18 on testing algorithms, specifically EfficientDets, 19 to enhance the smoke plume location and decrease the FP percentage. In their previous study, Fernandes et al. 18 tested Residual Nets and EfficientNets, with the latter achieving a true detection percentage of 85.3% and an FP percentage of 3.1% in the testing set. They introduced a mosaic-like division of the image that provides some location capability to EfficientNets, which were originally designed merely to indicate whether or not a smoke plume is present in the image and were unable to pinpoint its location. However, the smoke location using the mosaic structure is not yet as accurate as desired, even though this location is crucial for broadcasting only the first alarm of each wildfire event to the system operators by grouping the alarms from the same position in the image that occur within a certain period. Of the various possibilities of positioning-capable neural networks, the authors chose EfficientDet networks because Fernandes et al. 18 presented EfficientNets as a good option for wildfire detection, and EfficientDets employ EfficientNets as their backbone while introducing more powerful processing capabilities. Consequently, there were reasonable chances of having good results with EfficientDets, as it indeed happened, contradicting recent reports, 20 where EfficientDets present FP percentages so high that they are not applicable in any automatic detection system.
Few studies use EfficientDet for automatically detecting wildfires. Zheng et al. 21 describe the detection of smoke plumes, but they do not seem to report an FP percentage, an important evaluation parameter without which a proper comparison with our results is not possible. Only a mean average precision of 95.7% is reported. Their data set comprises 12,640 and 5200 images with and without forest-fire smoke, but it is unclear how many of these images are real, as the data set was created using augmentation techniques.
Xu et al. 20 developed an ensemble system that includes YOLOv5, EfficientDet, and EfficientNet. They compared EfficientDet with an individual YOLOv5, another type of object detector. They found that YOLOv5 had fewer FPs than EfficientDet, namely, 22.6%. However, that value is still considered too high. When tested separately, EfficientDet had an FP percentage of 41.8%, which is extremely high. Even though YOLO allows for real-time image processing, unlike EfficientDet, we did not choose it because there are several examples where EfficientDet is competitive in object detection efficiency.22–25 Furthermore, our application does not require real-time image processing. Renjie et al. trained their classifiers using 2381 images that contain forest fires, but they did not use any images without fire/smoke, which is different from what we did. In addition, Renjie et al. detected flames, whereas our goal is to detect smoke plumes from considerable distances, a few tens of kilometers, when the flames are usually not visible. The results of our work suggest that an isolated EfficientDet can yield significantly better results than those reported in Xu et al. 20
Data set
We used the same data set as Fernandes et al. 18 Cameras mounted in nine surveillance towers between 10 and 60 km from the sea in the region of Leiria, Portugal, captured images for smoke detection. These cameras, operating in the visible spectrum, form a system for observing forest fires over a large area. The image dates range from 6 May 2019 through 31 May 2020 for a total of 274 days; smoke images were collected over 186 days, and smoke-free images over 188 days. Although all surveillance tower cameras have smoke images, none have images for all 186 days. Figure 1 shows the number of images collected per day. The data set does not include images for winter 2019/2020. It is composed of 14,125 images that contain smoke plumes and 21,203 that do not. The data set is divided into training, validation, and testing sets. The purpose of the training set is to train the neural network. The validation set allows you to evaluate which hyperparameters provide the best performance of the neural networks. The testing set allows the neural networks to be assessed for their ability to generalize, that is, to provide correct results for new images. There are 8638, 2824, and 2663 images with smoke in the training, validation, and testing sets, respectively, and 8495, 5724, and 6984 without smoke, the total number of images being 17,133, 8548, and 9647. The training, validation, and testing sets contain, correspondingly, images from four, two, and three different towers. The introduction of such a difference in the choice of towers for the sets simulates the case when the generated classifiers will have to classify images from newly installed (new to the network) surveillance towers. Because the cameras in the surveillance towers rotate, the training, validation, and testing set contained images from 103, 66, and 63 different viewing directions for smoke images and 108, 56, and 81 different viewing directions for non-smoke images, respectively.
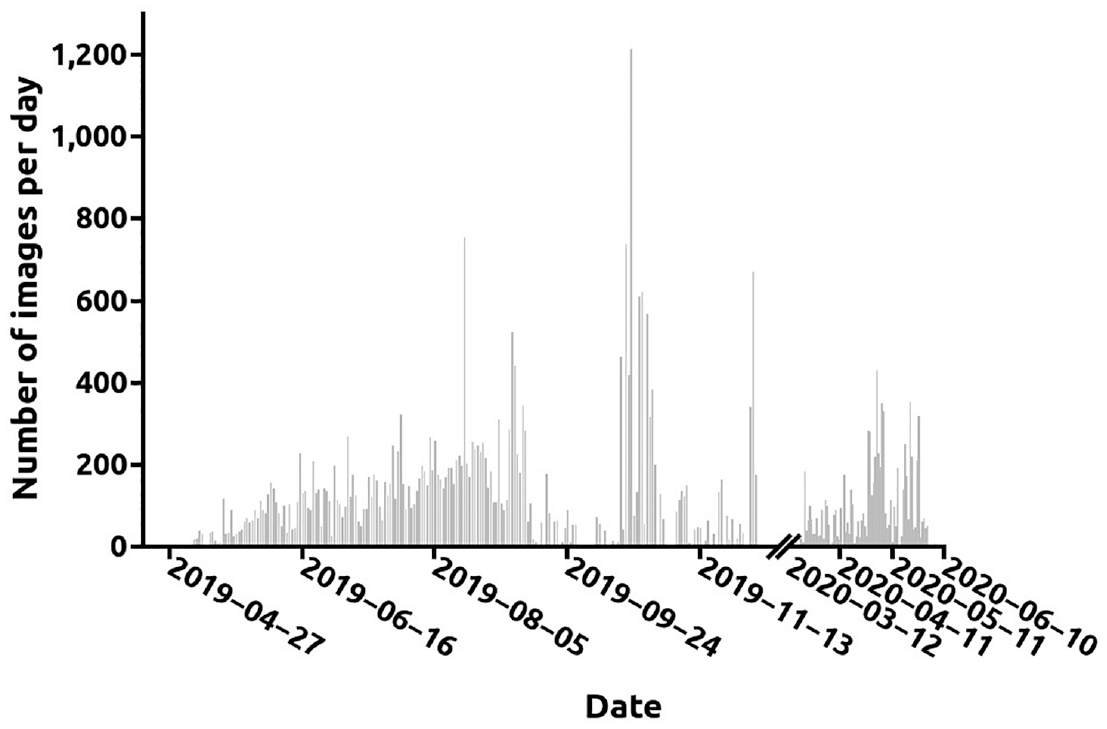
The number of images collected per day between 6 May 2019 and 31 May 2020.
Smoke plumes were annotated by rectangular sub-regions, which are good proxy measures of the plumes’ size, even though the annotations are not a perfect outline of the smoke plume. Since several images contain multiple smoke plumes, there are 22,255 such annotations. Figure 2 depicts the histogram with the smoke plume annotation area as a percentage of the image area. An amount of 85% and 92% of all smoke plume annotations enclosed percentages of image areas of less than 5% and 10%, respectively, demonstrating how small the detected plumes are concerning the size of the image.
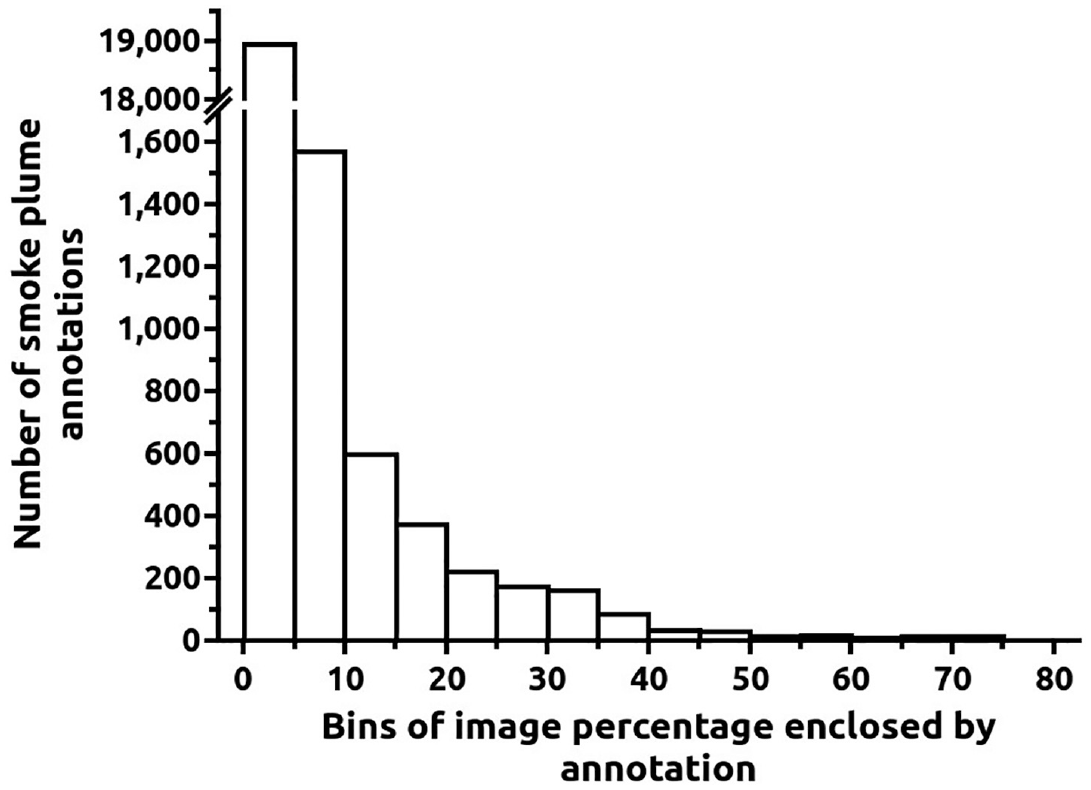
Histogram of the percentage of each image covered by a smoke plume annotation. The first bin contains 85% of all annotations.
Various representative far landscape images from the data set are shown in Figure 3. The images depict flat terrain, hills, or a combination of the two. The sunlight intensity and ground-shadow extent vary depending on whether the sky is cloudy or clear. Clouds may be located high in the sky or rather low. Houses may be present, or images may be almost devoid of man-made structures; we did not find any noticeable differences between the images with and without smoke regarding these features.
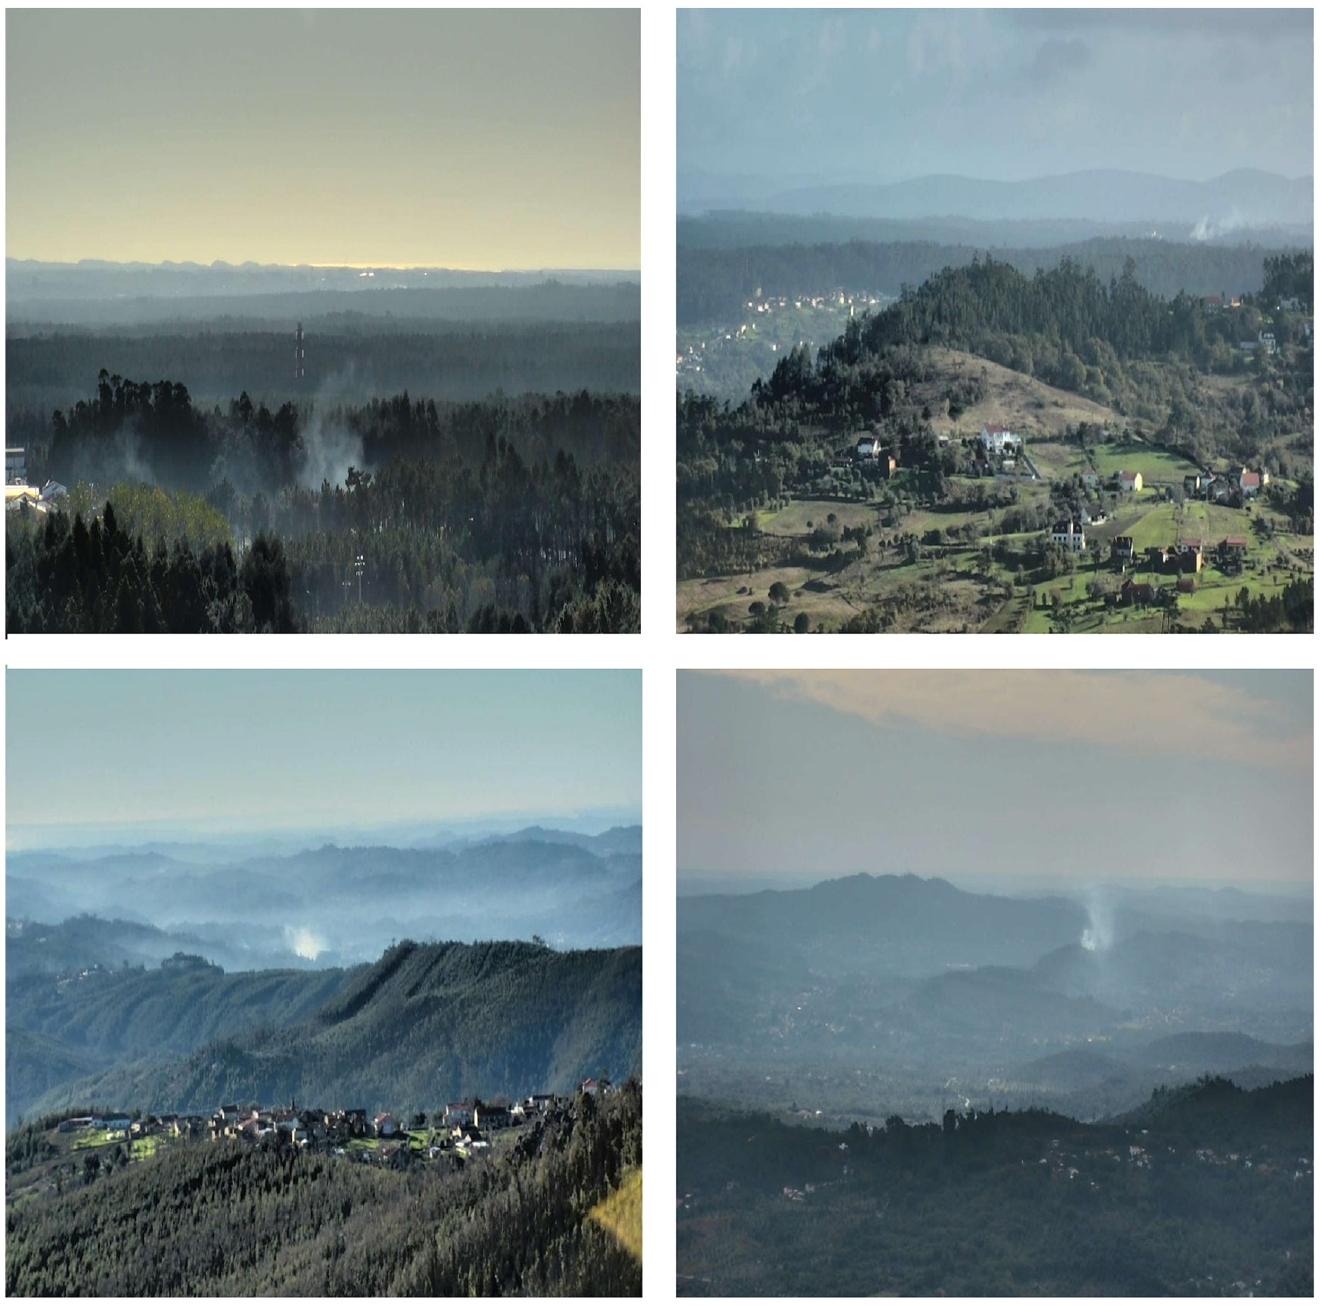
Various landscapes with smoke plumes.
Methods
EfficientDet
EfficientDets 19 are neural networks whose aim is object detection. Therefore, they indicate the object’s presence and point out its location in an image. They are composed of a backbone neural network, EfficientNet, 26 whose various levels of resolution are features/inputs to a BiFPN (weighted bi-directional feature pyramid network) layer. The BiFPN allows one to fuse the information flows from various levels and resolutions and weigh them differently, with the weights being learned during training. The fusion involves information circulating in both top-down and bottom-up directions. The BiFPN fused features are the input of two neural networks, called classification and box networks. The outputs of the former and latter are, respectively, the object class and its bounding box coordinates. In BiFPN, the nodes, where the convolution operations occur, that do not fuse features were discarded relatively to the previous equivalent structures and a connection was added directly between the input and output layers to include more feature fusion. For BiFPN, the numbers of channels and layers increase exponentially and linearly, respectively, to a factor included in the EfficientDet name such as D0 and D1. For the classification and bounding box nets, the number of channels is the same as in BiFPN, and the number of layers increases linearly with the previously mentioned factor. Due to all the improvements introduced, EfficientDets presented a state-of-the-art performance in the COCO data set 27 at their launch date while significantly decreasing computational costs. They are still among the top performers at present.
Transfer learning
Transfer learning consists of retraining one neural network, previously trained to solve some problem, to address a new problem. Retraining works when the new and previous data have similarities. For example, it is still important to identify features such as edges or curves in images, even for different classification tasks. In addition, training the highly complex models from random weights would be too difficult, if not impossible, due to the lack of training samples. This way, as in the present situation, models pretrained on the large Imagenet data set 28 are subsequently trained using the wildfire data specific to our problem.
Results evaluation
To evaluate the results, we used TP and FP percentages as primary quality indicators. The reason was the need to select classifiers with the largest possible true detection percentage, which would not have more than 1% FPs. The 1% limit allows for a lower FP percentage than that proposed by Fernandes et al. 18 At the same time, assessing any classifier with the values corresponding to a unique decision threshold is risky. It is widely accepted that a better solution is to compare areas under receiver operating characteristic (ROC) curves. In this work, a partial area under the ROC curve (pAUROC) estimation approach 29 is used, which means that the AUROC is determined only for FP percentages smaller than a certain value. By doing this, we can focus the parameter calculation on the regimes more relevant to the application in question. Accuracy, precision, and average precision are also reported here. The latter metric is widely employed in evaluating object detector neural networks. It is well known that precision-recall curves may be more suitable than ROC curves for choosing between classifiers, but this is for situations when the classes are highly skewed, which is not the present case. 30
Our results are presented for the value of the Intersection over Union (IoU) between the annotation and the neural network detection equal to 0.3. IoU measures the ratio of the two following quantities: (1) the intersection area between the annotation rectangle of a smoke plume and the bounding box provided by the neural network, and (2) the area of the union of the annotation rectangle and that same bounding box. Typically, this parameter is set to 0.5 for solid objects containing well-defined boundaries. It should be noted that here we detect smoke plumes, objects that inherently have blurred boundaries, making it difficult to distinguish them strictly. Consequently, a less demanding IoU of 0.3 seems more satisfactory to ensure that all true detections are counted while not missing some due to the harder-to-define smoke boundaries. The TP and FP values are calculated per image; FP determination only considers images without smoke plumes.
Results
In this article, we tested EfficientDets in D0, D1, and D2 configurations. The implementation used was that of Xuannianz. 31 We did not test larger networks such as D3 or D4 to maintain the neural network as small as possible. The training algorithm was Nadam 32 with Smooth_L1 loss 33 for regression and focal loss 34 for classification. The neural network training lasted 20 epochs. The best epoch was that with the best sum of true positives (TPs) and true negatives for a decision threshold in the classification of 0.5. This sum was applied after ensuring that the TP percentage was higher than 80% and the FP percentage was lower than 1%. The choice of these limits was due to the need to have an FP percentage as small as possible because if it is too high, the system operators will disregard or turn off the system. On the contrary, the TP percentage must not drop too much because failure to detect a wildfire may have dire consequences. One may claim that TP should be as high as possible despite the percentage of FP. For this situation, real-world practice has shown that large FP percentages diminish operators’ confidence in the system, causing them to pay less attention to alarms. Moreover, the chosen TP and FP limits of 80% and 1%, respectively, seem reasonable because automatic wildfire detection systems should be considered a decision support system that assists the human operator, not a completely autonomous system. However, if we still need a human in the loop, one may ask, “What is the purpose of an automatic detection system?” The answer lies in the fact that for humans, it is difficult to analyze the constantly changing images from several dozen cameras and stay fully concentrated on the task 100% of the time. Consequently, the team formed by a human and an automatic detection system will be stronger than if they worked separately. The automatic system keeps analyzing the images without interruptions, and the human operator provides the extra analysis capacity.
When training object detectors such as the EfficientDet, all the training images usually contain at least one of the objects to be detected. The classifier learns that a part of the landscape is not an object of interest by analyzing regions of the image that do not contain that object. In this article, we have included in the training set images with no smoke at all. By doing so, we exposed the neural network to a larger quantity of different landscape appearances and meteorological conditions to reduce FPs and increase the robustness of the created models.
Results in validation set
As a result of our experiments, we obtained three different neural networks with a TP percentage higher than 80% and an FP percentage lower than 1%. They are all D1 EfficientDets. Table 1 presents the results.
Best EfficientDets created with results for a decision threshold of 0.5 and IoU of 0.3.
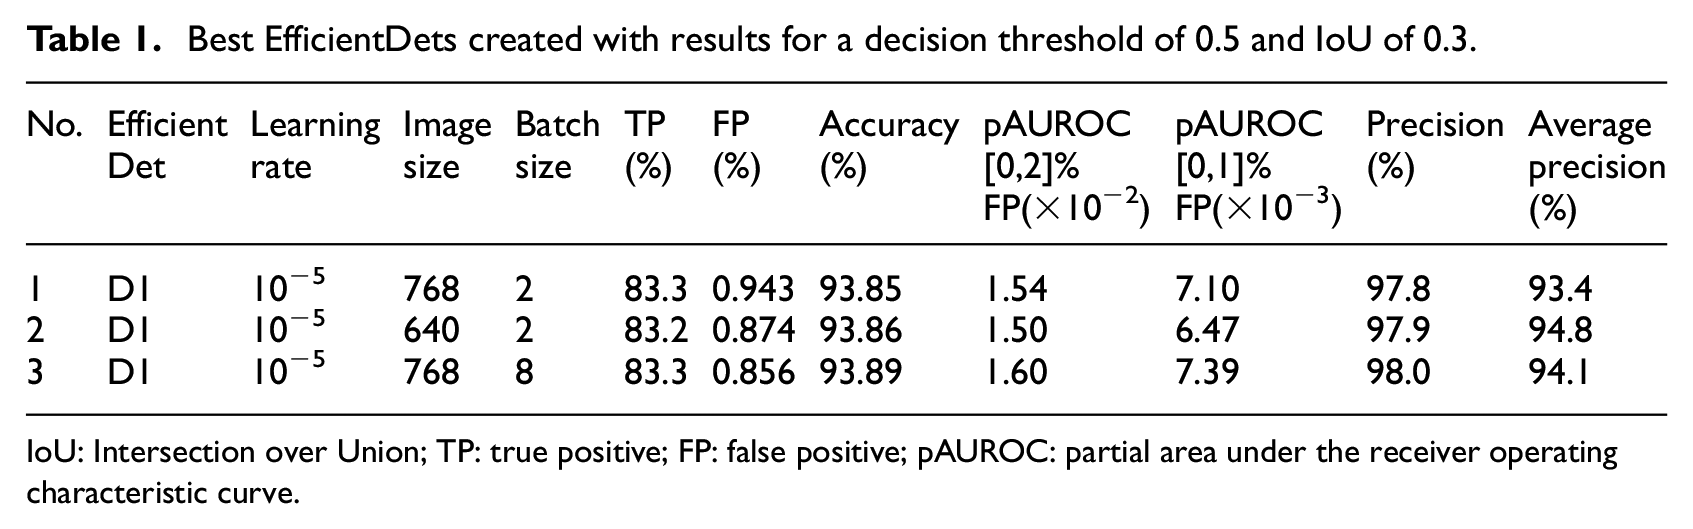
IoU: Intersection over Union; TP: true positive; FP: false positive; pAUROC: partial area under the receiver operating characteristic curve.
The values in Table 1 were used to choose the best of the three neural network models. The TP, FP, accuracy, and precision were determined for a decision threshold of 0.5 and IoU of 0.3. The best learning rate for the three classifiers in Table 1 was 10−5. In terms of image size, model number 2 uses 640 × 640 pixels, which is the typical value for an EfficientDet D1, developed on the Imagenet data set. 28 Model number 1 and 3 use 768 × 768 pixels, which is employed in EfficientDet D2 for Imagenet, but here allowed obtaining good results with D1. For model number 1 and 2, the batch size used is 2, and for model number 3, the batch size used is 8. The TP percentages are 83.2% or 83.3% and the FP percentages are 0.943%, 0.874%, and 0.856%. The table also contains the accuracy determined by adding the TPs and true negatives and dividing by the total number of images. For the shown TP and FP, the accuracies are 93.85%, 93.86%, and 93.89% for model number 1–3, respectively. This makes the third model the best in terms of accuracy.
The use of AUROC was driven by the need to understand whether the classifier was robust, independently of the chosen decision threshold. We used pAUROC because we found situations in which the larger AUROC values resulted from considering regions with large TP percentages and simultaneously with large FP percentages that are beyond any practical use. We want to obtain the best TP percentage with the lowest possible FP percentage, which raises the need to measure the AUROC only at low FP percentages. For the pAUROC the table contains the results for the interval between 0% and 1% of FP as well as the interval between 0% and 2%. The two cases are relevant because there was the possibility that the interval choice would influence the decision of which classifier is the best. For FP between 0% and 1% and between 0% and 2%, the maximum pAUROC value for the perfect classifier would be 0.01 and 0.02, for the former and latter intervals, respectively. The values of pAUROC for the former interval are 7.10 × 10⁻³, 6.47 × 10⁻³, and 7.39 × 10⁻³. For the latter interval, the pAUROC values for model number 1–3 are 1.54 × 10⁻², 1.50 × 10⁻², and 1.60 × 10⁻², respectively. Both FP intervals lead to the same conclusion that the worst neural network, in terms of pAUROC is number 2 and the best one is number 3. These values show that the third classifier is the best in the operational mode of fewer FPs and also that there is significant room for improvement in this mode.
The precision of model number 1 and 2 is 97.8% and 97.9%, respectively. For neural network number 3, the precision is 98%, meaning that only 2% of the algorithm detections correspond to FP. It is the best precision out of the three algorithms. Considering the average precision, calculated with all the precision-recall values, neural network number 1 is the worst with 93.4%. Neural network number 3 is the second best, with 94.1% against 94.8% of neural network number 2. The fact that neural network number 2 has the worst pAUROC values in Table 1 forces us to choose neural network number 3 to preserve the best results for smaller FP percentages. In summary, neural network number 3 is the best according to the evaluation parameters chosen except for the average precision. With the large precision values obtained, a system operator receiving the alarm knows that the probability that this is a true alarm is fairly high; this helps to increase the overall confidence in the system.
Results in testing set
After choosing neural network number 3 from Table 1, we analyzed its performance on the testing set. The objective was to understand whether its generalization ability, that is, the capacity to correctly classify images not involved in the development of the neural net, is good. The TD percentage obtained was 80.4%, with an FP percentage of 1.13%. Let us compare these results with 83.3% and 0.856%, respectively, in the validation set: the drop in TD and the increase in FP percentages from validation to test are not large, and they do not raise concerns regarding the generalization ability of the developed neural network. The accuracy in testing is 93.77% which is quite close to the value of 93.89% in validation.
Figure 4 contains the ROC curves for validation and testing sets of EfficientDet number 3 in Table 1. The left image contains the whole curve, and the right one presents a detail of the curve for percentages of FP smaller than 2%. The difference in the ROC curves between validation and testing sets is attributable to employing images from different surveillance towers with dissimilar landscapes for validation and testing.
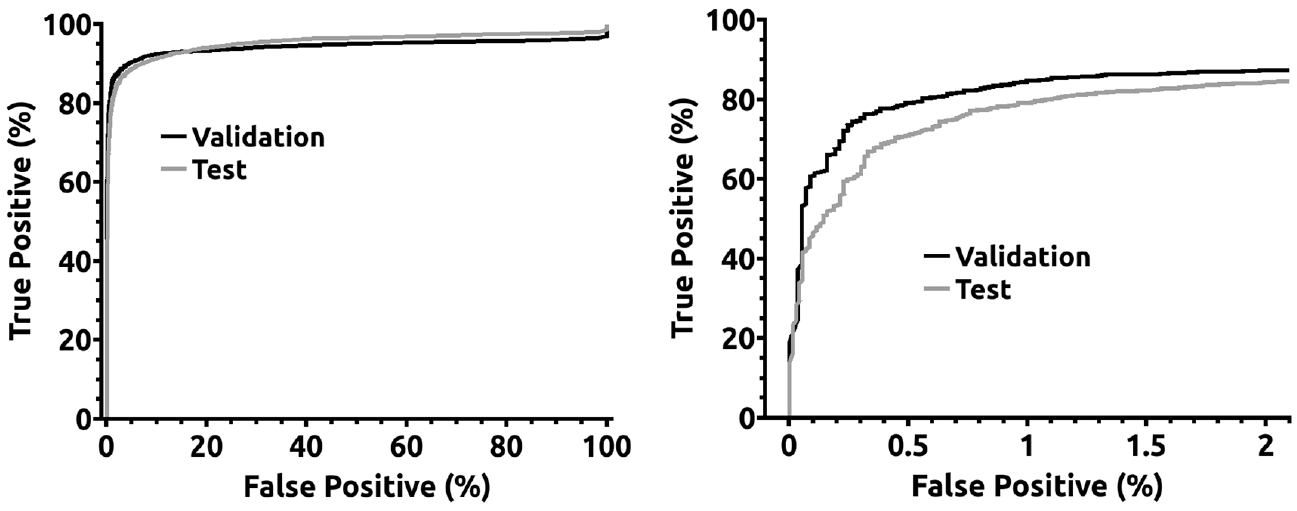
ROC curves for EfficientDet number 3 from Table 1.
False negative and FP characterization
From the obtained results, it is hard to understand which kind of images originates false negatives. The most obvious would be that the smaller smoke plumes would go undetected, as illustrated on the left side of Figure 5, but that was not what happened. The created neural networks sometimes failed to detect large smoke plumes, as shown on the right side of Figure 5, while being perfectly able to detect most of the small plumes. This failure might have to do with the fact that the classifiers had to be trained to disregard clouds to avoid FPs, and some large smoke plumes resemble clouds.
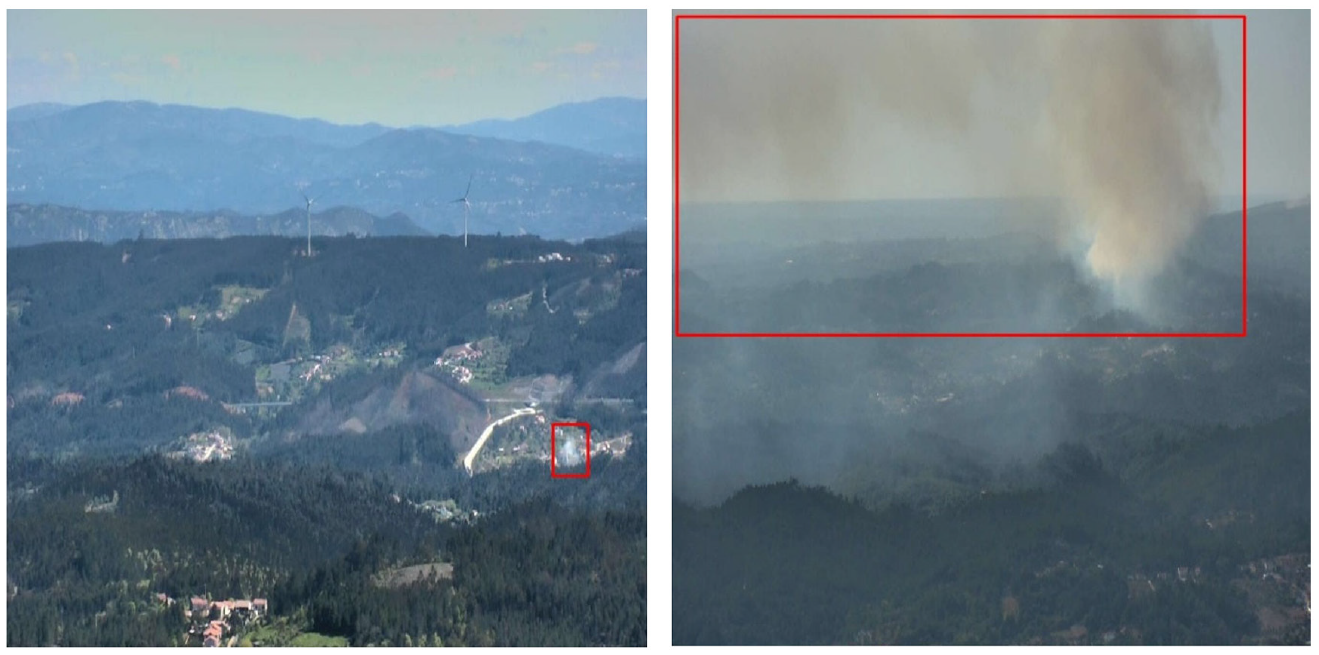
Two examples of smoke plumes that were not detected (false negatives), small and large. The red rectangle is the manual annotation.
The most frequent FPs are those caused by clouds, as seen on the left side of Figure 6. One particular case where clouds are hard to distinguish from smoke plumes, even for humans, is when small clouds, like flakes, appear close to the ground. The region of Leiria where the data set was collected is close to the sea, so fog and low clouds are frequent in the morning. There are also other types of FPs such as paths in the hills. These seem to be caused by the pathways’ undulant shapes, similar to smoke plumes, and their light brown color, significantly different from the greenery of surrounding trees and other vegetation (see the right side of Figure 6). Our experiences suggest that limiting the cloud-induced false alarms may hinder the system’s capacity to provide a better true alarm percentage. The difficulty in attaining the highest true detection percentages can be seen in the ROC curves of Figure 4, with true detection percentages being less than 90% for FP percentages smaller than 2%.
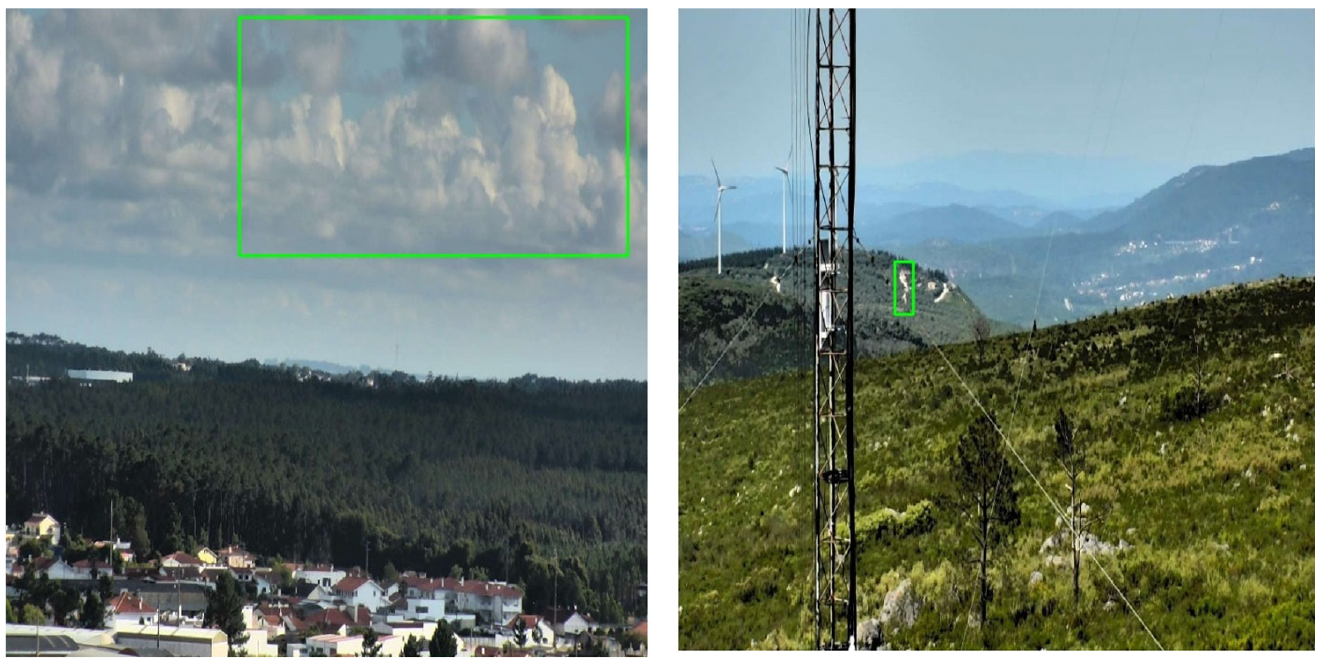
Two examples of false positives, a cloud on the left and a pathway on the right. The green rectangles correspond to the classifier detections.
Discussion
Comparison with other works is usually rather difficult because of the different situations to be detected, the difference in algorithms used, or the number of images in the data set. For the problem under consideration, we want to emphasize the importance of the data set size. The reason is that with smaller data sets, it may be easier to obtain good results as they potentially contain neither all landscape types seen in forest-fire images nor all atmospheric-related spurious objects. Surely, being representative, even a small data set, can provide realistic results. However, it is difficult to know whether a data set is representative of a given problem. Consequently, gathering as many images as possible is fundamental, but those images must be highly diverse in terms of landscapes covered, seasons, and weather conditions. According to our general knowledge of the scientific literature, the large number of images that compose the present work data set is highly unusual. Most works use significantly smaller numbers of images. In some cases, even though the number of images available is large, the total number of images with fire or smoke is still smaller than ours, 17 with the additional disadvantage that true detection percentages are reported for only 100 images. Our results are (apparently) not the best in terms of FP percentage or true detection ability reported in the scientific literature.15,16 Nevertheless, due to the quality of the used data set, we believe our results are, if not the most, at least among the most realistic and reliable.
When comparing our testing set results with those of Fernandes et al., 18 the most important step forward is the ability to provide the precise location of the smoke plumes. Remarkably, for the FP percentage of 1.13%, the best neural network from Fernandes et al. 18 has a true detection percentage of approximately 74%. In comparison, the present network reaches 80.4%, which indicates that the extra effort to get the smoke plume location in EfficientDet does not cause any loss of detection ability. On the contrary, it even reinforces it. However, the authors believe this difference may be due not only to the different algorithms employed but also to the dissimilarity in the methods used to choose the best neural networks. In this study, we selected those neural networks with (1) FP percentages smaller than 1% and (2) simultaneously restricted AUROC, calculated for a portion of the ROC curve. In the work of Fernandes et al., 18 the best neural network was the one with the best AUROC measured over the entire ROC curve.
Conclusion
EfficientDet was shown to be able to provide a low percentage of FPs, specifically 1.13%, while maintaining a true detection percentage of 80.4% in wildfire smoke detection. It was able to provide improved results over EfficientNets after being tested on the same extensive data set. Our work suggests that this improvement is due not only to the algorithm differences but also to the use of the partial Area Under the ROC Curve (pAUROC) to select classifiers that perform better in modes with fewer FPs. Low-FP operation is essential to ensure that operators do not ignore alarms. The accuracy and average precision of the best classifier were 93.89% and 94.1%, respectively.
The most frequent reason for FPs was clouds, while undulating pathways were less common but still relevant. Both types of FPs were caused by similarities to smoke plumes. Misdetections of smoke plumes could not be attributed to their dimensions, as they occurred for both small and large plumes.
The present work has rehabilitated EfficientDets for use in automatic forest-fire detection after previous publications, where the percentage of FPs was so high as to render the classifier useless. In addition, due to the extensive data set used, the authors believe that the reported classifier could be considered as one of the models setting the state-of-the-art in wildfire smoke detection using distant landscape images.
Footnotes
Declaration of conflicting interests
The author(s) declared no potential conflicts of interest with respect to the research, authorship, and/or publication of this article.
Funding
The author(s) disclosed receipt of the following financial support for the research, authorship, and/or publication of this article: this work was supported by project ResNetDetect with the number PCIF/MPG/0051/2018 from “Fundação para a Ciência e a Tecnologia” in Portugal.