
Abstract
The Vindhyan basin (~1.7-1.0 Ga) is the largest Precambrian sedimentary succession, covering the central (Son Valley, Bundelkhand) and western (Rajasthan) parts of India. Stratigraphically, it is divided into Semri, Kaimur, Rewa and Bhander Groups, and is well exposed in both the Son Valley and the Rajasthan area. The present study aims to provide detailed geology and geochemistry of the Lower Kaimur Sequence (LKS), that is, Chittor Fort Sandstone (CFS; ~1.1 Ga) of Rajasthan, Western India, and to compare it with the so-called contemporaneous deposits preserved in the Son Valley, consisting of Sasaram Sandstone (SS), Ghurma Shale (GS) and Markundi Sandstone (MS), in order of superposition. The CFS of Rajasthan consists of three lithofacies, comprising alternating shale and sandstone. The SiO2/Al2O3, K2O/Na2O, and CIA values from CFS, Rajasthan, indicate a moderate to high degree of chemical weathering in a warm, humid climate, leading to the derivation of compositionally mature sediments. The Th-Sc-Zr/10 and La/Sc-Ti/Zr diagrams imply that the sandstones of CFS belong to a passive margin setting, whereas the shales bear a signature of a continental island arc. The average trace element ratios, Th vs Sc and [Gd/Yb] N versus Eu/Eu*, indicate that the siliciclastics have post-Archean continental-to-intermediate compositions. The trace element ratio plots of La/Sc versus La/Co and La/Sc versus Th/Co revealed that the Hindoli Group (~1.8 Ga) of the Aravalli-Delhi Fold Belt (ADFB) is the source for the shales of the CFS of Rajasthan. The sandstones likely received detritus from the Berach granite (~2.5 Ga) of the Banded Gneissic Complex. At 1.6 Ga, due to this collisional activity, the compressional and extensional stresses caused the opening of the Vindhyan basin, which is separated from the Aravalli Fold Belts by the Great Boundary Fault (GBF). During the deposition of the LKS of Rajasthan/CFS the basin was active due to the reactivation of GBF. This caused a shift in provenance: the lower part of the Kaimur sequence received sediments from the Hindoli belt, while the upper part received sediment supply from the weathering of the Berach granite. Our study reveals that the LKS of Rajasthan has dissimilar lithology, geochemistry, provenance and tectonic setting from the contemporary sequence of the Son Valley. Our study thus suggests that a separate basin status should be given to the Rajasthan Vindhyans.
INTRODUCTION
The depositional history of the late Palaeo-Mesoproterozoic (~ 1.7 to 1.0 Ga) platformal sequence of the Vindhyan Supergroup coincides with the time frame when India became an integral part of two Supercontinent assemblies, namely Columbia and Rodinia (Zhao et al., 2004). During this time, the continental masses were very similar to the present-day configuration (Nance et al., 2014) and witnessed geological, climatic, and evolutionary stagnation, referred to as the ‘Boring Billion’ (Peng et al., 2019). Recent studies, however, have considered this span of Palaeo-Mesoproterozoic era (1800-800 Ma) as ‘Not-so’ because of some spectacular shifts in the Earth system processes like plate tectonics, atmosphere-ocean redox dynamics, marine nutrient cycles, and biological evolution including initiation of sexual reproduction (Mitchell & Evans, 2024; Mukherjee et al., 2025; Santosh & Groves, 2023). Interestingly, this time frame also witnessed the formation and evolution of several sedimentary basins (Chhattisgarh, Khariar, Vindhyan, Kaladgi, Pranhita-Godavari and Cuddapah) in the Indian Craton (Chakraborty et al., 2020; Kale & Patil Pillai, 2022). Recent geochronological database (Das et al., 2009; Meert et al., 2010; Patranabis-Deb et al., 2008; Rasmussen et al., 2002 and references therein) from the basin fills allowed workers to believe that most of these basins formed and evolved in late Palaeoproterozoic–Mesoproterozoic time, with only a few transgressed into Neoproterozoic, for example, Kurnool and Marwar. Understandably, the basins offer a unique opportunity to study Precambrian near-surface processes and products when continents were without land plants and marine systems were infested with microbes (Choudhuri et al., 2020; De, 2006; Taylor & Krings, 2005; Wellman & Strother, 2015).
The mineralogical and chemical composition of clastic sedimentary rocks are governed mainly by lithology, tectonics and weathering profile (climate) of provenance and hence, sediment mineralogy and chemistry are used to reconstruct the source rock character (McLennan, 1989; McLennan & Taylor, 1991; McLennan et al., 1983, 1993; Mohammedyasin & Wudie, 2019; Taylor & McLennan, 1985). Additionally, the composition of clastic sedimentary rocks, particularly sandstones and conglomerates, is strongly influenced by hydraulic sorting of minerals and by subsequent processes such as diagenesis, metamorphism (where applicable), and hydrothermal alteration. These processes can significantly modify the bulk geochemistry, with major elements, especially the alkali and alkaline earth elements, being particularly susceptible to redistribution and disturbance. In contrast, a few major elements like Ti and Al and selected trace elements like Rb, Cs, Ba, Sr, Y, Nb, Ta, Cr, V, Co, Ni, Sc, Th, including rare earth elements (REE) are heavily used for geological studies since these elements remain relatively immobile in course of weathering and sediment transportation (Bhatia & Crook, 1986; Condie, 1993; McLennan, 1989; Sen & Mishra, 2020; Taylor & McLennan, 1985). Concentration of these elements and their ratios, for example La/Sc, La/Co, Th/Sc and Th/Co, provide invaluable clues on source rock composition and tectonic setting (Condie, 1993; Cullers, 1988; Cullers & Podkovyrov, 2000; McLennan et al., 1993; Roser & Korsch, 1986). Also, the Chemical Index of Alteration (CIA=[Al2O3/(Al2O3+CaO+Na2O+K2O]) *100) and A(Al2O3) -CN (CaO+Na2O) - K (K2O) diagram is effectively used to quantify the extent of weathering in the provenance and, in turn, palaeoclimatic condition (Mudoi et al., 2021; Nesbitt & Young, 1982, 1984).
The Vindhyan Supergroup (named after the Vindhya Mountains) is composed of the Lower Vindhyan (Semri Group) and the Upper Vindhyan (Kaimur, Rewa, and Bhander Groups), in order of superposition, with unconformable-to-conformable contacts. Exposures of the Vindhyan Supergroup span an area of 104,000 km² and are subdivided into three sub-basins: the Son Valley, Bundelkhand, and Rajasthan (Ray, 2006). The Kaimur Group is defined as an assemblage dominated by sandstone and shale (Sastry & Moitra, 1984). The Kaimur Group is exposed in all three sub-basins (sectors) of the Vindhyan from west to east (Chakraborty, 2006; Chakraborty et al., 2010; Meert et al., 2010). In the Son Valley, the Kaimur Group is divided into two subgroups: The Lower Kaimur Subgroup and the Upper Kaimur Subgroup. In Rajasthan, the Lower Kaimurs are equated with the Chittor Fort Sandstone (CFS) Formation and the Upper Kaimurs with the Akoda Mahadev Sandstone Formation (Prasad, 1984). The objective of the present work is to geochemically characterise the Chittor Fort (Lower Kaimur) Sandstone from the Rajasthan sector of the Vindhyans, with special emphasis on deciphering its provenance, weathering history, and palaeotectonics. Furthermore, the geochemical data from the CFS are compared with and assessed against the geochemistry of equivalent stratigraphic-level sandstones from the Son Valley. In addition, the possible contribution of the Great Boundary Fault (GBF) reactivation during the sedimentation history of the Lower Kaimur sandstone in Rajasthan (CFS) is evaluated.
GEOLOGY OF THE STUDIED AREA
The western margin of the Vindhyan basin is defined by the GBF, which separates it from the Aravalli Fold Belt. At the same time, its southern edge is bounded by the Satpura Orogenic Belt/Central Indian Tectonic Zone (CITZ) (Figure 1A). The Kaimur Group, studied here, consists of a thick sequence of coarse-grained to medium-grained sandstone and conglomerate in Rajasthan. Stratigraphically, the Group is divided into two formations, the CFS (Lower) and Akoda Mahadev Sandstone (Upper). The CFS is exposed in the south of Rajasthan in the Chittorgarh area (Figure 1B). Here, the western, northern and southern side of the Kaimur sequence is bounded by the Hindoli Group (~1.8 Ga) of the Aravalli Fold Belt (Deb et al., 2002) and the Berach granite (~2.4 Ga) of the Banded Gneissic Complex (Figure 1B). The eastern side of the Rajasthan Vindhyan is bounded by Bundelkhand granite (~2.5 Ga). Bimodal meta-volcanics and metasedimentary rocks represent the 1.8 Ga Hindoli Group (Deb et al., 2002). The metasedimentary sequence consists of metapelites (phyllite) and metagreywacke (turbidite), with thin intercalations of metavolcanic rocks (Saxena & Pandit, 2012). The Berach Granite (2530 ± 3.6 Ma; Meert et al., 2010) is believed to have been emplaced during the collision between the Bundelkhand and Aravalli Cratons (AC) (Ghosh et al., 2022, and references therein), which contributed to the stabilisation of the Bundelkhand Craton (BC).
A. Generalised geological map of the Vindhyan Supergroup, exposed in the Son Valley and Rajasthan. The map shows the location of CITZ and ADFB, Hindoli Belt, Berach granite and Bundelkhand granite; B. Geological map of the Vindhyan basin in the Rajasthan area. Red square marks show the sample location in Rajasthan; C. Geological map of the Vindhyan basin in the Son Valley. The red square marks the sample location in Son Valley.
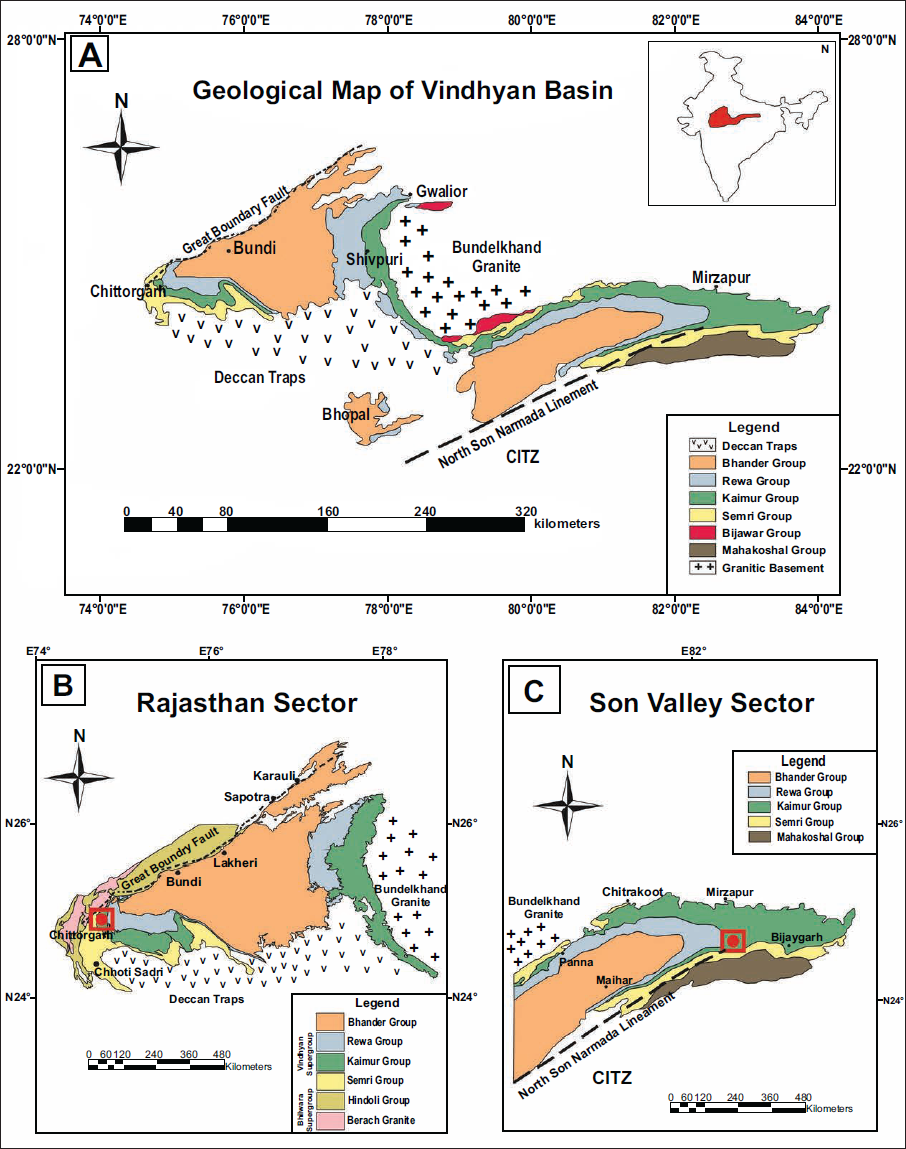
In the Son Valley, the Vindhyan succession includes the Lower Kaimur Group (Sasaram Sandstone [SS], Ghurma Shale [GS], and Markundi Sandstone [MS], from older to younger) and is bounded by the Palaeoproterozoic Mahakoshal Group and the Chhotanagpur Gneissic Complex (CGC) to the south. In contrast, the Bundelkhand Granite Gneisses (BGG) demarcate the northern boundary (Figure 1C). The Bijaigarh Shale Mangesar Formation/Scarp Sandstone and Dhandraul Sandstone together represent the Upper Kaimur Group.
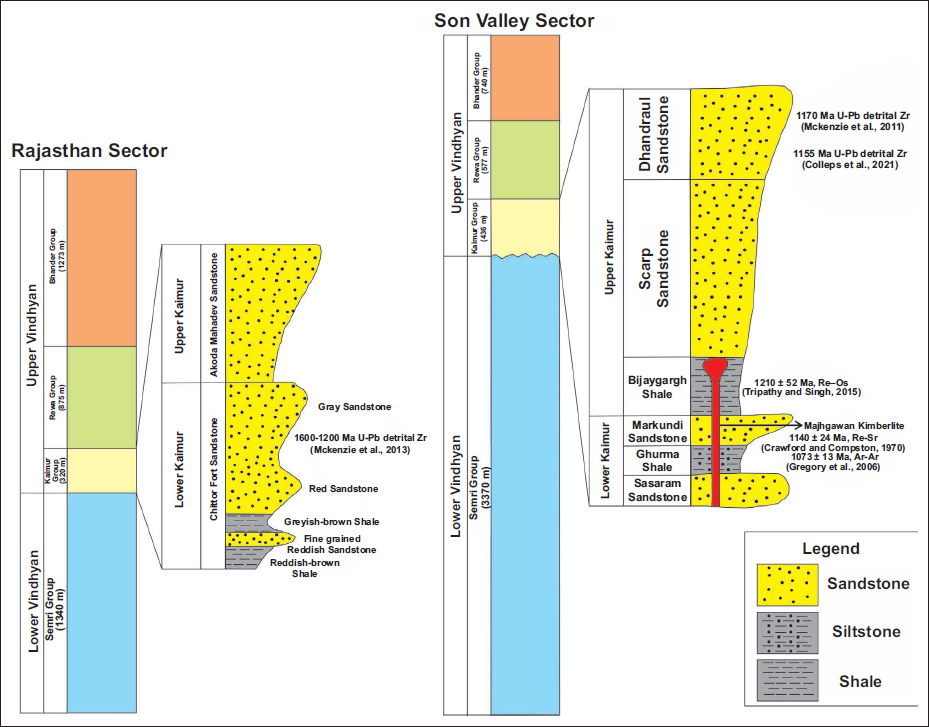
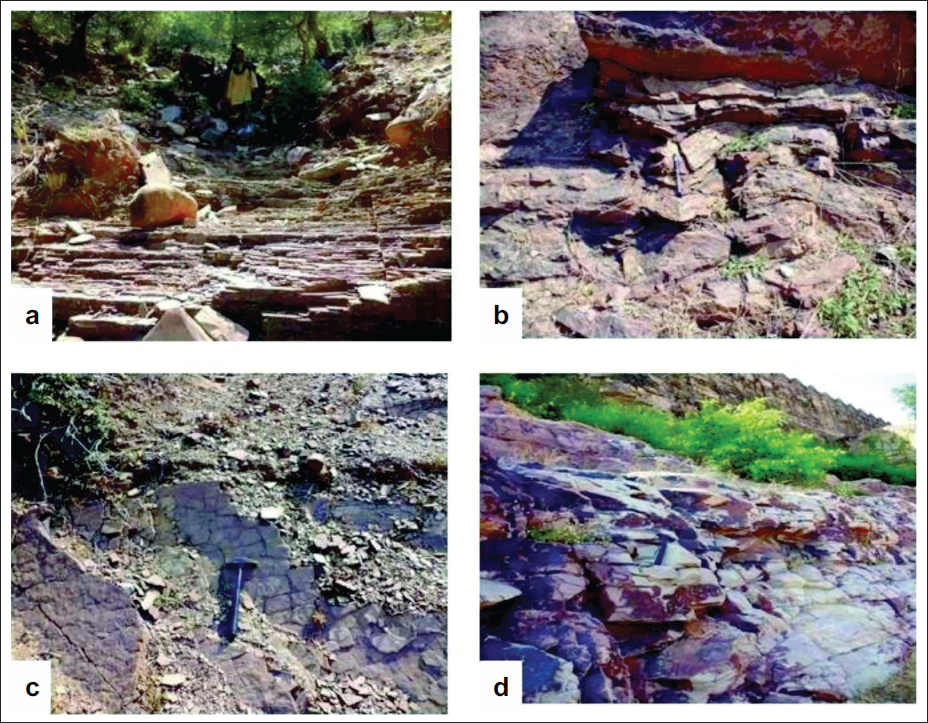
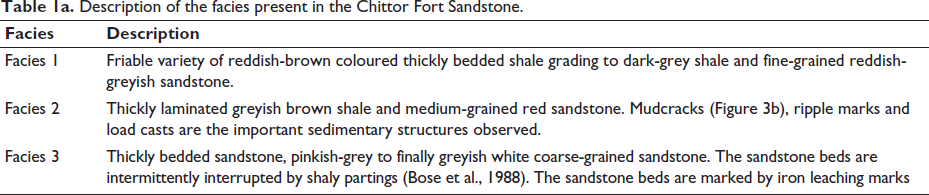
In the Chittorgarh area, the CFS rocks conformably overlie the Suket Shale of the Semri Group and are composed of greyish-yellow shales, subordinate grey shales, reddish-brown shale, siltstones, and light-brownish-grey sandstones (Dutta et al., 2006; Sastry & Moitra, 1984). This is in contrast to the Son Valley, where the Lower Kaimur Group of rocks overlies the Rohtas Limestone of the Semri Group (Lower Vindhyans) and is composed of sandstones, silicified shale, and pyritiferous shale. The stratigraphy of the Kaimur Group exposed in Rajasthan and the Son Valley, with available age constraints, is illustrated in Figure 2. The CFS Formation, Rajasthan, is initiated by reddish-brown, thinly bedded shale over the Suket Shale of the Semri Group (Figures 3a and 3c). Dark-grey shale, fine-grained reddish sandstone, grey-brown shale, and medium-grained red sandstone to grey sandstone, in order of superposition, constitute the CFS (Figure 2). Based on lithology and sedimentary structure, the CFS sequence is subdivided into three facies (Table 1a and Figure 2). Exposure scale folds are found in these sandstones (Figure 3b). The grain-size coarseness increases stratigraphically upwards in the succession (Figure 3d). The CFS of Rajasthan is interpreted as a product of a prograding shoreline system from a storm-dominated shelf to beach sequence (Bose et al., 1988, 2015).
Generalised lithology of the Lower Kaimur Sequence from Chittorgarh and its equivalents in the Son Valley, Rajasthan.
a. Thin beds of Chittor Fort Sandstones at a lower Stratigraphic level; b . Folding present on the beds of sandstone; c . Mudcracks present in shales, d . Coarse grey sandstone with iron patches at the highest stratigraphic level.
Description of the facies present in the Chittor Fort Sandstone.
Lithological difference between the LKS (Vindhyan Supergroup) of Rajasthan and the Son Valley, Vindhyan Supergroup.
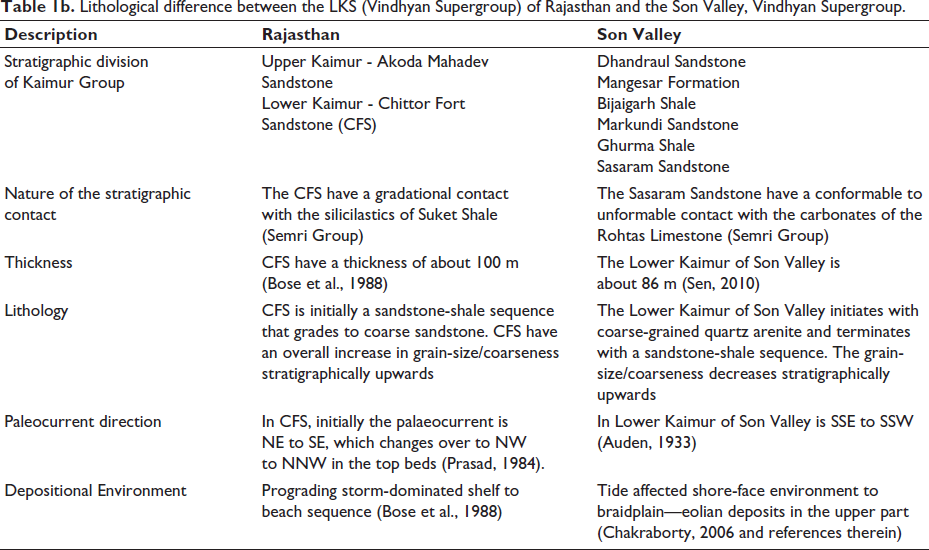
As discussed, the Lower Kaimur Group exposed in the Son Valley area is lithostratigraphically subdivided into three distinct formations, namely, SS, GS and MS, in order of superposition (Auden, 1933; Prakash & Dalela, 1982; Sen, 2010). The SS is very coarse-grained and thickly bedded. At the same time, Ghurma Shale (GS) comprises a medium to fine-grained blackish to greyish coloured thinly bedded sandstone-shale sequence, and Markundi Sandstone (MS) constitute alternate beds of coarse to fine-grained sandstones (Auden, 1933; Sen, 2010; Sen & Mishra, 2020). Whereas a tide-storm interactive coastline depositional setting is suggested for the SS (Chakraborty & Bose, 1990), palaeogeographic appraisal for the GS and MS is still awaited. In literature, the CFS of Rajasthan is considered equivalent to the Sasaram, Ghurma and MS of the Son Valley (Auden, 1933; Prasad, 1984; Sen & Chakraborty, 2023). The differences in field observations between the Kaimur Group of Rajasthan and Son Valley are described and summarised in Table 1b.
METHODOLOGY
The petrography work was carried out at the Department of Geology, University of Delhi, using a high-resolution Leica DMRX and Nikon Optiphot-Pol microscope. Five samples of shales, six samples of red sandstones and 12 samples of Gray sandstones (mentioned as grey sandstone in figures), that is, a total of 23 samples, were selected for geochemical analyses at the National Geophysical Research Institute, Hyderabad.
About 3 kg of fresh representative sandstone and shale samples from the CFS were reduced to small chips and powdered to a –60 mesh size. After homogenisation, approximately 100 grams of each sample were ground to less than 200 mesh size using a RETSCH pulveriser and an Agate Mortar and Pestle at the Department of Geology, University of Delhi, India.
Wavelength-dispersive X-ray fluorescence spectrometry (WD-XRF; model Philips MagiX PRO - PW2440, Philips, Eindhoven, The Netherlands) was used to determine major and minor oxides according to the procedure described by Krishna et al. (2016). The spectrometer was calibrated after measuring international reference materials like GSR-1 and GSR-4 (granite and sandstone). Preparation of sample powder pellets and other details are provided in detail by Balaram (2021).
Trace and REE analyses were performed using an inductively coupled plasma–mass spectrometer (ICP-MS; ELAN DRC II, PerkinElmer Sciex, USA). International rock standards GSR-4 and GSR-5 served as external reference materials. Approximately 0.05 gm of −200 mesh powdered sample was weighed into pre-cleaned and oven-dried Teflon crucibles prior to digestion and subsequent analysis. A mixture of conc. HF, conc. HNO3 and HClO4 in the ratio 7:3:1 were prepared. A mixture of approximately 10 mL was added to the Teflon crucible containing the sample. The crucibles with lids were left overnight on the hotplate. The next day, the sample was heated to approximately 200°C for about 2 hours until it reached incipient dryness. 5 mL of the initially prepared acid mixture (conc. HF + conc. HNO3 + HClO4) was again added to the sample, which was heated on a hot plate until complete digestion. After this, the sample present in the crucible was again diluted by adding 20 mL of dilute HNO3 (H2O and HNO3 in a 1:1 ratio). The solution was heated for about 20 minutes on the hot plate. After heating, 5 mL of Rhodium (Rh), considered an internal standard, was added to the sample. Then, distilled water was added, and the volume was made up to 250 mL. This final solution was then transferred to 100 mL plastic bottles for ICP-MS analysis. The precisions of major and minor oxides, REE, and trace elements were found to be better than 5% RSD with comparable accuracies (Balaram, 2021; Balaram & Rao, 2003; Krishna et al., 2016). The specifications of petrographic and geochemical data of the Lower Kaimur Group were previously published (Sen & Mishra, 2020; Sen et al., 2014); therefore, they are not mentioned here.
RESULTS: PETROGRAPHY
Chittorgarh Fort Sandstone (CFS), Rajasthan
The microscopic study of the CFS or Lower Kaimur Sequence (LKS) reveals that the sandstones exhibit a red colouration at a lower stratigraphic level, are medium to fine grained, moderately sorted, and have subangular grains (Figure 4a). Quartz, feldspars including orthoclase and plagioclase (Figure 4b), mica minerals and chlorite are present. In addition, chert, metamorphic, and volcanic lithic clasts are present (Figure 4c). Heavy minerals, such as zircon and tourmaline, are abundantly present (Figure 4a). The matrix is present, but its percentage decreases stratigraphically upwards. Hematite cement is abundantly present. A bimodal grain-size distribution is observed in samples collected from the upper part of CFS.
a. Angular quartz and high zircon content in red sandstone; b . Less mature red sandstone with plagioclase; c . Volcanic clast present in red sandstone; d . Pseudo matrix present in grey sandstones; e . Bimodal grains, polycrystalline quartz with straight contact and etched surface in the rounded quartz observed; f . Polycrystalline quartz with sutured contact.
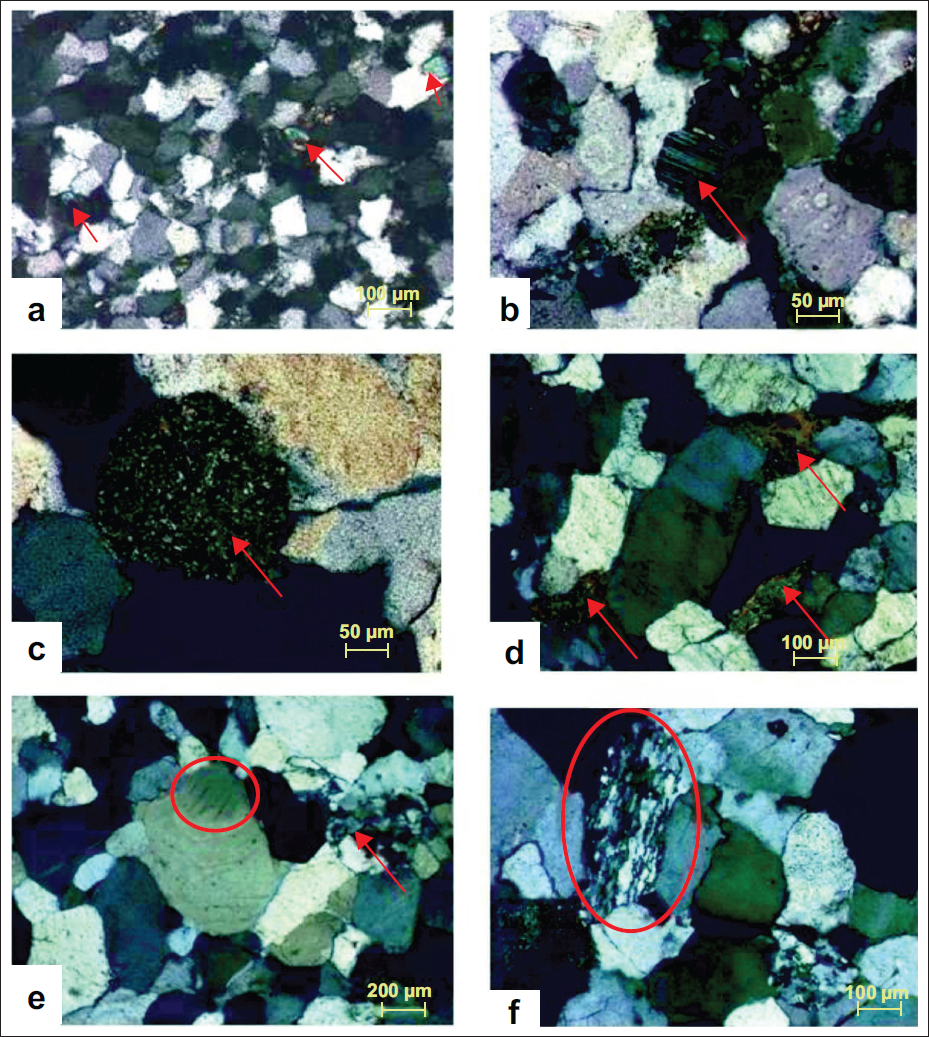
At a higher stratigraphic level of CFS, in grey sandstone, grains are subangular to subrounded (Figure 4d) and dominated by quartz and feldspars (orthoclase, microcline and plagioclase). Muscovite and biotite are both present. Rounded brown and blue tourmalines are abundant with minor zircon. The pseudo matrix (Figure 4d) serves as an important binding agent. The sandstones have coarse to medium grains and an overall increase in mineralogical and textural maturity. Quartz grains are subrounded to rounded with a bimodal grain-size distribution (Figure 4e). Quartz grains have etched surfaces due to pressure-solution activity and are predominantly non-undulose (Figure 4e). Polycrystalline quartz grains and chert fragments, as the only lithic clasts, are noticed in these sandstones (Figures 4e and 4f). Iron (hematite) and silica (quartz overgrowth) are dominant cements in these sandstones.
Lower Kaimur Sequence (LKS) of the Son Valley
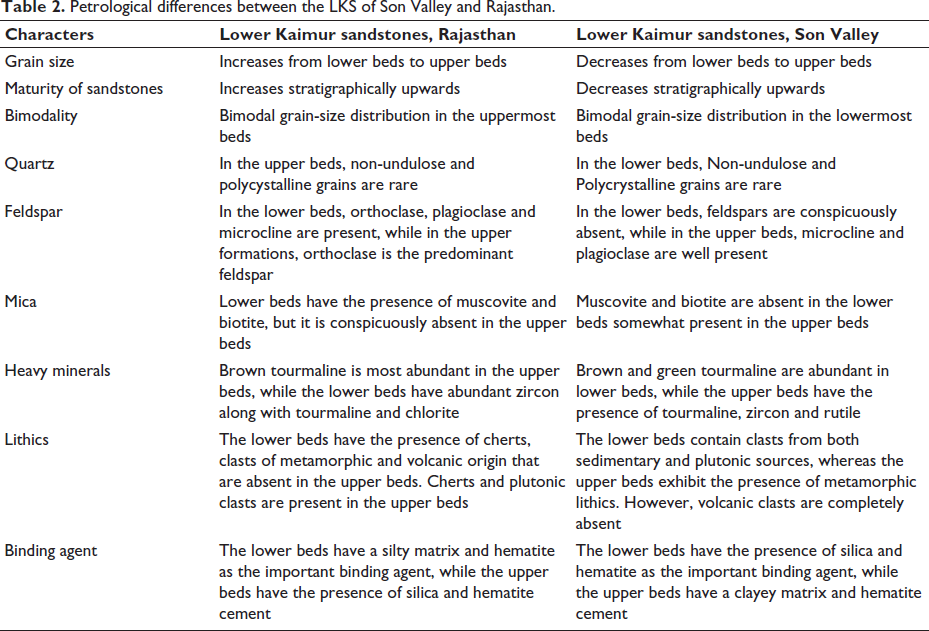
The lowermost SS consists of coarse-grained, compositionally and texturally mature quartz arenite (Sen et al., 2014). GS, represented by fine- to medium-grained sandstone, is less mature than the SS and exhibits a weak bimodal grain-size distribution. The MS is characterised by poor sorting and is less mature than that from the underlying formations. Tourmaline and zircon are present as heavy minerals. The detailed petrographic description of the Kaimur Group has already been published by Sen et al. (2014). A summary of observations and a comparative study is presented in Table 2.
Petrological differences between the LKS of Son Valley and Rajasthan.
GEOCHEMICAL RESULTS FROM THE CFS OF RAJASTHAN AND COMPARISON WITH THE LKS OF THE SON VALLEY
Major oxides
The major oxide data generated for shale units at the lowest stratigraphic level of CFS in Rajasthan are comparable to Post-Archean Australian Shale (PAAS) values, with relatively low SiO2 (56–79 wt%) and higher Al2O3 (8–20 wt%) contents (Table 3). The overlying red sandstones exhibit geochemical values comparable to those of the Average Proterozoic Cratonic Sandstone (APCS). Their SiO2 content (81–88 wt%) is higher than that of the associated shales, though Al2O3 (3.4–12.4 wt%) is comparatively lower. The grey-coloured sandstones that overlie the red sandstones record the highest SiO2 content (92–95 wt%) but lower values for the rest of the major oxides when compared with APCS and PAAS. In comparison, the LKS in the Son Valley records a different geochemical character. The SS, the lowermost stratigraphic interval, records the highest SiO2 concentration, though other major oxides record lower values than in PAAS and APCS. The major oxides of GS and MS record values closer to APCS than PAAS.
Major oxides data of the Lower Kaimur Group from Rajasthan.
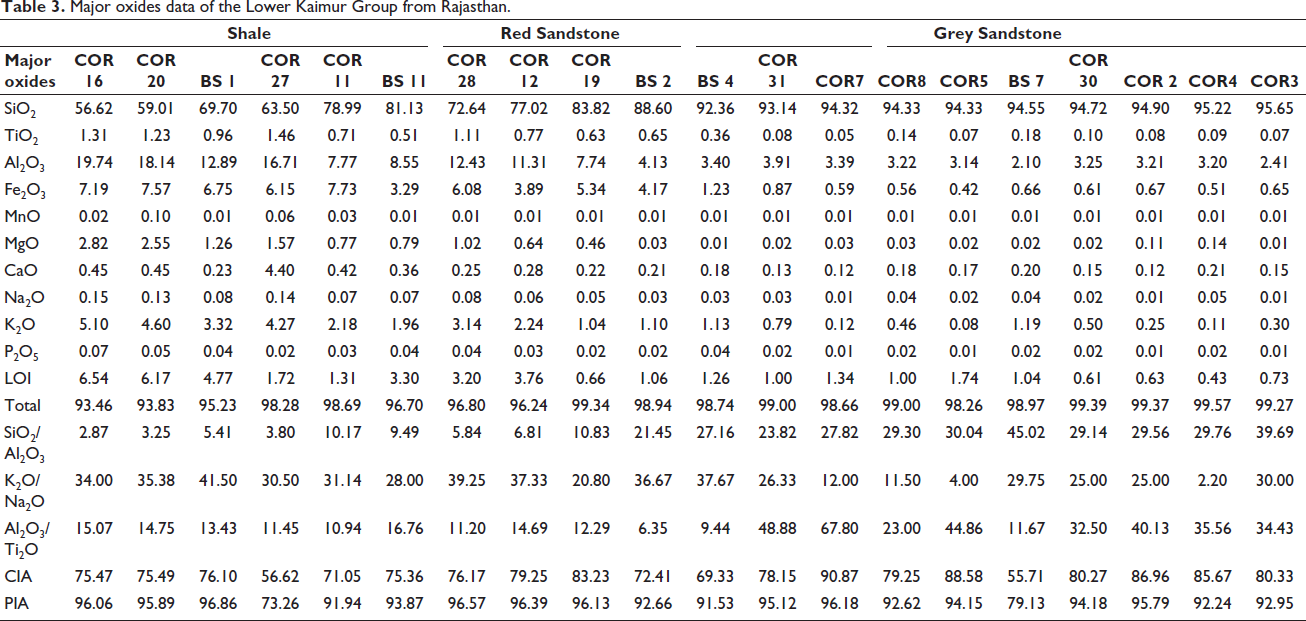
The SiO2/Al2O3 of CFS ranges from 5.8 to 31.6 with successively higher values in stratigraphically younger samples, suggesting that the sediment maturity improves at a younger stratigraphic level (Table 3). The K2O/Al2O3 values for CFS range from 0.1 to 0.2, indicating good occurrence of clay minerals in these rocks at the older stratigraphic level (Table 3). In the Son Valley, the average values of SiO2/Al2O3 of the LKS fall in a narrow range of 8.9–10, which is much lower than in Rajasthan.
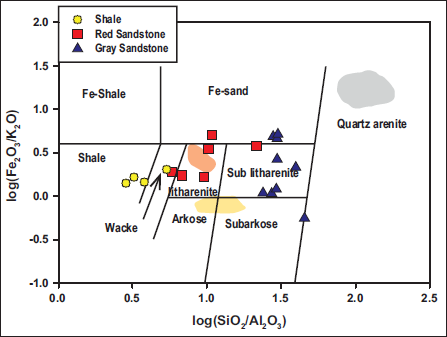
According to the geochemical classification of Herron (1988), the lowermost stratigraphic interval of CFS is represented by shale. In contrast, the LKS in the Son Valley initiates with supermature quartz arenite, that is, the SS. The shale, the red sandstones of CFS are identified as litharenites in composition, whereas the GS and the MS in the Son Valley are sublitharenite to litharenite in composition (Sen, 2010; Sen & Mishra, 2020). The upper sandstones of CFS are sublitharenite in composition (Figure 5).
Geochemical classification of the sedimentary rocks from the Kaimur Group, Rajasthan and Son Valley. The grey patch is of Sasaram Sandstone, the Yellow patch is of Ghurma Shale, and the red patch is of Markundi Sandstone from the LKS of Son Valley.
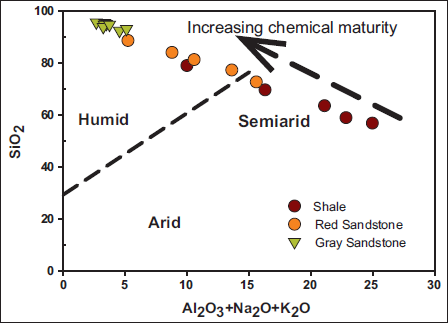
Intense chemical weathering is generally associated with warm, humid climates, whereas arid climates tend to result in weak chemical weathering (Nesbitt & Young, 1982). In the binary diagram SiO2-Al2O3+K2O+Na2O (Suttner & Dutta, 1986) shows the lowermost shales of the CFS were formed in semiarid climates, whereas the red and grey sandstone were formed in humid to semi-humid conditions (Figure 6); the LKS of the Son Valley was formed in a warm humid climate (Sen, 2010; Sen & Mishra, 2020).
Al2O3+Na2O+K2O vs SiO2 diagram to understand the paleoclimate and chemical maturity of the CFS sandstones and shales.
Trace Elements
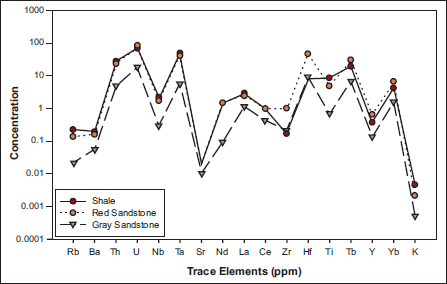
The LILEs (Rb, Sr, Ba, Th, and U) of the lowermost shales, red sandstone and topmost grey sandstones of CFS have the same geochemical patterns (Figure 7). While shale and red sandstone have similar values, the grey sandstone has comparatively lower values. Among the HFSE’s the Zr and Hf have the highest values in the red sandstone (Zr = 139–1066 ppm, Hf = 4.1–32 ppm) (Table 4).
Multielement diagram of Shales, Red Sandstone and Grey Sandstone of CFS.
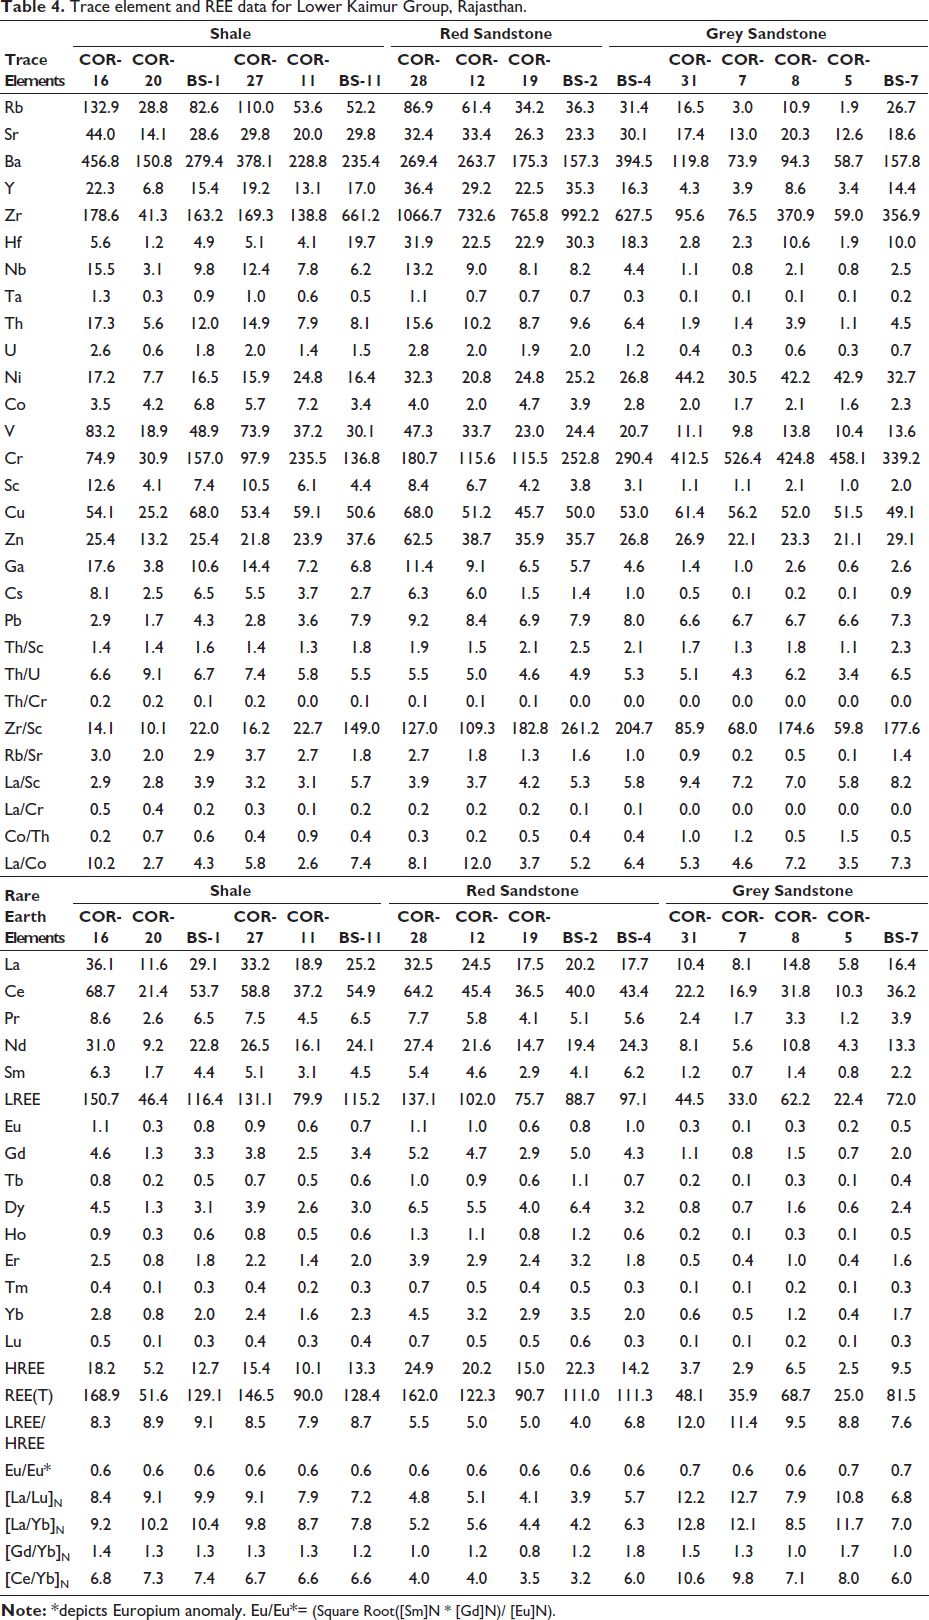
Trace element and REE data for Lower Kaimur Group, Rajasthan.
The elements Nb, Ta, and Y have similar concentrations in shales and overlying red sandstones, but the lowest concentrations are in grey sandstones, which may be attributed to quartz dilution (Raza et al., 2012). The transition metals, namely, Ni and Cr, have high concentrations in the CFS and improve stratigraphically upwards from the lowermost shale to the uppermost grey sandstone. In contrast, the Co, V, and Sc values are highest in shales and lowest in grey sandstones (Table 4).
Th and U have similar values in both Rajasthan and Son Valley. The Zr and Hf values are greater in the CFS than in the LKS of Son Valley, implying higher zircon concentration in CFS (Table 4). The higher concentrations of Ni, Cr, V, and Sc in the CFS indicate a greater presence of mafic minerals than in the LKS of Son Valley.
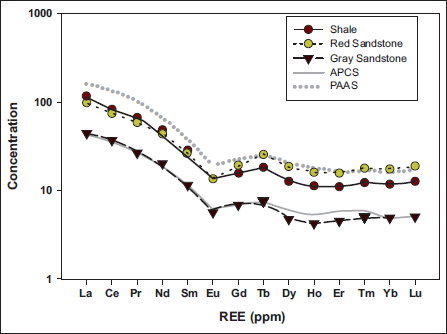
Rare Earth Elements
The total REE of CFS for shales, red sandstone and grey sandstone ranges between 51.6 and 168, 90.71 and 162 ppm, and 25 and 111 ppm, respectively (Table 4). The LREE of red sandstones is depleted, and the HREE is comparable to PAAS. In general, the REE patterns (Figure 8) of the shales of CFS are more depleted than those of PAAS and enriched than the APCS (Figure 8). The LREE patterns of the grey sandstone are comparable to APCS, and the HREE pattern is slightly depleted. The average LREE of CFS is fractionated, and the HREE show a flat pattern. The Eu/Eu* is comparable to both PAAS (0.66) and APCS (0.68) for shale (average 0.63) and grey sandstone (average 0.62), but lower for red sandstone (0.59) with prominent negative anomalies. The [La/Yb]N of shales (average 9.67) of CFS is comparable to PAAS (9.7), red sandstone (average 5.57) is depleted than PAAS and grey sandstone (average 10.43) of CFS is enriched than PAAS. Similar behaviour of [Gd/Yb]N values of shales (average 1.33), red sandstone (average 1.20) and grey sandstone (average 1.42) is also observed.
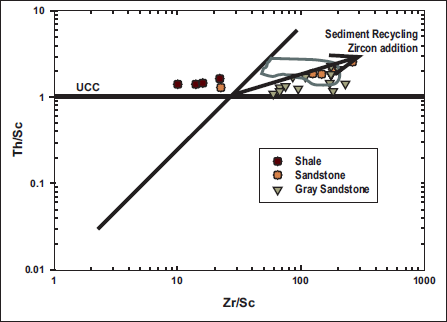
Zr/Sc vs Th/Sc diagram show the sediment recycling and zircon addition of Shales, Red Sandstone and Grey Sandstone of LKS/CFS. The encircled area is of LKS of Son Valley.
The total REE of Lower Kaimur Sandstone of Son Valley (30–242 ppm) is more than CFS (47.3–120 ppm). The LREE of CFS (43–105 ppm) is marginally depleted compared to the LKS of Son Valley (26–152 ppm), whereas the HREE (4.5–18 ppm) is similar. The LREE/HREE and the [La/Yb]N of CFS (6–9.7, 5.5–10.4, respectively) are less than the LKS of Son Valley (7.5–14, 7.4–18.7, respectively), which shows that the REE of LKS of Son Valley is more fractionated than CFS.
IMPLICATIONS FROM GEOCHEMISTRY OF CFS SEDIMENTS
Recycling and source area weathering of CFS (Rajasthan)
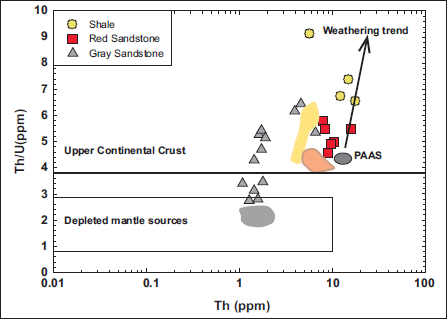
The ratios Th/Sc and Zr/Sc are important indicators of heavy-mineral concentration that remain unaffected during sediment recycling (McLennan et al., 1993). In the Th/Sc versus Zr/Sc diagram (Figure 9), the red and grey sandstone of CFS have deviated from the original compositional tendency of the source rock (Figure 9). The value Zr/Sc ratio increases during sediment recycling as the zircon gets concentrated, which causes zircon enrichment/addition. This deviation from the compositional trend suggests a felsic provenance for these sandstones. The shales of CFS have not deviated and are characterised by an unrecycled UCC composition. The lowermost shale of the CFS has low Zr/Sc concentrations and does not show signs of any zircon addition/sediment recycling. They exhibit points parallel to the compositional trend, with the least control of heavy-mineral sorting. Most of the grey sandstone of CFS is closer to the UCC (Th/U = 3.8) (McLennan et al., 1980, 1993), which suggests a recycling history (Figure 10). The red sandstone has values close to the PAAS, while the shale follows the weathering trend. In the Th/Sc vs Zr/Sc diagram, all the samples of the Lower Kaimur Group of Son Valley deviated from the original compositional tendency of the source rock. The plot (Figure 10) shows that all the LKS in Son Valley underwent recycling, unlike CFS.
REE diagram of Shales, Red Sandstone and Grey Sandstone of CFS and its comparison with APCS and PAAS.
The Th vs Th/U plot for the Shales, Red Sandstone and Grey Sandstone of CFS. Grey patch is of Sasaram Sandstone, Yellow patch is of Ghurma Shale and red patch is of Markundi Sandstone from the LKS of Son Valley.
The processes of chemical weathering and diagenesis convert unstable minerals, such as plagioclase, into clay minerals, including kaolinite, illite, and montmorillonite (McLennan et al., 1993). In the CFS, the CIA values of lowermost shales, red sandstones and topmost grey sandstones are on average 71.91, 76.94 and 80.93, respectively (Table 3). For the LKS in the Son Valley, the lowermost SS, GS, and the uppermost MS are about 79, 75, and 80, respectively, indicating that the source areas of CFS, Rajasthan, and LKS, Son Valley, experienced similar moderate weathering (Table 3). Average Plagioclase Index of Alteration (PIA) values of CFS range from 92 to 95, and in the Son Valley LKS, they range from 85 to 98, which indicates extreme destruction of plagioclase and its complete conversion into secondary aluminous clay minerals such as kaolinite, illite and gibbsite (Fedo et al., 1995). The values of CIA and PIA of shales (average 71,91), red sandstone (average 76,94) and grey sandstone (average 80, 93) of CFS suggest moderate to extreme chemical weathering (Table 3).
Nesbitt and Young (1982, 1984) proposed Al2O3- (CaOsil + Na2O) - K2O (A-CN-K) ternary plot to assess and quantify the extents of chemical weathering or palaeo-weathering in the sediment source rock. On weathering, the samples plot along the A-K boundary (Figure 11) in the A-CN-K diagram. If the removal of K (K2O) is relatively more than that of Al (Al2O3), the samples plot near the A apex (Fedo et al., 1995). Close to the A apex, the biotite, muscovite and illite minerals are formed due to progressive depletion of K-feldspar and other unstable minerals. With further weathering, they finally alter to kaolinite, gibbsite and chlorite. The shale, red sandstone and grey sandstone of CFS clusters are almost near the illite. Therefore, the parent rock of shale and red sandstone has undergone moderate weathering. They show a similar extent of weathering because they are derived from the same source under similar climatic conditions or from different sources with similar climatic conditions
A-CN- K plot showing extent of weathering for Shales, Red Sandstone and Grey Sandstone of CFS. Grey patch is of Sasaram Sandstone, Yellow patch is of Ghurma Shale and red patch is of Markundi Sandstone from the LKS of Son Valley.
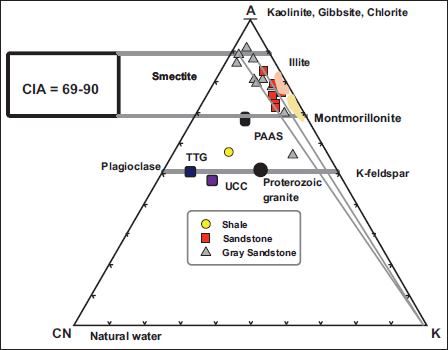
In the Son Valley, the LKS sediments record CIA values ranging from 75 to 82, and in the A-CN-K diagram, their plot ranges from 72 to 85. The differences in values are due to post-depositional K-metasomatism. Therefore, the source rocks of CFS and Son Valley have similar extents of chemical weathering.
Tectonic settings of CFS
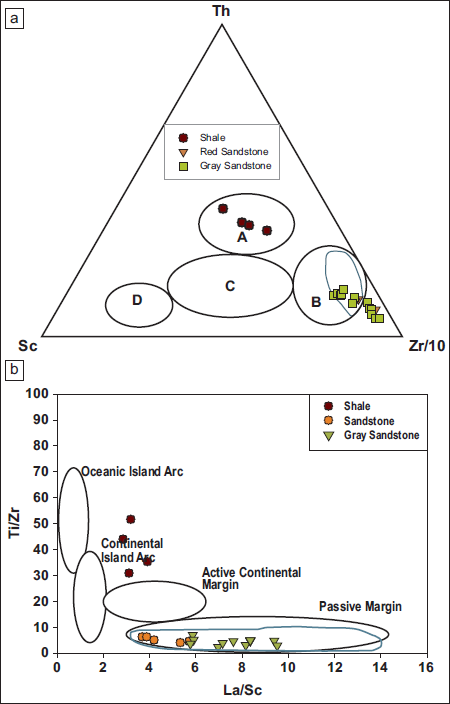
The major and trace element composition of clastic sedimentary rocks helps to understand the tectonic setting of the depositional basin (Bhatia & Crook, 1986; Roser & Korsch, 1986, 1988). In the Th-Sc-Zr/10 diagram (Bhatia & Crook, 1986), the shale samples of CFS dominantly fall in the zone of active continental margin setting, and the red and grey sandstones both fall in the passive margin setting (Figure 12a). The bivariate plots of La/Sc-Ti/Zr (Bhatia & Crook, 1986) also depict the same behaviour (Figure 12b). In the Son Valley, the SS, GS and MS all fall in the passive margin field.
a. Tectonic setting discrimination diagram for LKS in Rajasthan. In the Th-Sc-Zr/10 A is Active Continental Margin, B is Passive Margin, C is Continental Island arc, and D is Oceanic-Island arc. The blue boundary is of the LKS in Son Valley; b. Tectonic setting discrimination diagram for LKS of Rajasthan. In the La/Sc vs Ti/Zr (Bhatia & Crook, 1986). The blue boundary is of the LKS in Son Valley.
Provenance and source rock composition of CFS
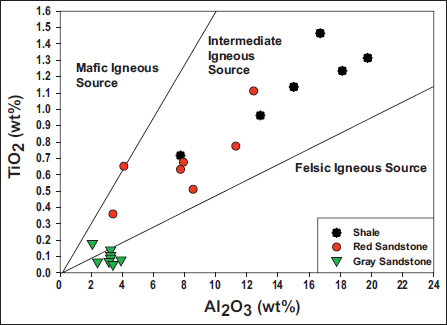
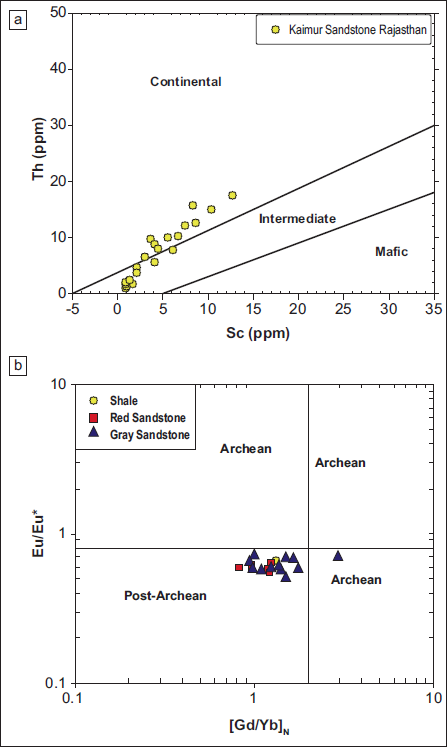
Al and Ti in the form of oxides and hydroxides have low solubility in aqueous solution and are considered immobile elements (Wesolowski, 1992). Therefore, the value of their ratios must be very close to the value of the source. If the Al2O3/TiO2 ratio value is less than 8, then it is a mafic source rock, and values in between 8 and 21 are considered a signature for an intermediate igneous source rock; an Al2O3/TiO2 ratio greater than 21 implies a felsic igneous source rock (Hayashi et al., 1997). The TiO2 versus Al2O3 diagram (Figure 13) and Al2O3/TiO2 ratio value of shale (avg = 13.3) and red sandstone (avg = 11.7) of CFS show intermediate igneous (or mixed felsic-mafic) source origin. In contrast, felsic source rock is identified in most grey sandstone samples (avg = 37.6). As mentioned earlier, trace elements like Th, La, Sc, Cr, Co, Ta, Ni, Zr, Hf and Nb are considered immobile during sedimentary processes (Bhatia & Crook, 1986; Condie, 1993; Taylor & McLennan, 1985) and have been extensively used to determine the source composition of the sediments. La and Th are more concentrated in silicic rocks than elements like Co, Sc, Ni, and Cr, which are primarily found in mafic rocks. The Th vs Sc plot of CFS shows a range of continental-to-intermediate compositions (Figure 14a). Sediments with pronounced negative Eu anomalies < 0.85 and GdN/YbN ratio < 2.0 record characteristic values of the post-Archean period (Taylor & McLennan, 1985). In the diagram of [Gd/Yb]N versus Eu/Eu*, all the samples of CFS fall in the post-Archean zone (Figure 14b). Therefore, the CFS of Rajasthan is derived from a post-Archean continental-to-intermediate compositional source. The idea is also corroborated by Th/Sc, La/Sc, La/Co, Co/Th, [La/Lu]N and Eu/Eu* values of shales, red sandstone and grey sandstones of CFS (Table 4).
Al2O3 vs TiO2 diagram that shows the provenance of Shales, Red Sandstone and Grey Sandstone of CFS.
a . Th vs Sc diagram to show source rock composition of CFS of Rajasthan (McLennan et al., 1993); b . Eu/Eu* vs (Gd/Yb)N plot shows the post-Archean age source rock for CFS Various fields are after Taylor and McLennan (1985) and Slack and Stevens (1994).
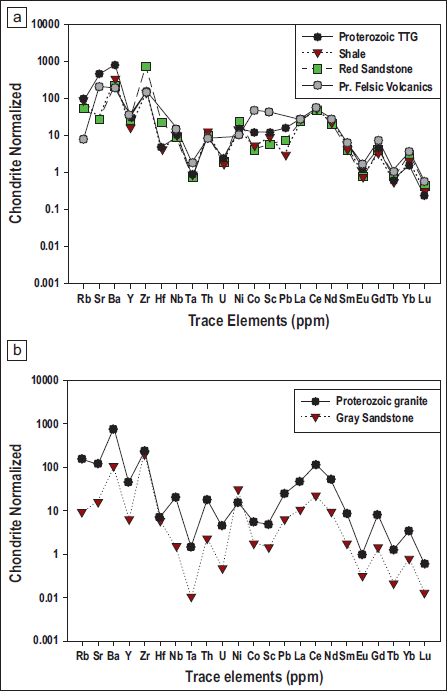
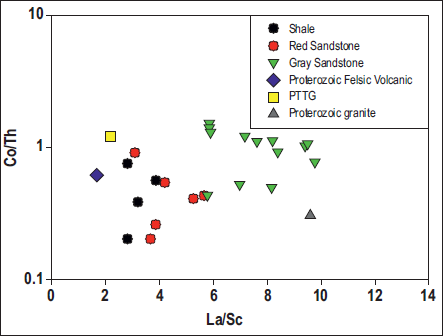
Therefore, it can be assumed that the source for the CFS is probably of mixed character (Proterozoic granite + Proterozoic TTG (tonalite-trondhjemite-granodiorite) + Proterozoic felsic volcanics). To determine the exact source rock composition, the average immobile trace element compositions of the shale, red sandstone, and grey sandstone of the CFS of Rajasthan were compared with those of the Proterozoic felsic volcanics, TTG, and granites. In the multielement diagram, the chondrite-normalised patterns of shale and red sandstone show a near-comparable signature with felsic volcanics and TTG (Figure 15a). In a trace multielement (Chondrite-normalised, REE) diagram, the grey sandstones of CFS are comparable to Proterozoic granite (Figure 15b). The CFS samples are plotted in the La/Sc versus Co/Th diagram, the shales and red sandstone cluster close to the average. Proterozoic felsic volcanic and Proterozoic TTG, whereas the grey sandstone clusters close to Proterozoic granite (Figure 16). Therefore, the stratigraphically lower part of the CFS (shale and red sandstone) has derived its sediments from a Proterozoic TTG + felsic volcanic source. In contrast, the upper CFS (grey sandstone) were primarily derived from Proterozoic granites.
a. The multielement trace element diagram showing Shale and Red Sandstone of the CFS are comparable to Proterozoic TTG and Felsic Volcanics; b. The multielement trace element diagram showing Grey Sandstone of the CFS is comparable to Proterozoic granite.
La/Sc vs Co/Th plot shows that the values of Shale and Red Sandstone are comparable to Felsic Volcanic Rock and PTTG, while Grey sandstone has values comparable to Proterozoic Granite.
The detailed provenance of the LKS of Son Valley has been discussed in Sen and Mishra (2020). The LKS is mostly derived from the Proterozoic Granite and Proterozoic PTTG (Sen, 2010).
DISCUSSION AND CONCLUSION
Hindoli Belt and Berach granite as a source of CFS
Based on the palaeocurrent direction, Prasad (1984) considered the source for the CFS in the west of the basin. Raza et al. (2012) suggested that the Kaimur sandstone from the Chittorgarh area (CFS) was composed of 40% granitic gneiss and about 20% TTG, with mafic enclaves derived from the Berach granite. The U-Pb data of detrital zircons from the Kaimur Group (CFS), Chittorgarh, reveal age peaks between ∼1.2 and ∼1.6 Ga, suggesting the Delhi Group of rocks as a possible sediment source (McKenzie et al., 2013). According to Turner et al. (2014), there is a complete absence of detrital zircons younger than 1000 Ma in the Vindhyan sequence. They compared the Upper Vindhyan sequence with the Marwar Supergroup, previously known as the Trans-Aravalli Vindhyan (Sastry & Moitra, 1984), and found a distinctly different detrital zircon population. Recent studies show that the deposition of the Marwar Supergroup commenced in post-Malani (~735 Ma) time, indicating a different age of sedimentation from the Upper Vindhyan (Xu et al., 2022). Isotopic studies (Shukla et al., 2019) done in this area have also shown that the Vindhyan sediments of Rajasthan were derived from the west and south-west of the basin, that is, from the Aravalli Mountain ranges. According to Basu et al. (2021), the Delhi Belt Granitoids of 1.6 Ga are considered the major source of sediments during the deposition of CFS (Lower Kaimur Sandstone of Rajasthan).
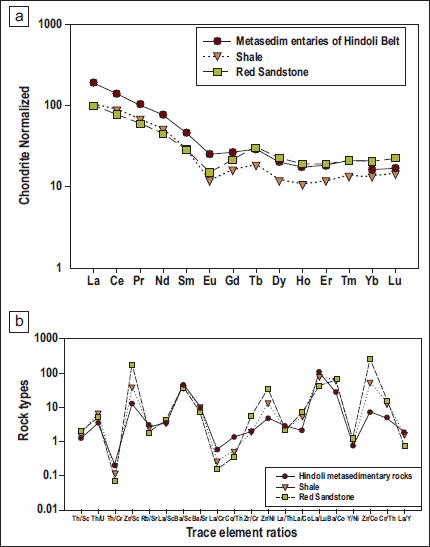
Based on the previous and present studies, the geochemical data for CFS (shale, red sandstone, and grey sandstone) were compared with the geochemistry of the immediate neighbours, that is, the Hindoli belt and the Berach granite (BGC). The average geochemical data for the Hindoli metasediments were taken from Saxena and Pandit (2012), and for the Hindoli volcanics from Raza and Siddique (2012), respectively. The geochemical data for Berach granite were obtained from Raza et al. (2010). The chondrite-normalised REE pattern of shale and red sandstone of CFS is nearly comparable with the REE of the metasedimentaries of the Hindoli belt (Figure 17a). Although the LREEs are enriched in metasedimentary rocks compared to CFS shale and red sandstones, the HREEs of the two are nearly identical. Similarly, when the REE data of shale and red sandstone were compared with the chondrite-normalised REE data from the Hindoli volcanics, the LREEs of Hindoli are comparable with both red sandstone and shale. At the same time, the HREEs are comparable only with the red sandstones of CFS. The trace element ratios from the CFS were found to be very comparable to those of the Hindoli metasedimentary rocks (Figure 17b). Therefore, it is suggested that the shale and red sandstone are primarily derived from the Hindoli belt. This is also evidenced by the presence of metamorphic (Chlorite, etc.) and volcanic lithics observed in these rocks during thin-section study.
a . REE chondrite normalised plot of Shale and Red Sandstone and its comparison with Hindoli metasedimentary rocks and the Hindoli Volcanics; b . Multielement trace element ratio diagram show the Shale and Red sandstone are comparable to Hindoli metasedimentary rocks.
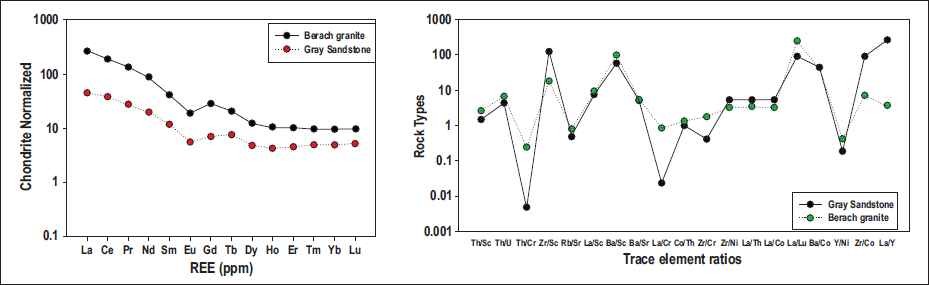
The chondrite-normalised REE plot of the grey sandstone of the upper CFS is comparable to that of Berach granite, which lies west of the CFS (Figure 18a), except for their absolute concentrations. Also, the incompatible trace element ratios are comparable to those of the Berach granite (Figure 18b). Possibly, the trace and REE elements have been diluted due to excessive quartz content (cf. Raza et al., 2012). The presence of orthoclase and plutonic clasts observed during the petrographic study also supports the Berach granite as a possible source.
a . Chondrite Normalised REE plot showing the Grey sandstone of LKS is comparable to the Berach Granite, b . The multielement trace element diagram shows the Grey sandstone of LKS comparable to the Berach Granite.
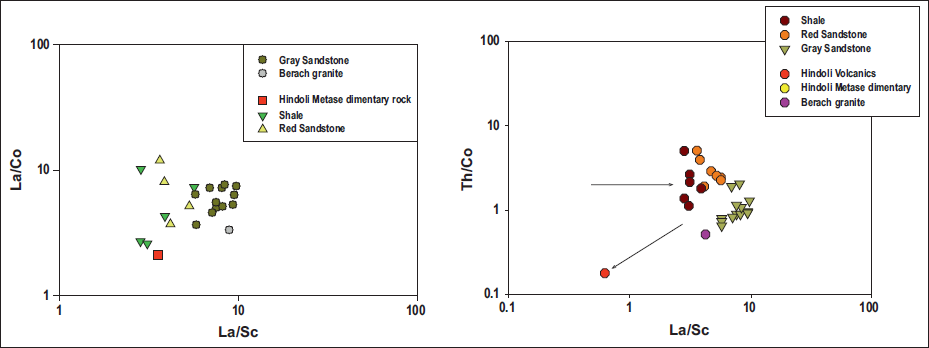
Using La/Sc and La/Co values from CFS, Rajasthan, we find that shales and red sandstone (lower CFS) have compositions similar to those of the Hindoli belt, while the grey sandstone (upper CFS) cluster is close to the Berach granite (Figure 19a). The idea is also supported by La/Sc and Th/Co diagrams of samples from CFS: samples from shale and red sandstone cloud near the Hindoli metasediments, and samples of the grey sandstone are close to the Berach granite composition, implying their respective sources (Figure 19b).
a . La/Sc vs La/Co diagram shows that the Shale and Red Sandstone have values comparable to Hindoli metasedimentary rocks, while Grey Sandstone to Berach granite; b . La/Sc vs Th/Co diagram shows that the Shale, Red Sandstone and Grey Sandstone have values closer to Hindoli metasedimentaries and Berach granite.
The Hindoli belt contains metamorphosed siliciclastic sediments with volcanic rocks of mafic and felsic composition (Malhotra & Pandit, 2000; Raza & Siddique, 2012) and was deposited in the subduction process in a continental arc setting (Raza & Siddique, 2012). The sediments for the upper part of the CFS were derived from the Berach granite. The Berach granite covers an extensive area in the west of Chittorgarh in Rajasthan (Roy & Jakhar, 2002). Indeed, palaeocurrent measurements from the CFS depict a dominant detrital supply from northwest and southwest (Hasan, 2019); whereas, the Berach granite is to the west and southwest, the Hindoli Group of rocks is exposed in the north.
In the Son Valley, the lowermost SS of the LKS consists of 82% contribution from the Bundelkhand granite and 18% from the Chhotanagpur Granite Gneissic Complex (CGGC). The GS is composed of 76% contribution from the Bundelkhand granite and 24% from the CGGC. The uppermost MS of the LKS is composed of 65% Bundelkhand granite and 35% from the CGGC (Sen, 2010; Sen & Mishra, 2020). Therefore, it is established that the source rocks for the CFS of Rajasthan and the LKS of the Son Valley are distinct, and contributions from local sources have played a significant role in different sub-basins of the Vindhyan.
Tectonic Evolution
The Vindhyan basin of Rajasthan is sandwiched between the GBF in the west and the Bundelkhand granite in the east. During 2.4–2.6 Ga, the Bundelkhand Craton (BC) collided with the Aravalli Craton (AC) with plausible subduction of the BC along the margin of the AC (Ghosh et al., 2022; Mishra et al., 1999 and references therein). The subduction process is manifested by the occurrence of intrusions of the Berach, Jahazpur, Untla, Gingla and Ahar River granites along the margin of the AC (Ghose et al., 2022; Roy & Jakhar, 2002 and references therein). The Berach granite represents the terminal cratonisation history in this region (Kaur et al., 2016; Meert et al., 2010). The deposition of the Vindhyan sediments was post the amalgamation of the Bundelkhand and AC (Figure 20A).
Tectonic model showing the origin of the Lower Kaimur Sequence (Vindhyan Basin), Rajasthan and the preceding events, modified after the tectonic model on the evolution of the Aravalli Delhi Fold Belt (Ghosh et al., 2022).
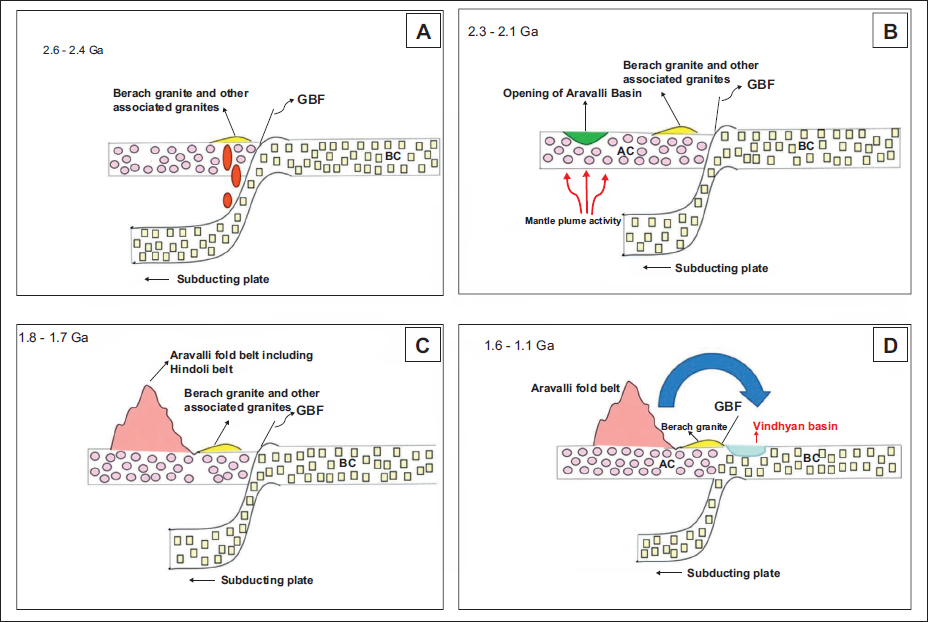
After the stitching of the two cratons, the region was subjected to compressional and extensional stresses and a linear gravity high was observed in the AC (Mishra et al., 1999). This might be due to mantle plume activity that led to the emplacement of mafic and felsic volcanics (Figure 20B). The occurrence of extensive magmatism and metamorphism at 1.8 Ga (Figure 20C) marked the onset of the Aravalli Orogeny (D’Souza et al., 2020). The Hindoli belt of 1.8 Ga (Deb & Thorpe, 2004; Deb et al., 2002) belong to the Aravalli Fold Belt (Fareeduddin & Banerjee, 2020; Ghosh et al., 2022; Roy & Jakhar, 2002) and was formed prior to the initiation of Vindhyan sedimentation at ~ 1.6 Ga (Figure 20D) in the form of an intracratonic rift (Mishra et al., 1996). Due to the continued tectonism, the shales of CFS depict an active continental margin signature.
In the Son Valley area, the deposition of sediments in the Vindhyan basin took place after the collision of the Bundelkhand and Bastar cratons, and by continent-continent collision between the two and their stitching at ~1.5 Ga (Roy & Prasad, 2003; Yedekar et al., 1990). The Bundelkhand granite to the north of the Vindhyan basin underwent domal uplift, as evidenced by the emplacement of dyke swarms (Sen & Mishra, 2020, and references therein), which continued until the deposition of the LKS in the Son Valley.
Possible interbasinal linkage between Rajasthan and Son Valley sectors
In the Son Valley, the Lower Kaimur is a fining-upward sequence that conformably overlies the Rohtas Limestone. In contrast, in Rajasthan, the CFS is a coarsening-upward sequence that overlies the Suket Shale. The CFS contains volcanic lithics, indicating input from a mafic source, which is absent in the LKS of the Son Valley. Heavy minerals, such as zircon grains, are abundant at lower stratigraphic levels in CFS, unlike in the LKS of the Son Valley. In Rajasthan, the CFS is geochemically classified as shales, sublitharenites and litharenites, unlike the dominant quartz arenites in the LKS of Son Valley. The Lower Kaimur sandstones in the Son Valley as a whole confirm a passive margin tectonic setting, whereas the CFS is deposited in an active setting related to the reactivation of the GBF.
The present study asserts that the lithounits deposited in different parts of the large intracratonic Vindhyan basin cannot be considered as isochronous, though they may be lithologically similar. The physical continuity between Rajasthan and the Son Valley area has not yet been established. The GBF marks the boundary for the Vindhyans in the Rajasthan sector, and the CITZ demarcates the southern Vindhyan boundary in the Son Valley. The Aravalli Mobile Belt (GBF) marks the collision zone between the Aravalli and the BC in northwest India, and the CITZ marks the collision zone between the Bundelkhand and the Bastar craton in Central India. These mobile belts have different physical properties, structures, and geophysical signatures (Mishra et al., 2000), as well as different ages. The two collisional events were not synchronous. There has been a marked difference in the orientation of the basement ridges of the Vindhyan in the Son Valley and Rajasthan, which implies that they were deposited in different tectonic frames (Bose et al., 2015). Based on the present study, it is inferred that the CFS of Rajasthan and the LKS of the Son Valley were probably deposited in different tectonic frames and at different ages, and hence in separate contemporary basins. The present study thus warrants further study in the Rajasthan Vindhyan basin to identify compatibility with the Son Valley Vindhyan.
Footnotes
Acknowledgement
SS is grateful to the Department of Science and Technology (DST) for rendering support under the Women Scientist Scheme (project no. DST/WOS-A/EA-7/2020). SS is thankful to Dr Keshav K Aradhi and Dr M. Satyanarayanan for the analyses of the samples. The authors are grateful to the anonymous reviewers for their valuable comments and suggestions, which have greatly helped improve the manuscript.
Declaration of Conflicting Interests
The authors declared no potential conflicts of interest with respect to the research, authorship and/or publication of this article.
Funding
The authors disclosed receipt of the following financial support for the research, authorship and/or publication of this article: It is acknowledged that the funding support provided under the Women Scientist Scheme (project no. DST/WOS-A/EA-7/2020), Department of Science and Technology (DST), Government of India, for carrying out the research, as well as for the preparation and publication of this manuscript (project no. DST/WOS-A/EA-7/2020).