
Abstract
Objective:
We examined whether miR-21-5p activates the PI3K/AKT/mTOR signaling pathway, thereby inhibiting autophagy and apoptosis induced by H2O2 in AEC II cells.
Introduction:
MicroRNA and autophagy play crucial roles in important biological processes during hyperoxia-induced acute lung injury. Located on chromosome 17q23.1, miR-21-5p, as a critical component of the miRNAs family, significantly contributes to the regulation of cell growth, apoptosis, and autophagy. However, the underlying mechanism through which miR-21-5p suppresses H2O2-induced autophagy and apoptosis of primary AEC-II in vitro remains to be fully elucidated.
Methods:
To investigate the regulatory role of miR-21-5p in autophagy, primary type II alveolar epithelial cells (AEC-II) were isolated from rat lung tissue and subjected to 0.5 mmol/L H2O2 in a cell culture environment to simulate hyperoxia-induced acute lung injury. Cell viability was detected by cell counting Kit 8. Reactive oxygen species and apoptosis were detected by flow cytometry. Autophagy levels in AEC-II were evaluated by autophagic double marker method. The expressions of apoptosis and autophagy related proteins were detected by Western blotting.
Results:
We found that in the process of H2O2 injury of AEC-II, the level of autophagy flow was up-regulated and the expression of miR-21-5p was down-regulated. Overexpression of miR-21-5p can significantly reduce the level of autophagy flow, inhibit apoptosis, and activate the AKT/mTOR signaling pathway.
We pretreated with rapamycin, an mTOR inhibitor, to block the biological effects of miR-21-5p. In addition, pretreatment with MHY1485, an mTOR activator, inhibited AEC-II autophagy flow levels and increased apoptosis.
Conclusion:
In summary, miR-21-5p can inhibit H2O2-induced AEC-II apoptosis and autophagy flow, which is partially mediated by the AKT/mTOR signaling pathway.
MiR-21-5p could be used as both a clinical biomarker and a promising molecular target in patients with HALI.
Keywords
Introduction
Hyperoxia-induced actue lung injury (HALI) is a major complication of oxygen therapy in the treatment of critically ill patients. The main pathogenic factors of HALI are hyperoxia-induced alveolar epithelial cells (AEC) and pulmonary vascular endothelial cells injury, 1 and then alveolar structure damage, pulmonary capillary leakage and hyaline membrane formation, which will eventually progress to acute respiratory distress syndrome (ARDS) in adults and bronchopulmonary dysplasia (BPD) in infants. 2 The overall incidence of HALI in ICU patients is approximately 12%–18%, and it exhibits a positive correlation with the duration of high-oxygen exposure. 3 The mortality rate was 35%–40%. 4 At present, the treatment of HALI is limited to prevention and symptomatic supportive treatment, and there are no effective means. Therefore, effective strategies of treatment are urgently needed to improve prognosis and reduce mortality of patient.
Autophagy is great significance in the physiological process of cells, including the removal of misfolded protein and damaged organelles, so as to maintain the balance of cell metabolism and relieve the stress of cells. Under stress conditions, autophagy can promote cell survival.5,6 However, excessive autophagy will degrade basic proteins or organelles to promote cell death, 7 so the biological effects of autophagy have two sides. For example, in the early stage of tumors, autophagy delays tumor progression by maintaining genome integrity and inhibiting inflammation, 8 while in advanced stages, autophagy promotes the degradation of MHC-I on the surface of cancer cells to facilitate immune evasion, which is not good for patients.9,10 Studies have shown that the autophagy of lung tissue and AEC-II of newborn mice will be up-regulated under hyperoxia exposure conditions. 11 This degradative autophagy has a protective effect, which can limit the death of alveolar epithelial cells.12,13 In addition, 8-oxoguanine-DNA glycosylase can activate autophagy-related protein 7 (ATG7) to repair DNA and regulate autophagy to reduce hyperoxia-induced alveolar epithelial cell injury. 14 It holds immense importance to investigate the regulation of autophagy in order to prevent and treat lung injury.
miRNA plays an important role in growth, apoptosis and autophagy.15 –17 In our previous study, miR-21-5p is low level in H2O2-induced AEC-II, which is involved in the apoptosis process of AEC-II. 18 miR-21-5p can target PTEN/PI3K/AKT pathway to inhibit AEC-II apoptosis and reduce HALI.18,19 But the mechanism of PI3K/AKT signaling pathway regulating AEC-II apoptosis in HALI has not been explored. Studies have shown that miR-21-5p can target the PTEN/AKT signaling pathway to inhibit autophagy and apoptosis. 20 Nevertheless, all previous experiments were conducted using cell lines, and there is a lack of reports on studies involving primary cells. The subsequent alterations in primary cells are crucial for disease research, therefore, this study investigates whether miR-21-5p can inhibit the apoptosis and autophagy of primary AEC-II under hyperoxic conditions. This may yield more valuable insights for the prevention and provide a new theoretical basis for the clinical treatment of HALI in the future.
Materials and methods
Animal and reagents
This study was approved by the Animal Ethics Committee of the Zunyi Medical University, China (permit#: [2021]2-218). The SPF male Sprague-Dawley (SD) rats were obtained from the Tianqin Biotechnology Company (Changsha, Hunan, China), license number: SCXK (Hunan) 2019-0014, all raised in the SPF laboratory of the Biological Research Center of Zunyi Medical University. The rats were maintained at 18–22°C, a relative humidity of 50%–60% and a 12 h light/dark cycle with free access to rat chow and water. Fetal bovine serum, trypsin and collagenase type I were purchased from the GIBCO Company (USA). The lentiviral vectors of miR-21-5p were purchased from Hanbio Biotechnology (Shanghai, China). The LC3B, p62, c-caspase-3, Bcl2, Bax, PTEN, p-AKT, mTOR, Phospho-mTOR, β-actin and goat anti-rabbit secondary antibodies were purchased from Cell Signaling Technology (USA).
Cell culture
The isolation of AEC-II was performed based on the previous studies.21 –23 SD rats were anesthetized via intraperitoneal injection of 2% pentobarbital sodium (50 mg/kg). Subsequently, the thoracic cavity was carefully opened, and the lung was promptly excised and placed into sterile Petri dishes for further processing. The lung tissue was digested using a solution containing 0.20% pancreatic enzyme and 0.1% type I collagenase for 15 min. The enzymatic digestion was subsequently terminated by adding medium supplemented with 0.015% DNase I. The lung tissue was sectioned into a 1 mm 3 mesh, followed by centrifugation at 377g for 5 min. Subsequently, the cells were transferred to a culture dish containing rat IgG and incubated at 37°C for 1 h. Then, the cells were inoculated and cultured for 48 h, after which they were collected for further experimentation. The purity and survival rates of isolated cells were >90%, indicating that isolated cells could be used for further experiments. We have previously achieved successful simulation of hyperoxia exposure by utilizing 500 mM H2O2. 23
Immunofluorescence
AEC II were cultured in a six-well plate with pre-existing cell slides. When AEC II are 50% full of the slide, the cells removed the medium and washed with PBS twice.
After formaldehyde fixation and BSA treatment, the cells washed with PBS twice. The cells were applied with SP-C (1:250, Absin Biotechnology Company, Shanghai, China) antibody and placed in a humid chamber at 4°C overnight. In the dark at room temperature, the cells were stained with the secondary antibody. Finally, the cell slide was observed and photographed under a fluorescence microscope.
Transmission electron microscopy (TEM)
There are two parts of this experiment that require TEM. First, the unique ultrastructural osmophilic lamellar bodies and microvilli of AEC-II were observed by transmission electron microscope. Second, autophagosomes and autophagolysosomes can be detected by TEM. 24 The cells were washed with phosphate buffers and then immobilized with electron microscope fixative at 4°C for 12 h. After dehydration in an ethanol solution, the cells were encased in epoxy resin. Samples were sliced and stained with uranyl acetate and lead citrate, then examined under a transmission electron microscope (HT7700, HITACHI, Japan).
CCK-8 assay
Primary AEC-II cells were extracted and inoculated into 96-well plates with 2–3 × 10³ cells/plate. After the simulated hyperoxic exposure was completed, the cells were treated with CCK-8 solution. Cell viability was tested with the cell count kit-8 (Solarbio Life Science Company, Beijing, China).
DCFH-DA (2′,7′-dichlorodihydrofluorescein) fluorimetry
The concentration of reactive oxygen species (ROS) was determined using a flow cytometer (Beckman Coulter, USA). The relevant detection was performed using a commercial ROS assay kit (Invitrogen, Thermo Fisher Scientific, USA).
MicroRNA transfection
The extracted primary AEC-II were plated in Petri dish (6 cm) plates at 2 × 10⁵ cells/plate and cultured overnight. Then, the cells were transfected with the overexpression lentiviral vector of miR-21-5p or a negative control miRNA using culture medium containing polybrene (2 μg/mL), according to the protocol.
Real-time PCR
Total RNA was extracted from the AEC-II using Trizol (Takara Bio, Beijing, China) reagent according to the manufacturer’s protocol (Invitrogen Life Technologies). The forward and reverse primers sequences for miR-21-5p were as follows: 5′-CCGGCTAGCTTATCAGACTGATGTTGA-3′ and 5′-CTCAACTGGTGTCGTGGA-3′. The forward and reverse primers sequences for U6 were as follows: 5′-CTCGCTTCGGCAGCACA-3′ and 5′-AACGCTTCACGAATTTGCGT-3′. The PCR was performed on Bio-Rad CFX96 thermocycler (Bio-Rad, USA). miRNA expression levels were finally normalized to the U6 with the 2−ΔΔCt method.
Western blotting
Total protein was extracted from AEC-II after different treatments by using lysed buffer (Tissue/cell lysate: PMSF: Phosphorylated protease inhibitor = 1:1:1) on ice. Extracted sample protein were resolved on SDS-PAGE gels and transferred to PVDF membranes. These membranes were treated with blocked and incubated antibodies and quantified using an chemiluminescence-Western blotting detection system (Bio-Rad, USA).
MRFP-GFP-LC3 adenovirus transfection
The extracted primary AEC-II were plated in six-well plates at 2 × 10⁵ cells/plate and cultured overnight and transfected with the autophagic LC3 double-labeled adenovirus using culture medium containing 10% FBS for 6 h, according to the manufacturer’s protocol. The culture medium was replaced by new after 6 h, and the status of infection was observed by confocal microscope at 48 h.
Detection of early apoptotic cells with flow cytometry (FCM)
The AEC-II were collected and resuspended in PBS. After centrifugation, the supernatant was discarded, and 100 μL of 1× binding buffer was added to each sample. The apoptosis detection kit (BD, Shanghai, China) was utilized following the experimental protocol and stained with 0.5 μL Annexin V-FITC/0.5 μL PI at room temperature for 15 min. Subsequently, the samples were analyzed using flow cytometry (Beckman Coulter, USA). Unstained cells were used to establish background fluorescence levels, serving as a negative control. FSC and SSC gates were utilized to select large, highly granular cells while excluding small debris fragments. FITC-conjugated Annexin V, PE-conjugated PI, Annexin V binds to phosphatidylserine, and PI is used for detecting cell membrane integrity. Therefore, living cells are characterized as Annexin V-negative/PI-negative, early apoptotic cells as Annexin V-positive/PI-negative, and late apoptotic or necrotic cells as Annexin V-positive/PI-positive. On a scatter plot, the horizontal axis represents Annexin V staining, while the vertical axis represents PI staining. The plot is divided into four quadrants: D3 indicates living cells, D4 corresponds to early apoptosis, D2 signifies late apoptosis or necrosis, and D1 corresponds to necrotic cells with entirely compromised cell membranes. The number of events were 50,000 cells.
Statistical analysis
SPSS 29.0 statistical software was used for data analysis. Graphpad prism 9.0 was used to draw statistical graphics. The data were presented as the means ± standard deviation and analyzed using independent-samples t-test or one-way analysis of variance followed by the Least Significant Difference post-hoc test for multiple comparisons. *p < 0.05, **p < 0.01, ***p < 0.001, nsp > 0.05. p < 0.05 was considered to indicate a statistically significant difference.
Results
Identification of AEC II
First, the primary AEC-II cells were extracted and cultured. An inverted phase-contrast microscope was used to observe cells morphology. When the cells were cultured for 24 h, the cells adhered to the bottom of petri dish and grew like islands. During 24–48 h, the cells began to extend to the periphery. The cell adhesion rate could reach more than 95% at 48 h (Figure 1(a)). Next, we used immunofluorescence and TEM to appraise AEC-II. We used immunofluorescence microscope to observe specific protein of AEC-II which SP-C was mainly distributed in the cytoplasm and cell membrane (Figure 1(b)). We also used TEM to observe the unique ultrastructure of AEC-II: microvilli and osmophilic lamellar bodies (Figure 1(c)). These show that the extracted cells are AEC-II.

Cultivation and identification of AEC II. The primary AEC-II was extracted and identified by immunofluorescence and TEM. (a) When the extracted primary AEC-II cells were cultured to 0 h, 24 h, and 48 h, we used light microscope to observe the cell morphology (bar = 250 μm). (b) When the cells were cultured to 48 h, we used immunofluorescence to identify AEC-II (bar = 25 μm). (c) When the cells were cultured to 48 h, we used TEM to identify AEC-II (bar = 2 μm). The red arrow points to the osmophilic lamellar bodies, the blue arrow points to the microvilli.
Changes of autophagic flux in AEC II after H2O2 stimulation
In order to verify whether the autophagic level in AEC-II changes after H2O2 treatment. We used WB to detect the expression levels of LC3 and p62 (Figure 2(a)). As shown in Figure 2(b), compared with the 0 h group, the expression of LC3-II/I was up-regulated at each time point, which is a reliable indicator of autophagy. 25 Comparing each time point in pairs, the expression of LC3-II/I was the highest in the 2 h group, and there was no difference in the expression of LC3-II/I at 4 h, 8 h, and 12 h. Figure 2(c) shows that the expression of p62 was the lowest at 2 h and the highest at 8 h. These data indicate that the primary AEC-II can be successfully induced to show dynamic changes of autophagic level after H2O2 treatment. Among them, p62 as an autophagy adaptor protein, 26 most obviously accumulates at the 8 h. Autophagy at 8 h is considered to be an insufficient form of autophagy as previously reported and this form of autophagy can exacerbate damage. 11 So the subsequent experimental modeling time is set at 8 h. As shown in Figure 2(d), we observed that cell viability was decreased in the H2O2 group compared with control group. We assayed the levels of ROS was up-regulated in AEC-II compared to the control group (Figure 2(e)). Autophagy dual-labeling system was used to evaluate the level of autophagy in cells. Figure 2(f) and (g) show that the number of autophagosomes and autophagolysosomes in the H2O2 group increased, compared with the control group. In addition, the autophagy vacuoles and autophagosomes in AEC-II were observed by transmission electron microscopy (Figure 3(a)).

H2O2 treat can activate autophagy level of AEC-II and reduce cell viability, AEC-II treated by H2O2 can induce autophagy and the optimal time is at 8 h. (a) Western blot was used to detect the expression level of p62 and LC3 protein of AEC-II in different time (n = 3). (b, c) The statistical graph of expression level of LC3 and p62. LC3-II/LC3-I/β-actin: 1.000 ± 0.068 (0 h), 2.761 ± 0.176 (2 h), 1.899 ± 0.164 (4 h), 2.094 ± 0.122 (8 h), 1.992 ± 0.197 (12 h). p62/β-actin: 1.000 ± 0.002 (0 h), 0.335 ± 0.119 (2 h), 2.130 ± 0.029 (4 h), 2.282 ± 0.019 (8 h), 1.66 ± 0.019 (12 h). (d) The viability of AEC-II was detected using the CCK-8 assay (n = 6). Control: 98.8240 ± 0.827%, H2O2: 73.344 ± 4.013%. (e) The level of ROS in AEC-II was detected using the ROS Assay Kit (n = 6). Control: 8.138 ± 1.020, H2O2: 37.060 ± 1.708. (f, g) Autophagy-related fluorescence double labeling was used to detect the autophagic level of AEC-II in control and H2O2 group (n = 6). Control: 1.67 ± 0.516 Dots (Autophagosom), 1.83 ± 0.753 Dots (Autophagolysome), H2O2: 10.00 ± 2.767 Dots (Autophagosom), 40.83 ± 8.329 Dots (Autophagolysome).

Overexpressing miR-21-5p alleviates autophagy induced by H2O2 injury. (a) TEM was used to observe autophagy-related bodies in AEC-II (bar = 2 μm). The red arrow points to the autophagolysosome and the yellow arrow points to the autophagosome. (b) RT-PCR was used to detect miR-21-5p expression levels in each group (n = 3). miR-21-5p/U6: 1.000 ± 0.000 (Control), 0.431 ± 0.010 (H2O2), 2.463 ± 0.240 (miR-21-5p+H2O2), 0.460 ± 0.029 (Empty vector+H2O2). (c) Observation of cell morphology of each group by microscope (bar = 100 μm). (d) Western blot was used to detect the expression level of p62 and LC3 protein of AEC-II in each group (n = 3). (e, f) The statistical graph of expression level of LC3 and p62. LC3-II/LC3-I/β-actin: 1.000 ± 0.016 (Control), 2.426 ± 0.159 (H2O2), 1.459 ± 0.037 (miR-21-5p+H2O2), 1.459 ± 0.037 (Empty vector+H2O2). p62/β-actin: 1.000 ± 0.238 (Control), 1.507 ± 0.010 (H2O2), 0.514 ± 0.211 (miR-21-5p+H2O2), 1.515 ± 0.012 (Empty vector+H2O2). (g) The effect of miR-21-5p overexpression on the vability of AEC-II. 98.660 ± 0.743% (Control), 72.200 ± 3.132% (H2O2), 82.950 ± 3.568% (miR-21-5p+H2O2), 74.250 ± 4.169% (Empty vector+H2O2).
miR-21-5p up-regulation alleviates autophagy induced by H2O2 injury
To clarify the role of miR-21-5p in H2O2-induced autophagy and apoptosis of AEC-II, we overexpressed miR-21-5p in AEC-II through lentiviral vectors. Immunofluorescence method proved that the best MOI was 50, and the efficiency of flow cytometry was 95.8% ± 0.18%. As shown in Figure 3(b), we observed a significant decrease in the expression level of miR-21-5p (43.2%) in the H2O2 group compared to the control group. Conversely, cells transfected with overexpressing miR-21-5p lentiviral vectors exhibited an approximately 6-fold increase in miR-21-5p expression relative to the H2O2 group. The H2O2 group exhibited a reduction in cell viability, whereas cells overexpressing miR-21-5p demonstrated enhanced resistance to H2O2-induced cell damage (Figure 3(c)). Compared to the H2O2 group, overexpressing miR-21-5p significantly attenuated autophagy, leading to a notable decrease in the expression levels of LC3-II/LC3-I and p62 protein (Figure 3(d)–(f)). The CCK-8 results also demonstrated that overexpressing miR-21-5pcould ameliorate H2O2-induced cellular damage, as compared to the H2O2 group (Figure 3(g)).
miR-21-5p can reduce H2O2-induced damage by activating AKT/mTOR axis
We aimed to investigate the significance of miR-21-5p-mediated regulation of the AKT/mTOR signaling pathway in AEC-II cells during H2O2-induced injury. The effects of an mTOR signaling pathway agonist (MHY1485) and an mTOR signaling pathway inhibitor (rapamycin) on AEC-II cell viability and the expression levels of proteins related to the AKT/mTOR signaling pathway were examined. Our findings demonstrated that H2O2 stimulation led to a decrease in PTEN, an apoptosis-related protein, while activating p-AKT and inhibiting p-mTOR. Furthermore, compared to the H2O2 group, overexpression of miR-21-5p significantly upregulated both p-AKT and p-mTOR/mTOR levels. (Figure 4(a)–(d)). The cell viability of AEC-II was unaffected by rapamycin treatment at concentrations ranging from 0 nM to 10 nM for 24 h, as demonstrated in Figure 4(e). Similarly, treatment with MHY1485 at concentrations of 0 μM, 1 μM, 2 μM, 5 μM, and 10 μM for either a duration of 4 h or 6 h did not impact cell viability. However, there was a decrease in cell activity observed after the extended duration of treatment (6 h) compared to the shorter duration (4 h) in Figure 4(f). Therefore, a treatment time of 4 h was selected for subsequent experiments involving MHY1485 on AEC-II. In addition, according to the literature,24,27 –29 the expression levels of mTOR and p-mTOR were assessed by Western blotting in AEC-II treated with rapamycin and MHY1485. Compared to the 0 nM group, there was a significant down-regulation of p-mTOR/mTOR expression at 10 nM, 20 nM, and 100 nM concentrations. The level of p-mTOR/mTOR expression in the 20 nM group was lower than that in the 10 nM group. No difference in p-mTOR/mTOR expression was observed between the 20 nM and 100 nM groups. Therefore, a concentration of 20 nM rapamycin was selected for a subsequent experiment involving a treatment duration of 24 h on AEC-II. (Figure 4(g) and (h)). Compared to the 0 μM group, the expression of p-mTOR/mTOR was upregulated in the 2 μM, 5 μM, and 10 μM groups. However, there were no significant differences observed in p-mTOR/mTOR expression among the 2 μM, 5 μM, and 10 μM groups. Therefore, a concentration of 2 μM MHY1485 was selected for a subsequent 4-h treatment of AEC-II in follow-up experiments (Figure 4(i) and (j)).

The impact of miR-21-5p on the AKT/mTOR signaling pathway in AEC-II and the effects of rapamycin and MHY1485 on AEC-II activity and mTOR activity. (a)The expression of PTEN, AKT, and mTOR related proteins in each group (n = 3). (b–d) The expression levels of AKT/mTOR pathway related proteins. p-mTOR/β-actin: 1.000 ± 0.081 (Control), 0.556 ± 0.112 (H2O2), 0.846 ± 0.026 (miR-21-5p+H2O2), 0.532 ± 0.113 (Empty vector+H2O2). p-AKT/β-actin: 1.000 ± 0.114 (Control), 1.436 ± 0.057 (H2O2), 1.800 ± 0.055 (miR-21-5p+H2O2), 1.474 ± 0.060 (Empty vector+H2O2). PTEN/β-actin: 1.000 ± 0.025 (Control), 0.816 ± 0.052 (H2O2), 0.511 ± 0.140 (miR-21-5p+H2O2), 0.808 ± 0.092 (Empty vector+H2O2). (e–f) The effect of each concentration on cell viability (The figure (e) is rapamycin; the figure (f) is MHY1485, n = 6). Rapamycin: (0 nM) 101.033 ± 9.040, (1 nM) 102.566 ± 3.934, (10 nM) 99.516 ± 12.267, (20 nM) 101.916 ± 5.071, (40 nM) 102.816 ± 4.152, (60 nM) 98.833 ± 5.110, (80 nM) 96.533 ± 8.021, (100 nM) 99.300 ± 4.534. MHY1485: (0 μM) 101.567 ± 6.005(4 h) 98.367 ± 9.923(6 h), (1 μM) 104.618 ± 6.234(4 h) 87.114 ± 26.670(6 h), (2 μM) 110.027 ± 6.101(4 h) 88.185 ± 33.143(6 h), (5 μM) 112.686 ± 6.701(4 h) 74.463 ± 31.240(6 h), (10 μM) 104.168 ± 0.089(4 h) 87.300 ± 33.671(6 h). (g–h) The expression of mTOR and p-mTOR at various concentrations of rapamycin (n = 3). p-mTOR/β-actin: (0 nM) 0.996 ± 0.008, (10 nM) 0.313 ± 0.036, (20 nM) 0.262 ± 0.032, (100 nM) 0.254 ± 0.005. (i–j) The expression of mTOR and p-mTOR at various concentrations of MHY1485 (n = 3). p-mTOR/β-actin: (0 μM) 1.000 ± 0.077, (2 μM) 1.227 ± 0.100, (5 μM) 1.229 ± 0.091, (10 μM) 1.278 ± 0.138.
The protective effect mediated by miR-21-5p during H2O2-induced AEC-II damage can be abolished through the inhibition of mTOR
Next, p-mTOR was inhibited using the mTOR inhibitor rapamycin to determine whether mir-21-5p could activate the AKT/mTOR signaling pathway to regulate apoptosis and autophagy. The data suggested a significant inhibition of p-mTOR/mTOR levels in cells treated with rapamycin, and miR-21-5p fails to activate Akt/mTOR after treatment with rapamycin (Figure 5(a)–(d)). The results depicted in Figure 5(c) and (d) demonstrate that rapamycin enhances autophagy by downregulating p62 expression and upregulating LC3II/I ratio. Notably, the LC3II/I ratio was lower in the Rapa+miR-21-5p+H2O2 group compared to the Rapa+H2O2 group. However, there were no significant differences observed in p62 expression levels. Based on these findings, it can be concluded that miR-21-5p regulates autophagy through mTOR signaling pathway and plays a role in H2O2-induced AEC-II damage. Then, we further investigate alterations in autophagy and apoptosis following mTOR activation. To achieve this, we activated mTOR using MHY1485 to induce p-mTOR and determine whether changes occur in autophagy and apoptosis pathways. Our data revealed a significant increase in p-mTOR/mTOR levels upon treatment with MHY1485. Furthermore, MHY1485 reduced autophagy by decreasing the LC3II/I ratio while increasing p62 expression levels. Interestingly, when comparing the MHY1485+H2O2 group with the MHY1485+miR-21-5p+H2O2 group, we observed a decrease in p62 expression only within the latter group, however, no statistically significant difference was found regarding LC3II/I ratio (Figure 5(e)–(h)). In addition, miR-21-5p can attenuate apoptosis by downregulating the expression of Bax and c-caspase-3 when compared to the H2O2 group. Conversely, the MHY1485+miR-21-5p+H2O2 group exhibited elevated levels of Bcl-2, Bax, and c-caspase-3 in comparison to the miR-21-5p+H2O2 group (Figure 5(i)–(l)).
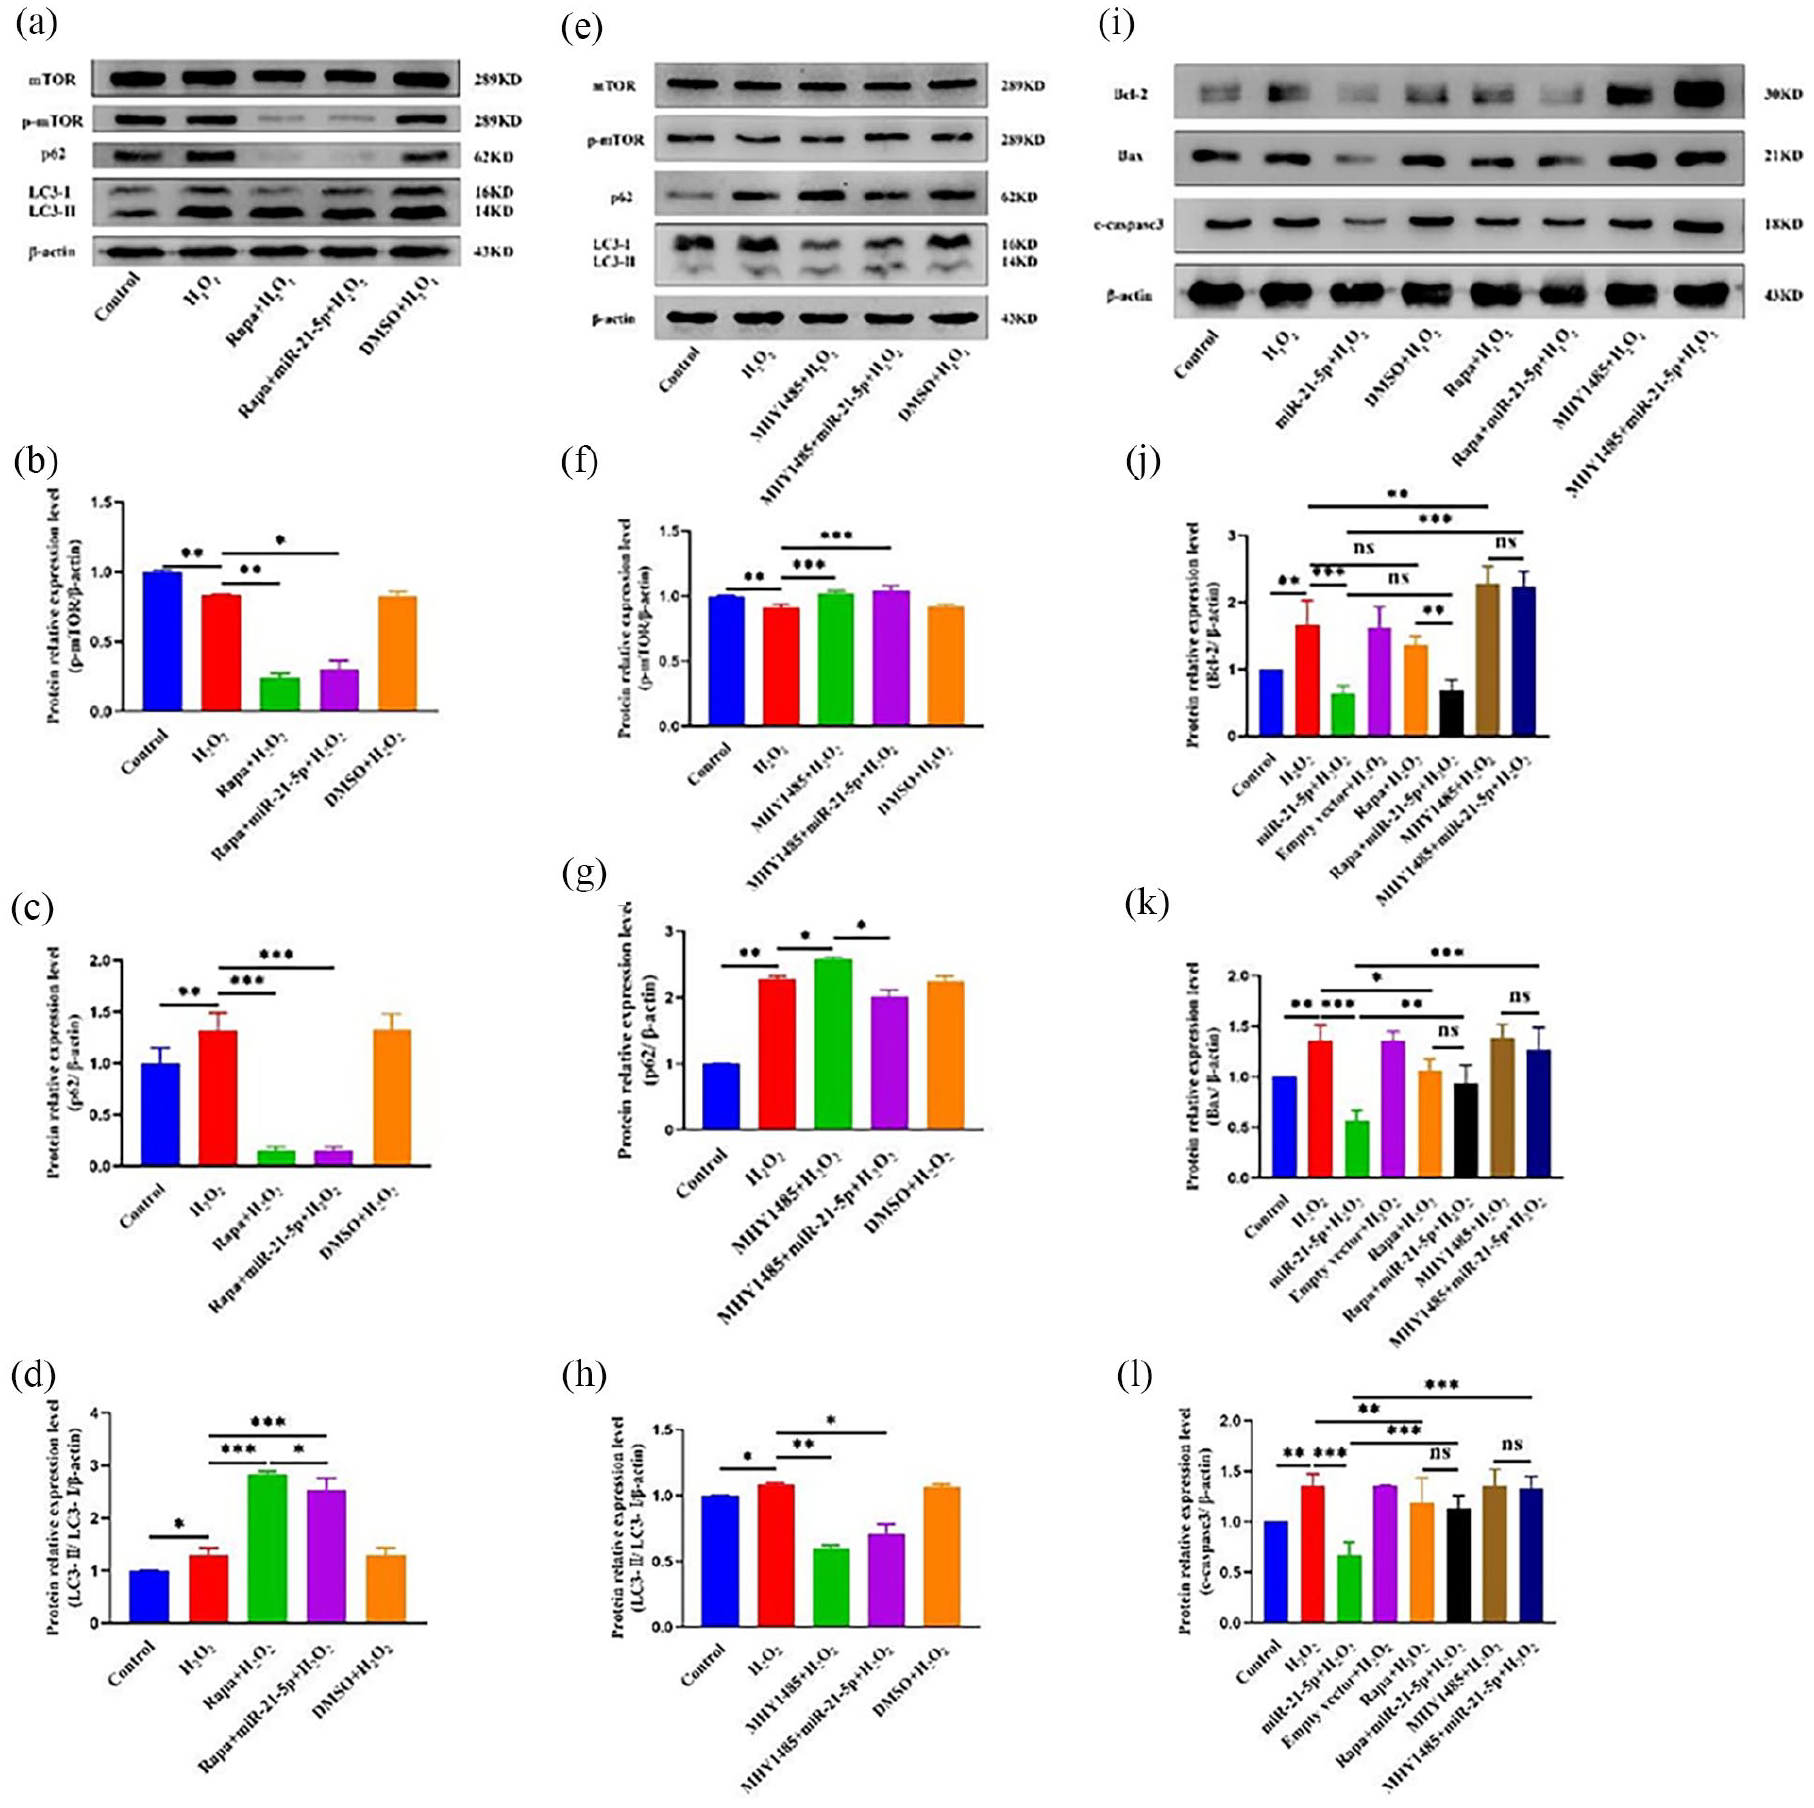
Inhibition of mTOR partially eliminated the protective effect mediated by miR-21-5p. (a) The expression of p62, LC3, and mTOR related proteins in each group (n = 3). (b–d) The expression levels of mTOR, p-mTOR, p62, and LC3 in each group (rapamycin). p-mTOR/β-actin: 1.000 ± 0.011 (Control), 0.837 ± 0.006 (H2O2), 0.242 ± 0.032 (Rapa+H2O2), 0.303 ± 0.062 (Rapa+miR-21-5p+H2O2), 0.831 ± 0.029 (MDSO+H2O2). P62/β-actin: 1.000 ± 0.149 (Control), 1.324 ± 0.166 (H2O2), 0.158 ± 0.030 (Rapa+H2O2), 0.157 ± 0.030 (Rapa+miR-21-5p+H2O2), 1.326 ± 0.152 (MDSO+H2O2). LC3-II/LC3-I/β-actin: 1.000 ± 0.010 (Control), 1.307 ± 0.126 (H2O2), 2.842 ± 0.046 (Rapa+H2O2), 2.547 ± 0.215 (Rapa+miR-21-5p+H2O2), 1.305 ± 0.131 (MDSO+H2O2). (e) The expression of p62, LC3, p-mTOR, and mTOR related proteins in each group (n = 3). (f–h) The expression levels of mTOR, p-mTOR, p62, and LC3 in each group (MHY1485). p-mTOR/β-actin: 1.000 ± 0.007 (Control), 0.916 ± 0.021 (H2O2), 1.020 ± 0.020 (MHY1485+H2O2), 1.040 ± 0.040 (MHY1485+miR-21-5p+H2O2), 0.920 ± 0.018 (MDSO+H2O2). P62/β-actin: 1.000 ± 0.004 (Control), 2.276 ± 0.047 (H2O2), 2.582 ± 0.025 (MHY1485+H2O2), 2.008 ± 0.107 (MHY1485+miR-21-5p+H2O2), 2.243 ± 0.080 (MDSO+H2O2). LC3-II/LC3-I/β-actin: 1.000 ± 0.006 (Control), 1.081 ± 0.015 (H2O2), 0.595 ± 0.028 (MHY1485+H2O2), 0.711 ± 0.071 (MHY1485+miR-21-5p+H2O2), 1.064 ± 0.170 (MDSO+H2O2). (i–l) The expression of Bax, c-caspased-3, and Bcl-2 related proteins in each group (n = 3). Bcl-2/β-actin: 1.000 ± 0.000 (Control), 1.666 ± 0.362 (H2O2), 0.628 ± 0.125 (miR-21-5p+H2O2), 1.616 ± 0.310 (Empty vector+H2O2), 1.358 ± 0.132 (Rapa+H2O2), 0.680 ± 0.164 (Rapa+miR-21-5p+ H2O2), 2.274 ± 0.263 (MHY1485+H2O2), 2.234 ± 0.225 (MHY1485+miR-21-5p+H2O2). Bax/β-actin: 1.000 ± 0.000 (Control), 1.365 ± 0.148 (H2O2), 0.570 ± 0.099 (miR-21-5p+H2O2), 1.357 ± 0.092 (Empty vector+H2O2), 1.067 ± 0.108 (Rapa+H2O2), 0.941 ± 0.175 (Rapa+miR-21-5p+H2O2), 1.388 ± 0.132 (MHY1485+H2O2), 1.266 ± 0.222 (MHY1485+miR-21-5p+H2O2). c-caspased-3/ β-actin: 1.000 ± 0.000 (Control), 1.352 ± 0.120 (H2O2), 0.670 ± 0.129 (miR-21-5p+H2O2), 1.357 ± 0.006 (Empty vector+H2O2), 1.116 ± 0.140 (Rapa+H2O2), 1.151 ± 0.143 (Rapa+miR-21-5p+ H2O2), 1.352 ± 0.164 (MHY1485+H2O2), 1.330 ± 0.120 (MHY1485+miR-21-5p+H2O2).
miR-21-5p can inhibit autophagy by inhibiting the production of autolysosome
Red dots refer to the fact that autolysosomes are markers of autophagy activity, the presence of red dots usually indicates an active autophagy process. They may represent autophagosomes that have fused with lysosomes, indicating that the cell is undergoing material degradation. Green dots usually refer to autophagosomes, and the appearance of green dots represents the formation of autophagosomes, indicating that the cell is capturing and sequestering the process of damaging components or harmful substances within the cell. By detecting red and green dots simultaneously, dynamic changes between autophagosome formation and autophagosome and lysosome fusion can be observed, providing insight into the different stages of autophagy. miR-21-5p decreased the number of autophagosomes and down-regulated autophagy, Rapamycin inhibited mTOR increased the number of autophagosomes and autophagolysosomes and enhanced autophagy. MHY1485 inhibited the number of autophagosomes and autolysosomes and inhibited autophagy. There was no difference in the number of LC3-GFP and LC3-RFP in AEC-II between Rapa+H2O2 group and Rapa+miR-21-5p+H2O2 group, indicating that rapamycin blocked the down-regulation of autophagy by miR-21-5p. There was no difference in the number of LC3-GFP and LC3-RFP in AEC-II between MHY1485+H2O2 group and MHY1485+miR-21-5p+H2O2 group, indicating that MHY1485 pretreatment can exert a strong autophagy inhibition effect on AEC-II (Figure 6(a) and (b)). Even overexpression of miR-21-5p could not further inhibit autophagy.

The effect of activation and inhibition of mTOR on miR-21-5p-mediated AEC-II autophagy during H2O2 injury. (a) Changes of LC3-GFP and LC3-RFP points in each group (n = 6). (b) The location of LC3-GFP and LC3-RFP in each group (bar = 15 μm). LC3-GFP: 1.60 ± 0.371 (Control), 10.10 ± 3.107 (H2O2), 8.40 ± 3.502 (miR-21-5p+H2O2), 8.40 ± 3.240 (Empty vector+H2O2), 34.00 ± 8.692 (Rapa+H2O2), 31.40 ± 10.856 (Rapa+miR-21-5p+H2O2), 2.50 ± 0.972 (MHY1485+H2O2), 2.20 ± 0.919 (MHY1485+miR-21-5p+H2O2), 9.90 ± 2.767 (MDSO+H2O2). LC3-RFP: 1.70 ± 0.396 (Control), 41.20 ± 8.135 (H2O2), 24.90 ± 10.082 (miR-21-5p+H2O2), 40.50 ± 7.517 (Empty vector+H2O2), 88.20 ± 24.453 (Rapa+H2O2), 93.30 ± 23.646 (Rapa+miR-21-5p+H2O2), 4.10 ± 1.524 (MHY1485+H2O2), 3.50 ± 1.179 (MHY1485+miR-21-5p+H2O2), 39.30 ± 6.667 (MDSO+H2O2).
miR-21-5p can inhibit the early apoptosis of AEC-II and reduce cell damage
The early apoptosis rate of each group was detected by flow cytometry after H2O2 treatment. The results showed that H2O2 treatment of AEC-II could induce cell apoptosis, and overexpression of miR-21-5p could inhibit the early death rate of AEC-II and alleviate cell damage. The anti-apoptosis effect of miR-21-5p after rapamycin pretreatment was not significant (Figure 7(a) and (b)).

The effect of activation and inhibition of mTOR on miR-21-5p-mediated AEC-II apoptosis during H2O2 injury. (a)The rate of apoptosis of AEC-II in each group. (b) The rate of early apoptosis rate in each group (n = 6). The rate of apoptosis of AEC-II: 0.417 ± 0.147% (Control), 33.950 ± 4.568% (H2O2), 16.183 ± 1.081% (miR-21-5p+H2O2), 33.683 ± 4.338% (Empty vector+H2O2), 26.733 ± 2.673% (Rapa+H2O2), 24.967 ± 3.208% (Rapa+miR-21-5p+H2O2), 41.417 ± 4.256% (MHY1485+H2O2), 37.917 ± 4.681% (MHY1485+miR-21-5p+H2O2), 33.317 ± 4.378% (MDSO+H2O2).
Discussion
To the best of our knowledge, this study represents the first evidence demonstrating that up-regulation of miR-21-5p can effectively rectify inadequate autophagy in AEC-II induced by H2O2 stimulation, which plays a critical role in cellular protection against HALI. The findings from this investigation suggest that miR-21-5p may regulate autophagy through its targeting of the AKT/mTOR signaling pathway. In order to simulate HALI in vitro, primary AEC-II derived from Sprague-Dawley rats were utilized and exposed to H2O2 treatment. An assessment of both miR-21-5p expression and autophagic activity within damaged AEC-II. Notably, our results revealed insufficient levels of miR-21-5p expression in H2O2-treated AEC-II, overexpression of miR-21-5p was found to effectively modulate autophagy and mitigate H2O2-induced damage in these cells.
The process of autophagy is a highly regulated and dynamic mechanism of self-digestion. Autophagy has gained increasing recognition as a multifaceted biological process that is intricately linked to various Neurodegenerative disorders (Alzheimer disease, Parkinson disease, Polyglutamine diseases, etc.),30 –33 Cardiovascular diseases, 34 Musculoskeletal disorders, 35 Kidney diseases, 36 Metabolic syndromes 37 and Pulmonary disorders, 38 among others. A significant amount of research has been dedicated to investigating the role of autophagy in lung diseases, such as HALI.11,27,39 –42 Under physiological conditions, autophagy exerts a cytoprotective effect and facilitates normal lung function. Autophagy also exhibits an anti-apoptotic role by aiding cellular recovery during HALI, subsequent damage can lead to compromised autophagic activity, which is classified as type II programmed or autophagic cell death. 11 Our previous studies showed that inhibiting AEC-II apoptosis could significantly improve lung function after hyperoxia-induced lung injury. 19
The miRNA molecules play a pivotal role in cellular functions, encompassing the regulation of apoptosis, proliferation, migration, and differentiation. The pioneering study conducted by Zhu et al. 43 unveiled the involvement of miRNAs in autophagy regulation. The regulation of autophagy is facilitated by miR-30a through the inhibition of Beclin-1 expression, which is mediated by the presence of the miR-30a consensus sequence within the 3′-UTR region of Beclin 1. Consequently, numerous miRNAs have been identified as capable regulators of autophagy through their targeting of miRNAs or other signaling pathways.44 –46 Recently, Yan et al. 20 showed that Inhibition of miR-21-5p targets PTEN and reduces autophagy and migration of keloid fibroblasts. Similarly, a separate study demonstrated that downregulation of miR-21 in nasopharyngeal carcinoma cells not only suppresses cellular proliferation but also induces apoptosis through inhibition of the PI3K/AKT/mTOR signaling pathway. 47 The present study reveals that miR-21-5p exerts a negative regulatory function on autophagy, primarily through the mediation of the AKT/mTOR signaling pathway.
The PI3K/AKT/mTOR pathway is a classic pathway for autophagy regulation. 48 mTOR belongs to the PI3K-related protein kinase family, and its C-terminal exhibits homology with PI3K. There are two forms of mTOR: the lysosomal mTOR complex (mTORC1) and the lipid membrane-associated mTOR complex (mTORC2). While mTORC1 is involved in regulating autophagy, mTORC2 governs cytoskeletal processes. The activation of the PI3K/AKT/mTOR signaling pathway exerts a negative regulatory effect on autophagy. Phosphorylation at Ser2448 leads to the activation of p-AKT and subsequent phosphorylation of mTOR, resulting in p-mTOR. 49 Phagocytic vesicles, the precursor of autophagosomes, are synthesized by ULK1-FIP200-ATG13 complex. p-mTOR directly phosphorylates ULK1 to inhibit the formation of ULK1-FIP200-ATG13 complex to inhibit autophagy. 50 The target gene of miR-21-5p identified thus far is PTEN.51 –53 We observed that the overexpression of miR-21-5p resulted in a downregulation of PTEN expression and activation of the PI3K/AKT/mTOR pathway, leading to a reduction in autophagy levels. However, even in the presence of rapamycin, an mTOR inhibitor, miR-21-5p still decreased autophagy activity, suggesting its potential involvement in regulating alternative signaling pathways.
Based on the above results, miR-21-5p regulates autophagy via mTOR, and autophagy may be beneficial to AEC-II. Therefore, we want to observe the changes in autophagy and apoptosis by activating mTOR. MHY1485 was synthesized based on the morpholinotriazine structure that could be combined with mTOR and inhibited autophagy by inducing mTOR activation. 54 However, we showed that MHY1485 can decrease autophagic level, but amplify AEC-II apoptosis during H2O2 injury. When we utilized the mTOR activator MHY1485, miR-21-5p exhibited augmented autophagic activity, implying its potential involvement in the regulation of other signaling pathways. Furthermore, previous investigations have substantiated that miR-21-5p directly binds to Bcl-2 mRNA and attenuates its expression. 55 The protein Beclin-1 contains the BH3 domain of Bcl-2 homolog, which functions as an inhibitor of autophagy. 56 The findings of Ma et al. 57 demonstrated that miR-21 downregulated the expression of Bcl-2 and concurrently upregulated autophagy-associated proteins ATG5, Beclin1, and LC3-I/II. Our findings also demonstrate that miR-21-5p exerts a down-regulatory effect on the expression level of Bcl-2. Moreover, emerging research has increasingly elucidated the pivotal role of members from the RAB small GTPase protein family, renowned as regulators of membrane transport and fusion, in autophagy regulation.58,59 The findings of a study on traumatic brain injury revealed that miR-21-5p exerts inhibitory effects on autophagy activity by specifically targeting Rab11a, thereby suggesting the potential role of miR-21-5p in regulating autophagy through a novel signaling pathway. 60
In this study, we conducted preliminary investigations into the role and mechanism of miR-21-5p through in vitro cell experiments. However, future research should include animal experiments involving up-regulation and knockout of miR-21-5p, as well as the knockout or overexpression of mTOR, to better elucidate relationship between miR-21-5p and mTOR with autophagy and apoptosis. After comprehensive analysis, our data demonstrated that miR-21-5p effectively inhibits H2O2-induced autophagy and apoptosis of AEC-II cells. This effect may be attributed to the regulation of the AKT/mTOR signaling pathway. Furthermore, rapamycin exhibited significant anti-apoptotic efficacy in our cellular model, warranting further investigation into its specific mechanism. In addition, the sample size was not calculated in this study, which is a limitation. We plan to address this issue and improve it in future experiments by implementing a more rigorous sample size estimation method.
Conclusion
miR-21-5p reduces H2O2-induced autophagy and apoptosis of primary AEC-II by partially activating PI3K/AKT/mTOR signaling pathway, thereby alleviating cell damage. Our findings could potentially offer a novel perspective and serve as a robust basis for the clinical management of HALI.
Footnotes
Author contributions
XL and HM designed this study. QD, YR, and BF performed all the experiments and analyzed the data and prepared the figures. YR, JZ, KY, and MC drafted the initial manuscript. HM reviewed and revised the manuscript. All authors read and approved the final manuscript.
Declaration of conflicting interests
The author(s) declared no potential conflicts of interest with respect to the research, authorship, and/or publication of this article.
Funding
The author(s) disclosed receipt of the following financial support for the research, authorship, and/or publication of this article: This work was financially supported by the National Natural Science Foundation of China (82160022), Guizhou Provincial Department of Science and Technology (No: ZK-2022-660, No: ZK-2023-544, ZK-2024-299, ZK-2024-320), and Guizhou Provincial Health Commission (gzwkj2024-091, gzwkj2024-310). Zunyi Science and Technology Bureau Science and Technology Fund Project: (2023) No. 221, (2023) No. 199.
Ethical approval
Ethical approval for this study was obtained from * The Animal Ethics Committee of the Zunyi Medical University, China (permit#: [2021]2-218)*.
Animal welfare
The present study followed international, national, and/or institutional guidelines for humane animal treatment and complied with relevant legislation.
Declaration of AI use
We employed [Deepseek] to enhance the grammatical accuracy and readability of the manuscript. All AI-generated suggestions were critically reviewed and approved by us, who retain full responsibility for the final content.
Availability of data and materials
The datasets used and/or analyzed during the current study are available from the corresponding author on reasonable request.