
Abstract
Introduction
Glioblastoma, a primary intracranial neoplasm characterized by its pronounced malignancy and dismal prognosis,1–4 remains a formidable clinical challenge, boasting a median survival period of a mere 14 months and standing as the leading cause of mortality among neurological tumors.5,6 In the therapeutic arsenal against glioblastoma, radiation therapy occupies a central role. While the advent of tumor electric field therapy in 2011 extended overall survival, 7 no therapeutic modality has yet succeeded in significantly elevating cure rates. Hence, it is incumbent upon the scientific community to delve deeper into the pathogenesis of glioblastoma, investigate avenues for augmenting the efficacy of radiotherapy, and unearth molecular markers germane to treatment response and prognosis. 7
Extensive prior investigations have unveiled the pivotal role of immune cell dysregulation in the genesis, malignant progression, and therapeutic refractoriness of tumors. In the vast landscape of immunotherapeutic strategies for malignancies, substantial strides have been achieved by deploying targeted immune checkpoints.8–10 Notably, anti-PD-1 and anti-PD-L1 therapies, encompassing a cadre of checkpoint inhibitor anticancer agents that impede the activity of PD-1 and PDL1 immune checkpoint proteins resident on cell surfaces, have demonstrated clinical utility across diverse solid tumors. 11 Regrettably, the profound heterogeneity characterizing gliomas has, thus far, hampered the effective application of immune checkpoint inhibitors among glioma patients. 12 Consequently, pursuing novel therapeutic targets with the capacity to comprehensively facilitate the establishment of immunosuppressive microenvironments represents a paramount breakthrough imperative.13,14
In preceding investigations, the author has discerned that the decline in CD4+T cells and the concomitant escalation of CD8+T cells in glioblastoma patients following radiotherapy emerge as independent risk factors exerting a notable impact on survival outcomes. Significantly, heightened elevations in CD8+T cell levels correlate with worsened patient prognoses. Building upon the foundation laid by previous studies, the present inquiry aspires to further elucidate the characteristics of immune cell populations relevant to radiotherapy, delineate immune cell-associated genes of import, and assemble a signature capable of unmasking disparities in the molecular and tumor microenvironment immune profiles across patients harboring distinct risk profiles. In doing so, our endeavor seeks to unfurl novel prospects in glioblastoma treatment, thereby illuminating the path toward the discovery of potential therapeutic agents.
Materials and methods
The Study was conducted at the Department of Radiation Oncology, The Affiliated Henan Cancer Hospital of Zhengzhou University. This study was approved by the Henan cancer hospital ethics committee, documented under reference number 2022-540-001, Dated: 2022.12.16. The dataset comprises a limited number of samples from adult patients undergoing radiotherapy, encompassing a total of 124 cases. All subjects (patients) participating in the study provided written informed consent prior to their inclusion.
Data download and preprocessing
Using the University of California, Santa Cruz (UCSC) Xena database (https://xena.ucsc.edu), 15 the logFPKM expression profile data for The Cancer Genome Atlas Glioblastoma (TCGA-GBM) was downloaded as the training set, and survival and phenotype data from 124 adult patients receiving radiotherapy were extracted for subsequent analyses. The phenotype and survival data of the validation set for Chinese Glioma Genome Atlas Glioblastoma (CGGA-GBM) were downloaded from the CGGA database (https://www.cgga.org.cn). 16
Immune cell infiltration analysis
Based on the TCGA-GBM training set data, 22 immune cell infiltration analyses were performed using one of the algorithms (CIBERSORT, xCELL, ssGSEA, etc.), and survival packets were used to screen for immune cell types that were significantly correlated with good prognosis (p < .05).
Recognition and functional enrichment of immune cell–related genes
Based on the training set data, the differentially expressed genes (DEG) between high infiltration and low infiltration groups of immune cells were calculated using Limma packets, and the expression of genes was displayed using volcano and heat maps. Through the STRING database (https://cn.string-db.org), 17 interaction data between DEGs were obtained, and the maximal clique centrality (MCC) algorithm of the Cytoscape software cytoHubba plugin was used to identify the top 100th gene as the hub gene and label it as an immune cell–related gene. The cluster Profiler package was used to perform gene ontology (GO) and Kyoto Encyclopedia of Genes and Genomes (KEGG) functional enrichment analysis based on immune cell–related genes.
Signature constructed from immune cell–related genes
Based on the TCGA-GBM expression data and survival information in the training set, univariate Cox screening was performed on immune cell–related genes using survival packages to screen for prognostic-related genes (p < .05). LASSO Cox analysis using the glmnet package was performed to remove redundant genes and construct a signature. The calculation formula is as follows, where expr is the expression value of the characteristic gene in the model, and coef is the regression coefficient.

Signature and patient prognosis and clinical characteristics
Patients were divided into high- and low-risk groups based on the median (or optimal threshold) risk scores of all samples, and the prognostic efficacy of signatures in the training set and external independent validation set were evaluated. By comparing the clinical features of the training and validation sets, differences in clinical features of the signature groups were revealed. Using the survival package for univariate and multivariate Cox validation, the signature was verified as an independent prognostic factor.
Molecular characteristics related to signature and drug response
The GBM copy number variation (CNV) data based on the TCGA database was downloaded, and the maftools package was used to display a waterfall map of the gene mutation rate. CNV differences between the two signature groups were identified using methods such as Fisher’s precision test. From the MsigDB database (https://www.gsea-msigdb.org/gsea/msigdb), 18 the hallmark pathway gene set was downloaded; the pathway enrichment score was calculated using the ss Gene Set Enrichment Analysis (ssGSEA) algorithm, and differences in the hallmark pathway between the two groups were evaluated using the Limma package. The R package ESTIMATE was used to calculate the ImmuneScore, StromalScore, and ESTIMATE Score and display them through box plots. Then, the R package corrplot was used to calculate their Pearson correlation with the signature. The ssGSEA algorithm was used to evaluate differences in the cell infiltration within the tumor microenvironment between the signature groups, and Pearson’s correlation between the infiltration level and the signature was calculated. In addition, the expression differences in the immune checkpoints between the signature groups were evaluated. Through The Cancer Innunome Atlas (TCIA) database (https://tcia.at/home), 19 the distribution differences of the immune cell promotion scores (IPSs) between high- and low-risk groups were predicted. The Tumor Immune Dysfunction and Exclusion (TIDE: https://tide.dfci.harvard.edu), 20 database was used to predict the tumor immune escape ability of the samples. Then, the correlations between these three factors and the signature were analyzed. The prognostic effect of immunotherapy of the signature was evaluated through other cohorts with immunotherapy data (bladder cancer dataset [IMvigor210]). Here, we also calculated the differences in CD8A/PD-L1 expression levels, tumor mutational burden (TMB), homologous recombination deficiency (HRD), TIDE, and other immunotherapy predictive markers between the signature groups and their correlations with the signature.
Identification of potential drugs
Patient drug sensitivity was predicted based on the Genomics of Drug Sensitivity in Cancer (GDSC: https://www.cancerrxgene.org) 21 and Cancer Cell Line Encyclopedia (CCLE: https://sites.broadinstitute.org/ccle). 22 The correlation between the signature and drug sensitivity (IC50) was calculated using Spearman’s method. The differences in drug sensitivity were compared between groups.
Immunohistochemical analysis
In our study, we conducted immunohistochemical analysis to investigate the expression levels of SDC-1, PLAUR, FN1, and CXCL13 proteins in glioblastoma tissues obtained from 104 patients. Monoclonal antibodies targeting SDC-1, PLAUR, FN1, and CXCL13 were procured from Abcam. Additionally, we utilized HRP-labeled goat anti-human IgG antibody obtained from Henan Yunhong Biotechnology Co., Ltd. for the immunohistochemical staining process.
Immunohistochemistry steps
The immunohistochemistry procedures involved several sequential steps. Initially, the corresponding patient’s wax block tissue was sliced into 4um sections. Subsequently, dewaxing was conducted by immersing the sections in 100% xylene solution for 5 minutes, repeated twice, followed by immersion in 100%, 95%, and 80% gradient concentration alcohol for 2 minutes each, and finally washed with distilled water for 1 minute. To block catalase activity, the tissue sections were placed in a 3% hydrogen peroxide (H2O2) solution for 10 minutes at room temperature, followed by rinsing with PBS three times for 1 minute each. Antigen retrieval was then performed by placing the slices in 10ul of citrate solution (pH=6.0), heating for 5 minutes, allowing them to cool at room temperature for 30 minutes, and rinsing with PBS three times for 1 minute each. Subsequently, serum blocking was achieved by adding goat serum to the sections and incubating them at room temperature for 15-20 minutes. The primary antibody (1:200 dilution) was then added to the tissue section, which was kept overnight in the refrigerator (4°C). Afterward, the sections were allowed to reach room temperature for 30 minutes and washed with PBS solution for 7 to 8 minutes. The secondary antibody was added dropwise and incubated for 30 minutes, followed by another wash with PBS solution for 7 to 8 minutes. For DAB color development, freshly prepared DAB color developer was added dropwise to the slices. The staining condition was observed under a microscope, and the slices were rinsed with distilled water after staining. Finally, the sections were lightly counterstained with hematoxylin for 5 minutes, rinsed with water for 1 minute, differentiated with hydrochloric acid and alcohol (1%), dried, and sealed with neutral resin.
Determination of immunohistochemistry results
The results of immunohistochemical staining were interpreted blindly by 2 attending physicians from the pathology department of our hospital. The interpretation criteria are the number of positive cells ≤ 25%, score 0 points; the number of positive cells 26%–50%, score 1 point; the number of positive cells 51%–75%, score 2 points; 76%–100%, score 3 points. Staining degree: no staining, score 0; yellow, score 1; brownish yellow, score 2; brown, score 3. The two results are multiplied to obtain the final scoring result. A cut-off value of 4 points was used, <4 points were defined as low expression, and ≥4 points were defined as high expression. The results of the four immunohistochemical scores were added together to obtain the final signature score. The cut-off value was analyzed by Receiver Operating Characteristic (ROC) curve, and divided into high-expression group and low-expression group according to the cut-off value, and Kaplan–Meier method was used to compare whether there was any difference in survival rate between the two groups.
Results
Immune cell infiltration is associated with the prognosis of glioblastoma radiotherapy
In our endeavor to scrutinize immune cell infiltration patterns within the glioblastoma microenvironment, we harnessed the capabilities of three distinct analytical algorithms: CIBERSORT, xCELL, and ssGSEA. Our exploration commenced with the CIBERSORT algorithm, designed for the assessment of 22 distinct immune cell subtypes. Leveraging the survival package, we meticulously evaluated the association between these immune cell populations and prognosis. Intriguingly, none of the 22 immune cell subtypes exhibited statistically significant correlations at a stringent significance threshold of p < .05.
Subsequently, our investigative efforts turned to the ssGSEA algorithm, enabling a comprehensive analysis encompassing 28 diverse immune cell types. In this phase, we unearthed five immune cell subtypes that exhibited noteworthy associations, with p-values falling below the predetermined threshold (refer to Figures 1 and 2). Central memory CD8+T cells, among these, stood out as the most conspicuously significant immune cell subtype. As a final analytical stride, we resorted to an Excel algorithm specifically tailored for immune cell infiltration analysis. Regrettably, akin to the results obtained with the CIBERSORT algorithm, none of the assessed immune cell subtypes displayed statistically significant correlations at the p < .05 threshold. Consequently, guided by the outcomes derived from the trio of algorithms, we elected to direct our subsequent investigations towards central memory CD8+T cells, an immune cell subset identified as particularly salient by the ssGSEA algorithm. This strategic decision reflects our recognition of the pivotal role attributed to central memory CD8+T cells within the intricate landscape of glioblastoma-associated immune responses, compelling us to pursue an in-depth inquiry into their characteristics and implications. Histogram of the proportion of immune cells in each sample. Univariate Cox results of 28 immune cells obtained by the ssGSAE algorithm.

Recognition and functional enrichment of immune cell–related genes
To identify genes that were notably different between these two groups, we employed a statistical method called Limma. This analysis yielded 699 differentially expressed genes (DEGs) that met our criteria, with adjusted p-values less than 0.05 and a fold change greater than 0.585 (as illustrated in Figure 3). (a) Volcano map of differentially expressed genes. (b) Differential expression gene heatmap.
Next, we looked at how these 699 DEGs interacted with one another using the STRING database. We then used a special algorithm within Cytoscape software, known as cytoHubba, to pinpoint the top 100 genes that appeared most influential in this network (as depicted in Figure 4). We labeled these genes as central memory CD8+T cell-related genes. The MCC algorithm of the Cytoscape software cytoHubba plugin takes the top 100th gene.
To understand the roles of these 100 genes, we conducted two types of analyses, namely, Gene Ontology (GO) and Kyoto Encyclopedia of Genes and Genomes (KEGG) analyses. These analyses helped us unravel the biological functions and pathways associated with these genes. Remarkably, we identified 1199 GO terms, which encompassed 1065 biological processes (BP), 48 cellular components (CC), and 86 molecular functions (MF). Intriguingly, while GO analysis yielded numerous insights, we did not identify any significant KEGG pathways associated with these genes. In Figure 5, we showcase the top 20 genes that stood out in terms of their importance across various functions (MF, BP, and CC). GO enrichment results of immune cell–related genes in central memory CD8+T cells.
In essence, these steps allowed us to pinpoint a set of genes closely linked to central memory CD8+T cells and gain valuable insights into their potential roles in glioblastoma.
Constructing a signature based on immune cell–related genes
In order to ientify Genes Linked to Central Memory CD8+T Cells and Survival, we have started by focusing on the top 100 genes associated with central memory CD8+T cells. From this group, we honed in on 19 genes that were particularly relevant to predicting patient survival (overall survival or OS). To do this, we employed a statistical tool called the R language survival package and utilized univariate Cox analysis, selecting genes that exhibited significant associations (with p-values less than 0.05). We used these 19 genes to create Kaplan–Meier survival curves, as shown in Figure 6. The curves highlight the genes that had significant impacts on patient survival (with p-values less than 0.05). Subsequently, we performed a specialized statistical analysis called LASSO Cox analysis. This method allowed us to distill the selection down to four genes with non-zero coefficients, meaning these genes had a substantial influence on patient survival. We then used these four genes to craft a unique gene signature, as depicted in Figure 7. In essence, this part of our study enabled us to identify a small set of genes associated with central memory CD8+T cells that could serve as a powerful signature. Survival analysis of prognostic characteristic genes. (a) Each curve in the figure represents the variation trajectory of each independent variable coefficient, with the vertical axis representing the value of the coefficient and the lower horizontal axis representing log (λ). The upper horizontal axis is the number of non-zero coefficients in the model at this time. (b) The lowest point in the curve indicates the best lambda. (c) Histograms of the four characteristic genes and regression coefficients.

Correlation between signature and patient prognosis and clinical characteristics
Our study leveraged survival data sourced from the TCGA-GBM dataset. To discern the prognostic utility of our constructed signature, we employed an optimal threshold value of 2.466642 to stratify adult patients who had received radiation therapy into two distinct groups: a high-risk group and a low-risk group. The survival curves we generated vividly illustrated notable disparities between these two groups. In particular, the high-risk group exhibited a significantly poorer prognosis, as indicated by a p-value of 0.0068. This stark contrast is visually depicted in Figure 8. We further evaluated the predictive performance of our signature by plotting ROC curves (using the time ROC package) for 1-year, 3-year, and 5-year survival. These curves yielded area under the curve (AUC) values exceeding 0.82 for each time point, underscoring the robust prognostic efficacy of our signature scoring system. To fortify the credibility of our signature, we subjected it to validation in an independent dataset, CGGA_mRNAseq_693. The results affirmed the consistency of our findings, with significant distinctions observed between high and low-risk groups (p < .0001), mirroring the trend observed in the training set (Figure 9). Once again, the high-risk group demonstrated an unfavorable prognosis in the validation set. K-M survival curve (a) and time-dependent ROC curve (b) of the high- and low-risk groups in TCGA-GBM, distribution of risk scores and survival time for each patient sample, and expression heatmap of characteristic genes in the high/low group (c). CGGA_mRNAseq_ K-M survival curve (a) and time-dependent ROC curve (b) for the high- and low-risk groups in 693, distribution of risk scores and survival time for each patient sample, and expression heatmap of characteristic genes in the high/low group (c).

Our investigation extended to the assessment of how our signature correlated with distinct molecular subtypes and the mutation status of the IDH1 gene. Encouragingly, significant differences in the signature were discerned among patients with different molecular subtypes and IDH1 mutation states (p < .05), as delineated in Figure 10. Univariate and multivariate Cox regression analyses were undertaken to comprehensively investigate the prognostic association between our signature and clinical features. The results were unequivocal, both in the training set, TCGA_GBM, and the validation set, CGGA_mRNAseq_693. In both datasets, the signature emerged as an independent prognostic factor, signifying its robust predictive capability (Figure 11). Specifically, the signature exhibited a statistically significant association with patient outcomes in both single-factor and multi-factor analyses, where the hazard ratio (HR) consistently exceeded 1. In summation, our study unveiled the promising prognostic potential of our signature, as evidenced by its ability to stratify patients into distinct risk groups with divergent survival outcomes. Moreover, the signature demonstrated robust predictive accuracy across different time points, received validation in an independent dataset, exhibited relevance to molecular subtypes and IDH1 mutation status, and emerged as an independent prognostic factor in rigorous statistical analyses. TCGA_ Box plot of clinical feature distribution between different signature groups in GBM (*p < .05; * *p < .01; * * *p < .001; * *p < .0001; not significant p > .05). TCGA_ GBM (a) and CGGA_ mRNAseq_ Univariate and multivariate Cox regression analysis of signature and clinical features in 693 (b).

Molecular characteristics related to signature and drug response
In our quest to comprehend the genetic underpinnings of our signature, we delved into the mutation and Copy Number Variation (CNV) data from the TCGA-GBM dataset. This analysis unveiled notable differences in genomic alterations between the two signature-defined groups, which we graphically represent in Figure 12(A) and (B). To offer a clearer perspective, we constructed a waterfall plot illustrating the mutation rates of the top 20 genes (The top 20 genes in the High group are PTEN, TP53, TTN, MUC16, NF1, EGFR, RB1, RYR2, AHNAK2, CALN1, DNAH5, COL6A2, FAT2, GRM3, HYDIN, KEL, MUC17, OBSCN, PIK3R1, and PPP1R3A. The top 20 genes in the Low group are TP53, EGFR, PTEN, TTN, MUC16, SPTA1, PIK3R1, ATRX, FLG, RYR2, AHNAK2, DNAH17, IDH1, OBSCN, PCLO, DNAH3, HYDIN, LRP2, TAF1L, and USH2A) in both groups. Strikingly, the high-risk group displayed an overall higher mutation rate compared to the low-risk group. Waterfall diagram of the top 20 genes with the highest mutation rate between the high (a) and low (b) groups. Analysis of differences in the CNV between high/low groups (c). The distribution of CNV between the high (d) and low (e) groups.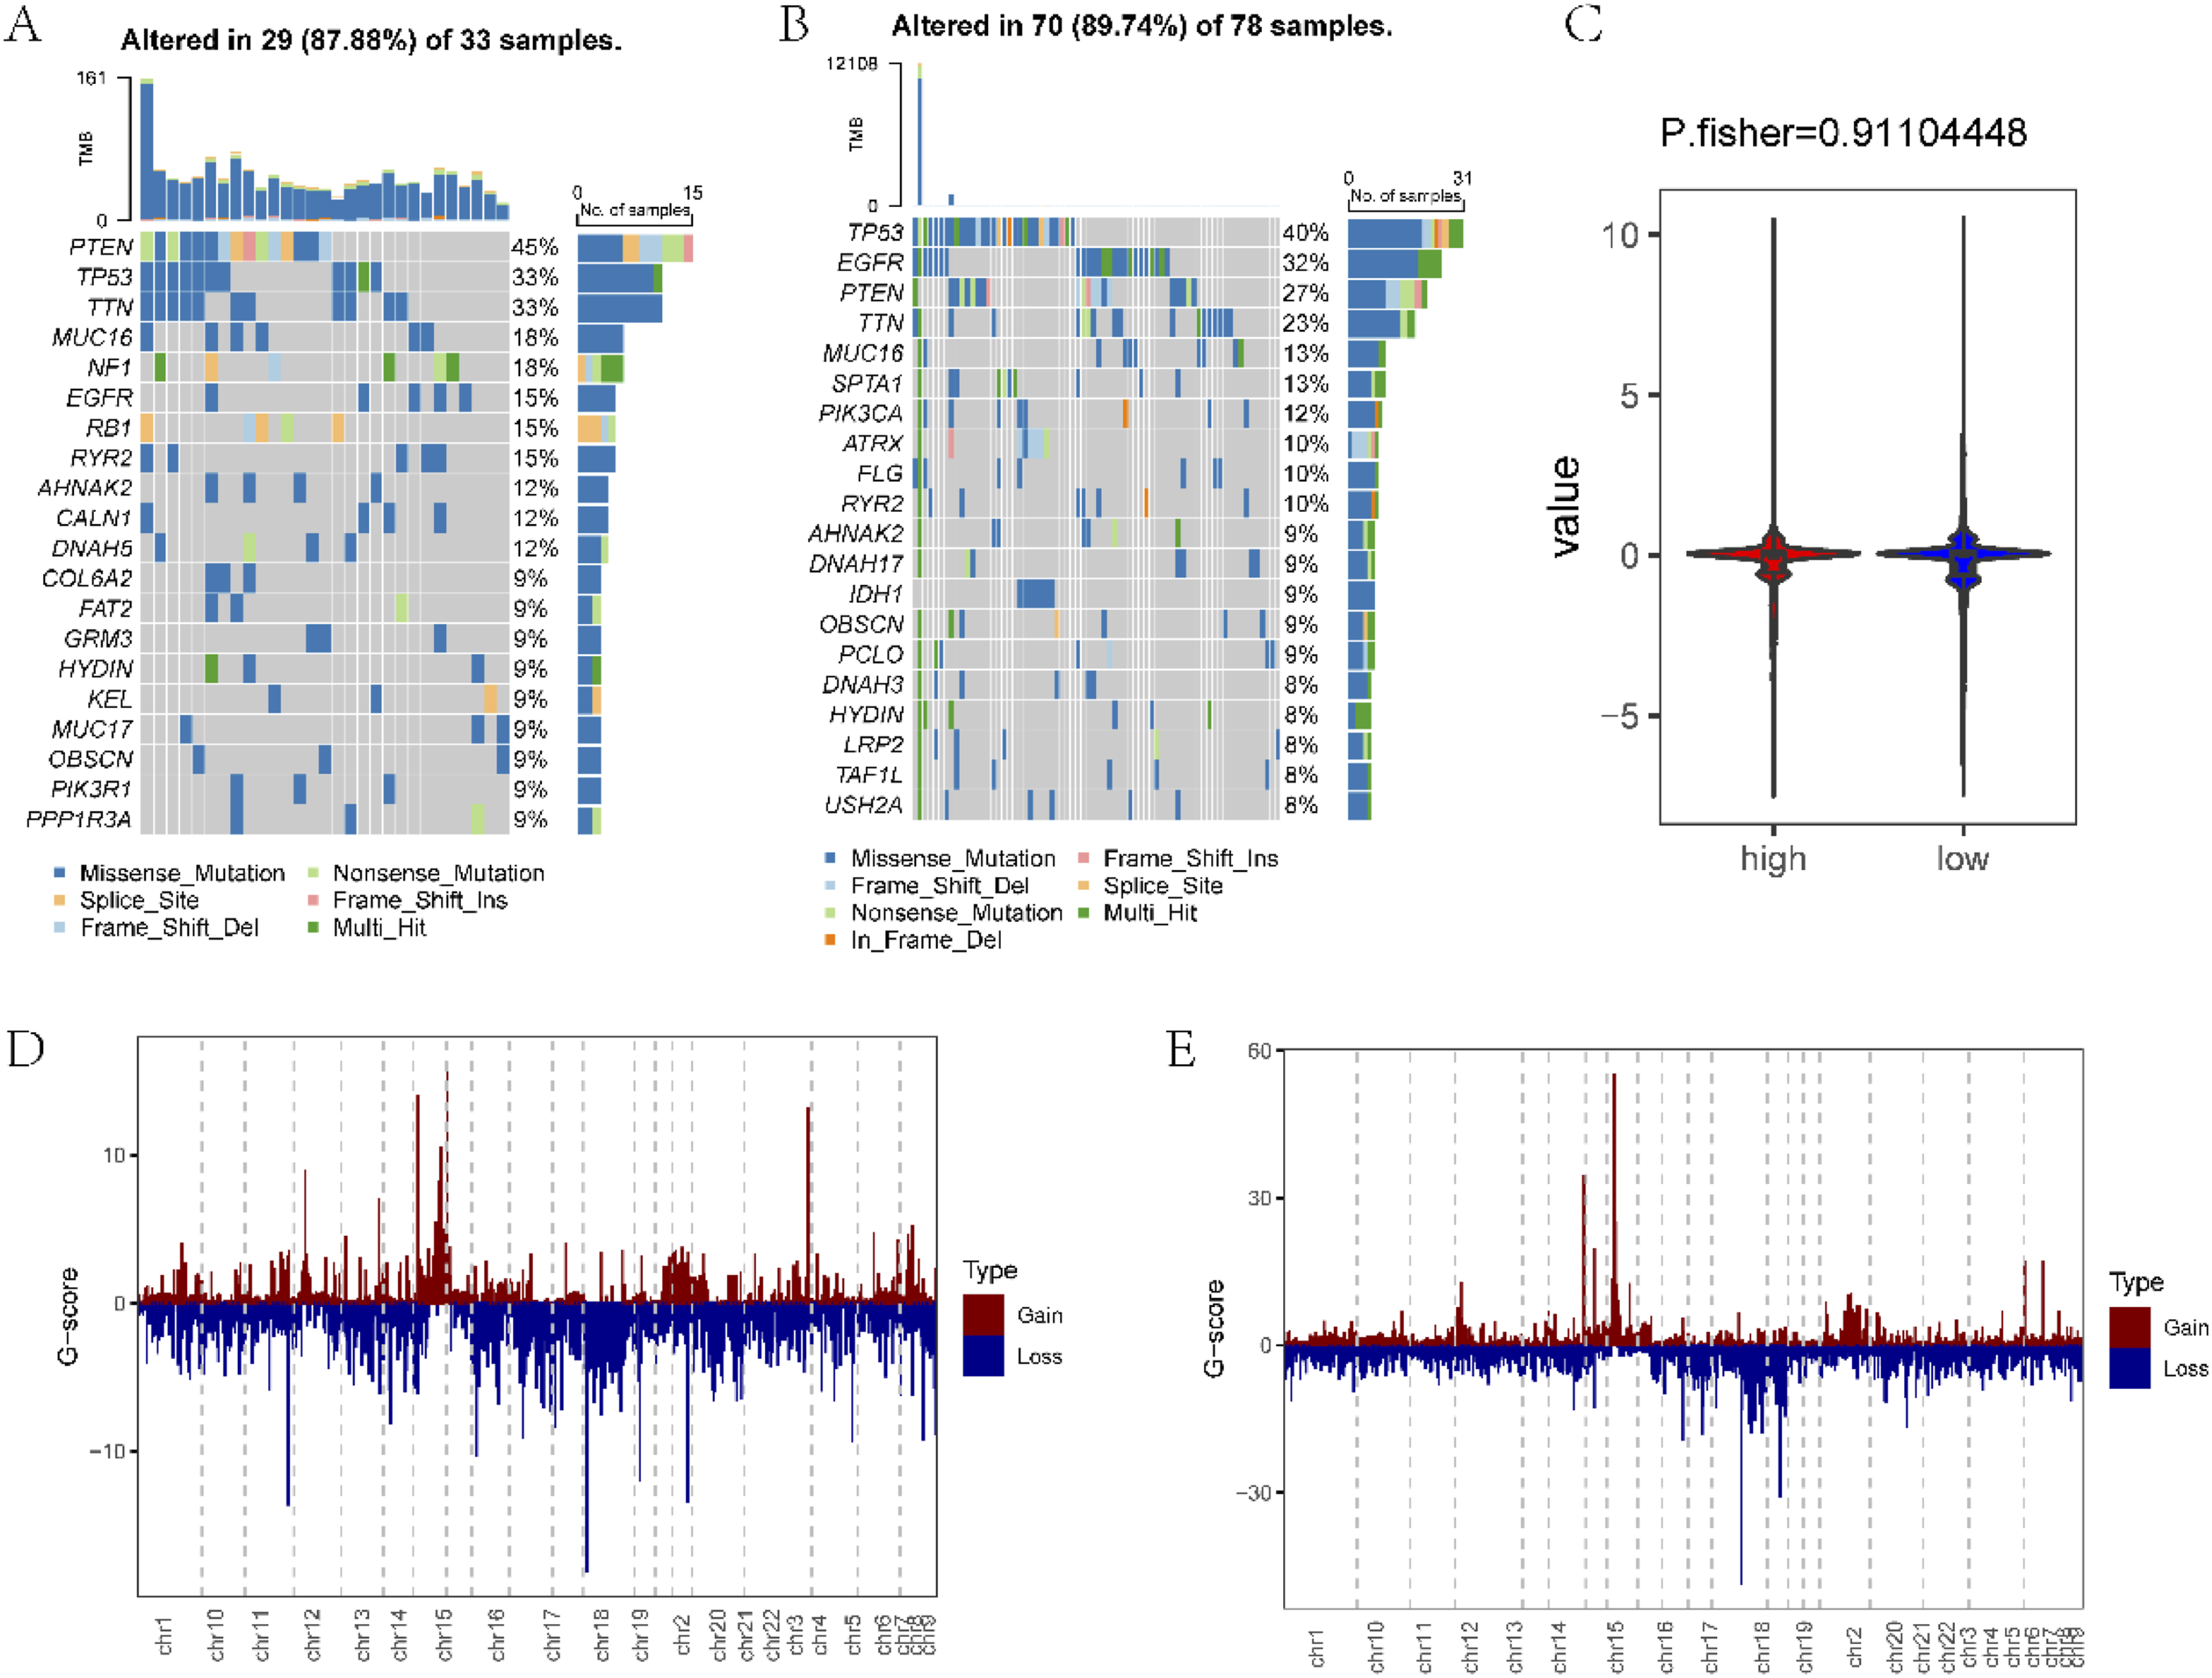
Surprisingly, our examination of CNV data (Figure 12(C)) did not unveil significant disparities between the high and low-risk groups. Further exploration of CNV magnitude, as depicted in Figure 12(C) and (D), similarly indicated a lack of pronounced distinctions between the two groups.
In an effort to unravel the functional implications of our signature, we accessed a collection of 50 tumor hallmarks from the MsigDB database. Employing the ssGSEA algorithm, we assessed hallmark scores within the high and low-risk groups. To scrutinize differences in hallmark pathways, we conducted a rigorous analysis using the Limma R package. This analysis illuminated the presence of a notable pathway with a strikingly low p-value of less than 0.01 (Figure 13). In summary, our genomic analysis of TCGA-GBM data revealed substantial differences in mutation rates between the high and low-risk groups, with the former displaying a higher overall mutation rate. Intriguingly, CNV profiles did not exhibit marked distinctions between these groups. Furthermore, our exploration into hallmark pathways underscored the presence of a significantly perturbed pathway, thereby shedding light on the potential functional implications of our signature. Heat map of hallmark differences between ssGSEA evaluation of high/low groups.
In our exploration of the tumor microenvironment within the high and low-risk groups, we made several notable observations. Notably, the analysis revealed significant distinctions in key parameters of the tumor microenvironment between these two groups. Specifically, the StromalScore, ImmuneScore, and ESTIMATEScore exhibited statistically significant differences (p < .05), as visually represented in Figure 14(A). Moreover, these scores exhibited significant correlations with our signature (p < .05), underscoring the interplay between our signature and the tumor microenvironment, as depicted in Figure 14(B). Employing the ssGSEA algorithm, we meticulously assessed immune cell infiltration patterns within these groups. Remarkably, more than 95% of immune cell types exhibited striking differences in infiltration levels between the high and low-risk groups (p < .05). Importantly, all of these immune cell types displayed a positive correlation with our signature, as elucidated in Figure 15. Our analysis of the tumor microenvironment uncovered substantial disparities in StromalScore, ImmuneScore, and ESTIMATEScore between the high and low-risk groups, all of which were statistically significant. These scores were intimately linked to our signature, indicating a profound interplay between our genetic signature and the tumor microenvironment. Furthermore, our assessment of immune cell infiltration patterns unveiled significant differences across a wide spectrum of immune cell types, all of which exhibited a positive association with our signature. These findings collectively shed light on the intricate relationship between our signature, the tumor microenvironment, and immune cell dynamics. Comparison of the ImmuneScore, StromalScore, and ESTIMATEScore between (a) high/low groups. (b) Scatter plot of the correlation between the ImmuneScore, StromalScore, ESTIMATEScore, and signature. (a) ssGSEA algorithm evaluates the infiltration differences of immune cells between high/low groups. (b) The correlation diagram between the infiltration level of immune cells and signature (*p < .05; * *p < .01; * * *p < .001; * *p < .0001; not significant p > .05).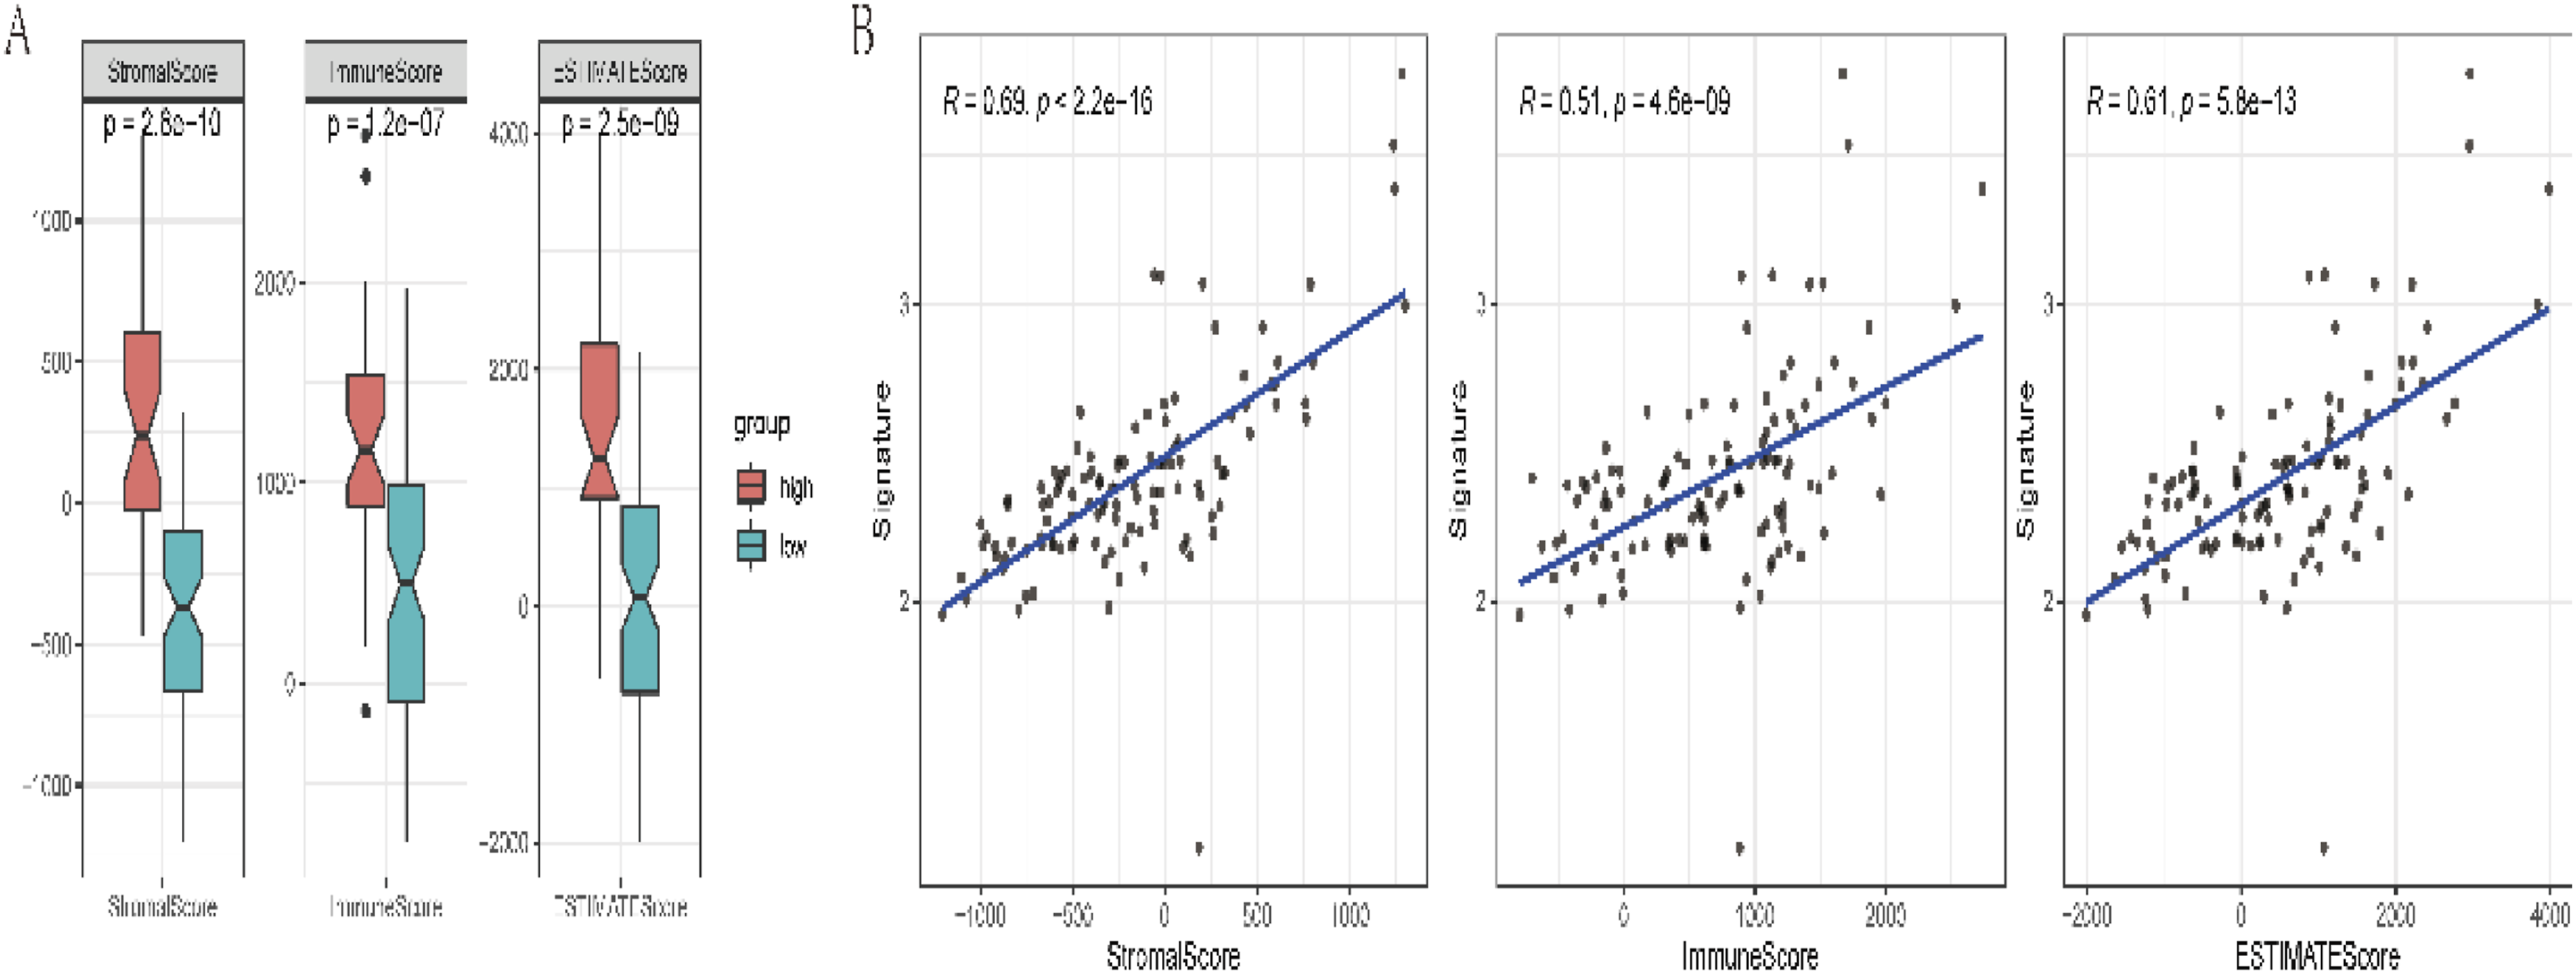

In our study, we conducted a comprehensive assessment of immune checkpoints and associated scores within the high and low-risk groups defined by our signature. We meticulously scrutinized the expression levels of immune checkpoints in both groups. The outcomes, depicted in Figure 16, unveiled significant differences in the expression of most immune checkpoints between the high and low-risk groups. These distinctions underscored the substantial impact of our signature on the immune checkpoint landscape. Additionally, we evaluated Immune Prognostic Scores (IPS) in both groups. Remarkably, significant differences in IPS scores were observed between the high and low-risk groups, highlighting the divergent immunological landscapes associated with our signature. Our analysis extended to exploring the relationship between our signature and Tumor Immune Dysfunction and Exclusion (TIDE) scores. Intriguingly, our findings revealed a notable correlation between the TIDE scores and our signature, shedding light on the potential implications of our signature in the context of tumor immune dysfunction and exclusion. Our study uncovered compelling evidence of the impact of our signature on immune checkpoint expression, IPS scores, and their correlation with TIDE scores within both high and low-risk groups. These findings deepen our understanding of the immune response dynamics associated with our signature and its potential relevance to immunotherapy strategies. (a) Box plot of the expression distribution of immune checkpoint genes between signature groups. (b) Differences in IPS scores between signature groups. (c) Correlation analysis between the TIDE score and signature.
Our investigation extended to assess the potential relevance of our signature in predicting prognosis and treatment response in immunotherapy patients. To do so, we scrutinized its prognostic impact in the IMvigor210 cohort, which provides immunotherapy data for bladder cancer. Employing the optimal threshold determined for our signature, we segregated patients into high and low-risk groups. Strikingly, our analysis revealed a substantial difference in the survival prognosis of bladder cancer patients associated with our signature (p = .046), as delineated in Figure 17(A). This finding underscores the signature’s potential utility in predicting patient outcomes in the context of immunotherapy for bladder cancer. Equally noteworthy, our investigation assessed the treatment response of patients to immunotherapy. Once again, our signature emerged as a potent predictor, as evidenced by a highly significant difference in patient responses following immunotherapy (p < .0001), as depicted in Figure 17(B). Importantly, the majority of patients in the high-risk group displayed favorable responses, specifically achieving Complete Response (CR) or Partial Response (PR), as depicted in Figure 17(C). These findings collectively highlight the potential of our signature to serve as a valuable tool in forecasting patient prognosis and therapeutic response in the realm of immunotherapy for bladder cancer. Signature survival prognosis curve (a) of the bladder cancer dataset (IMvigor210). Analysis of differences in the signature among different treatment response groups (B, * * * * *p < .0001). Histogram of the proportion of response (c).
In our comprehensive assessment, we diligently calculated the expression levels of CD8A and PD-L1, examined differences in pivotal immunotherapy predictive markers including Tumor Mutational Burden (TMB), Homologous Recombination Deficiency (HRD), and Tumor Immune Dysfunction and Exclusion (TIDE), and conducted correlation analyses among the signature-defined groups, as depicted in Figure 18. Notably, our analysis disclosed that the low-risk group exhibited higher TMB and HRD levels. Intriguingly, these findings unveiled a negative correlation between our signature and both TMB and HRD. This suggests that our signature is associated with lower TMB and HRD, indicating distinct genomic characteristics in the low-risk group. Equally significant, our investigation indicated that the low-risk group displayed a lower TIDE score, which was positively correlated with our signature. This observation suggests that our signature holds potential as a valuable marker for assessing the potential benefits of immunotherapy. The positive correlation with TIDE score underscores the potential of our signature to predict improved treatment responses and reduced immune dysfunction and exclusion. Our study highlights the relevance of our signature in relation to critical immunotherapy predictive markers. It not only reflects differences in TMB, HRD, and TIDE score between risk groups but also underscores the potential utility of our signature as a promising marker for evaluating the potential advantages of immunotherapy interventions. Differences in CD8A/PD-L1 expression levels, TMB, HRD, TIDE, and other immunotherapy predictive markers (a); and correlation (b) analysis results between signature groups.
In our study, we delved into the intricate realm of chemotherapy drug resistance to discern potential distinctions between distinct groups defined by our signature. We began by accessing crucial data from the GDSC database (https://www.cancerrxgene.org), specifically drug sensitivity data (IC50) and gene expression data. Subsequently, we diligently calculated the signature for each sample within the dataset and classified them into high and low-risk groups based on the median signature value. To explore the interplay between our signature and drug sensitivity data (IC50), we harnessed Spearman’s correlation coefficients. To ascertain the significance of these correlations, we employed the Corrplot package. Our analysis bore fruit in the identification of the top five drugs exhibiting the most robust positive and negative correlations with our signature. These compelling findings were visually represented. Of particular note, we discerned that the sensitivity data (IC50) associated with the five drugs displaying the strongest positive correlation showcased statistical significance when comparing the high and low-risk groups, as depicted in Figure 19(A). In parallel, we extended our analysis to encompass the CCLE database. Here, we once again obtained drug sensitivity data (IC50) and gene expression data. We meticulously calculated the signature for each sample and classified them into high and low-risk groups based on the median signature value. Subsequently, we explored the interplay between our signature and drug sensitivity data (IC50) using Spearman’s correlation coefficients. These correlations were also scrutinized for significance. From this analysis, we identified the top five drugs exhibiting the most pronounced positive and negative correlations with our signature, visually representing these findings. Of particular significance, the sensitivity data (IC50) of the two drugs manifesting the most potent negative correlations exhibited statistical significance between the high and low-risk groups, as depicted in Figure 19(B). In essence, our study unveiled intricate insights into chemotherapy drug resistance across different signature-defined groups, leveraging two distinct datasets (GDSC and CCLE) to bolster our understanding of potential implications for chemotherapy response associated with our signature. Correlation analysis between signature and drug sensitivity data (IC50) in GDSC (a) and CCLE (b) databases and their differences in the high and low groups (*p < .05; * *p < .01; * * *p < .001; * * *p < .0001; not significant p > .05).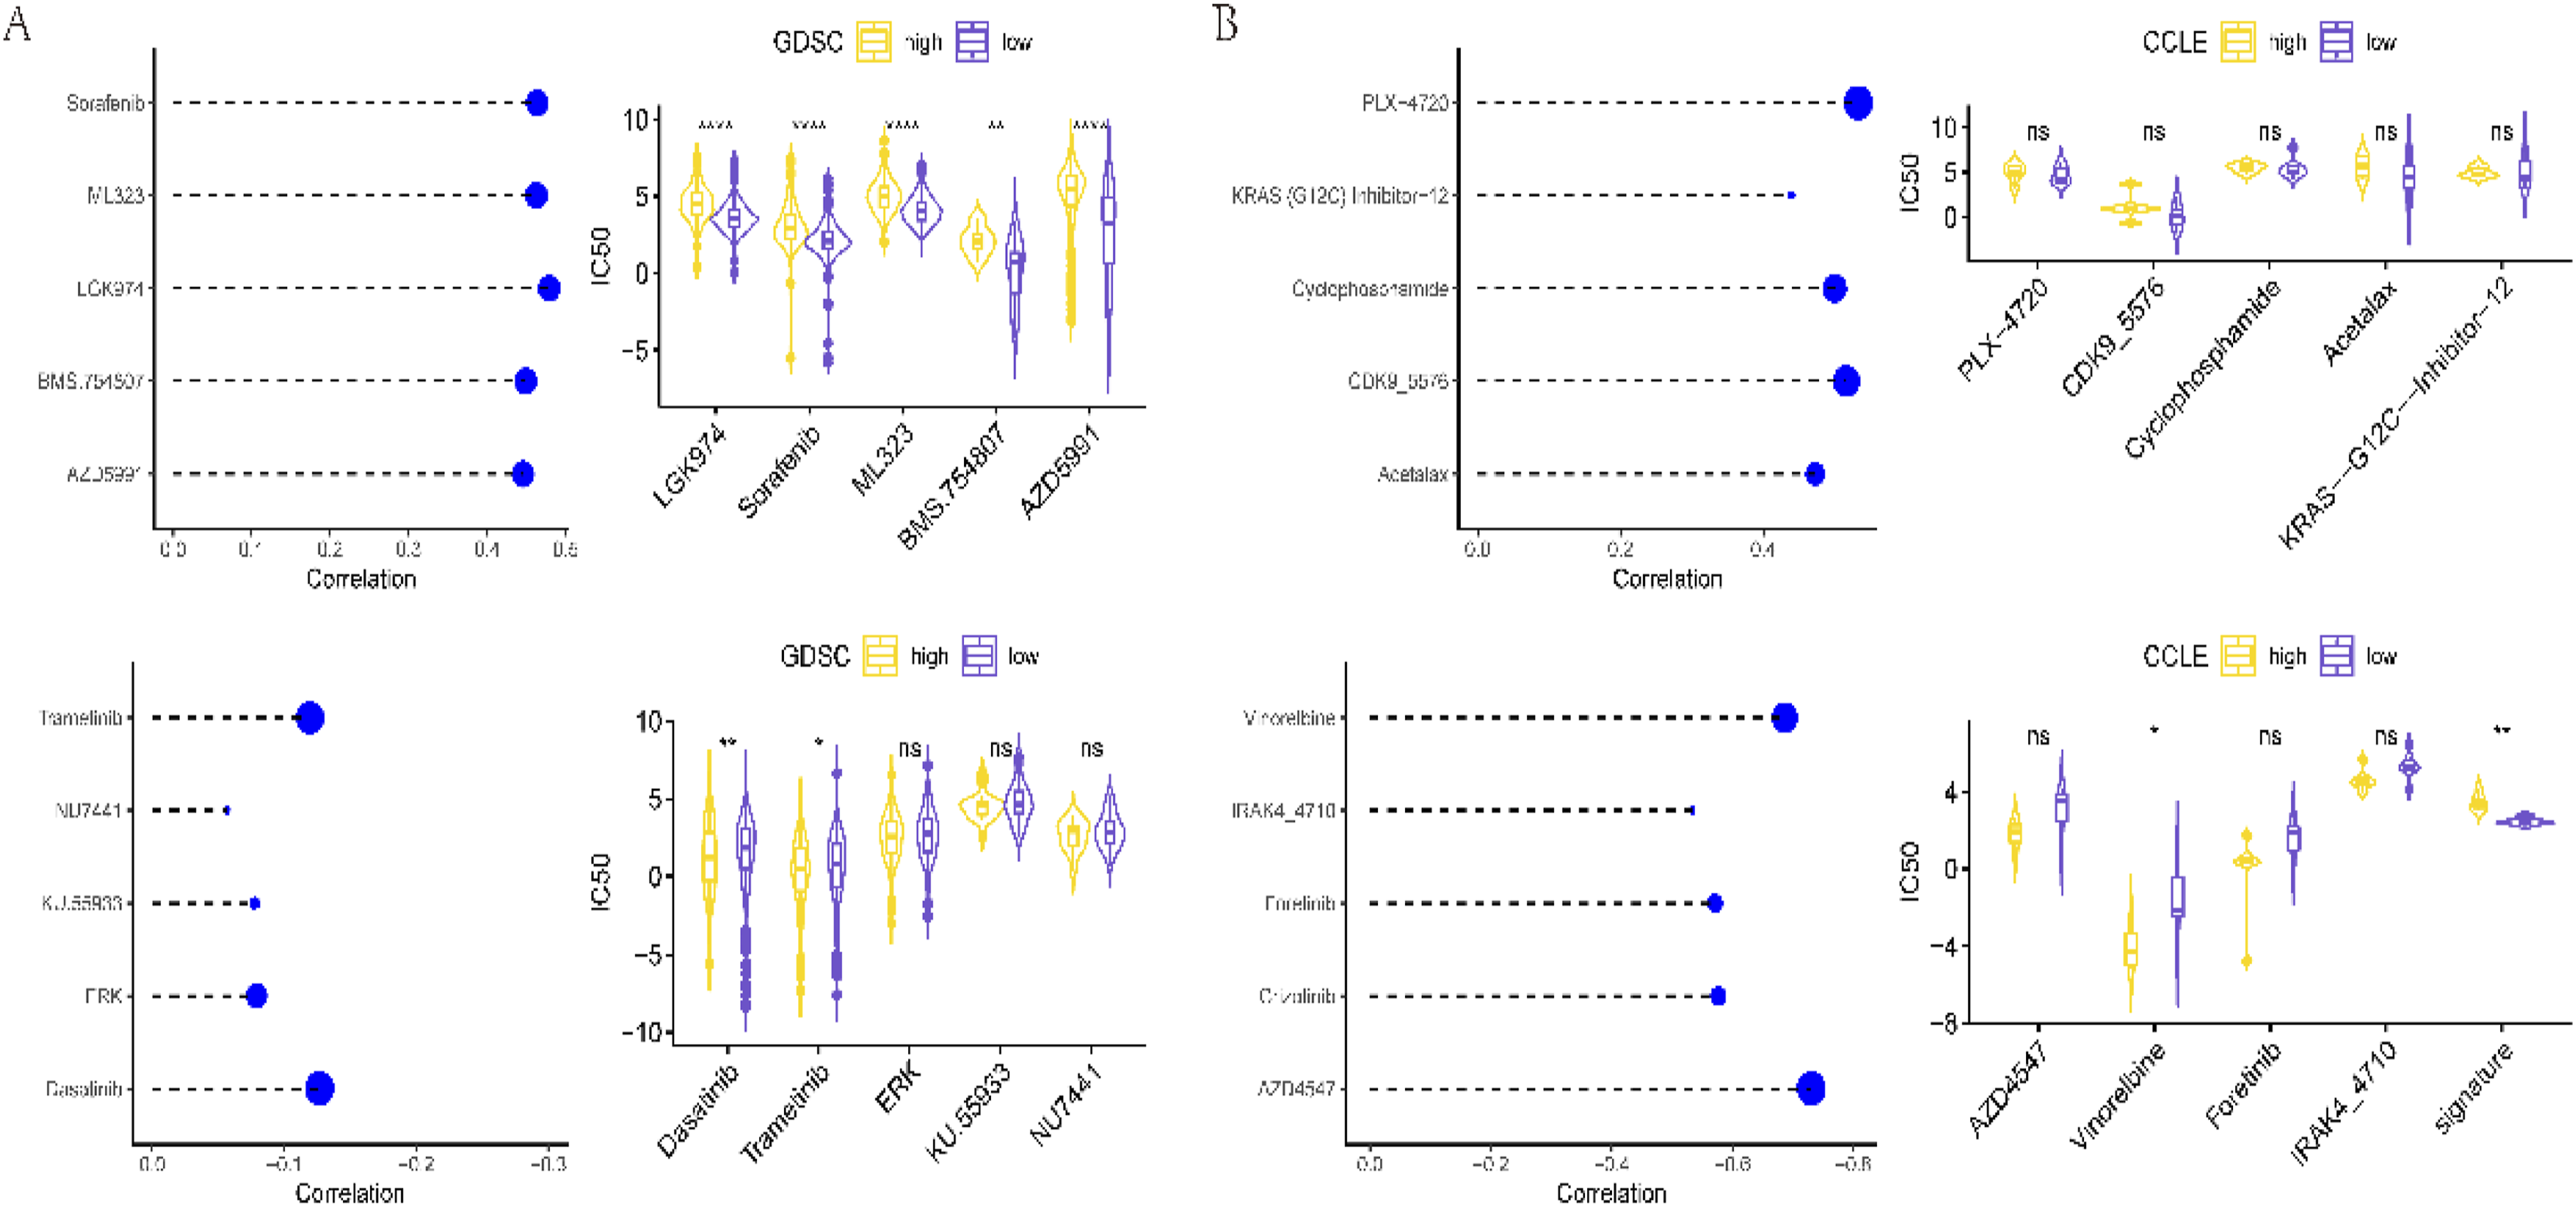
Immunohistochemical results
In our study, we embarked on immunohistochemical analyses of tissue samples obtained from a cohort of 104 patients diagnosed with glioblastoma (GBM). These analyses involved the meticulous scoring of immunohistochemical staining based on established evaluation criteria. Upon conducting rigorous analyses, our investigation yielded compelling outcomes through ROC curve analysis. This analytical approach enabled us to identify an optimal cut-off value for the immunohistochemical scores, which was determined to be 9.5 (p < .001). With this critical cut-off value in hand, we stratified the patients into two distinct groups: the High expression group (comprising individuals with scores ≥9.5) and the Low expression group (encompassing patients with scores <9.5). Our classification process allocated 64 patients to the high expression group and 40 patients to the low expression group. Furthermore, we thoughtfully selected one representative case from high expression group to vividly illustrate our results, as visually depicted in Figure 20. To assess the prognostic implications of this immunohistochemical stratification, we employed the Log Rank (Mantel-Cox) test within the framework of the Kaplan–Meier method. Our analysis of overall survival (OS) revealed a notable difference, with the high-expression group exhibiting a significantly lower OS compared to the low-expression group (p < .05), as illustrated in Figure 21. These findings underscore the potential of our risk models in predicting prognosis among glioblastoma patients following radiotherapy. In essence, our study demonstrates the promise of immunohistochemical analyses and risk modeling as valuable tools for prognostic assessment in the context of glioblastoma management after radiotherapy. Immunohistochemical results of a patient in the high expression group (a): positive expression of FN1, score4; (b): positive expression of PLAUR, score0; (c): positive expression of SDC-1, score9; (d): negative expression of CXCL‐13, score0). (Microscope 40.0x). Relationship between signature expression level and OS.

Discussion
The physiological structure of the central nervous system has unique characteristics, with a blood–brain barrier between it and the circulatory system and a lack of general lymphatic drainage, resulting in structural isolation and relatively blocked material exchange.23,24 Under normal physiological conditions, the levels of intercellular adhesion molecules in endothelial cells that form the blood–brain barrier are relatively low. Peripheral immune cells can only migrate to the perivascular space of the central nervous system and cannot enter the brain parenchyma. However, the central nervous system is not an “immune exemption zone,” as there is a rich lymphatic network in the dura mater that can absorb and transport cerebrospinal fluid to the deep cervical lymph nodes, known as the cerebral lymphatic system. 25 Antigen-presenting cells present antigens to T lymphocytes in the cervical lymph nodes through the brain lymphatic system. Under pathological conditions, immune cells can react with interferon-γ. Under the leading chemotaxis, it is guided to the brain parenchyma, and tumor-infiltrating lymphocytes can be seen in the glioblastoma tissue samples to confirm this view. 26 In addition, the binding of immunoglobulin to the neonatal Fc receptor can cross the blood–brain barrier under carrier-mediated transport. The inherent blood–brain barrier, coupled with low immunogenicity, will restrict the body to produce an effective immune response, making it have an extremely complex immune microenvironment.27,28 Thus, treatment must overcome substantial challenges. Radiation therapy will induce immune activation but also immunosuppression. The imbalance of immune cell infiltration in the tumor microenvironment will help the tumor progress. Therefore, identifying genes related to immune characteristics after radiotherapy may help improve the treatment of glioblastoma.
In this study, we first analyzed 22 types of immune cell infiltration and found a significant correlation between central memory CD8+T cells and poor prognosis. Then, we identified genes significantly associated with it, including SDC-1, PLAUR, FN1, and CXCL13. Multiligand proteoglycan-1 (SDC-1) is one of the leading members of heparan sulfate proteoglycan, which regulates metabolism, transportation, and information transmission. SDC-1, through its extracellular segment of the heparan sulfate chain, binds to various ligands and participates in corresponding cellular signal transduction, playing an essential role in tumor occurrence and development. The expression of SDC-1 in cells has been found in various types of tumors.29–31 For example, SDC-1 is often found to be highly expressed in invasive breast cancer. SDC-1 will regulate fibronectin production through integrin and then change cell morphology, leading to invasion and metastasis of breast cancer.32,33 PLAUR, also known as uPAR, is a glycated single-chain protein rich in cysteine with a relative molecular weight of 50,000 to 60,000 g/mol. It is a glycolipid anchored receptor that fibroblasts, monocytes, neutrophils, epithelial cells, tumor cells, etc. can synthesize. In wound healing, tissue reconstruction, injury repair, and tumor tissue, the expression of PLAUR on the cell surface is upregulated when immune activation occurs. Some studies have used the TCGA dataset to mine the available RNAseq expression data of the PLAUR gene in breast cancer and colon cancer patients and extracted relevant genome and clinical data for analysis. The level of uPAR is significantly related to white blood cell count and fibrinogen and is significantly increased in patients with advanced diseases, including metastatic diseases. In the TCGA lung cancer cohort, PLAUR expression was significantly correlated with progression-free survival shortening in univariate and multivariate analyses. 34 FN1, a glycoprotein in the form of soluble dimers in plasma, is involved in embryogenesis, wound healing, coagulation, host defense, and tumor metastasis. The expression of FN1 is upregulated in many tumors and plays a significant role in the metastasis microenvironment in many tumors. Some studies have shown via immunohistochemical analysis of head and neck tumor tissue samples that the overexpression of FN1 is related to the trend of a significantly reduced overall survival rate.35,36 CXCL13 is a chemokine ligand highly expressed in activated germinal center helper T cells. CXCL13 first entered the view of scientists in an article published in Cell in 2019. In this study, the author found that CXCL13 is specifically overexpressed on depleted T cells, and its role in T cells has been highlighted for the first time, serving as a depleted marker for T cells.37,38 It has been confirmed that it can serve as a marker for immunotherapy response in various tumors. However, its relationship with tumor occurrence, development, treatment response, and prognosis is still unclear, and further research is needed.39–42
Based on these four genes, we constructed signatures. Recently, many studies have shown that tumor patients can benefit from immunotherapy, and prognostic signatures based on immune characteristics have become a research focus for predicting cancer risk.43–46 Our research results show that the constructed signature scoring system has better prognostic effects. In contrast, high-risk groups have poorer prognoses, which have also been validated in external independent validation sets. It was found that there are statistically significant differences in StromalScore, ImmunoScore, and ESTIMATEScore between high-risk and low-risk groups, indicating significant differences in the expression, IPS score, and TIDE score of most immune checkpoints between the high-risk and low-risk groups. Together, the above results suggest that the signature is a potential marker for evaluating the benefits of immunotherapy. Then, we calculated the expression levels of CD8A/PD-L1, differences in immunotherapy predictive markers such as TMB, HRD, and TIDE, and correlation analysis between signature groups. We found that the low-risk group had higher TMB and HRD, and the signature was negatively correlated with TMB and HRD. The low-risk group had a lower TIDE score, and the signature was positively correlated with the TIDE score, indicating that the signature is a potential marker for evaluating the benefits of immunotherapy. Finally, we conducted a correlation analysis between the signature and drug sensitivity data in GDSC and CCLE databases, which may help guide the chemotherapy and targeted treatment of glioblastoma.
Previously, Nassani et al. (2023) emphasized the proposition of molecular signatures for predicting GBM prognosis, aiming to enhance clinical decisions, GBM management, and drug development. 47 Conversely, Zheng et al. (2023) highlighted the unveiling of transcriptional heterogeneity in glioblastoma and established a significant connection between spatial cellular architecture and clinical outcomes. 48 In contrast, our Study identifies central memory CD8 + T cell-related genes and establishes a robust signature with predictive value for glioblastoma patients. This signature holds promise for guiding immunotherapy, chemotherapy, and targeted treatment decisions and underscores the necessity for further research to explore underlying mechanisms and validate drug sensitivities in glioblastoma tissues. Moreover, the findings contribute to personalized glioblastoma management by integrating clinical characteristics such as molecular subtyping and IDH1 mutation status. The present study emphasis on identifying specific genes related to central memory CD8 + T cells and constructing a prognostic signature represents a novel contribution to the field. Unlike the previous studies, which focus on broader molecular signatures or transcriptional heterogeneity, this study offers a targeted approach with potential implications for personalized treatment strategies in glioblastoma management. Further exploration of underlying mechanisms and validation efforts are crucial avenues for future research, underscoring the study’s commitment to advancing understanding and clinical management of glioblastoma.
Our research has certain limitations. Firstly, whether and how these four genes (SDC-1, PLAUR, FN1, and CXCL13) affect the activation of central memory CD8+T cells has not been further studied, and the sensitivity of glioblastoma tissue to chemotherapy and targeted drugs also needs further verification. The signature constructed by the four essential genes (SDC-1, PLAUR, FN1, and CXCL13) related to the level of the central memory CD8+T cell has significant prognostic value for predicting the survival and recurrence of glioblastoma patients, as well as guiding immunotherapy, chemotherapy, and targeted chemotherapy for glioblastoma. Our research may provide valuable clues for guiding treatment decisions based on the clinical characteristics of glioma tumors, such as molecular typing and IDH1 mutation status, ultimately promoting personalized management of glioma. One limitation of this study is the absence of power analysis for sample size calculation. Although the dataset comprised 124 cases of adult patients receiving radiotherapy, the study did not systematically assess the statistical power to detect meaningful effects or associations. As such, the generalizability and robustness of the findings may be influenced by the sample size adequacy. Future research endeavors should consider incorporating power analysis methodologies to enhance the reliability and validity of results.
Conclusion
Our study identifies central memory CD8 + T cell-related genes (SDC-1, PLAUR, FN1, and CXCL13) and constructs a robust signature with predictive value for glioblastoma patients. This signature shows potential for guiding immunotherapy, chemotherapy, and targeted treatment decisions. While promising, further research is needed to explore underlying mechanisms and validate drug sensitivities in glioblastoma tissues. Our findings contribute to personalized glioblastoma management, considering clinical characteristics like molecular subtyping and IDH1 mutation status.
Highlights of the study
The study highlights the identification of crucial genes associated with central memory CD8 + T cells, leading to the development of a robust prognostic signature for glioblastoma patients. This signature’s effectiveness was validated across independent datasets, and significant differences in immune characteristics were observed between risk groups. Moreover, correlations with immunotherapy markers suggest potential for guiding treatment decisions in glioblastoma.
Limitations of the study
However, the study has limitations, including the absence of a detailed exploration of the mechanisms underlying the impact of critical genes on central memory CD8 + T cell activation. Additionally, there is a need for further validation of drug sensitivity in glioblastoma tissues.
Future research directions
Future research should focus on the specific mechanisms by which these essential genes influence central memory CD8 + T cell activation and validate drug sensitivity in glioblastoma tissues. Exploring the signature’s utility for different molecular subtypes and IDH1 mutations and investigating its role in guiding tailored immunotherapy approaches are promising directions for further study.
Footnotes
Author’s contribution
Hui Wu contributed to the conception of the study. Rong Huang contributed significantly to analysis and manuscript preparation. Rong Huang performed the data analyses and wrote the manuscript. Xiaoxu Lu and Xueming Sun helped perform the analysis with constructive discussions. All authors reviewed the manuscript.
Declaration of conflicting interests
The author(s) declared no potential conflicts of interest with respect to the research, authorship, and/or publication of this article.
Funding
The author(s) declared the following potential conflicts of interest with respect to the research, authorship, and/or publication of this article: This study was supported by the 2021 Science and Technology Development Plan Project of Henan Province (212102310663).
Ethical statement
Informed consent
Written informed consent was obtained from all subjects before the study.
Data availability statement
Data sharing not applicable to this article as no datasets were generated or analyzed during the current study.