
Abstract
Objectives
This study aimed to explore the unique transcriptional feature of fibroblasts subtypes and the role of ferroptosis in diabetic foot ulcers (DFUs).
Methods
The GEO (Gene Expression Omnibus) was searched to obtain the DFUs single-cell and transcriptional datasets. After identifying cell types by classic marker genes, the integrated single-cell dataset was used to run trajectory inference, RNA velocity, and ligand-receptor interaction analysis. Next, bulk RNA-seq datasets of DFUs were analyzed to the key ferroptosis genes.
Results
Here, we profile 83529 single transcriptomes from the foot samples utilizing single-cell sequencing (scRNA-seq) data of DFU from GEO database and identified 12 cell types, with fibroblasts exhibiting elevated levels of ferroptosis activity and substantial cellular heterogeneity. Our results defined six main fibroblast subsets that showed mesenchymal, secretory-reticular, secretory-papillary, pro-inflammatory, myogenesis, and healing-enriched functional annotations. Trajectory inference and cell-cell communication analysis revealed two major cell fates with subpopulations of fibroblasts and altered ligand-receptor interactions. Bulk RNA sequencing data identified CGNL1 as a distinctive diagnostic signature in fibroblasts. Notably, CGNL1 positively correlated with pro-inflammatory fibroblasts.
Conclusions
Overall, our analysis delineated the heterogeneity present in cell populations of DFUs, showing distinct fibroblast subtypes characterized by their own unique transcriptional features and enrichment functions. Our study will help us better understand DFUs pathogenesis and identifies CGNL1 as a potential target for DFUs therapies.
Introduction
Diabetic foot ulcers (DFUs) are a devastating complication of diabetes mellitus, representing one of the most prevalent types of chronic wounds, and can lead to severe disability. 1 If left untreated, most DFUs will eventually progress into soft tissue infection, gangrene, and lower extremity amputations, significantly diminishing the affected individuals’ quality of life, impaired physical function, and increased healthcare utilization.2–4 Approximately 50% of DFUs become infected, with up to 20% of these requiring prolonged hospitalization, and between 15% and 20% of hospitalized patients undergo a lower extremity amputation.5,6 Alarmingly, DFUs presently account for 85% of lower extremity amputations in the USA, 2 with an estimated direct treatment cost of US$200 billion annually. 7 Moreover, people with DFUs have a 16.7% mortality rate at 12 months, and have a 5-years mortality rate greater than 70% for people with an above-foot amputation, surpassing those of most cancers.8,9 DFUs are multifactorial and dynamic, involving a combination of neuropathy, ischemia, infection, impaired immune function, cell death, and peripheral vascular problems, all of which contribute to poor wound healing.10–12 Management of DFUs typically involves the use of anti-inflammatory agents and antibiotics, but these therapies have demonstrated only moderate effectiveness in promoting wound healing. 13 Now, it is well established that many different types of cell death are involved in the pathogenesis of DFUs, but ferroptosis has not been extensively studied. 14
Ferroptosis is a newly identified mode of cell death: an iron-dependent, non-apoptotic form of programmed cell death characterized by intracellular accumulation of reactive oxygen species (ROS) and lipid peroxides. 15 Ferroptosis has become the research hotspot in the field of DFUs. Recent studies have implicated that the ferroptosis-related gene TP53 plays a significant role in the pathogenesis of DFUs and can serve as a potential biomarker. 16 Long-term hyperglycemia elevates the expressions of lipid peroxidation products, ROS, and ferroptosis-associated proteins, potentially contributing to DFUs with persistent non-healing properties. 17 Feng and colleagues have demonstrated that the ferroptosis inhibitor ferrostatin-1 significantly reduces the expression of oxidative stress and inflammation markers in DFUs. 18 Intriguingly, prophylactic application of ferroptosis inhibitor ferrostatin-1 prevents the formation of wounds. Increased levels of free iron in plasma also contribute to oxidative stress and ferroptosis. 19 Increasing evidence suggests that ferroptosis and ferritinophagy exist in DFUs due to iron overload caused by iron metabolism pathway disorder.20–22 Nevertheless, the precise molecular mechanism underlying ferroptosis in DFUs still requires further exploration.
The rapid advancement of single-cell RNA sequencing (scRNA-seq) has emerged as a valuable tool for understanding specific cell populations and gene expression patterns in skin wounds.23–25 To uncover how ferroptosis functions in the development of DFUs, we collected previous scRNA-seq data 24 to characterize the DFUs transcriptomic landscape at single-cell resolution among control, diabetic, DFU-healer, and DFU-Non-healer groups. Using a variety of state-of-the-art analytical tools, we identified cellular abundance, functional variations, metabolic changes, trajectory dynamics, and ligand-receptor interactions in the major wound healing state of DFUs. Additionally, we found distinct fibroblast subtypes characterized by unique compositional and transcriptional differences, and enrichment functions. We also displayed CGNL1, as a ferroptosis-related gene, positively correlated with pro-inflammatory fibroblasts. Our study will help us better understand DFUs pathogenesis and identify CGNL1 as a potential target for DFUs therapies.
Materials and methods
Data acquisition
The scRNA-seq dataset GSE165816 24 and three bulk transcriptomic cohorts (GSE143735, GSE80178, and GSE134431 26 ) were retrieved from the NCBI GEO database (https://www.ncbi.nlm.nih.gov/geo/). The GSE165816 expression profile comprised 11 healthy normal tissues, 8 diabetic subjects, and 14 patients with DFUs (Healer; n = 9, Non-healer; n = 5). The GSE143735 dataset consisted of 4 healthy controls, 5 DFUs-Healer, and 4 DFUs-Non-healer. The GSE80178 expression profile comprised 6 DFUs and 3 normal skin tissues. The GSE134431 dataset encompassed 13 DFUs and 8 Diabetic foot skin (DFS). Detailed information is depicted in Supplemental Table S1. Ferroptosis-related genes, containing 259 ferroptosis signature genes, were retrieved from the FerrDb database (https://www.zhounan.org/ferrdb).
scRNA-seq data processing
The raw gene-expression data were transformed into a Seurat object for each one using Seurat (v4.3.0) R package. Single cells that expressed <200 detected genes, or contained >10% percentage of mitochondrial gene counts, and genes expressed <3 least cells were filtered out to exclude low-quality cells. The doublet cells were further identified and removed from the remaining cells using R package DoubletFinder (v2.0.3). 27 The “SCTransform” function was used to normalize and scale data, and identify 3000 highly variable genes (HVGs). After performing PCA analysis using HVGs, the first 20 principal components and a resolution of 0.6 were selected for the following cluster analysis and visualized dimensionality reduction by uniform manifold approximation and projection (UMAP). The “FindCluster” function was used for all cell cluster analysis with the resolution set to 0.6. The Wilcox algorithm was used to analyze the differential expression between cells in each cluster with the criteria average log (fold change) of >0.25 and p-value <.01 using the “FindAllMarkers” function.
Assessing the scores of ferroptosis activity
The signature genes of ferroptosis are provided in Supplemental Table S1. AUCell analysis with the default settings was used to calculate the ferroptosis activity scores in major cell populations in AUCell package. AUCell was used to assess whether certain gene sets were enriched within the top 5% or 10% expressed genes for each cell. Briefly, gene expression rankings of each cell were generated based on the area under the curve (AUC) value of the selected ferroptosis signature genes, to estimate the proportion of highly expressed gene sets in each cell. Cells expressing more genes within the gene set had higher AUC values. The “AUCell_exploreThresholds” function was used to determine the threshold for identifying gene set active cells.
scMetabolism analysis
Metabolic states were analyzed using the scMetabolism package, which applied the VISION algorithm to calculate the metabolic activity score of each cell in 80 metabolic pathways with default parameters. KEGG pathways and Reactome entries were pre-populated in the scMetabolism software. We also compared the metabolic scores of each cluster using a Wilcoxon rank-sum test with the Bonferroni–Hochberg procedure. The “DotPlot.metabolism” function was employed for visualization.
Assessing the heterogeneity of single-cell populations
We compared the heterogeneity of cell types using ROGUE package 28 with the default parameter settings for recommended pipelines in this study. The ROGUE index is scaled from zero to one. One represents a completely pure subtype with no significant genes, and zero represents the population’s most heterogeneous state.
Developmental trajectory inference
We subclustered fibroblasts based on known fibroblast-specific markers. To infer the pseudotime trajectories of fibroblast subpopulations, we used Monocle 29 and CytoTRACE 30 algorithms to identify pseudotime-dependent gene expression changes. Before Monocle analysis, we selected marker genes from the Seurat clustering result and raw expression counts of the cell that passed filtering. The “subset” function of Seurat was used to separate the fibroblast clusters, and the “newCellDataSet” function of Monocle was used to construct a CellDataSet object with the “lowerDetectionLimit” parameter set to 0.5. We adopted a method recommended by Monocle to identify ordering genes with a high degree of dispersion (mean_expression>=0.01). These ordering genes were used to reduce the dimensions using the “DDRTree” method in the “reduceDimension” function. The functions “plot cell trajectory” and “plot genes in pseudotime” were used for visualization after ordering cell. CytoTRACE analysis was also performed with default settings of recommend pipelines to supplement the fibroblast subsets trajectory analysis using an unsupervised framework, and the results were used to infer the origin of fibroblast subsets. All pseudotime-dependent genes were visualized using a heatmap reflecting the kinetic trends of these genes.
RNA velocity analysis
To measure the transcriptional dynamics and characterize differentiation process based on fibroblast subsets, we performed RNA velocity analysis using the scVelo algorithm. 31 Specifically, the “scv.pp.moments” function was used to compute the moments for each cell with the default parameters of normalized spliced and unspliced counts. The RNA velocity was estimated using the “scvelo.tl.velocity” function with the dynamic mode selected as “stochastic”. Using the “scvelo.tl.velocity graph” function, a velocity graph representing transition probabilities was constructed based on estimated velocities. The RNA velocities were projected onto a computed UMAP for each subset. The streamline velocity vectors represent directions and flow of estimated trajectory and differentiation of the cells.
Ligand-receptor interaction analysis
To comprehensively decipher a systematic cellular crosstalk, we used CellChat Bioconductor package with the default setting of recommended pipelines. 32 CellChat predicts enriched ligand-receptor interactions between two cell types based on the expression of a receptor by one cell type and the expression of a ligand by another cell type. The CellChat results revealed both incoming communication patterns of target cells and outgoing communication patterns of secreting cells. Significant mean and cell communication significance (p < .05) were calculated based on the interaction and the normalized cell matrix achieved by Seurat normalization. CellPhoneDB 33 analysis was performed to evaluate ligand-receptor pairs between fibroblast cell subsets. A normalized expression matrix was used as the input data. Only genes expressed in >10% single cells in at least one cell subgroup were considered in this analysis. The enriched ligand-receptor interactions between two cell subsets were calculated based on a permutation test. We extracted significant ligand-receptor pairs with p-value <.01. The “heatmap_plot” function was used to display the frequency of interactions between two fibroblast cell subsets.
NicheNet analysis
NicheNet 34 is a powerful approach that predicts ligands driving targeted cell transcriptomic changes. The differentially expressed genes were ordered using log2FC in fibro-6 with the threshold adjusted p-value <.05 and log2FC >0.5, and the remaining clusters were treated as potential targets. Genes were considered expressed when they have non-zero values in at least >10% in a cell type. Fibro-6 was used to characterize sender cells, and other cell populations were treated as receivers. The top ligands expressed by one or more sender cells were ranked using the Pearson correlation coefficient combined with ligand-target weights.
Bulk datasets preprocessing and analysis
The raw data of the GSE134431 dataset was processed for WGCNA analysis and differentially expressed genes (DEGs) analysis using the edgeR package. The heat maps and principal components plots were drawn to visualize the interrelationships among the different samples. The DEGs were identified with the threshold criterion of |log2FC| >1 and adjusted p-value <.05. 35 A microarray-based dataset GSE80178 was used to confirm the analysis results. To evaluate the relative abundance of fibroblast subclusters in the present study, we performed ssGSEA analysis to construct a reference matrix to deconvolute the fibroblast abundances in each patient with default parameters for GSE134431 and GSE143735 datasets.
Candidate diagnostic markers screening by machine learning
To identify the diagnostic markers critical for DFUs, two feature selection methods, the least absolute shrinkage and selection operator (LASSO) algorithm and support vector machine recursive feature elimination (SVM-RFE) algorithm were employed. The procedure is outlined as follows. Firstly, the bulk dataset GSE134431 was divided into the training dataset and internal validation dataset at a ratio of 7:3, and ten-fold cross-validation was employed. Secondly, the LASSO method was applied on the training dataset to detect the genes that contributed the most to the diagnosis of DFUs using ‘glmnet’ R package. The model performance was evaluated by root mean squared error (RMSE) in the internal validation dataset. Genes from the model with the best performance were selected. Furthermore, the SVM-RFE method from the R package ‘e1071’ was adopted for classification analysis of the selected biomarkers in the diagnosis of DFUs. Finally, the intersection of SVM-RFE and the best performance LASSO model was considered as potential diagnostic biomarkers to enhance the reliability of our findings. We evaluated the diagnostic efficacy of these signature genes by calculating the area under the curve (AUC) of the receiver operating characteristic (ROC) curve. An AUC exceeding 0.7 would indicate a favorable diagnostic outcome, suggesting potential utility of these genes in the identification of DFUs.
Weighted gene co-expression network analysis (WGCNA)
To further explore the potential role of fibroblasts in DFUs, the WGCNA package 36 was used to identify the gene modules on the bulk data. The GSE134431 dataset was clustered to determine the existence of remarkable outliers. We categorized samples into high fibro and low fibro groups according to the median expression value of fibroblasts. The co-expression network was developed utilizing the automatic network construction function. Subsequently, the soft threshold was calculated using the “pickSoftThreshold” function to determine the appropriate threshold for module identification. The network adjacency was computed based on squared Euclidean distance, and samples with standardized connectivity values below −2.5 were excluded from further analysis. By setting soft threshold, we aimed to achieve a scale-free topology fit index of 0.75. The modules were ascertained using hierarchical clustering as well as dynamic tree-cut functions. Gene significance as well as module membership were determined to correlate modules with high-expression fibroblasts and low-expression fibroblasts content.
Gene set variation analysis
Gene Set Variation Analysis (GSVA) was conducted with the default setting of recommended pipelines. Differences between different cell groups were calculated with a linear model offered by the limma package.
Correlation analysis between CGNL1 and fibroblasts subsets
Pearson correlation coefficients between CGNL1 and all other genes were calculated to estimate correlation. These coefficients were subsequently arranged in descending order. Genes with an absolute correlation coefficient greater than 0.7 were defined as CGNL1-related genes. Gene Set Enrichment Analysis (GSEA) was performed to assess CGNL1-related pathways and molecular mechanisms using clusterProfiler package. Pearson’s coefficient was used to evaluate the correlation between CGNL1 and fibroblast subclusters identified in scRNA-seq data.
Statistical analysis
All statistical analyses were performed using R (V4.1.2). Results with p < .05 were considered as statistically significant: *p < .05; **p < .01; ***p < .001. t test, Wilcoxon rank sum test, and Kruskal–Wallis test were used where indicated.
Results
Single-cell profiles analysis revealed cellular diversity and heterogeneity of DFUs skin tissue
To dissect cellular heterogeneity and explore the regulatory changes associated with DFUs, we re-analyzed the scRNA-seq dataset GSE165816 of skin specimens from DFUs (Figure 1(a)). After stringent quality control and unsupervised clustering, we retained a total of 83,529 high-quality single cells (31,608 from healthy control subjects, 10,531 from diabetic patients, 24,434 from DFU-Healer patients, and 15,323 from DFU-Non-healer patients). These cells were unbiasedly annotated into 12 distinct cell types: fibroblasts (Fibro), smooth muscle cells (SMCs), vascular endothelial cells (VasEndo), T-lymphocytes (T-lympho), CD14 monocytes (CD14-Mono), differentiated keratinocytes (DiffKera), basal keratinocytes (BasalKera), melanocytes and Schwann cells (Melano/Schwann), sweat and sebaceous gland cells (Sweat/Seba), lymphatic endothelial cells (LymphEndo), B-lymphocytes (B-lympho), and mast cells (Mast) using established canonical markers (Figure 1(b) and (c), Figure S1(a)). T-lymphocytes and mast cells exhibited higher purity, while sweat and sebaceous gland cells and fibroblasts showed higher heterogeneity indicating subclusters in both cells (Figure 1(d)). Pearson correlation analysis revealed fibroblasts and sweat and sebaceous gland cells have their own distinct transcriptional molecular signatures when compared with other cell populations (Figure S1(b)). Comparative analysis of cell type abundance revealed substantial variations in enrichment across groups (Figure 1(e)). All these cell subtypes were shared among four groups, whereas some clusters showed specific enrichment in control and DFU-Healer groups (Figure 1(e)). Statistical analysis showed significant variation in cellular abundance for fibroblasts between diabetic and DFU-Non-healer groups, suggesting decrease of fibroblasts in DFU-Non-healer patients (p < .05, Figure S1(c)). This difference suggests the fibroblasts of diabetic patients transform gradually from control to DFUs. ScRNA-seq overview and identification of major cell types in DFUs. (a) Schematic of the overall study design. (b) UMAP dimensionality reduction plot showing the annotation for cell types. (c) Dot plot showing average expression of known markers in indicated cell types. (d) Boxplot of cell purity for each cell type by ROGUE. (e) Stacked bar plots indicating the proportion of cells across four groups.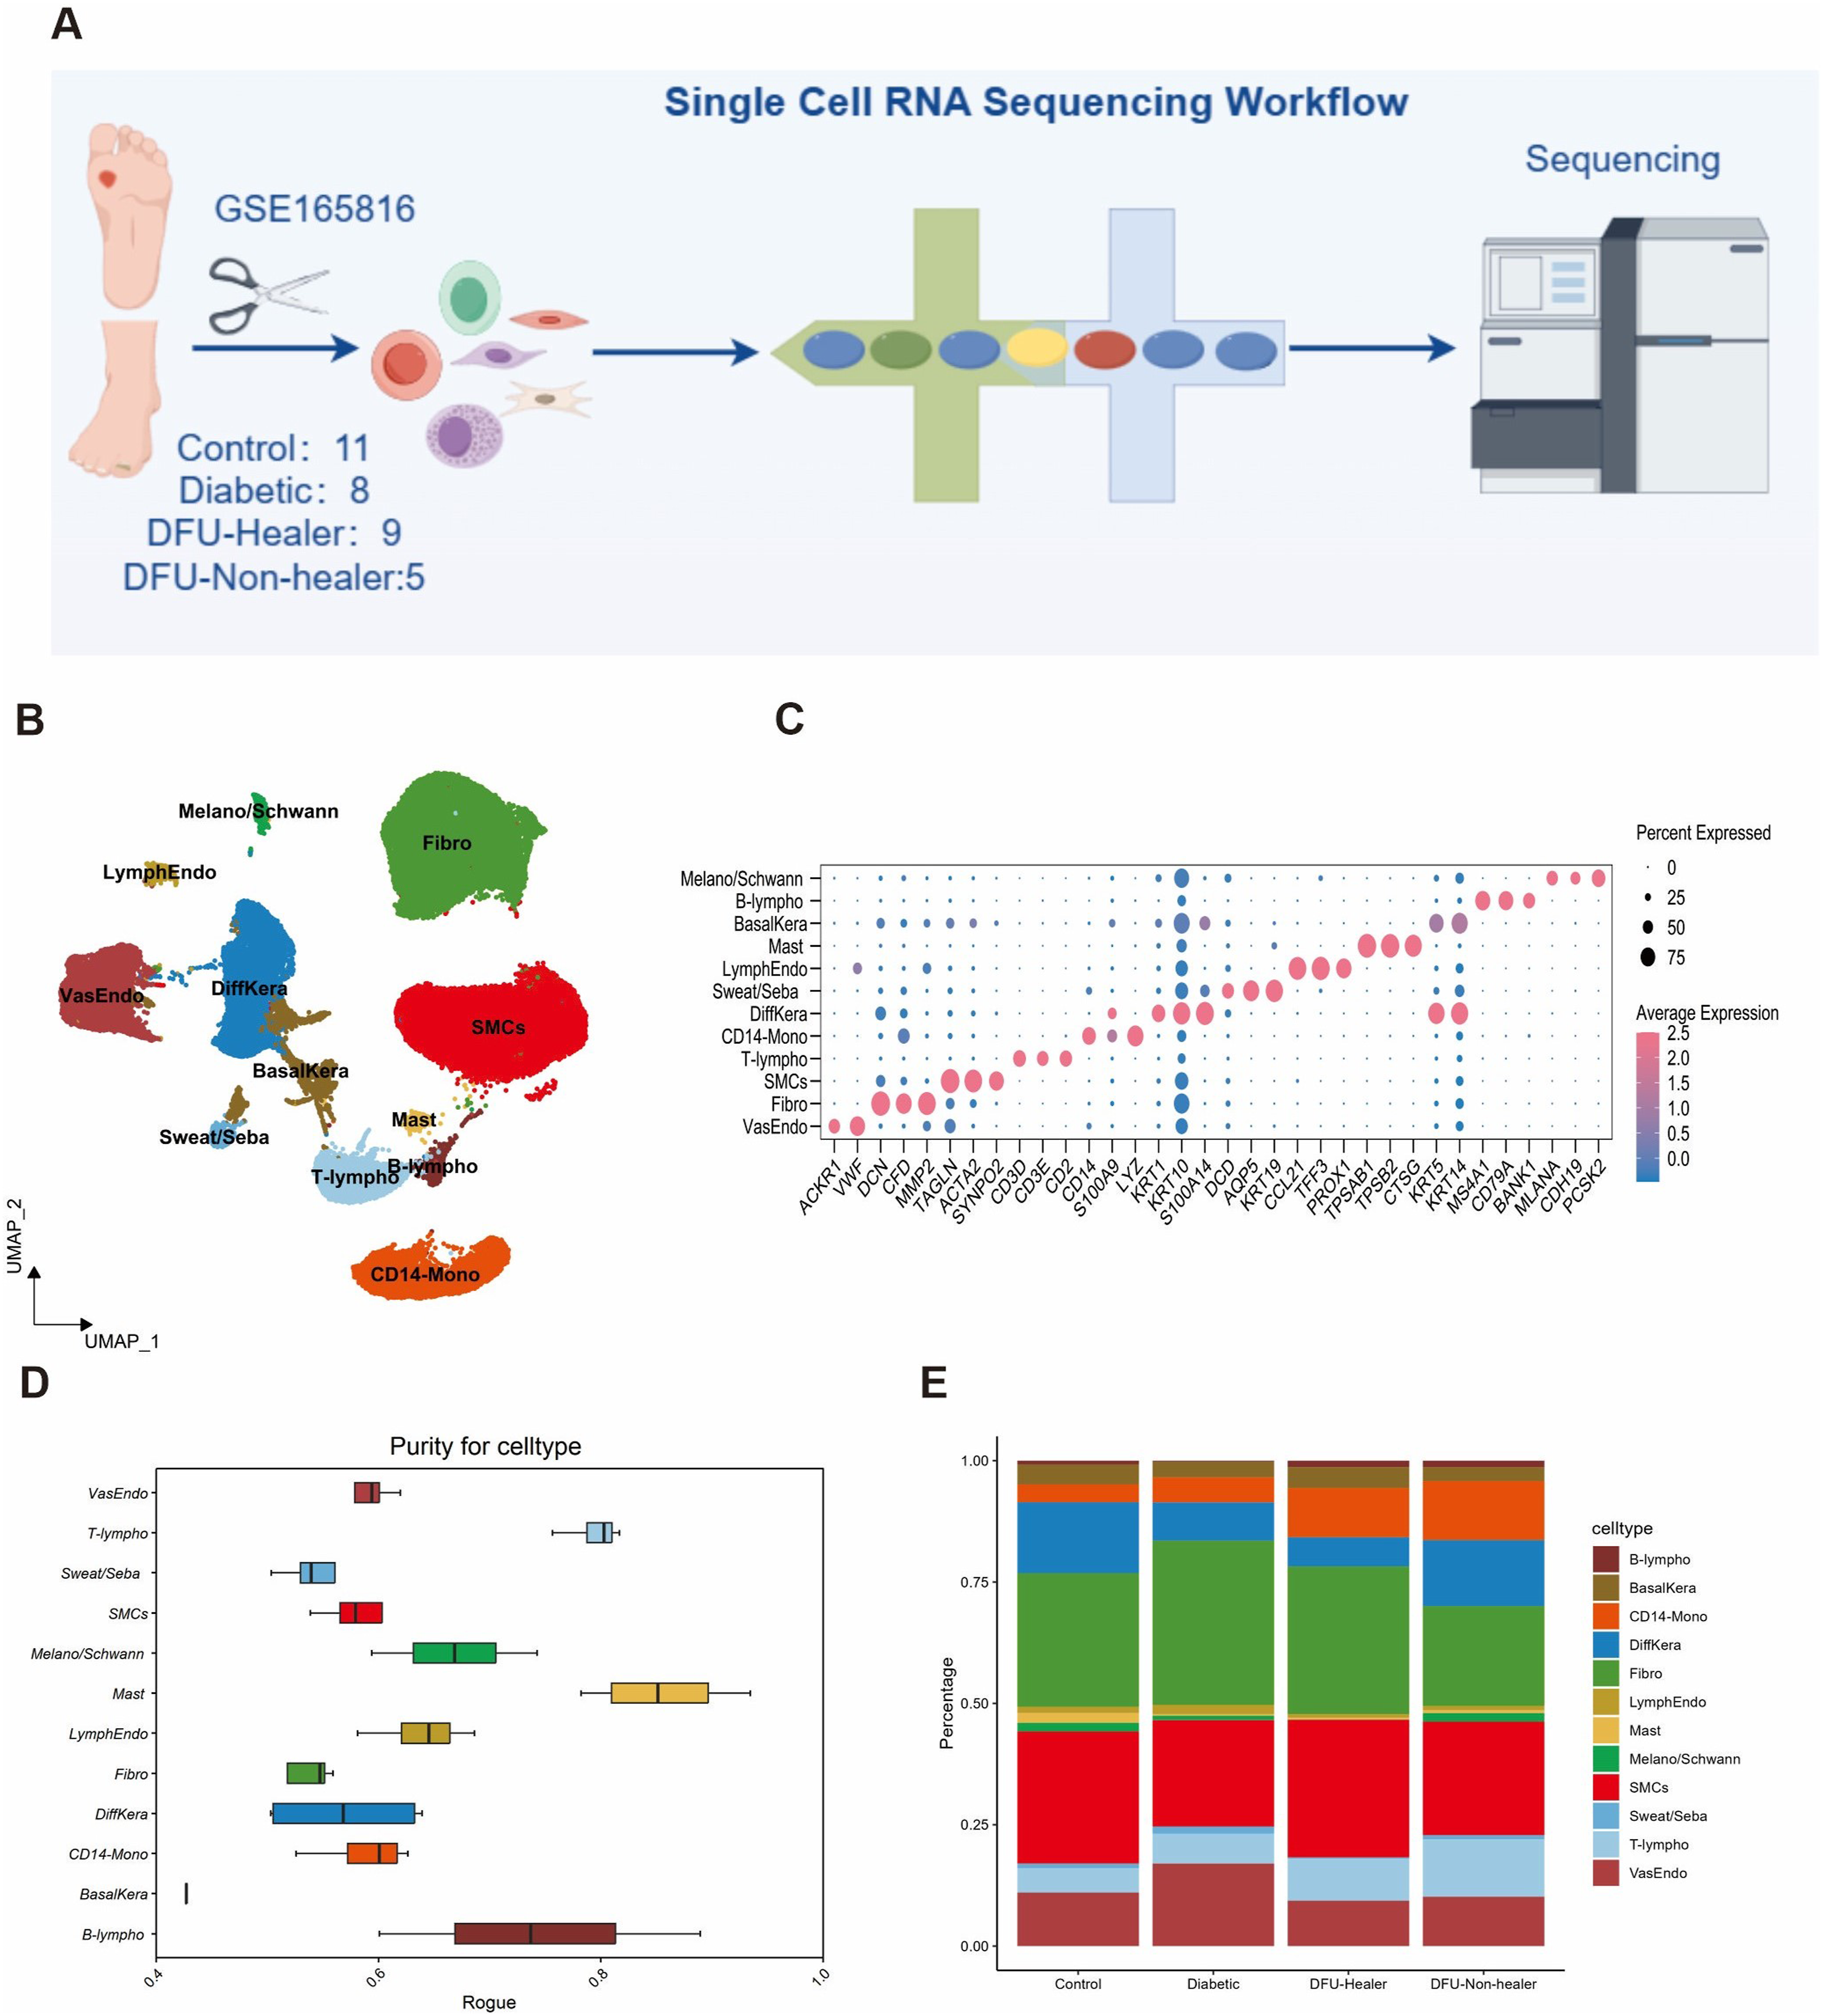
To further dissect the ferroptosis expression pattern of all these populations in DFUs, we performed ferroptosis activity analysis using the AUCell package. CD14-monocytes, basal keratinocytes, and fibroblasts showed higher AUC values compared to other cell types (Figure 2(a)). Due to DFUs leading to metabolic reprogramming during disease progression, we explored the metabolic features across different populations. The results showed that fibroblasts demonstrated higher glutathione metabolism, indicating enhanced resistance to ferroptosis (Figure S2(a)). Overall, our analysis revealed significant heterogeneity in the cellular composition of DFUs, with distinct differences in the abundance and gene expression profiles of different cell types across different stages of the disease. Fibroblasts subcluster into distinct cell populations among four groups. (a) Violin plot of ferroptosis activity scores for specified cell type. (b) UMAP plot further identify 6 fibroblast subclusters. (c) Violin plot of molecular signatures for the 6 fibroblast subclusters. (d) Stacked bar plots indicating the proportion of cells across four groups.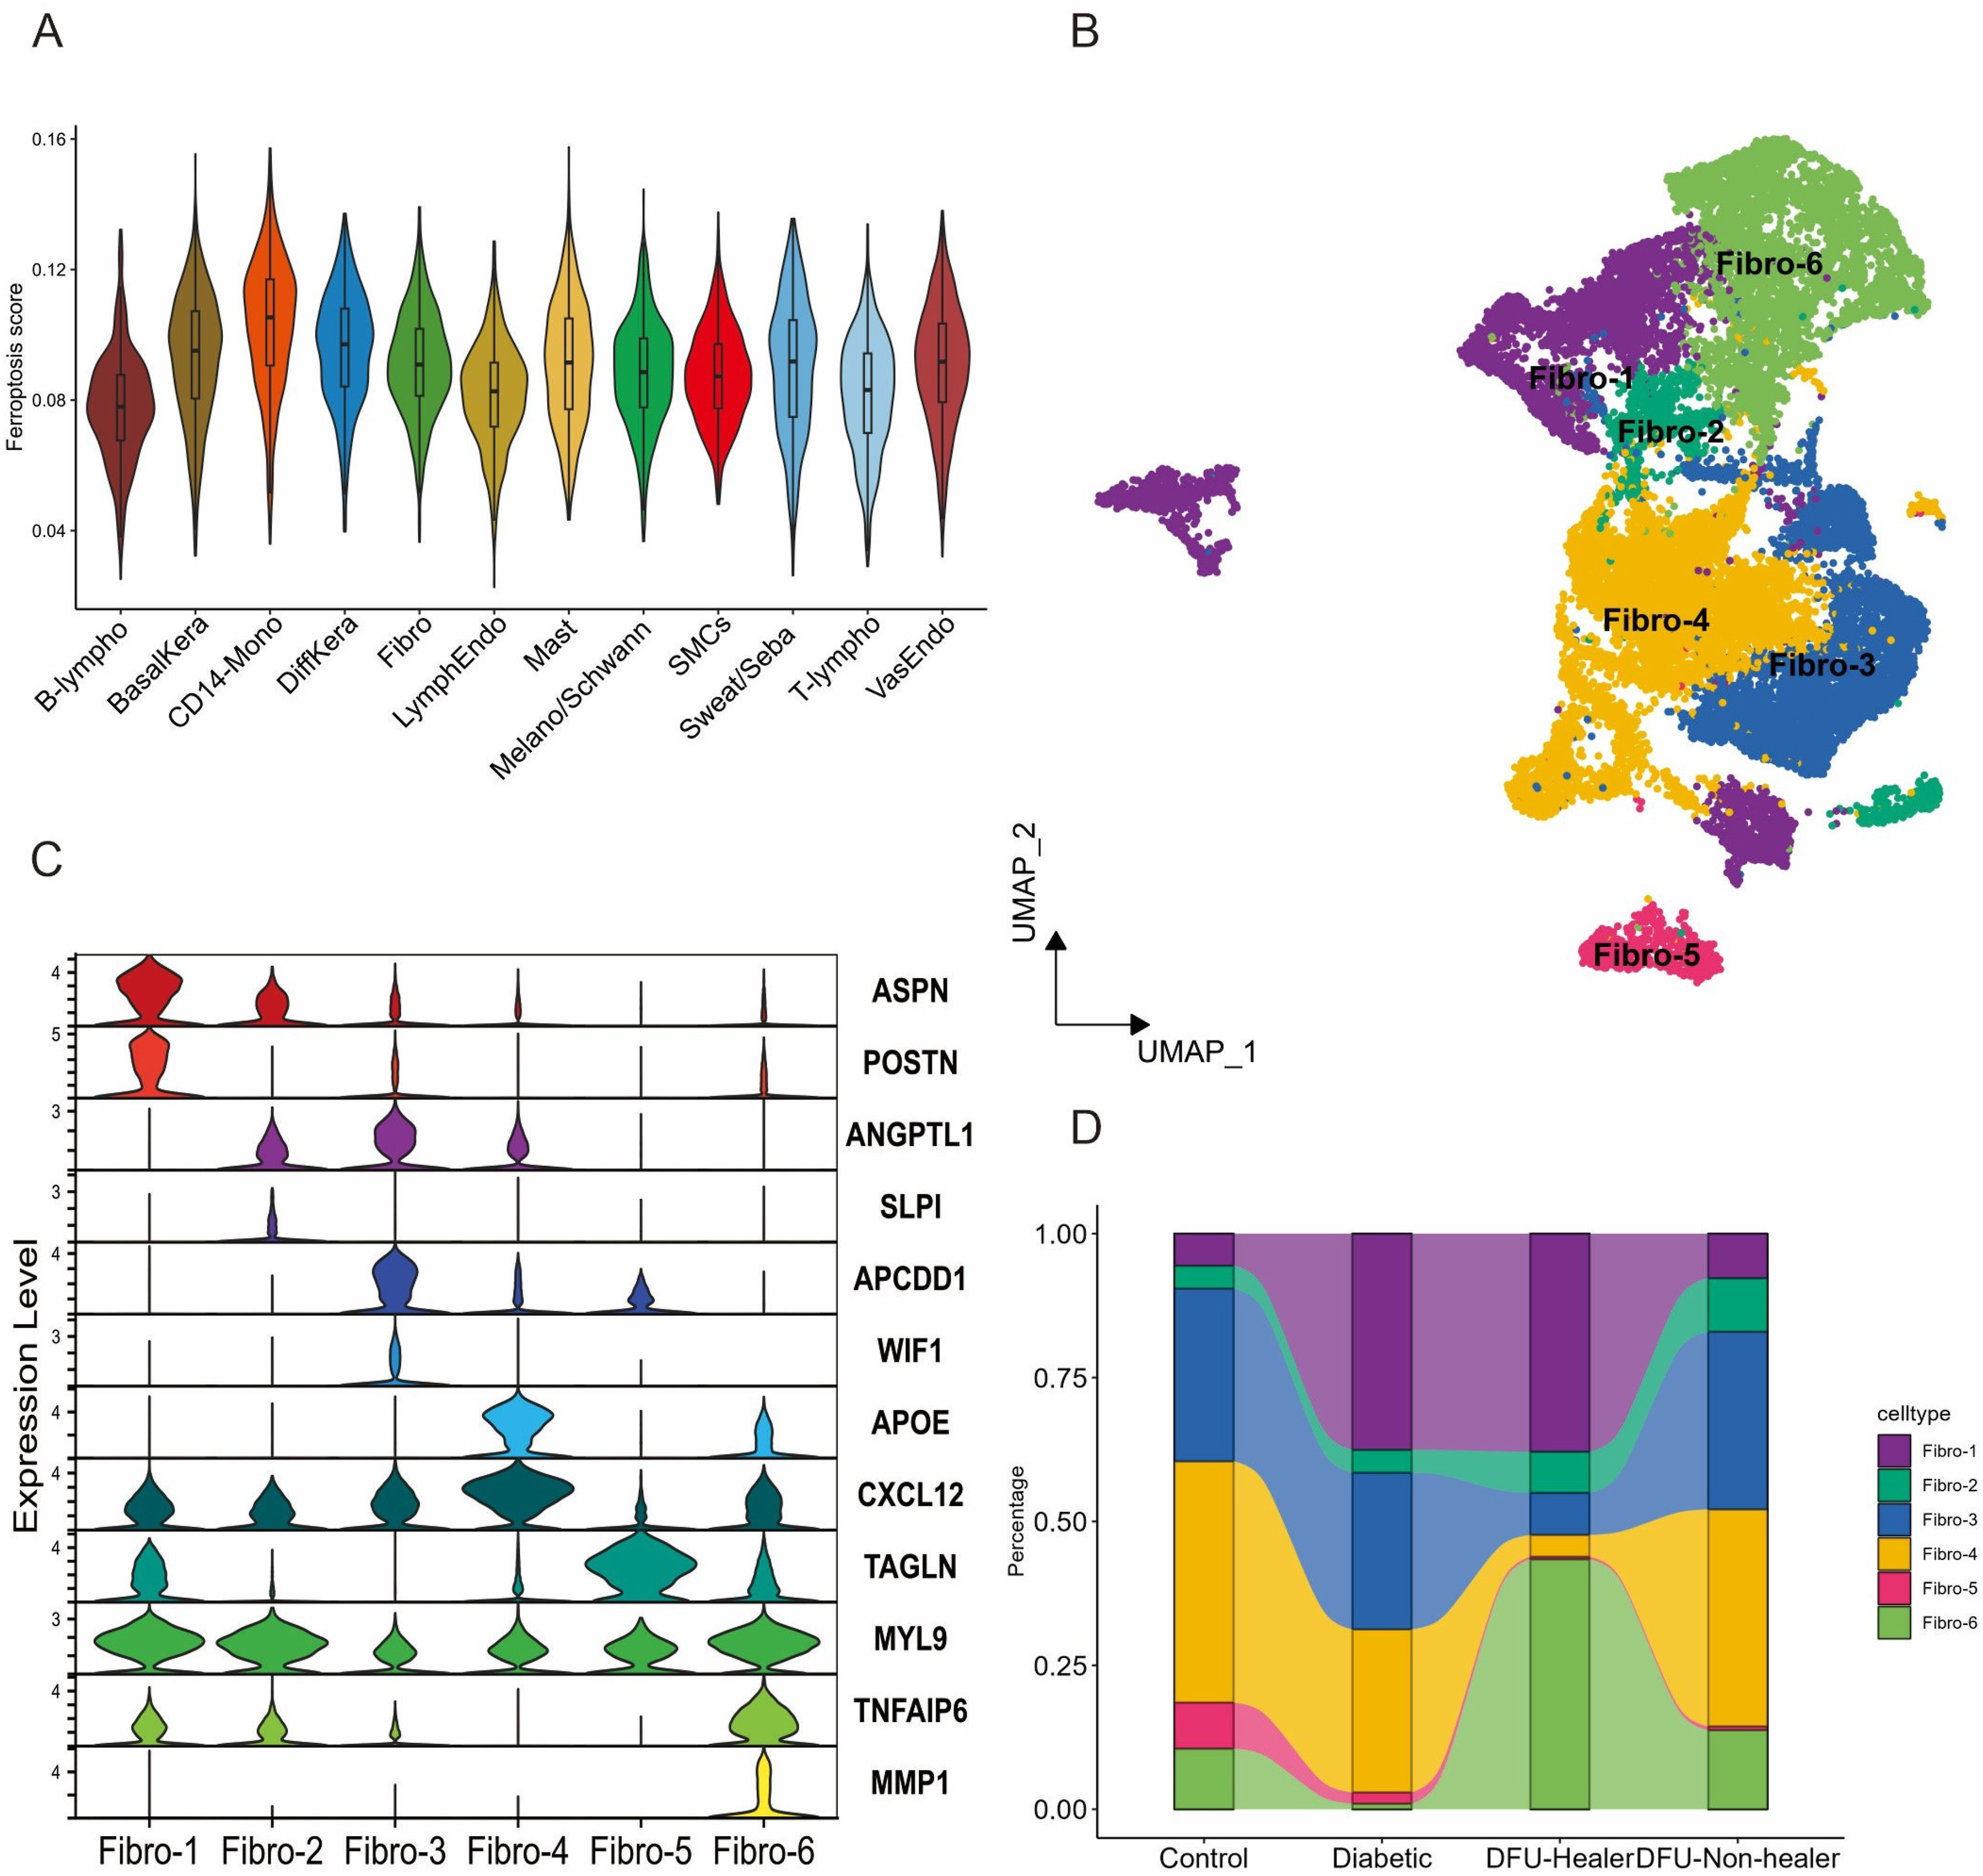
Cellular heterogeneity of DFUs fibroblasts
Because fibroblasts have higher ferroptosis score and are important for wound healing in DFUs, 37 Next, we performed focused unsupervised clustering on all fibroblasts and dissected further heterogeneity among fibroblasts, dividing them into Fibro1 to Fibro 6 subclusters (Figure 2(b), Figure S2(b)). The majority of subclusters showed distinct expression profiles indicating heterogeneity in the fibroblast population. The results demonstrated that fibro-1 was mesenchymal fibroblasts, fibro-2 was secretory-reticular fibroblasts, fibro-3 was secretory-papillary fibroblasts, fibro-4 was pro-inflammatory fibroblasts, fibro-5 was myfibroblasts, and fibro-6 was healing enriched associated-fibroblasts. To further verify the accuracy of clustering, we compared the expression of inflammation-response genes among fibroblasts subclusters. Notably, fibro-6 and fibro-4 had significantly higher expression levels of inflammation-response genes, validating our corresponding results (Figure S2(C)). Each subcluster exhibited unique marker profiles as shown in Figure 2(c). Fibro-1 express some mesenchymal progenitor markers, such as ASPN and POSTN, which are known to be involved in skeletal system development and osteoblast differentiation. 38 The signatures of fibro-4 include inflammatory response and reduced expression of collagens. 38 Fibro-6 revealed high expression of extracellular matrix (ECM) remodeling markers (MMP1) and immune markers (TNFAIP16), which are involved in cell adhesion and ECM stability.39,40 TNFAIP16 has shown anti-inflammation effects in various models of inflammation, and TNFAIP16 could inhibit keloid scar formation by regulating the PI3KAkt-Bcl-2 pathway. 41 As shown in Figure 2(d), the cell proportions of the fibroblasts subclusters from control to DFU-Non-healer group. From the results, we can see that the proportion of fibro-6 increased in DFU-healer group compared to three other groups. Only the change in DFU-healer group compared to diabetic group reached statistical significance (Figure S2(d), P < .05). Fibro-6, distinct healing enriched subtype of fibroblasts, may contribute to wound healing in DFU-healers.
Analysis of fibroblasts differentiation trajectories
To further delineate the evolutionary relationship among fibroblast subtypes, we generated pseudo-time trajectory of all fibroblasts with Monocle 2 and CytoTRACE analysis. The ordering of Monocle 2 revealed a branched trajectory with two major bifurcations, namely cell fate 1 and cell fate 2 (Figure 3(a)). Fibro-1 and Fibro-6 predominantly accumulated at the prebranch trajectory, which represents the initial states of fibroblasts. Subclusters fibro-4 and fibro-5 constituted the most of the cell fate 1, representing the cellular state of the myfibroblast phenotype. Subcluster fibro-3 constituted the most of the cell fate 2, thus representing specific states of ECM remodeling and vascular angiogenic. CytoTRACE also predicted that fibro-1 and fibro-6 had higher differentiation potential and fibro-5 had lower differentiation potential (Figure 3(b)). Based on the above information, we identified multiple branch-dependent genes of temporal expression pattern for fibroblasts differentiation, which were closely associated with extracellular matrix production and wound healing (Figure 3(c)). We also conducted RNA velocity-based trajectory inference to delineate the cellular differentiation of the cell type of interest. Consistently, we observed a clear directional flow from fibro-6 to fibro-5, reflecting potential transdifferentiation events (Figure 3(d)). Fibro-5 appeared to be distant from other clusters revealed it had own significant and unique transcriptional features. Pathway analysis with gene set variation analysis (GSVA) revealed enrichment for Wnt signaling pathway in fibro-1, type 2 diabetes mellitus and vascular smooth muscle contraction in fibro-4, and cell adhesion molecules in fibro-5 (Figure 3(e)). Pseudo-time trajectory analysis of DFUs fibroblast subpopulations. (a) Pseudo-temporal ordering of DFUs fibroblasts reveals a branched trajectory. (b) CytoTRACE analysis boxplot showing the comparison of CytoTRACE score between these fibroblast subclusters. (c) The patterns of gene expression along with the pseudotime. (d) UMAP-based scRNA velocity projections in fibroblast subclusters; black arrows show the RNA velocity field. (e) Heatmap showing the functional pathways enriched in six fibroblast subclusters by GSVA analysis.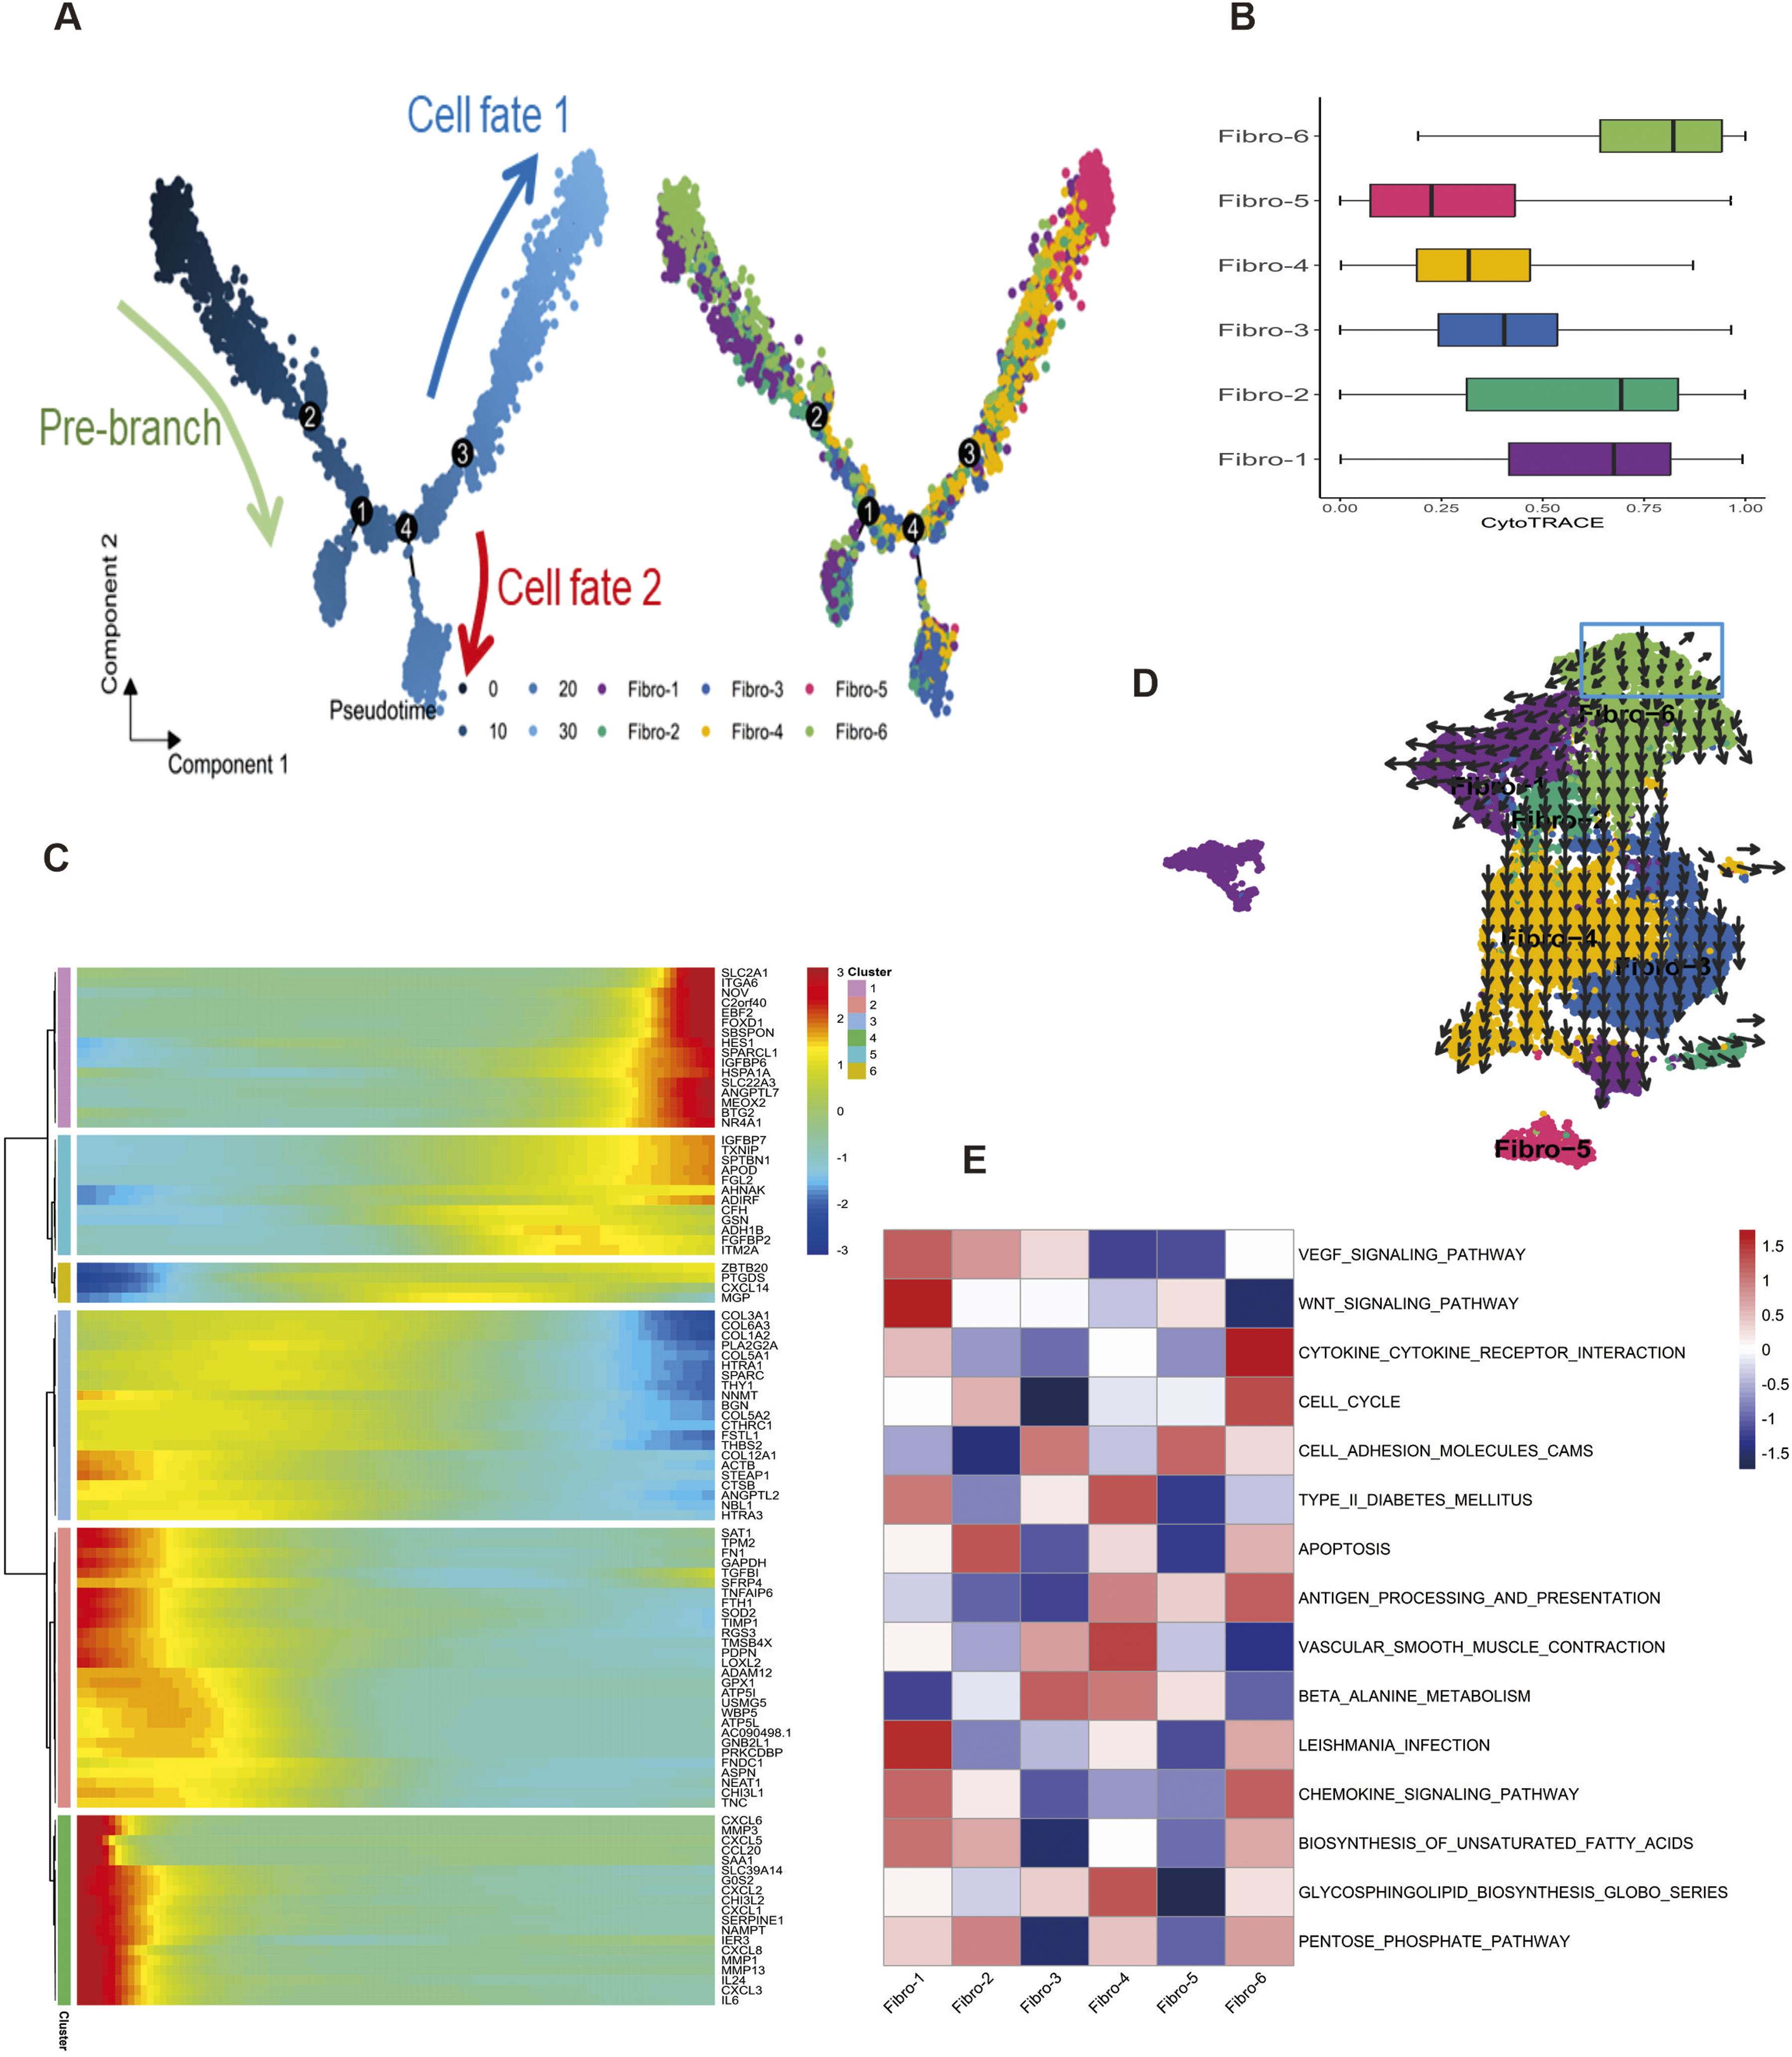
Cell–cell communication patterns revealed global alterations of intercellular crosstalk in fibroblast subsets
Fibroblasts coordinate organ function and homeostasis via communication with other cell types through ligand-receptor interactions.
42
To further determine the critical factors and intercellular regulation network within fibroblast subpopulations that contribute to the heterogeneous effects, we used a multiplication of expression between receptors and ligands as a communication score. Results showed that fibro-6 had a strong connection to fibro-1 with over 30 interactions quantified by communication correlation heatmap. Fibro-4 and fibro-5 showed similar interactions with fibro-6 (Figure 4(a)). The broad range of molecular interactions was further demonstrated by identifying cell types (Figure 4(b)). We then applied NicheNet computational approach to investigate external regulators of fibro-6 phenotype. As fibro-6 was enriched in both inflammatory and ECM remodeling genes (TNFAIP16, CHI3L1, and MMP1), critical to the healing process, fibro-6 was selected as “sender” subcluster to generate ligand candidates, while the other remaining subpopulations were treated as receiver cells. We found that EFNB1, which is produced in large quantities by fibro-5, may function as a ligand to drive the fibro-6 phenotype (Figure 4(c)). Fibro-5 was also interacted to a greater extent with fibro-6 according to the CellPhoneDB. Focused on ligand-receptor interactions, we observed EFNB1-EPHB3 was among the most significantly enriched ligand-receptor combinations (Figure 4(d)). Furthermore, we detected a significant increase in EFNB1 expression in the DFU group compared to DFS group by mining the bulk data (Figure 4(e)). The fibro-5 to fibro-6 ratio varied across samples, while the proportional distribution of both cell populations in relation to fibro-6 phenotype distribution was not significantly different (Figure 4(f)). Kakarla
43
and colleagues found continuous activation of EFNB1 increases the expression of cancer-associated fibroblasts (CAF) markers and could induce a CAF phenotype in the prostate cancer. The role of EFNB1 in fibroblast subtypes requires further investigation. Our analysis identified ligand-receptor interactions and indicated fibro-5 may drive the phenotype of fibro-6. Cell-cell communications of fibroblast subclusters. (a) Heatmap displaying the significant ligand-receptor cellular interactions in fibroblast subsets (The color bar represents the interaction counts between two different cell types. (b) A detailed view of ligand and cognate receptor interaction for each cell subtypes. (c) Heatmap showing correlation scores for regulation of genes (columns) by potential ligands (rows). (d) Heatmap depicting the selected ligand-receptor pairs between fibro-6 and other fibroblasts in DFU. (e) Boxplot showing EFNB1 expression levels in DFS (n = 8) and DFU (n = 13) group; DFS, Diabetic foot skin; DFU, Diabetic foot ulcers. **p < .01, t test. (f) Scatter plot showing the Pearson correlation between fibro-5 composition and fibro-6 composition among bulk data (n = 9).
Co-expression module construction
To further explore the potential role of fibroblasts in DFUs, co-expression networks and modules were created using the WGCNA algorithm. By setting the soft threshold to four and scale-free R2 of 0.75 (Figure 5(a)), co-expressed gene modules were identified, and 33 distinct modules with various colors were obtained using the dynamic cut algorithm (Figure 5(b)). Analysis of module-fibroblast feature relationships showed that the malson color module (380 genes, Supplemental Table S2) had the highest correlation with low fibroblasts (0.42) and the lowest correlation with high fibroblasts (Figure 5(c)). A total of 454 DEGs, containing 164 upregulated and 190 downregulated DEGs, were screened in the dataset (Figure 5(d)). We also obtained 259 ferroptosis-related genes from the FerrDb database. A Venn diagram was utilized to identify 75 genes related to ferroptosis or fibroblast infiltration (Figure 5(e), Supplemental Table S2). Overall, this study provides insights into the relationship between fibroblast and ferroptosis-related genes in the context of DFUs. Further research is needed to validate these findings and explore potential therapeutic implications. Co-expression pattern identification. (a) Selection of soft threshold power. (b) Cluster dendrogram of genes clustering under optimal soft thresholds. (c) The correlation between different modules and the proportion of low-fibroblasts and high fibroblasts infiltration. Each row represents to a module eigengene, column to a trait. (d) Volcano plot of differentially expressed genes (DEGs) in GSE134431 dataset. (e) Venn diagram of DEGs, ferroptosis-related genes, and fibroblasts-related genes.
Candidate diagnostic genes selection
To identify potential signatures as biomarkers, two machine-learning algorithms were utilized in the study. The LASSO results revealed 7 potential diagnostic biomarkers that demonstrated the lowest point on the curve (Figure 6(a)), whereas the SVM-RFE algorithm classified 31 informative feature variables (Figure 6(b)). Four overlapping genes (CGNL1, PIK3R1, ZNF395, and SLC7A11) were shared by both algorithms, as depicted in the venn diagram (Figure 6(c)). Furthermore, the expression level of these four genes were analyzed in the GSE134431 dataset, revealing significant differences between the DFU group and the diabetic foot skin (DFS) group (Figure 6(d), Figure S3(a) and (b)). To verify the accuracy of the above findings, the GSE80178 dataset was employed as a validation cohort. Among the three genes selected (PIK3R1, ZNF395, and SLC7A11), their expression levels did not exhibit significant differences (Figure 6(e), Figure S3(a) and (b)). To further evaluate the diagnostic effectiveness of CGNL1, ROC curves were utilized. In the GSE134431 dataset, CGNL1 displayed an AUC score of 1 (Figure 6(f)). In the validation data, the corresponding score was 0.99 (Figure 6(g)). We conducted functional enrichment analysis to gain insights into the biological activities of CGNL1 based on GSEA. The most significantly upregulated pathways were insulin secretion, lysine degradation, and mtor signaling pathway (Figure 6(h)); the most significantly down-regulated pathways were fatty acid metabolism, metabolism, and epithelial cell signaling (Figure 6(i)). Candidate signature genes selection. (a) Error plot of different lambda in LASSO. Five genes corresponding to the lowest point of the curve were identified as the most accurate genes. (b) Error plot of different number of features in SVM-RFE. The minimum error was obtained for the inclusion of 2 genes. (c) Venn diagram identified 4 genes by two machine learning algorithms. (d-e) Boxplot of CGNL1 expression levels in GSE134431 dataset and validation data. *p < .05; ***p < .001. (f-g) ROC curves of CGNL1 expression levels in GSE134431 dataset and validation data. GSEA enrichment analysis of CGNL1-related the highest regulated pathways (h) and the lowest regulated pathways (i).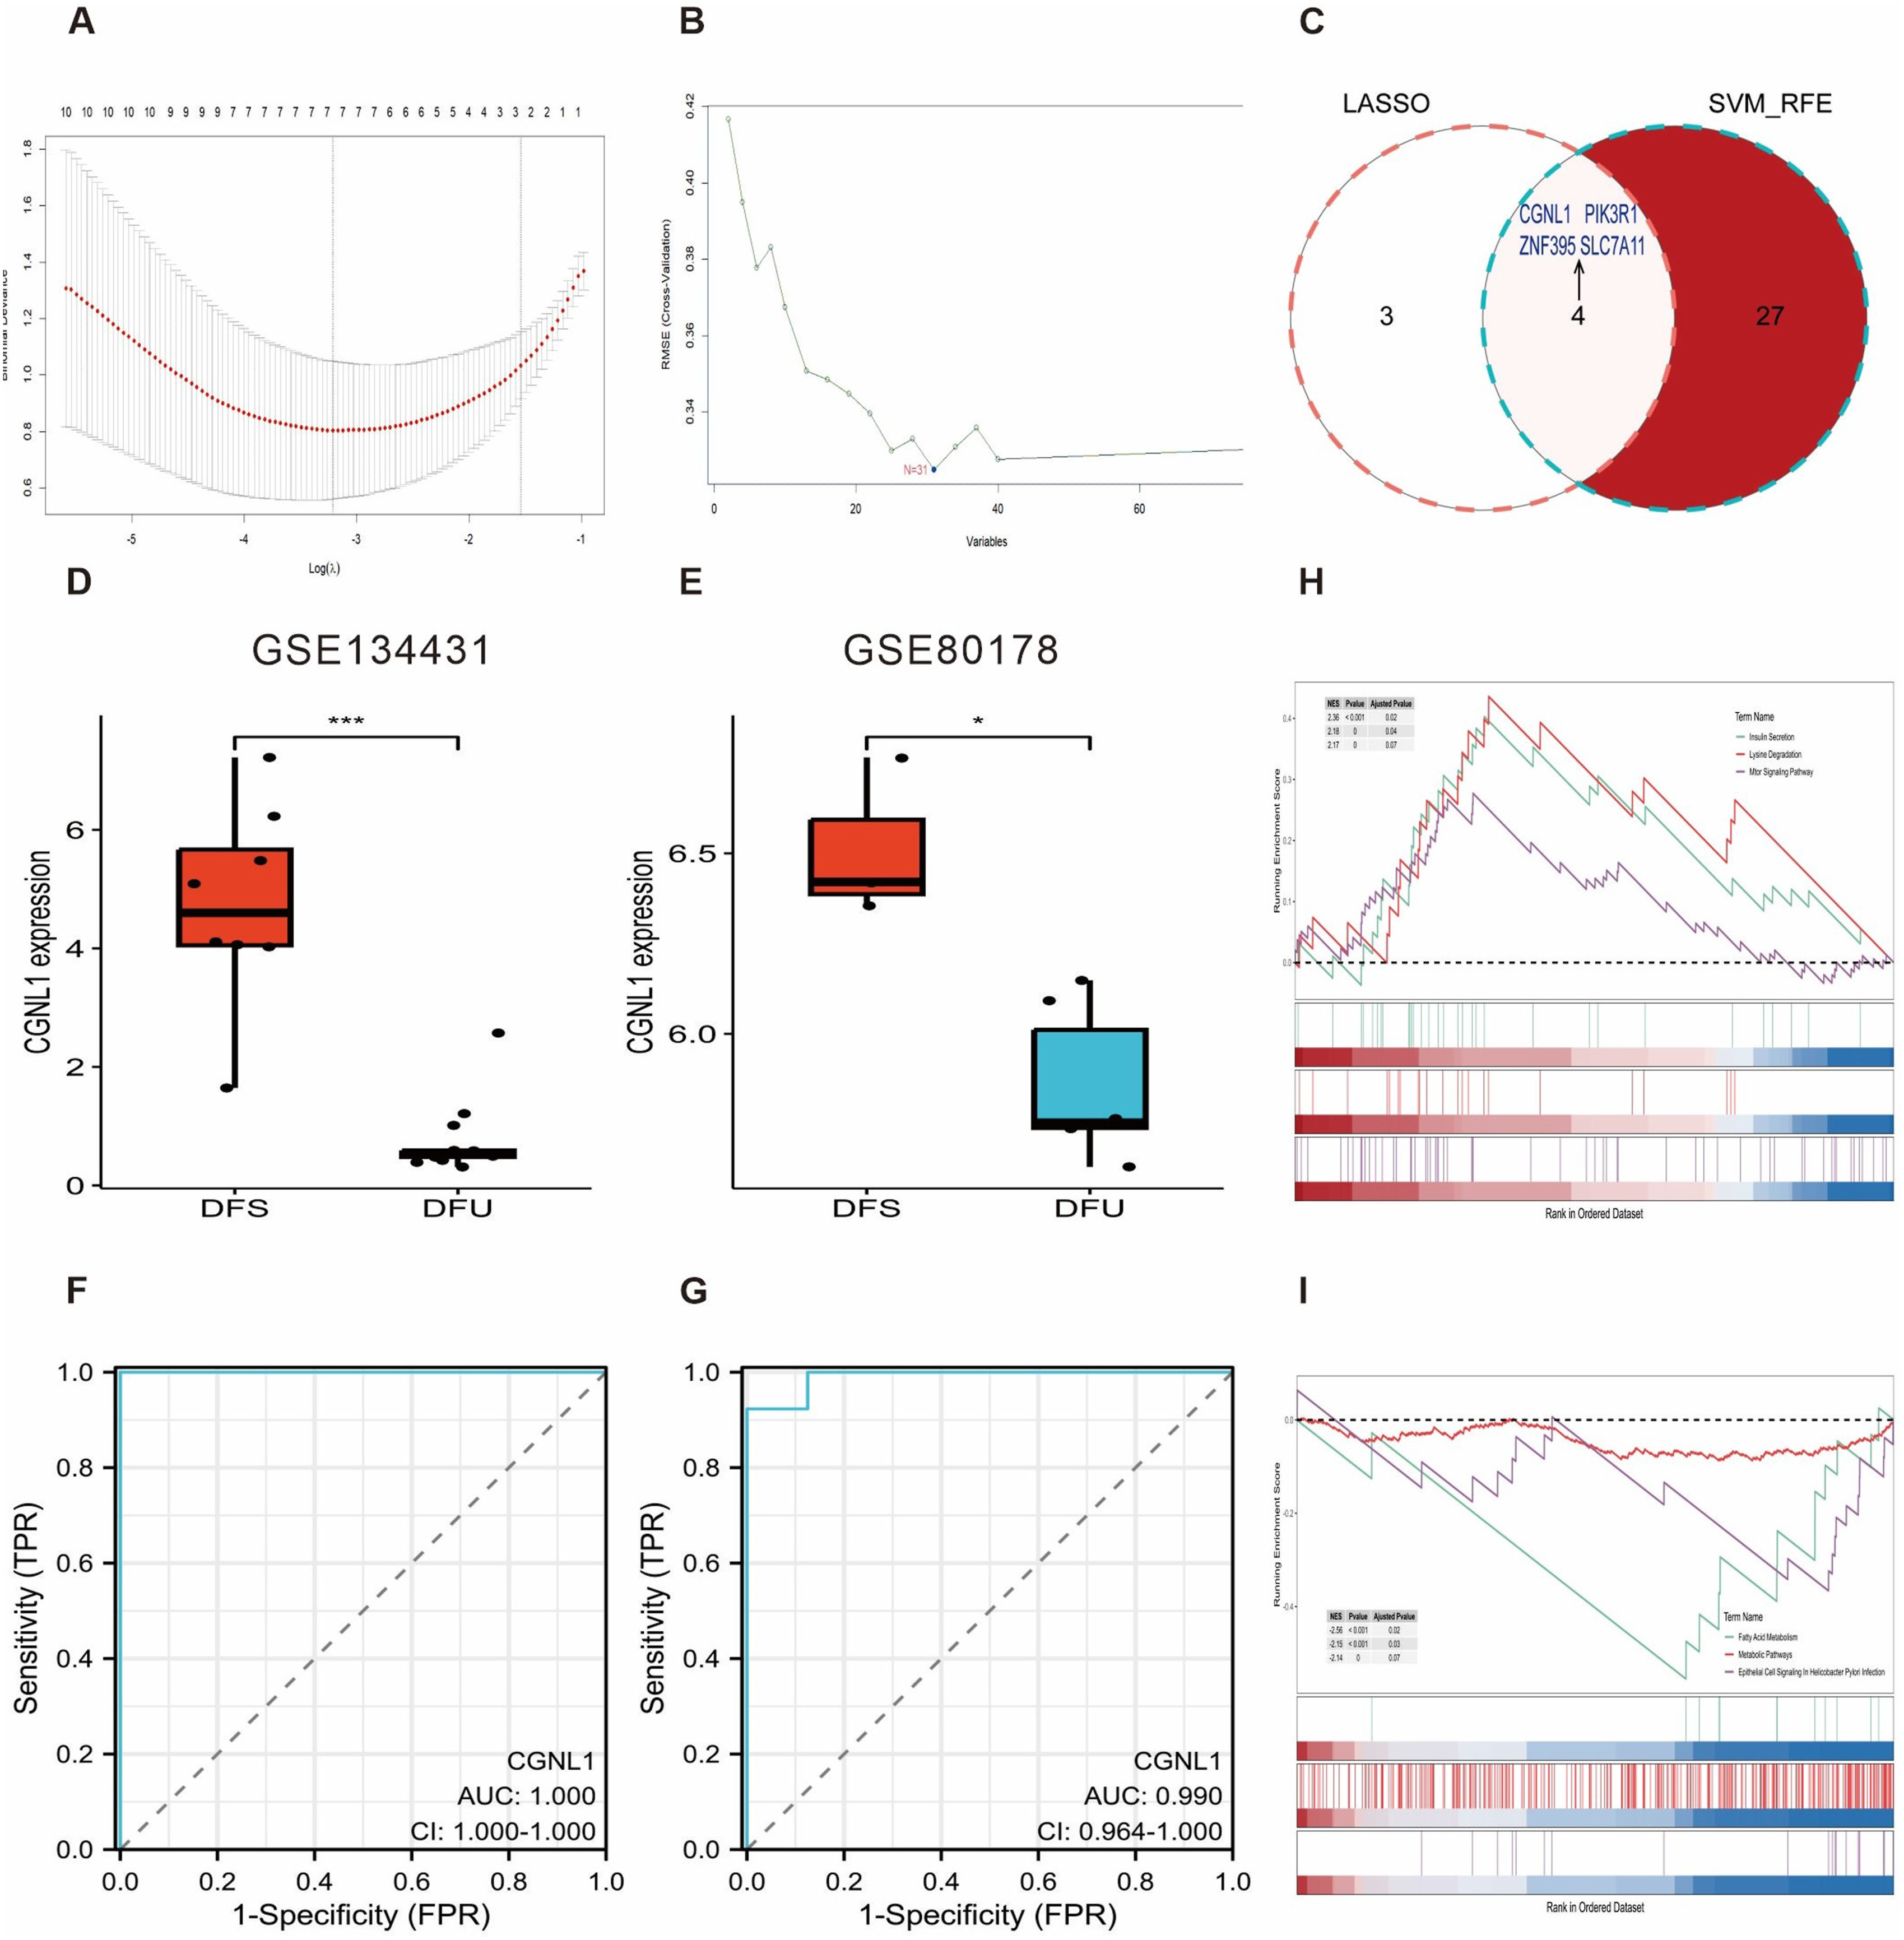
Correlation analysis of CGNL1 with fibroblasts and fibroblast subclusters
To investigate the role of CGNL1 in DFUs at single cell level, we found that CGNL1 was predominantly enriched in fibroblasts and fibroblast subsets fibro-3 and fibro-4 in the UMAP clustering distribution (Figure 7(a)). Notably, CGNL1 was significantly upregulated in the control group compared to the three other groups (p < .05), and the distribution is also consistent with the fibro-3 and fibro-4, subpopulations, although showing no significant difference (Figure 7(b)). Liu et al.
44
showed CGNL1 was downregulated in the head and neck squamous cell carcinoma compared with adjacent healthy tissue, and lower expression level of CGNL1 was associated with lower overall survival rate. To verify the relative abundance of fibroblasts and fibroblast subclusters in bulk RNA-seq, we estimate the percentage of fibroblasts and fibroblast subclusters in patient samples from the GSE134431 and GSE143735 datasets with well-defined cell signatures using ssGSEA algorithm. The abundance of fibroblasts was downregulated in DFUs group compared with DFS group significantly, partially consistent with scRNA-seq data (Figure S4(a), p < .05). We then estimated the abundance of fibrob-3 in the GSE134431 and GSE143735 datasets, finding no statistical difference among both groups (Figure S4(b)). The percentage of fibro-4 was higher in DFS than DFUs group, while no significantly differ in the GSE143735 dataset (Figure S4(c)). Correlation analyses identified CGNL1 exhibited a high positive correlation with fibroblasts (Figure 7(c), R = 0.55, p < .05). Further correlation analysis revealed that, CGNL1 was correlated positively with fibro-4, other than fibro-3 in the GSE134431 dataset (Figure 7(d), R = 0.75, p < .01). Fibro-4, characterized as pro-inflammatory fibroblasts, exhibits a significant enrichment of functions associated with inflammatory response, and demonstrates a high correlation with the diagnostic marker CGNL1. This finding may reveal CGNL1 has a distinct role in shaping the difference among DFUs fibroblasts. Correlation analysis of CGNL1 with fibroblasts and fibroblast subsets. (a) UMAP plots showing CGNL1 expression in the fibroblasts, fibro-3, and fibro-4 subsets. (b) Violin plots comparing the expression of CGNL1 in fibroblasts, fibro-3, and fibro-4 subsets in four groups. (c) Scatter plots of correlation between CGNL1 expression and fibroblasts, fibro-3, and fibro-4 subsets in the GSE134431 dataset. Each dot represents an individual sample. Left-y-axes: fibroblasts log2 expression, middle-y-axes: secretory-papillary fibroblasts log2 expression, right-y-axes: pro-inflammatory fibroblasts log2 expression.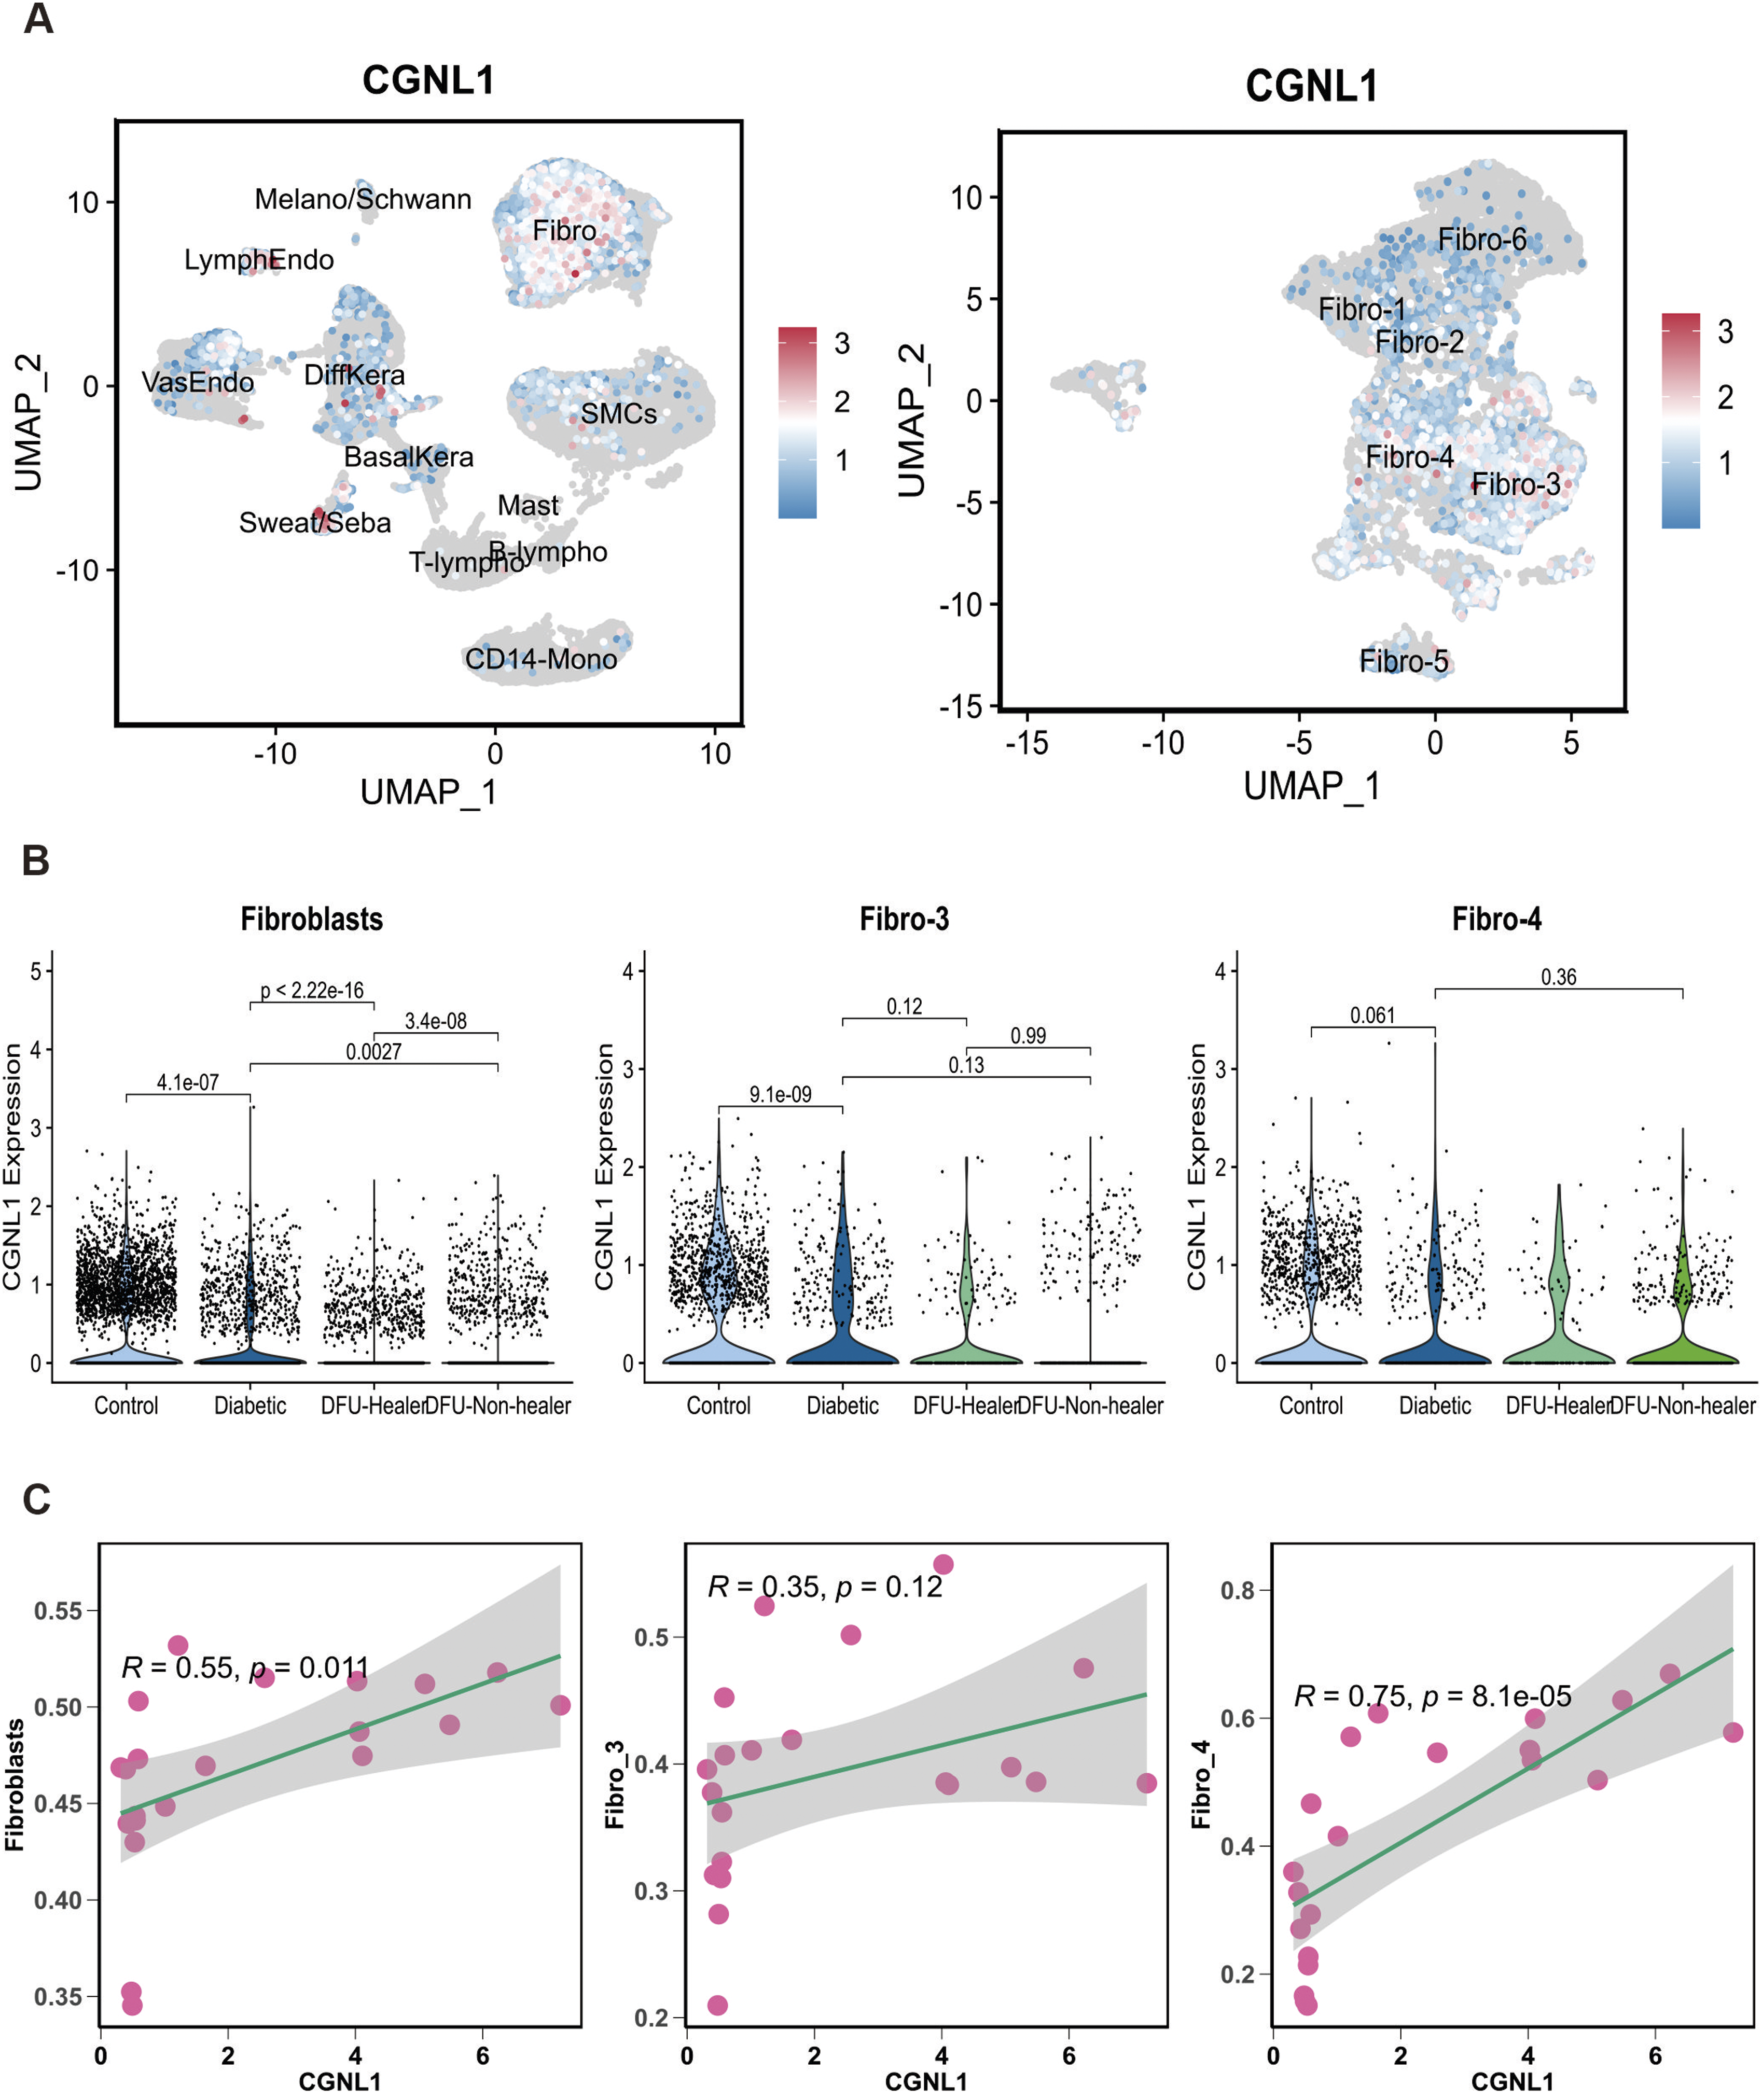
Discussion
There are not many investigations dissect the relationship between fibroblasts and ferroptosis in DFUs. In this study, by integrating large-scale unbiased scRNA-seq and bulk RNA-seq datasets, we demonstrated the more complex and heterogeneous fibroblasts and a strong relationship with ferroptosis-associated signature CGNL1. Briefly, we analyzed 83529 cells from 33 DFUs foot samples and identified 12 different cell populations. We further focused on heterogeneity among fibroblasts due to the higher ferroptosis signature score and important roles for wound healing in DFUs. Further cluster analysis identified 6 distinct fibroblast subclusters among four groups with unique and significant transcriptional signatures. Intriguingly, fibro-6 associated with healing enriched is predominant in the DFU-Healer group, enrichment for functions in anti-inflammation and ECM remodeling pathways. Fibro-4 as pro-inflammatory fibroblasts was enriched in DFU-Non-healer group, expressing some pro-inflammation genes, such as CXCL12, CXCL14, CCL9, and APOE. We also found increasing fibro-1 in DFU-Healer group compared to DFU-Non-healer group, expressing genes associated with skeletal system development. We further identified two major cell fate of fibroblasts via pseudotime trajectory analysis, that is from mesenchymal fibroblasts to myfibroblasts or to secretory-papillary fibroblasts. Cell-cell communication analysis revealed the expression of multiple genes related to ECM receptor. Fibroblasts may influence ferroptosis through the regulation of glutathione metabolism (Figure S2(a)). Moreover, fibroblast-derived lipids, such as arachidonic acid metabolites, may propagate oxidative damage in ferroptosis. 45 Georgios et al. utilized scRNA-seq to demonstrate the existence of multiple fibroblasts clusters and increased inflammation in the dorsal skin of individuals with DFUs. 25 Researchers indicated that ROS produced by photodynamic therapy induces ferroptosis in keloid fibroblasts with GPX4 downregulation. 46
CGNL1 was identified as a diagnostic marker in DFUs by leveraging two machine learning algorithms, which was then validated in an independent dataset using bulk data. Our analysis consistently demonstrated the prominent enrichment of CGNL1 predominantly within fibroblasts in scRNA-seq data. Furthermore, CGNL1 exhibited a notable presence in fibro-3 and fibro-4 subclusters of fibroblasts. Correlation analysis deciphered CGNL1 is strong positively correlated with fibro-4 in fibroblasts subclusters. CGNL1 regulates fibroblasts migration by modulating the expression of CD9, which is associated with the Rho GTPase family. 47 CGNL1 was observed to negatively regulate the activity of RhoA and Rac1 by upregulating the expression of RhoGDI, thereby influencing the migration and differentiation of fibroblasts and myofibroblasts. 48 Moreover, previous studies have highlighted the interaction of CGNL1 with the actin cytoskeleton, indicating its involvement in the reorganization of the cytoskeleton, a crucial aspect of fibroblasts activity and function.49,50 These results suggest that CGNL1 plays a significant role in the fibroblasts. However, limited research has been conducted about the specific role of CGNL1 in ferroptosis, and only a few reports suggest that CGNL1 affects the expression and activity of enzymes related to lipid metabolism. 51
This study has certain limitations that need to be acknowledged. Firstly, this study lacked experimental to further validate the above findings. Secondly, the machine learning prediction model in the external validation cohort affects the accuracy due to the small sample size, leading to misdiagnosis and missed diagnoses. Future research will focus on large scale scRNA sequencing analysis to explore cell-specific expressions in DFUs.
Conclusions
Our analysis identified distinct fibroblast subpopulations and demonstrated a significant positive correlation between CGNL1 and the pro-inflammatory fibroblasts by integrating scRNA-seq and transcriptome RNA-seq data. Furthermore, we elucidated CNGL1 as a new diagnostic biomarker in DFUs. This research provides insights into ferroptosis activation across DFUs.
Supplemental Material
Supplemental Material - Identification of CGNL1 as a diagnostic marker in fibroblasts of diabetic foot ulcers: Insights from single cell RNA sequencing and bulk sequencing data
Supplemental Material for Identification of CGNL1 as a diagnostic marker in fibroblasts of diabetic foot ulcers: Insights from single cell RNA sequencing and bulk sequencing data by Li Wang, Lulu Tang, Lingna Zhou, Yingtao Lai, Hui Li, Xiaojun Wang and Xiaoyi Liu in International Journal of Immunopathology and Pharmacology
Footnotes
Author contributions
LW conceptualized the study design. LT and LZ analyzed the data. HL, LZ and XW revised the images. XL and HL wrote the manuscript. XW and XL helped to accurately process the data, and reviewed and revised the manuscript. All authors read and approved the final manuscript.
Declaration of conflicting interests
The author(s) declared no potential conflicts of interest with respect to the research, authorship, and/or publication of this article.
Funding
The author(s) disclosed receipt of the following financial support for the research, authorship, and/or publication of this article: This work was supported by The National Natural Science Foundation of China (No.82304938), The Guangdong Natural Science Foundation (No. 2022A1515110282), Guangdong Provincial Bureau of Traditional Chinese Medicine Research Foundation (No. 20221115), Guangzhou Science and Technology Plan Project Foundation of China (No. 202102010474).
Ethical statement
Supplemental Material
Supplemental material for this article is available online.
References
Supplementary Material
Please find the following supplemental material available below.
For Open Access articles published under a Creative Commons License, all supplemental material carries the same license as the article it is associated with.
For non-Open Access articles published, all supplemental material carries a non-exclusive license, and permission requests for re-use of supplemental material or any part of supplemental material shall be sent directly to the copyright owner as specified in the copyright notice associated with the article.