
Abstract
Introduction
Myocarditis is a type of autoimmune disease that involves the inflammatory process affecting heart muscle tissue.1,2 The etiology of myocarditis can be viral, drug-induced, or idiopathic. 3 Clinical manifestations are typically acute, 4 but regardless of the cause, acute myocarditis may progress to a chronic stage, 5 eventually leading to tissue fibrosis, abnormal myocardial structure, and loss of cardiac contractile function. 6 Myocarditis is one of the causes of sudden cardiac death. 7 However, the diagnosis and treatment of myocarditis still face significant challenges. Therefore, there is a strong interest in identifying biomarkers for the diagnosis and treatment of myocarditis.4,8
The infiltration of extracellular matrix and immune cells in the cardiac microenvironment plays a crucial role in the progression of myocarditis.9,10 According to immunopathology, myocarditis is primarily classified into lymphocytic myocarditis (acute and chronic), giant cell myocarditis, eosinophilic myocarditis, and granulomatous myocarditis.1,11,12 The infiltration of immune cells such as T lymphocytes and myeloid cells is closely associated with lymphocytic and giant cell myocarditis. 11 Granulomatous lesions are caused by dysregulation of antigen-presenting cell (APC) function. 12 Therefore, understanding the cellular composition and functions of the myocarditis microenvironment is urgently needed.
In this study, thorough analysis of single-cell and next-generation sequencing expression profile data from myocarditis mice was conducted. The objective of this study was to identify the distinctive types of cell infiltration within the myocarditis microenvironment, analyze differentially expressed genes (DEGs) and their functions in these cells, and explore the interactions among them. These findings are expected to provide insights into the progression of inflammatory responses in the myocarditis microenvironment.
Materials and methods
This study was conducted from September 2023 to June 2024, and the workflow of the study can be found here and Figure 1(A). Overview of the cellular landscape in the myocarditis microenvironment. (A) Workflow of this study. In step 1, sequencing data related to myocarditis, including bulk RNA-seq (GSE155423) and single-cell sequencing (GSE174458) data, were obtained from the GEO. In step 2, the major cell types in the myocarditis microenvironment were annotated, and the differential gene expression analysis were performed. In step 3, we performed subtype analysis of the three major cell types in the microenvironment: fibroblasts, myeloid cells, and T/NK cells. In step 4, we analyzed the crosstalk between cells in the myocarditis microenvironment. (B) UMAP plot of the main cell types in the myocarditis microenvironment, which included fibroblasts, myeloid cells, immune cells, and endothelial cells. These cell types are distinguished by different colors. (C) Density plots illustrating the cellular distribution of four samples in two groups (healthy Control: Healthy group, and myocarditis: Myocarditis group). The shading from dark to light represents low to high cell density. (D) Expression bubble plot of cell subtype-associated biomarkers. The color indicates the scaled expression value, and the bubble size represents the percentage of gene expression. (E) Bar chart illustrating the distribution of cell types across sample sources. The proportions are scaled between 0 and 1, with colors representing different samples. GEO: gene expression omnibus; NK: natural killer cell; UMAP: uniform manifold approximation and projection.
Data collection
We accessed the Gene Expression Omnibus (GEO), a publicly available multitype online database, to construct comprehensive datasets on myocarditis. 13 These analyses included both single-cell sequencing (scRNA-seq) (accession number GSE174458) and bulk RNA sequencing (bulkRNA-seq) (accession number GSE155423) data.
For GSE174458, data from both healthy control and myocarditis model groups were included, with two replicates per group. Each replicate consisted of heart tissue from n = 7 mice per group, and the samples were loaded onto a single channel of the 10X Genomics platform. 14 Only data from samples without signs of infection or other confounding conditions were included in the analysis.
For GSE155423, 24 samples were used, with 12 from healthy controls and 12 from autoimmune myocarditis model mice. Tissue samples were collected at three time points: day 10, day 15, and day 21 after disease induction. 15 Data from any samples showing signs of secondary infections or other complications were excluded from the analysis.
Although the methods used to induce myocarditis in the two datasets differ, these datasets collectively provide a valuable resource for in-depth exploration of the myocarditis microenvironment.
Quality control and integration of scRNA-seq data
Before proceeding with further analysis, rigorous quality control measures were applied to the scRNA-seq data. This involved the removal of cells with mitochondrial expression exceeding 10%, as well as cells with total gene expression less than 100 and gene counts less than 200. Additionally, potential doublets were identified and filtered using the DoubletFinder package. 16 Package harmony was employed to address potential batch effects. 17 The integrated dataset ensures data consistency and comparability, laying a solid foundation for subsequent analyses.
Cell type annotation
To identify the major cell types in the mouse myocarditis microenvironment, CellMarker 2.0 was utilized to acquire cell markers. 18 This approach was complemented with previously published cell-type markers. 19 The cell markers used in this study can be found in Supplemental Table S1.
The cell subtype markers used for the analysis of the main subgroups of the three major cell types, namely fibroblasts, myeloid cells, and T/NK cells, can be found in Supplemental Table S2.
Identification of differential genes
For the scRNA-seq data, gene expression values were normalized using the NormalizeData function in Seurat V4 with the normalization method set to “LogNormalize”. 20 Subsequently, highly variable genes (HVGs) were identified using the “FindVariableFeatures” function. Differential gene expression analysis for each cell type was performed using the “FindMarkers” function. The DEGs for the cell subgroups at the single-cell level can be found in Supplemental Table S3.
For the bulk RNA-seq data, gene expression count values were analysed using DESeq2 to identify DEGs for each group. 21 The threshold for significant DEGs in myocarditis was set to an absolute log2 fold change (log2FC) greater than one and a p-value less than 0.05.
Gene enrichment analysis
Functional enrichment analyses were conducted using gene set variation analysis (GSVA) or gene set enrichment analysis (GSEA), as appropriate. Target gene sets were obtained through the msigdbr package. 22 The R package for GSVA and the fgsea package were used for Hallmark GSVA, Kyoto encyclopedia of genes and genomes (KEGG), and Gene ontology biological process (GOBP) GSEA, respectively. The pathway enrichment results mentioned in the study were derived from these methods. The Hallmark results can be found in Supplemental Table S4.
Inflammation score and gene correlation analysis
Inflammation-related genes were scored using the “Addmodulescore” function of the Seurat package. The gene sets used for scoring are listed in Supplemental Table S5. Correlation analysis was performed using the “cor.test” function with the “Spearman” method.
T-cell functional analysis
Genes associated with cytotoxicity, exhaustion, and costimulatory functions across T-cell subsets were identified in a previous study. 23 Using these genes, we conducted a comparative analysis of T cell subtypes in mice with myocarditis.
Cell cell communication analysis
To calculate the interactions between fibroblasts, myeloid cells, and T cells, the CellChat package was used to predict receptor-ligand interactions among these cell types in myocarditis.24,25 Following the CellChat pipeline, the “CellChatDB.mouse” database for mice was utilized. The signal strength and quantity for the healthy and myocarditis groups were integrated using “mergeCellChat” for subsequent comparisons.
Statistical analysis
When appropriate, statistical differences between groups were assessed using t test or the Wilcoxon test, depending on the data distribution. Spearman correlation values were used to analyze the correlation of genes or scores. A p-value less than 0.05 was considered statistically significant and is denoted as *, while p < .01 is represented as **, p < .001 as ***, and p < .0001 or less as ****.
Results
Cellular landscape in the myocarditis microenvironment
We downloaded sequencing data for myocarditis mice from the GEO and identified the major cell clusters present in the myocarditis microenvironment using classical cell markers. Subsequently, we performed subpopulation analysis of the three main cell types in the microenvironment: fibroblasts, myeloid cells, and T/NK cells, revealing potential crosstalk interactions between these cells (Figure 1(A)). First, we conducted quality control and filtering on the data, removing cells with mitochondrial gene proportions exceeding 10% (Figure S1A and S1B). Using classical markers and doublet prediction, we identified cell subtypes and doublets (Figure S1C and S1D). By employing Seurat for dimensionality reduction and clustering, we obtained 26 clusters (Figure S1E), seven of which were considered major clusters (Figure S1F). After filtering out low-quality cells and doublets, we identified six major clusters, corresponding to fibroblasts, myeloid cells, T/NK cells, B cells, endothelial cells, and mast cells (Figure 1(B)). There was an increase in the density of fibroblasts, myeloid cells, and T/NK cells in the myocarditis microenvironment compared to that in the healthy heart group (Figure 1(C)). Immune cells express CD45+ (Ptprc), and the expression of classical markers for the six cell types is specific to each of the following: fibroblasts (Col1a1, Dcn), myeloid cells (Cd14, S100a8), T/NK cells (Cd3d, Cd3e, Cd3g), B cells (Cd79a, Ms4a1), endothelial cells (Pecam1, Vwf), and mast cells (Cpa3, Kit) (Figure 1(D)). Furthermore, the proportions of fibroblasts, myeloid cells, and T/NK cells were greater in myocarditis samples than in healthy samples. Interestingly, the proportion of endothelial cells was almost entirely determined in the myocarditis samples, but, unfortunately, the number of endothelial cells was too low (Figure 1(E)). In summary, this study depicts the landscape of the major cell types in the myocarditis microenvironment.
Identification of key genes and functional pathways associated with myocarditis through bulk RNA-seq
Further, we conducted differential expression analysis using a total of 24 samples from GSE155423, including 12 myocarditis samples (collected at days 10, 15, and 21) and 12 control samples (also collected at the same time points). Our analysis revealed significant variations in the number of differentially expressed genes across the three time points (Figure 2). To obtain more accurate differential genes, we intersected the results from these time points, identifying 690 upregulated genes and 13 downregulated genes common to myocarditis mice across all time points. Notably, among the upregulated genes, we found several related to antigen presentation and immune response, such as H2-Ab1, H2-DMa, H2-DMb1, H2-DMb2, H2-Eb1, H2-Oa, H2-Q5, and H2-T23. Additionally, chemokines and chemokine receptor genes, including Ccl3, Ccl4, Ccl5, Ccl6, Ccr1, Ccr2, Ccr5, Cxcr2, Cxcl1, Cxcl2, and Cxcl3, were also identified, alongside genes involved in regulating immune responses and inflammation processes, such as Nfkbid, Nfkbie, and Wfdc17 (Figure 2(A)). Conversely, the downregulated gene list included Akap5, Aoc1l2, Fam83e, Gucy1a2, Lrrc30, Tll2, Msantd1, Papln, Pik3c2g, Slc46a2, St8sia5, Ky, and Tet1 (Figure 2(B)). Next, we performed GO functional enrichment analysis on the 690 upregulated genes, revealing significant enrichment in functions related to immune regulation, including the cytokine-mediated signaling pathway, T cell receptor complex, MHC class II protein, and cytokine/chemokine receptor binding (Figure 2(C)). KEGG enrichment results further indicated that these genes are associated with pathways related to cardiovascular diseases, specifically viral myocarditis, lipid and atherosclerosis, and fluid shear stress and atherosclerosis, which may contribute to apoptosis of cells within the myocarditis microenvironment (Figure 2(D)). Additionally, we observed enrichment in pathways such as the NF-kappa B signaling pathway, T cell receptor signaling pathway, B cell receptor signaling pathway, antigen processing and presentation, and cytokine-cytokine receptor interaction (Figure 2(E)). These findings suggest that the myocarditis microenvironment may be significantly influenced by these key genes and pathways. Therefore, further analysis of the myocarditis microenvironment through single-cell RNA sequencing is warranted. Bulk RNA sequencing analysis identified key genes and functional pathways associated with myocarditis. (A) Venn plot illustrating the overlap of up-regulated genes between myocarditis mice and the control group at Days 10, 15, and 21. (B) Venn plot illustrating the overlap of down-regulated genes between myocarditis mice and the control group at Days 10, 15, and 21. (C) Bar graph displaying the top GO term functional enrichment of overlapping upregulated genes, categorized by Biological Process (BP), Cellular Component (CC), and Molecular Function (MF), selected based on p-value. (D) Bubble chart illustrating the top KEGG pathways of overlapping upregulated genes, colored by p-value. The categories are grouped into cardiovascular disease, cell growth and death, immune system, signal transduction, and signaling molecules and interaction.
Ifitm1 + antigen-presenting fibroblasts play a proinflammatory role in the myocarditis microenvironment
To further analyze the impact of different cellular compositions on the myocarditis microenvironment, we conducted subpopulation analysis of the major cell types in GSE174458. First, fibroblasts, which include myocardial fibroblasts, were divided into subsets, comprising a total of 8135 fibroblasts. After dimensionality reduction and clustering, we obtained six fibroblast cell clusters (Figure 3(A)). Clusters three and four had higher proportions in myocarditis mice than did the healthy mice, while cluster one had a higher proportion of healthy mice (Figure 3(B)). Based on their different functions, we defined normal fibroblasts (nF), inflammatory fibroblasts (iF, expressed Il6, Pdgfra, Cxcl12, and Cxcl1), myofibroblasts (mF, expressed Tagln, Myl9, Hopx, and Col12a1), and antigen-presenting fibroblasts (aF, expressed H2-Ab1, Saa3, Cd74, and Slpi) (Figure 3(C)). Using the top-expressed genes in each cluster, we ultimately defined six subtypes of fibroblasts: Ndufa4l2 + nF cluster 1, Cd248+ iF cluster 2, Ifitm1 + aF cluster 3, Inmt + iF cluster 4, Dkk3 + mF cluster 5, and Il6 + iF cluster 6 (Figure 3(D) and S2). Subsequently, 50 hallmark enrichment results highlighted the functional differences among these fibroblast clusters. Among them, Ifitm1 + aF cluster three and Il6 + iF cluster six showed a high correlation with the inflammatory response (Figure 3(E)). Further analysis of the DEGs between the myocarditis group and healthy group revealed overexpression of the antigen-presenting genes H2-D1, H2-K1, and Ifitm1 and the complement gene C3 in fibroblasts (Figure 3(F)). These genes are predominantly expressed in fibroblasts, while H2-K1 is also expressed in T/NK cells, B cells, and myeloid cells (Figure 3(G)). The Ifitm1 + aF cluster three exhibited high expression of the chemokines Ccl2 and Ccl7, which are associated with high levels of inflammation. Interestingly, GSEA revealed significant enrichment of cytokine receptor interactions in the top KEGG pathways associated with myocarditis (Figure 3(H)). The release of cytokines is usually associated with proinflammatory effects. Thus, Ifitm1 + aF cluster six represents a subtype of antigen-presenting, proinflammatory fibroblasts in myocarditis. Classification and functional analysis of fibroblasts in myocarditis. (A) UMAP plot of fibroblast subtypes. Different colors represent cell subtypes. (B) Bar chart depicting the proportions of fibroblast subtypes in myocarditis and healthy samples. The proportions are scaled between 0 and 1, with colors representing different cell subtypes. (C) Bubble plot illustrating the expression of fibroblast subtype markers. The color indicates scaled expression values, and bubble size represents the percentage of gene expression. (D) Heatmap of the top genes expressed in fibroblasts. Colors represent scaled gene expression values ranging from −2 to 2. (E) Heatmap of the GSVA enrichment results for 50 hallmark gene sets. Enrichment scores are scaled from −2 to 2. (F) Volcano plot illustrating differential gene expression between myocarditis and healthy group. Genes with p < .01 and |log2FoldChange| > 0.25 are marked in red as significantly differentially expressed genes. (G) Bubble plot illustrating the expression of the top genes associated with myocarditis in major cell types in F. The color indicates the scaled expression values, and bubble size represents the percentage of gene expression. (H) GSEA table. Gene ranks are based on the fold change in differential expression between myocarditis and healthy samples, arranged from high to low rank. UMAP: uniform manifold approximation and projection; nF: normal fibroblast; iF: inflammatory fibroblasts; mF: myofibroblasts; GSVA: gene set variation analysis; GSEA: gene set enrichment analysis; NES: normalized enrichment score.
Nfkbia M1 macrophages regulate inflammatory responses through NF-κB signaling
The second major cell type, myeloid cells, consisted of a total of 4473 cells. To better elucidate the functions of myeloid cells in the microenvironment, we performed a re-clustering of myeloid cells, which resulted in six myeloid cell clusters (Figure 4(A)). The proportions of these clusters in the myocarditis and healthy groups were subsequently compared (Figure 4(B)). Based on gene expression of classical myeloid cell markers from the CellMarker database
26
(Figure 4(C)) and the top genes expressed within each cluster (Figure 4(D)), six subtypes of myeloid cells were defined: Fgl2 + Macrophage cluster 1, Stx11+ DC cluster 2, Ngp + Neutrophil cluster 3, Nfkbia + M1 macrophage cluster 4, Rsad2 + Monocyte cluster 5, and Mitochondrial + Macrophage cluster 6 (Figure S3). The proportion of the Nfkbia + M1 macrophage cluster four was higher in myocarditis samples than in healthy samples (Figure 4(B)). The top genes in this cluster included Wfdc17, Stfa2/3, BC100530, and Nfkbia (Figure 4(D)). Among these genes, Stfa2/3, Wfdc17, and Nfkbia were consistently upregulated at both the bulk RNA and scRNA levels in myocarditis tissues (Figure 4(E) and (F)). Furthermore, Nfkbia was positively correlated with the inflammation score (Figure 4(G)), and Nfkbia and Wfdc17 were positively correlated at both the scRNA (R = 0.17, p < 2 × 10⁻¹⁶) and bulk RNA (R = 0.75, p = 3.7 × 10⁻⁵) levels (Figure 4(H) and (I)). GOBP enrichment analysis of Nfkbia + M1 macrophage cluster four revealed involvement in KAPPAB KINASE NF KAPPAB signaling, NIK NF KAPPAB signaling, and regulation of inflammatory response (Figure 4(J)). These findings suggest that Nfkbia + M1 macrophages may promote myocarditis through the synergistic effect of Wfdc17 on NF-κB signaling. M1 macrophages promote the occurrence of inflammation in myocarditis. (A) UMAP plot of major myeloid cell subtypes. The different colors represent different subtypes. (B) Bar chart illustrating the sample source proportions of myeloid cells. The colors represent sample categories. The proportions are scaled between 0 and 1, with colors representing different cell subtypes. (C) Bubble plot depicting the expression of markers for different subtypes of myeloid cells. The color indicates the scaled expression value, and the bubble size represents the percentage of gene expression. (D) Heatmap of the top genes expressed in myeloid cells. Gene expression levels are scaled from −2 to 2. (E, F) Bubble and box plots illustrating the expression of the top genes in Nfkbia M1 macrophages across scRNA (e) and bulk RNA (f) cohorts. (G–I) Correlations between the expression of Nfkbia and inflammation score (G), expression of Nfkbia and Wdc17 (H) at the single-cell level, and expression of Nfkbia and Wdc17 (I) at the bulk RNA level. (J) GSEA plot of Nfkbia + M1 macrophages. The gene ranking was based on the fold change in the differential expression of Nfkbia + M1 macrophage, arranged from high to low rank. UMAP: uniform manifold approximation and projection; DC: dendritic cells; Macro: macrophage; GSEA: gene set enrichment analysis; NES: normalized enrichment score.
Distinct T-cell infiltration in myocarditis
T cells play a crucial role in immune activation. To elucidate the function of T cells in myocarditis, we isolated 3618 T/NK cells. Initially, after dimensionality reduction and clustering, we identified 11 clusters (Figure 5(A)). Clusters two and four exhibited higher infiltration and proportions of myocarditis than did the healthy controls (Figure 5(A) and (B)). Combining the clusters based on classical markers and the top expressed genes in each cluster (Figure 5(C) and (D)), we identified Ccr7 + Cd4 T naive cluster 1, S100a4 + Cd4 T exhausted cluster 2, Gzma + NK cluster 3, Ccl5 + Cd8 T cytotoxic cluster 4, Dapl1 + Cd8 T naive cluster 5, Ctal4 + Cd4 T exhausted cluster 6, Xcl1 + NK antigen presenting cluster 7, Stmn1 + proliferating T cluster 8, Lmo4 + mature T cluster 9, Irf4 + Cd4 T antigen presenting cluster 10, and Trdc + Gamma Delta T (γδ T) exhausted cluster 11 (Figure S4A). Functional enrichment analysis revealed that S100a4 + Cd4 T cells in the myocarditis microenvironment exhibited high expression of exhaustion/inhibitory molecules, along with elevated expression of costimulatory genes such as Cd28, Cd40lg, and Icos (Figure 5(E)). Furthermore, Ccl5 + Cd8 T cells showed cytotoxicity with high expression of toxic/effector factors Nkg7, Gzmb, Gzmk, and Ifng. Interestingly, Ccl5 + Cd8 T cells also expressed low levels of the exhaustion markers Pdcd1, Havcr2, Klrc1, and Entpd1 (Figure 5(E)). This may indicate that the status of Ccl5 + Cd8 T cells is pre-exhausted. In summary, a subset of Ccl5 + Cd8 T cells in the myocarditis microenvironment exhibits immune cytotoxicity, but their status suggests impending exhaustion. Interactions between fibroblasts, macrophages, CD4 T cells, and CD8 T cells are mediated through the H2-D1/K1-CD8a axis of the MHC-I molecule. Enrichment of cytotoxic CD8 + T cells and exhausted CD4 + T cells in the myocarditis microenvironment. (A) UMAP plot illustrating the distinct T-cell subpopulations between myocarditis and healthy samples. The different colors represent different subtypes. (B) Proportional bar chart of sample sources for 11 T-cell subpopulations. Proportions are scaled from 0 to 1. The different colors represent different samples. (C) Bubble plot depicting the expression of cell markers. Color indicates scaled expression values, and the bubble size represents the percentage of gene expression. (D) Heatmap of the expression of the T-cell marker Cd3 and the top gene expressed in various T-cell subpopulations. Gene expression levels are scaled from −3 to 3. (E) Heatmap of the expression of markers associated with cytotoxic/effector, co-inhibition/exhaustion, and co-stimulatory. The expression levels are scaled from −2 to 2. UMAP: uniform manifold approximation and projection; NK: natural killer cell; γδ T cells: gamma delta T cells.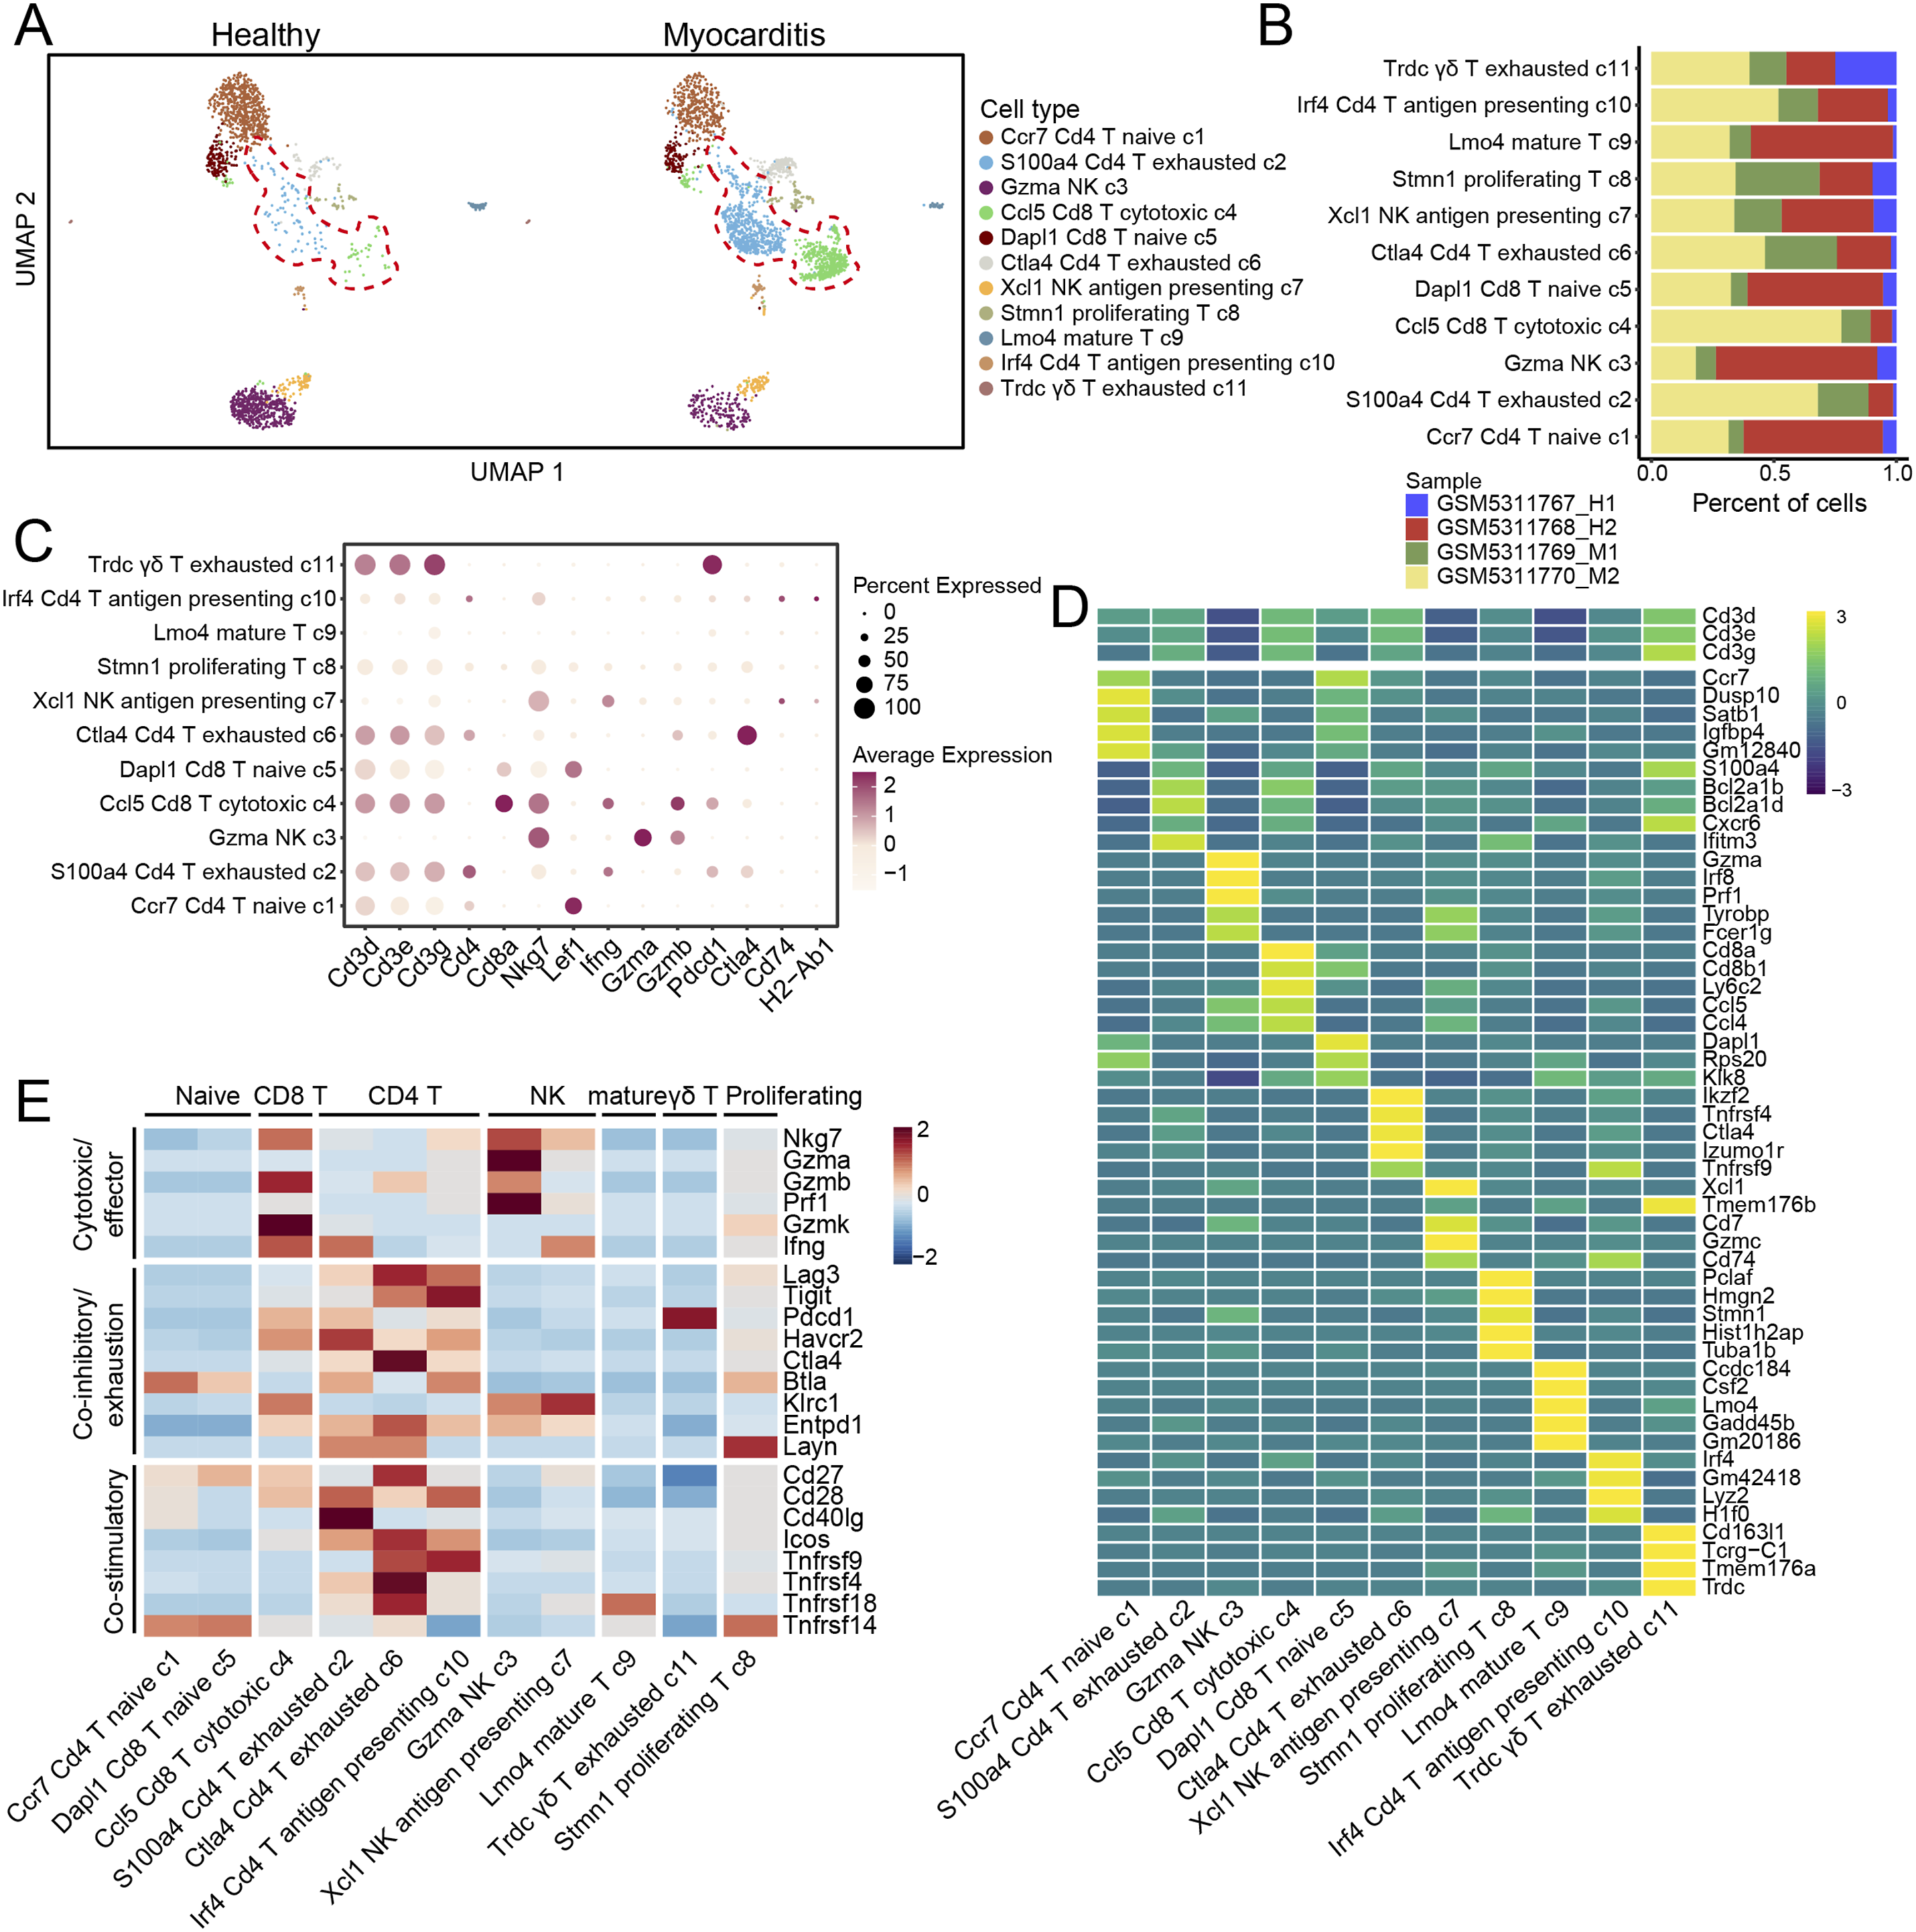
Main crosstalk among cells in the myocarditis microenvironment
The progression of this disease is often caused by crosstalk among cells. To explore the complex microenvironment of myocarditis, we conducted a signaling ligand-receptor analysis of a total of 23 subtypes of fibroblasts (n = 6), myeloid cells (n = 6), and T/NK cells (n = 11). A comparison of healthy and myocarditis conditions, we found that the number and intensity of signaling interactions in the myocarditis microenvironment were lower than those in healthy hearts (Figure S5A). In the healthy myocardium, there were more interactions among fibroblasts, while T-cell interactions were stronger in mice with myocarditis (Figure S5B). By analyzing the intensity of the signal interactions, we found that Ccl5 + Cd8 T cytotoxic cluster four cells received signals from other fibroblast subtypes, and myeloid cell subtypes, including themselves (Figure S5C). A comparison of the 81 signaling pathways, revealed that in myocarditis, the Ccl5 + Cd8 T cytotoxic cluster four was strongly correlated with the MHC-I, ADGRE, ICAM, LCK, IFN-II, and CCL pathways (Figure S5D).
Furthermore, the results of the ligand-receptor analysis of the Ccl5 + Cd8 T cytotoxic cluster four indicated that the Thy1-Adgre5 signal primarily existed between cells interacting with T cells (Figure 6(A)). Notably, Ifitm1 + aF cluster three and Nfkbia + M1 macrophage cluster four mediate H2-D1/K1-Cd8a/b1 signaling crosstalk with Ccl5 + Cd8 T cytotoxic cluster4 (Figure 6(A) and (B)). Interestingly, Ccl5 + Cd8 T cytotoxic cluster4 exhibits strong Ccl5-Ccr1 signaling crosstalk with the Nfkbia + M1 macrophage cluster 4 (Figure 6(A) and (C)). Among T cells, Ccl5 + Cd8 T cytotoxic cluster4 receives Lck-Cd8a/b1 signals from both Ccl5 + Cd8 T cytotoxic cluster4 and itself (Figure 6(A) and (D)). Ifitm1 + aF cluster three communicates a Cxcl1-Cxcr2 signal to Nfkbia + M1 macrophage cluster 4, and Ifitm1 + aF cluster three receives feedback from Ccl3-Ccr1 signaling of Nfkbia + M1 macrophage cluster 4 (Figure 6(A) and (E)). The signal intensity of H2-D1-Cd8a was greater in myocarditis than in healthy conditions, emphasizing that the Ccl5 + Cd8 T cytotoxic cluster four stimulates cell activity through Lck-Cd8a/b1 to exert cytotoxic effects upon antigen presentation. Cell signaling crosstalk analysis in the myocarditis microenvironment. (A) Bubble plot illustrating the main signaling interactions among fibroblasts, myeloid cells, and T cells. The bubble size represents significance, while the color indicates the strength of the signaling pathway. He: healthy samples; M: myocarditis samples; (B) Violin plot depicting the major ligand-receptor expression in the MHC-I signaling pathway. (C–E) Violin plot illustrating the major ligand-receptor expression in the CCL (C), LCK (D), and CXCL (E) signaling pathways. Fibro_c3, Ifitm1 + aF c3. Mye_c4, Nfkbia + M1 Macrophage c4. Tcell_2, S100a4 + Cd4 T exhausted c2. Tcell_c4, Ccl5 + Cd8 T cytotoxic c4.
Discussion
In our study, through integrated analysis of single-cell and bulk RNA sequencing data from mice with myocarditis, we identified the major cell types present in the myocarditis microenvironment, including fibroblasts, myeloid cells, and T/NK cells. Our research further underscores the complexity of immune cell infiltration in myocarditis, and is consistent with the findings of previous studies.27–29 However, our study offers a more detailed and comprehensive single-cell resolution, emphasizing the diversity and functionality of distinct cell subpopulations.
Differential expression analysis of 24 samples revealed significant variations in gene expression across three time points, leading to the identification of 690 upregulated genes and 13 downregulated genes common to myocarditis mice. The upregulated genes included those related to antigen presentation and immune response, such as H2-Ab1 and various chemokines, which may play a role in immune regulation and inflammation within the myocarditis microenvironment. And the GO enrichment analysis of these upregulated genes highlighted functions associated with immune regulation, while KEGG pathway analysis revealed pathways linked to cardiovascular diseases, suggesting potential mechanisms of apoptosis in the affected cells. Elevated levels of pro-inflammatory cytokines and chemokines are observed in many autoimmune diseases, where they are associated with poorer disease outcomes and reduced therapeutic responses. 30 A study reported that in Alopecia areata (AA), an autoimmune hair loss disorder, increased expression of H2-Ab1, Ifng, and Ccl5 was observed, which are involved in immune regulation and inflammation in the AA microenvironment. 31 Moreover, systemic lupus erythematosus (SLE) is an autoimmune disease in which the upregulation of MHC class I molecules and Ccl5 in the central nervous system has been linked to microglial activation and neuroinflammation. 32 These findings are consistent with our results, where we observed significant upregulation of H2-Ab1 and Ccl5 in myocarditis, suggesting their potential role in immune cell recruitment and modulation of inflammation within the myocarditis microenvironment. Furthermore, our analysis provides a more detailed characterization of these genes and pathways at single-cell resolution, reinforcing the need for further exploration of the myocarditis microenvironment through advanced technologies like single-cell RNA sequencing.
Subgroup analysis of fibroblasts revealed distinct cell subtypes with different functions and expression patterns. This classification offers deeper insights to gain deeper insights into the heterogeneity of fibroblasts in the myocarditis microenvironment. Interferon-induced transmembrane protein 1 (Ifitm1), confers resistance to viruses and plays a role in immune responses. 33 Furthermore, another study indicated that Ifitm1 is effective against hepatitis C virus (HCV) and functions in the late stages of HCV infection. 34 Here, we found that the Ifitm1 + aF and Il6 + iF clusters are associated with inflammatory responses and are highly expressed in myocarditis. A potential implication of these findings is that fibroblasts with high Ifitm1 expression may secrete antigens and interferons, contributing to the inflammatory response.
The analysis of myeloid cells revealed six cell subtypes. In particular, the significant increase in Nfkbia + M1 macrophages in myocarditis suggests their potential key role in the inflammatory response. Nfkbia is known to be a regulatory gene in the inflammatory process of skin diseases. 35 Additionally, in the inflammatory immune response process in osteoarthritis, Nfkbia has been identified as a critical hub. 36 M1 macrophages play a role in promoting inflammation in the myocardium. 37 However, there are limited reports on the role of Nfkbia in myocarditis. Here, we propose that Nfkbia + macrophages may represent a potential biological target in myocarditis.
The identification of T/NK cell subtypes revealed 11 unique clusters, including the Stmn1 + proliferating T-cell cluster, which is associated with cell proliferation. We observed that S100a4 + Cd4 T exhausted cells in myocarditis exhibit functional exhaustion, particularly in terms of releasing the effector molecule Ifng. The overexpression of Ccl5 has been associated with the infiltration of CD8 + T cells in solid tumors, and enhanced infiltration mediated by overexpressed Ccl5 may weaken tumor growth in mice. 38 However, Ccl5 overexpression appears to lead to CD8 + T cell exhaustion in HCC tumors. 39 Consistent with the findings of our study, Ccl5+ CD8+ T cells that exert cytotoxic effects on myocarditis express exhaustion factors such as Klrc1, Havcr2, and Pdcd1, indicating a pre-exhausted cellular state in the Ccl5+ CD8+ T cytotoxic cluster. These findings not only underscore the diversity of T cells in myocarditis but also reveal subtypes associated with different functions and states.
In the myocarditis microenvironment, intricate interactions between different cell types have been observed. In particular, the Ccl5 + CD8 T cytotoxic cluster received signals from other fibroblast subtypes, myeloid cells, and itself, including the MHC-I antigen presentation pathway. H2-K1 is a novel immunopeptidome in tumor tissues that induces CD8 + T cell responses in mice. 40 Both H2-D1 and H2-K1 are involved in antigen presentation to activate recruited CD8 + T cells, resulting in the production of the effector molecule Ifng, which effectively controls Toxoplasma gondii infection in the brain. 41 These findings suggest that H2-D1/K1 may play a crucial modulatory role in CD8 + T cell immune regulation in myocarditis.
This study has several limitations, such as a relatively small sample size and the inherent limitations of single-cell technology in accurately reconstructing the spatial information between cells. 42 Additionally, the mechanisms underlying autoimmune myocarditis and viral myocarditis differ, which may pose challenges when analyzing both conditions together. To gain a deeper understanding of the complexity of the myocarditis microenvironment, future research could employ various approaches to elucidate the specific mechanisms underlying different cell subtypes. Further validation of our findings is needed to determine their role in the progression of myocarditis.
However, our study provides a comprehensive and detailed analysis of the myocarditis microenvironment, offering several key innovations. First, we employed single-cell resolution to profile the cellular diversity and heterogeneity within the myocarditis tissue, revealing previously uncharacterized subpopulations of fibroblasts, myeloid cells, and T/NK cells. Second, we identified Nfkbia + M1 macrophages as a potential new therapeutic target in myocarditis, highlighting their critical role in inflammation. Third, we uncovered the pre-exhausted state of Ccl5+ CD8+ T cells, which could contribute to immune dysfunction in myocarditis and presents a new avenue for therapeutic intervention. Lastly, our analysis of cell-cell interactions, particularly those involving MHC-I antigen presentation, suggests that H2-D1/K1 signaling plays a crucial role in modulating T cell responses in the myocarditis microenvironment. These findings provide valuable insights into the immune mechanisms underlying myocarditis and open new directions for future research and therapeutic strategies.
Conclusion
In conclusion, this study provides new insights into the complexity of the myocarditis microenvironment, revealing the heterogeneity of cell subpopulations, including fibroblasts, myeloid cells, and T/NK cells. Notably, we identified Nfkbia + M1 macrophages as a key player in the inflammatory response, and Ccl5 + CD8 T cells in a pre-exhausted state, suggesting impaired immune function in myocarditis. Our findings also highlight critical cell-cell signaling interactions, such as the role of H2-D1/K1 antigen presentation in modulating T cell responses. These insights offer valuable implications for therapeutic targets and future research aimed at better understanding the pathogenesis and treatment of myocarditis.
Supplemental Material
Supplemental Material - Integrated transcriptomic and single-cell analysis reveals key immune-related genes and cellular crosstalk in the myocarditis microenvironment
Supplemental Material for Integrated transcriptomic and single-cell analysis reveals key immune-related genes and cellular crosstalk in the myocarditis microenvironment by Yuanqing Li, Shangfei He, Jun Wu, Shenrong Liu, Ruiming Liu, Yipeng Du, Dunzheng Han, Wenjie Luo, Zheng Huang and Pingzhen Yang in European Journal of Inflammation.
Footnotes
Acknowledgments
We appreciate all the reviewers who participated in the review process.
Author contributions
YQ.L and PZ.Y. conducted Conceptualization. YQ.L, SF.H, and J.W. performed the formal analysis and visualization. SR.L, RM.L, and YP.D carried out the data curation and methodology. DZ.H and WJ.L conducted an investigation. YQ.L, SF.H and J.W. contributed to writing – original draft. Z.H. and PZ.Y. provided supervision and contributed to writing – review & editing.
Declaration of conflicting interests
The author(s) declared no potential conflicts of interest with respect to the research, authorship, and/or publication of this article.
Funding
The author(s) received no financial support for the research, authorship, and/or publication of this article.
Data availability statement
The data can be accessed from GEO under accession numbers GSE174458 and GSE155423. All the data and method used to support the findings of this study can be found in the article.
Supplemental Material
Supplemental material for this article is available online.
References
Supplementary Material
Please find the following supplemental material available below.
For Open Access articles published under a Creative Commons License, all supplemental material carries the same license as the article it is associated with.
For non-Open Access articles published, all supplemental material carries a non-exclusive license, and permission requests for re-use of supplemental material or any part of supplemental material shall be sent directly to the copyright owner as specified in the copyright notice associated with the article.