
Abstract
Introduction
Primary liver cancer is a life-threatening disease and its death and incidence rates are increasing worldwide. 1 Liver cancer ranks fifth in incidence 2 and is the third most common cause of cancer-related mortality 3 worldwide. Hepatocellular carcinoma (HCC) and intrahepatic cholangiocarcinoma account for 80% and 15% of all liver cancer cases, respectively. 4 The former is an epithelial cancer originating from hepatocytes and progenitor cells and is characterised by rapid growth, extensive vascular invasion and metastasis, and short overall survival (OS).5,6 HCC rapidly progresses, its rates of postoperative recurrence and metastasis are high, it cannot be cured, and neither palliative treatment nor adjuvant therapy improves its prognosis.7,8 Surgical resection is the first treatment option in early-stage HCC. However, the major challenge is the efficacious treatment of advanced HCC. Chemotherapy, immunotherapy, and chemoimmunotherapy have demonstrated potential for high efficacy in cancer treatment. Hence, novel diagnostic biomarkers, treatment response predictors, and effective targets for the inhibition of progression are essential for individual precision HCC treatment.
Tumour initiation and progression are complex processes that involve the tumour microenvironment (TME), system changes, tissue-cell interactions, regulation, and aberrant signal pathway activation. 9 As of the time of this writing, it has been 40 years since it was first reported that WNT1 drives tumorigenesis and specifies the fate of stem cell self-renewal. 10 Mutations in the tumour suppressors of the WNT pathway abnormally regulate cancer initiation, development, and progression. 10
β-catenin-dependent and β-catenin-independent signalling pathways activate WNT-associated receptors which are linked to the signalling cascade response and regulate cancer development. 11 The WNT signalling pathway is activated in cancers when tumour suppressor genes are inactivated and genes promoting stemness, proliferation, and tumour cell survival are transcribed. 12
Numerous studies reported on the roles of WNT/β-catenin signalling in HCC proliferation, metastasis, and therapeutic response. Here, we curated data from a public database, subjected them to bioinformatics analysis, and revealed the WNT signatures in HCC. We characterised WNT signature-based classification and categorised patients with HCC into various clusters with specific properties. We also constructed a WNT score-based model with good prognostic and clinical feature prediction capability (Figure 1). Study overview. 1. WNT score-associated signalling pathway enrichment analysis. 2. Patient data were obtained from the TCGA-LIHC, GSE14520, and HCCDB18 cohorts and processed by strict selection and normalisation. 3. DEGs were recognised based on the TCGA-LIHC and HCCDB18 datasets. ConsensusClusterPlus was used for WNT-score-based patient sample clustering. 4. Both clusters were compared based on their clinicopathological and pathological characteristics, mutation and immune features, and immunotherapy and chemotherapy responses. 5. Prognostic target gene identification. 6. Establishment and validation of the WNT score gene-associated risk model. 7. Risk score evaluation for various clinicopathological features. 8. Construction of a risk score-based prognostic and predictive nomogram model.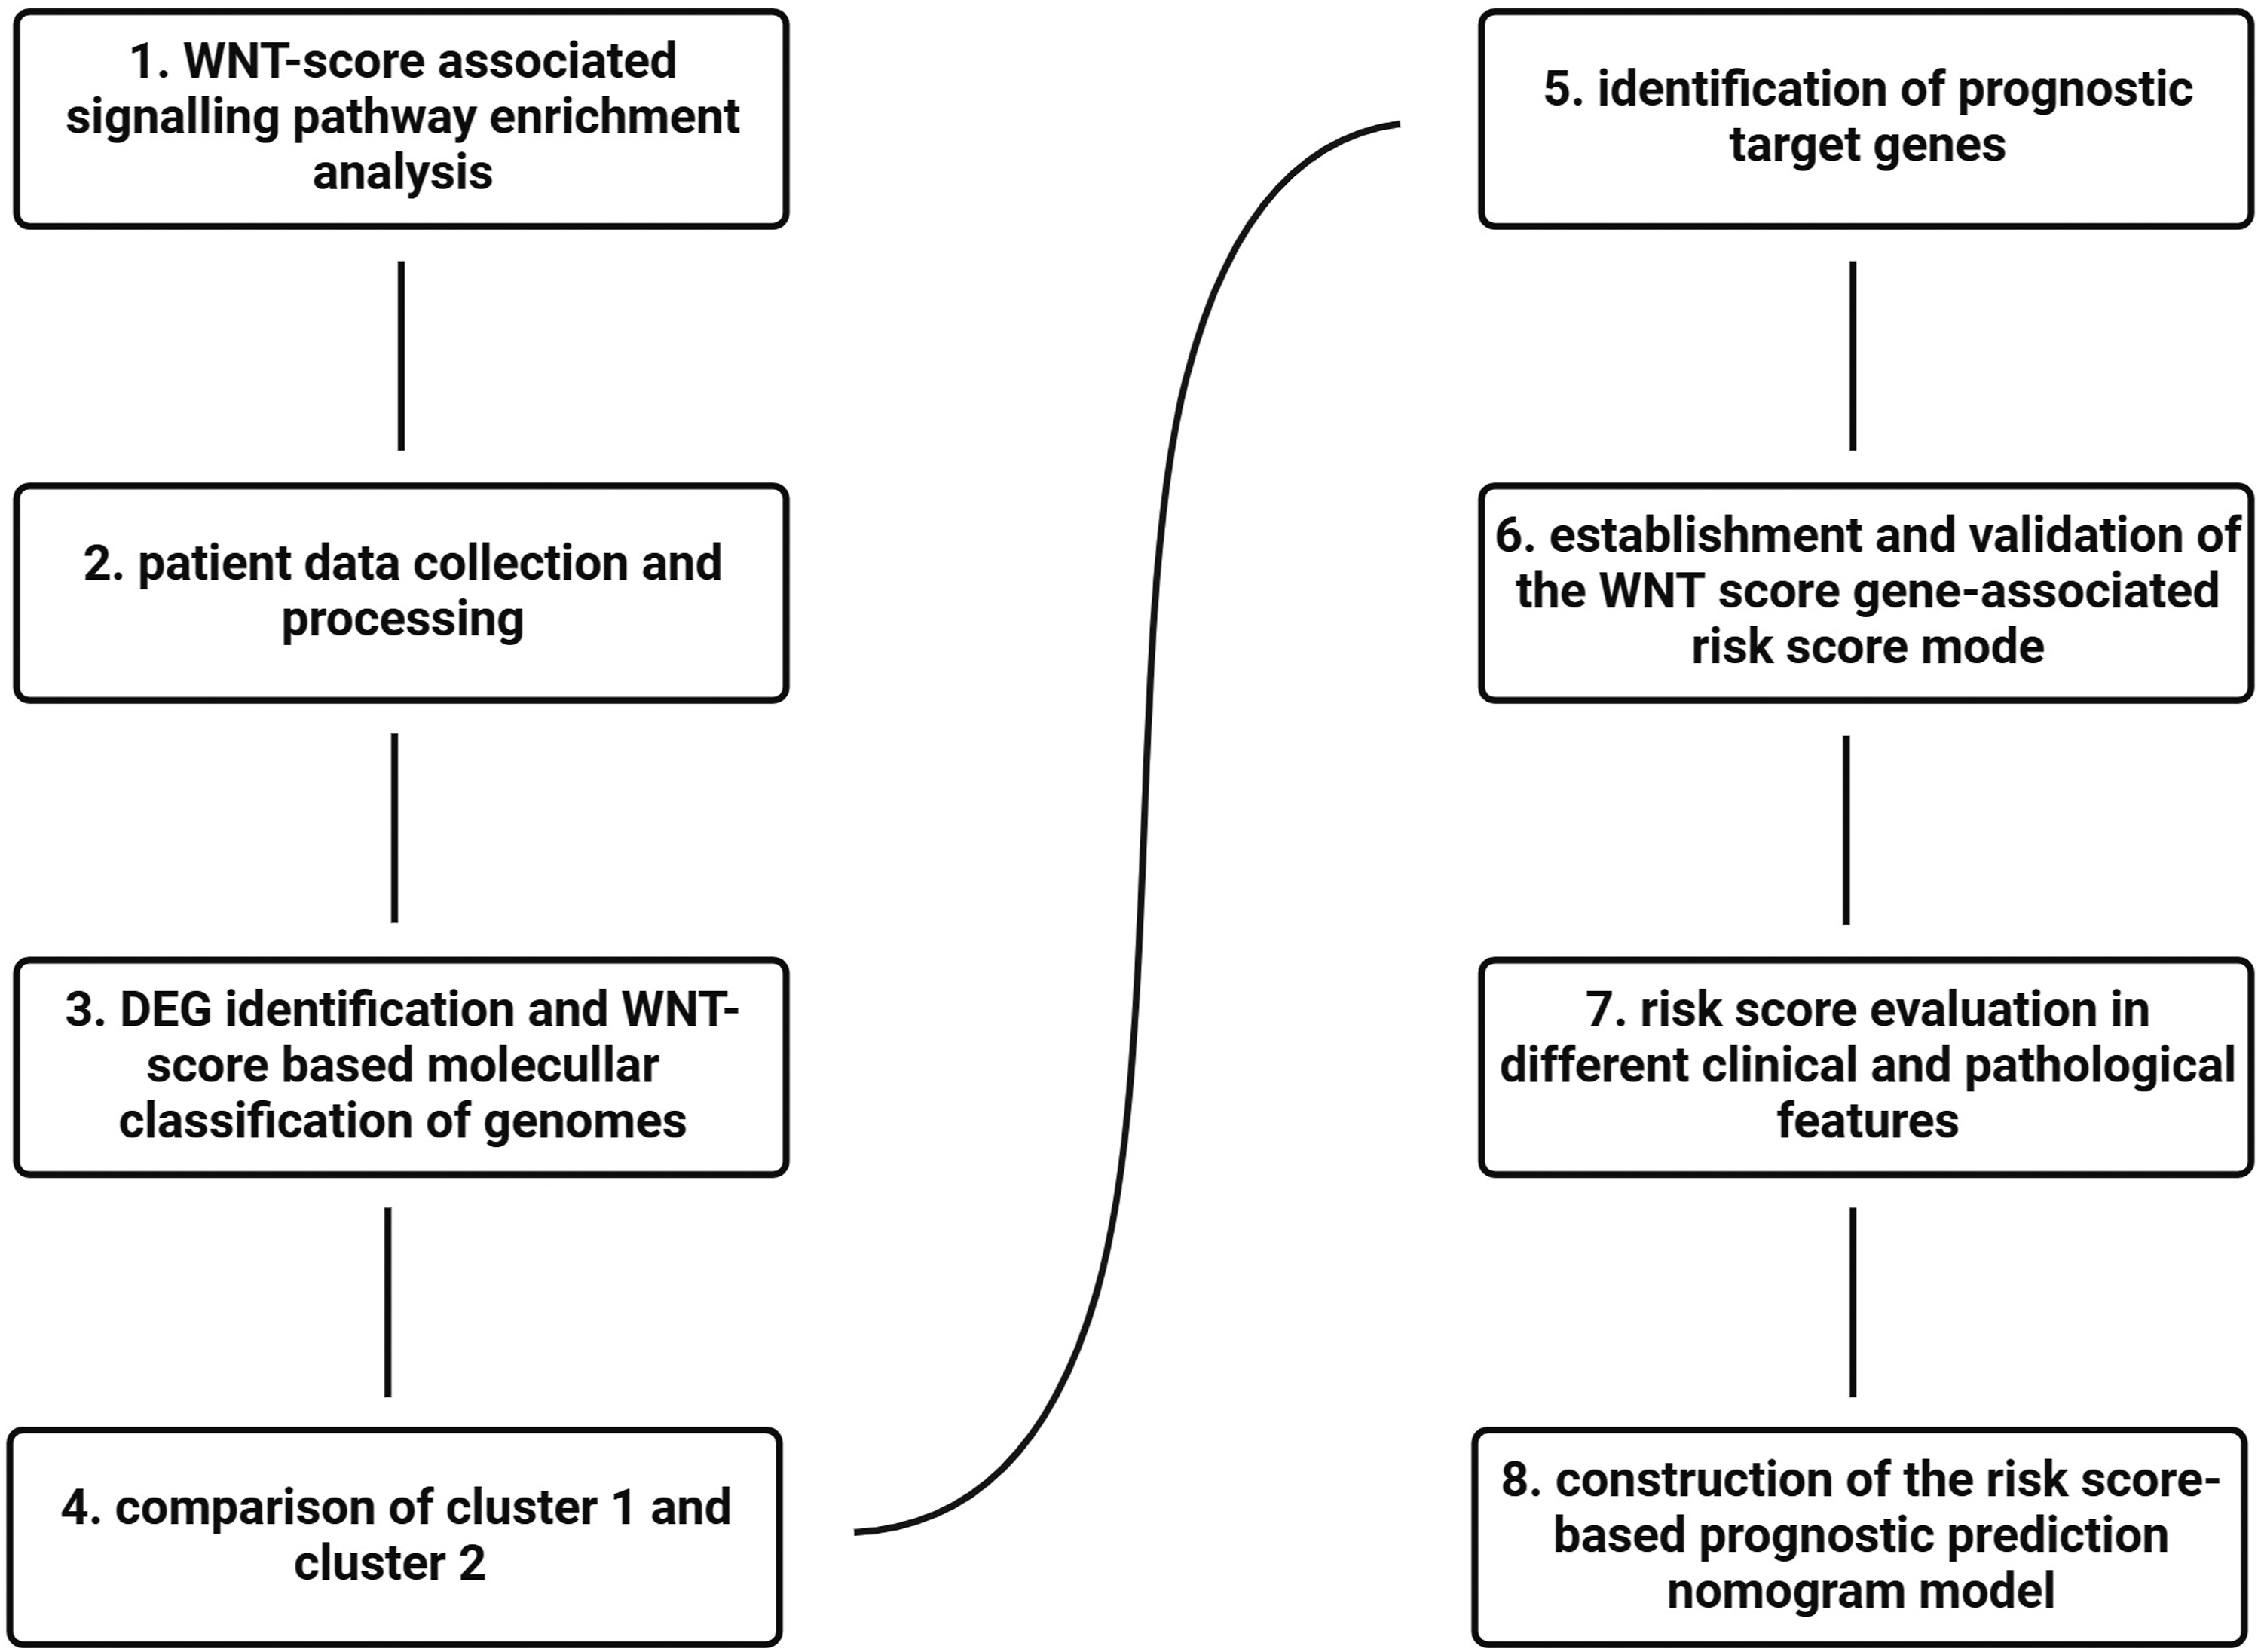
Materials and methods
Data collection
The Cancer Genome Atlas (TCGA) database (https://portal.gdc.cancer.gov/) and the liver hepatocellular carcinoma (LIHC) mRNA expression profiles with fragments per kilobase million (FPKM) values served as the training set. The GSE14520 cohort was downloaded from the Gene Expression Omnibus (GEO) database (https://www.ncbi.nlm.nih.gov/geo/), the HCCDB18 cohort was downloaded from HCCDB18 13 (http://lifeome.net/database/hccdb/home.html), and both served as validation sets. The mRNA expression matrix with transcripts per million (TPM) values was used in the subsequent analyses.
Data processing
All samples from the TCGA-LIHC cohort were processed by strict selection and normalisation. HCC samples with incomplete clinical information were excluded. The Bioconductor biomaRt package (v. 2.40.1) (https://bioconductor.org/packages/release/bioc/html/biomaRt.html) was used to convert the Ensembl IDs (https://useast.ensembl.org/index.html) into gene symbols of transcriptional expression data. The average expression value was used in the event of multiple gene symbols. Three hundred and sixty-five samples were obtained for the subsequent investigation.
Samples without clinical follow-up, survival time, or survival status information were omitted from the GSE14520 cohort. The Bioconductor R package (https://www.bioconductor.org/install/) was used to map the chip probe to human gene symbols. Probes corresponding to multiple genes were removed. When genes corresponded to multiple probes, the average was taken as the gene expression value. Two hundred and twenty-one samples were selected from the GEO database. For the HCCDB18 dataset, samples without clinical follow-up, OS time, survival status, or genomic profile data were removed. RNA sequencing (RNA-Seq) data were acquired for 203 samples from HCCDB18.
DEG identification and gene enrichment analysis
The single-sample gene set enrichment analysis (ssGSEA) algorithm was applied to the WNT signalling pathway and the WNT score was calculated. Correlations between the WNT score and the protein-coding genes (PCGs) were calculated for the TCGA dataset. The thresholds R >.4 and P < .05 disclosed 2817 PCGs that were positively associated with the WNT score. The WebGestaltR package in R (https://www.rdocumentation.org/packages/WebGestaltR/versions/0.4.6) was used in the biological functional enrichment analysis of the 2817 PCGs.14,15
Gene Set Enrichment Analysis (GSEA)
GSEA (https://www.broadlnstitute.org/gsea/) was applied to identify the biological states and gene expression patterns according to all candidate gene sets in the Hallmark database. 16 The coxph function in R (https://www.rdocumentation.org/packages/survival/versions/3.5-7/topics/coxph) was used for univariate Cox analysis.
ConsensusClusterPlus analysis
ConsensusClusterPlus (https://bioconductor.org/packages/release/bioc/html/ConsensusClusterPlus.html) was used to conduct consensus molecular subtyping and determine WNT score-related subtypes in the TCGA-LIHC transcriptomic dataset. The optimal number of clusters was determined to be k = 2 and was based on the clustering score for the cumulative distribution function (CDF).
Mutation data analysis
Genomic anomalies including single-nucleotide and structural variants as well as copy number changes occur in cancer genomes. 17 Mutect2 (https://gatk.broadinstitute.org/hc/en-us/articles/360037593851-Mutect2) was used to describe the somatic mutation data of two clusters. Genes with mutation frequency >3 were selected and 2564 were obtained. Fisher’s exact test was performed to screen genes with significant numbers of high-frequency mutations per subtype. The selection threshold was P < .05, and 47 genes were obtained.
DEG identification and signalling pathway enrichment analysis
The limma package in R (https://bioconductor.org/packages/release/bioc/html/limma.html) was used to identify the differentially expressed genes (DEGs) between Clusters 1 and 2. The thresholds were P < .05 and |FC| > .05. WebGestaltR was used to perform biological functional enrichment analyses of the DEGs in the TCGA-LIHC and HCCDB18 datasets.
WNT score-based prognostic model construction and validation
Univariate Cox analyses were conducted on the WNT score-associated DEGs in the TCGA-LIHC and HCCDB18 cohorts and 724 common DEGs were detected. The TCGA-LIHC cohort was classified into two subcohorts and annotated as training and test sets. Univariate Cox regression analyses were applied to identify prognosis-related risk and protective genes. The least absolute shrinkage and selection operator (LASSO) algorithm was run to reduce data dimensionality and identify the candidate WNT score genes with the best discriminative ability. The risk score was calculated as shown in equation (1) below

Each sample was categorised either into a high risk or low risk score subgroup. 18 The Kaplan-Meier method was applied to plot survival curves for both subgroups in the testing and validation datasets. The clinical characteristics of both subgroups were also compared. The timeROC package in R (https://github.com/cran/timeROC) was used to analyse the receiver operating characteristics (ROC) of the prognostic risk score subgroup classification.
Immune infiltration and Tumour Microenvironment (TME) evaluation
The absolute abundance of immune cells was determined by the Microenvironment Cell Populations-counter (MCP‐counter) method. The MCP-counter in R (https://github.com/ebecht/MCPcounter) was also used for ssGSEA and to characterise tumour immune infiltrating patterns. The ESTIMATE, stromal, and immune scores were calculated using the ESTIMATE package in R (https://rdrr.io/rforge/estimate/man/). 19 Cell types were identified by estimating the relative RNA transcript subsets. The CIBERSORT algorithm (https://cibersortx.stanford.edu) was applied to determine the relative abundances of 22 infiltrating immune cells in LIHC tissues. The efficacy and response to immunotherapy in patients with HCC patients were established via the tumour immune dysfunction and exclusion (TIDE) algorithm (http://shinyapps.datacurators.nl/tide/). 20
Cell culture, RNA extraction, and RT-PCR
Huh7 and LO2 cells were cultured at 37°C under a 5% CO2 atmosphere. A Qiagen RNA Extraction Kit (No. 74204; Qiagen, Hilden, Germany) was used to extract the total RNA. A NanoDrop 2000 instrument (Thermo Fisher Scientific, Waltham, MA, USA) was used to determine RNA purity and concentration. HiScript II Q RT SuperMix for qPCR (+gDNA wiper) (No. R223-01; Vazyme Biotech, Shanghai, China) was used to transcribe the RNA into cDNA. ChamQ Universal SYBR qPCR Master Mix (No. Q711-03; Vazyme Biotech) and an ABI-7500 RT-PCR System (Applied Biosystems Inc., Foster City, CA, USA) were also used. The 2−ΔΔCt method 21 was used to quantify relative RNA expression. The primer sequences are listed in Supplementary Table 1.
Analysis of target genes using single-cell sequencing data
TISCH2 (http://tisch.comp-genomics.org/home/) was used to evaluate the relative expression levels of the target genes in patients with HCC as well as the various cell types associated with this disease.
Results
WNT score-associated signalling pathway enrichment analysis
We used the WebGestaltR package in R to subject the 2817 DEGs to the Kyoto Encyclopedia of Genes and Genomes (KEGG) and Gene Ontology (GO) enrichment analyses and determine the biological functions of the WNT score-related PCGs. The GO enrichment analysis revealed that 1351 signalling pathways (false discovery rate (FDR) < .05) were significantly enriched in biological processes, 140 others (FDR <.05) were significantly enriched in molecular functions, and 140 others (FDR <.05) were significantly enriched in cellular components. We selected the top 10 enriched signalling pathways including tissue morphogenesis, blood vessel morphogenesis, and small GTPase-mediated signal transduction in the GO biological process category. The anchoring junction, adherens junction, and actin cytoskeleton signalling pathways were significantly enriched in the cellular component category. The cell adhesion molecule binding, Ras GTPase binding, and other signalling pathways were significantly enriched in the molecular function category (Supplementary Figure 1(a)–(c)). The KEGG analysis revealed that 94 significant DEGs (FDR <.05) were enriched in the top 10 signalling pathways including cancer, phosphoinositide3-kinase (PI3K)-protein kinase B (Akt), regulation of actin cytoskeleton, and Ras-associated protein 1 (Rap1) (Supplementary Figure 1(d)). The preceding results suggest that WNT score-associated DEGs are widely implicated in cellular biological functions such as tissue morphogenesis, blood vessel morphogenesis, anchoring junctions, adherent junctions, cell adhesion molecule binding, cancer, and PI3K-Akt.
WNT score-based molecular classifications of genomes
We downloaded LIHC samples with positively correlated gene expression levels from TCGA and the HCCDB18 genomic profile matrix to identify WNT score-based clusters. We performed a univariate Cox analysis and identified 995 and 37 prognostic risk and prognostic protective factor genes, respectively, in TCGA dataset. We also obtained 105 and 420 prognostic risk factor and protective genes, respectively, in the HCCDB18 dataset. We intersected both groups and identified 81 and 24 common prognostic and protective genes, respectively (Supplementary Figure 2). We performed a ConsensusClusterPlus analysis with the CDF on k = 2–10 (Figure 2(a)). We designated k = 2 as the optimal cluster number and classified patients into Clusters 1 and 2 according to the CDF value (Figure 2(b)). We then performed an OS analysis and found that Cluster 1 had an extremely significantly shorter OS time than Cluster 2 (P < .0001) (Figure 2(c)). The survival status events in the TCGA-LIHC cohort indicated that Cluster 2 had a remarkably higher % survival than Cluster 1 (Figure 2(d)). For the HCCDB18 dataset, Cluster 1 had a significantly poorer prognosis and a higher mortality rate than Cluster 2 (Figure 2(e) and (f)). Consensus clustering analysis classified the samples into two different clusters. (a) CDF and CDF delta area curves of the TCGA-LIHC cohort. (b) Sample clustering heatmap when the consensus k = 2. (c) Kaplan-Meier curve of the WNT score based on two clusters in the TCGA-LIHC cohort. (d) Survival status of Clusters 1 and 2 in TCGA. (e) Kaplan-Meier curve of the WNT score based on two clusters in the HCCDB18 cohort. (f) Survival status of Clusters 1 and 2 in HCCDB18.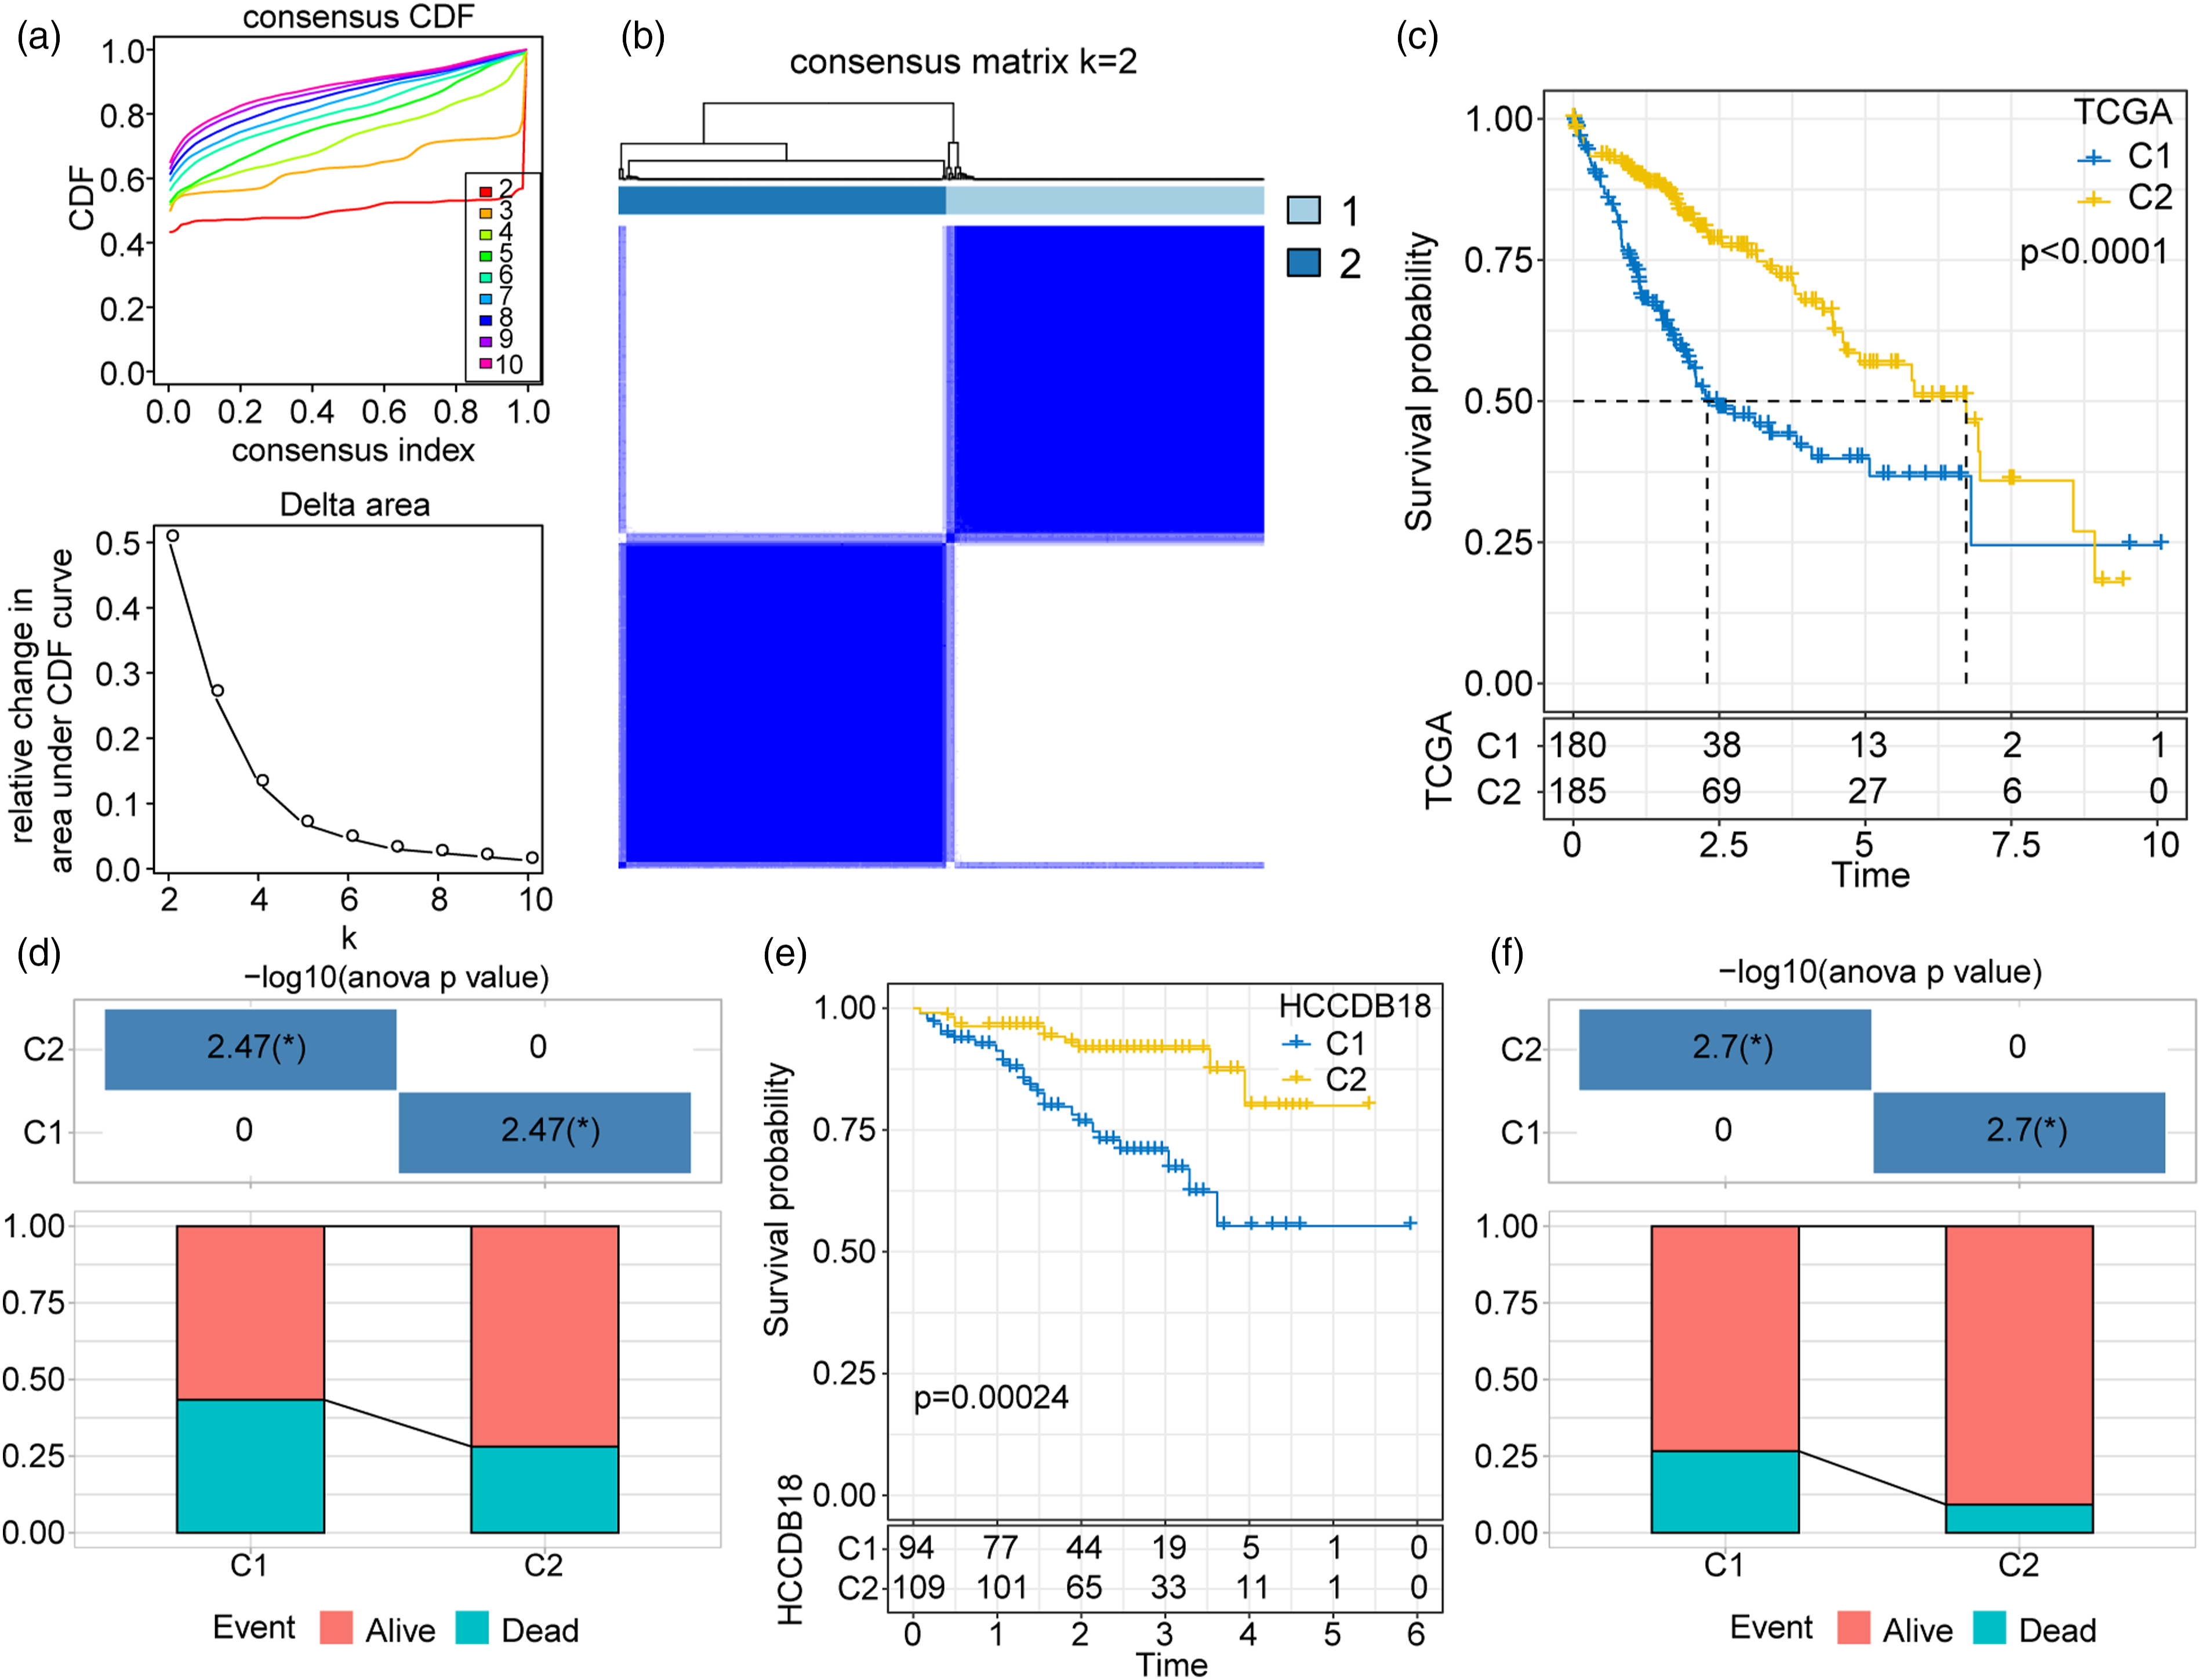
Clinicopathological and pathological characteristics of clusters 1 and 2
We compared the age, gender, tumour grade, T stage, and tumour stage of Clusters 1 and 2 to clarify the relationships between their risk scores and their clinical features. Clusters 1 and 2 significantly differed in terms of tumour grade, T stage, and clinical stage (Supplementary Figure 3(a)–(e)) but not in terms of age or gender. Similar results were also obtained for the HCCDB18 cohort (Supplementary Figure 3(f)–(h)).
Mutations in clusters 1 and 2
We then determined the top 20 genomic mutations in Clusters 1 and 2. TP53 was the most common mutation in both clusters in the TCGA-LIHC cohort (Figure 3(a) and (b)). Homologous recombination defects (P = 9.2 × 10⁻¹⁰) (Figure 3(c)), fractions altered (P = 4.6 × 10⁻¹⁰) (Figure 3(d)), segment number (P = 1.6 × 10⁻⁸) (Figure 3(e)), and tumour mutation burden (P = .0012) (Figure 3(f)) were substantially higher for Cluster 1 than for Cluster 2. Genomic mutation characteristics and enriched signalling pathways in Clusters 1 and 2. (a) Mutation landscapes for Clusters 1 and 2. (b) Genomic mutation evaluation indicators for Clusters 1 and 2. (c-f) Differences in Homologous Recombination Defects, Fraction Altered, Number of Segments and Tumor mutation burden between the two subtypes. (g) A heatmap demonstrating normalized enrichment scores of Hallmark pathways calculated by comparing Clusters 1 with 2.
Gene identification and functional analysis of DEGs between clusters 1 and 2
We applied the limma package to the TCGA dataset to investigate the DEGs and their related biological functions. We identified 1355 DEGs (698 upregulated and 567 downregulated) for Cluster 1. We then performed a gene set enrichment analysis (GSEA) and discovered that the pathways with high normalised enrichment scores (NES) were significantly enriched in E2F targets, G2/M checkpoint, MYC targets, DNA repair, and so on. Pathways with negative NES were substantially enriched in the coagulation, epithelial-mesenchymal transition (EMT), xenobiotic metabolism, bile acid metabolism, interferon-gamma (IFN-γ) response, tumour necrosis factor-alpha (TNF-α) signalling via nuclear factor kappa B (NF-κB), Kirsten rat sarcoma virus (KRAS) signalling, and interferon-alpha (IFN-α) response signalling pathways. We obtained similar results for the HCCDB18 dataset (Figure 3(g)).
Immune features and immunotherapeutic and chemotherapeutic responses of clusters 1 and 2
We applied MCP-counter to ten immune cell types, ssGSEA to 28 immune cell scores, and ESTIMATE to the entire immune microenvironment infiltration score to clarify the TMEs of Clusters 1 and 2. For ssGSEA, the immune scores of 25/28 types of immune cells were higher in Cluster 2 than in Cluster 1 (Figure 4(a)). The MCP-counter analysis revealed that the immune scores of 6/10 immune cells were higher in Cluster 2 than in Cluster 1 (Figure 4(b)). The ESTIMATE analysis demonstrated that the stromal (Figure 4(c)), immune (Figure 4(d)), and ESTIMATE (Figure 4(e)) scores were higher in Cluster 2 than in Cluster 1. The foregoing results suggest that Clusters 1 and 2 markedly differed in terms of their immune microenvironments. We then implemented the HisgAtlas database (http://biokb.ncpsb.org/HisgAtlas/) to evaluate the immune checkpoint gene expression level. We observed that most of the immune checkpoint genes including ARHGEF5, CD276, CD47, CTLA4, LAG3, TNFSF4, and VISTA were more highly expressed in Cluster 1 than in Cluster 2 (Supplementary Figure 4(a)). We used TIDE to evaluate the immunotherapy response and found that Cluster 2 had higher dysfunction and exclusion scores than Cluster 1. The clusters did not significantly differ in terms of their TIDE scores (Supplementary Figure 4(b)). We determined that Cluster 2 was more sensitive to cisplatin (P = 1 × 10⁻⁷), sorafenib (P = 7.2 × 10⁻⁷), pyrimethamine (P = 5.7 × 10⁻³⁰), bortezomib (P = 1 × 10⁻⁷), paclitaxel (P = 2.1 × 10⁻¹²), and crizotinib (P = 1 × 10⁻⁵) than Cluster 1 (Supplementary Figure 4(c)). Estimation of the immune microenvironment characteristics for the WNT score gene-based Clusters 1 and 2. (a) Immune scores of 28 different immune cells in Clusters 1 and 2 were determined from ssGSEA. (b) MCP-counter was used to compare scores for ten types of immune cells. (c–e) Stromal, immune, and ESTIMATE scores for Clusters 1 and 2 were obtained using ESTIMATE.
Prognostic target gene identification
We identified 724 DEGs between clusters in the TCGA-LIHC and HCCDB18 cohorts. We classified the TCGA cohort into training and test sets and identified 133 prognosis risk and 12 prognosis protective genes (Figure 5(a)). We then used the glmnet package in R to perform a LASSO regression analysis and reduce the number of genes in the risk model. We analysed the change track of each independent variable (Figure 5(b)). The number of independent variable coefficients approaching zero gradually increased with λ. We used 10-fold cross-validation to build the model and analysed the confidence interval under each λ (Figure 5(c)). The model was optimal and six genes were identified at λ = .0855. We used the lowest Akaike information criterion (AIC) value to remove other confounding factors and obtained optimal data fitting. We identified UCK2, MARCKSL1, PAGE1, and KLRB1 as the optimal prognosis-related genes (Figure 5(d)) and validated their mRNA expression levels by quantitative polymerase chain reaction (qPCR). WNT score-based prognostic model construction and validation. (a) DEGs were identified in the TCGA and HCCDB18 datasets. (b) Trajectories of the independent variables as λ changes. (c) Confidence intervals under λ. (d) Distribution of the LASSO coefficients for the WNT-related prognostic gene signature. (e) qPCR showing that MARCKSL1, PAGE1, and UCK2 were significantly more highly expressed in Huh7 than in LO2 cells. KLRB1 was downregulated in Huh7 cells compared to LO2 cells. (f) Multivariate Cox forest map of four hub genes. (g) Kaplan-Meier (KM) survival and ROC curves based on the risk scores for the TCGA training dataset. (h) KM survival and ROC curves based on the risk scores in the TCGA validation dataset. (i) KM survival curve, ROC curve, and risk scores for the entire TCGA cohort. (j) KM survival curve, ROC curve, and risk score-based classification of the HCCDB18 cohort. (k) Prognosis and ROC curves for risk score-based classification of the GSE14520 cohort.
Previously reported qPCR analyses showed that MARCKSL1, PAGE1, and UCK2 were upregulated in HCC cells.22–24 We found that these genes were more highly expressed in Huh7 than in LO2 cells. This discovery was consistent with earlier reports. The KLRB1 expression levels were lower in the Huh7 than in the LO2 cells (Figure 5(e)).
We used TISCH2 (http://tisch.comp-genomics.org/home/) to assess target gene expression in single-cell sequencing datasets. Supplementary Figure 5 shows that MARCKSL1 was significantly more highly expressed in malignant tumour cells, endothelial cells, and fibroblasts than in other cell types.
Clinical prognostic model construction and validation
We calculated the risk scores of all samples and assigned the latter to high risk and low risk score subgroups. The forest plot in Figure 5(f) shows the multivariate Cox analyses of the prognosis-related genes UCK2, MARCKSL1, PAGE1, and KLRB1. We plotted OS curves for the high risk and low risk score subgroups and found that the former had extremely significantly shorter OS than the latter (P < .0001) (Figure 5(g)). A time‐dependent ROC analysis revealed that this model had good predictive accuracy for OS in the training cohort (1‐year area under the curve (AUC) = .8, 95% CI = .71–.9; 3‐year AUC = .8, 95% CI = .71–.89; 5‐year AUC = .79, 95% CI = .69–.9). We obtained similar results for the other validation datasets (Figure 5(h)–(k)). We implemented a LASSO regression analysis and identified four prognostic genes with good prognostic and predictive ability for patients with HCC.
Risk score evaluation of different clinical and pathological features
We evaluated the risk scores associated with various clinical features and found remarkable differences in the T stage (P = 1.9 × 10⁻⁶) (Figure 6(a)), clinical stage (P = 1.2 × 10⁻⁶) (Figure 6(b)), and tumour grade (P = 8.1 × 10⁻⁷) (Figure 6(c)) but no significant differences in N stage, M stage, gender, or age subgroup for the TCGA testing dataset (Figure 6(d)–(g)). For the validation HCCDB18 dataset, the risk scores for the advanced clinical stages were significantly higher than those for the T stage (Figure 6(h)–(j)). The risk score for the advanced clinical T stage significantly differed in GSE14520 (Figures 6(k)–(m)). Risk score evaluation for different clinical features. (a–g) Relative risk scores for T stage, N stage, M stage, stage, grade, gender, and age in the TCGA-LIHC cohort. (h–j) Differences in risk score for T stage, gender, and age in the HCCDB18 cohort. (k–m) Comparisons of risk scores for stage, gender, and age in the GSE14520 cohort.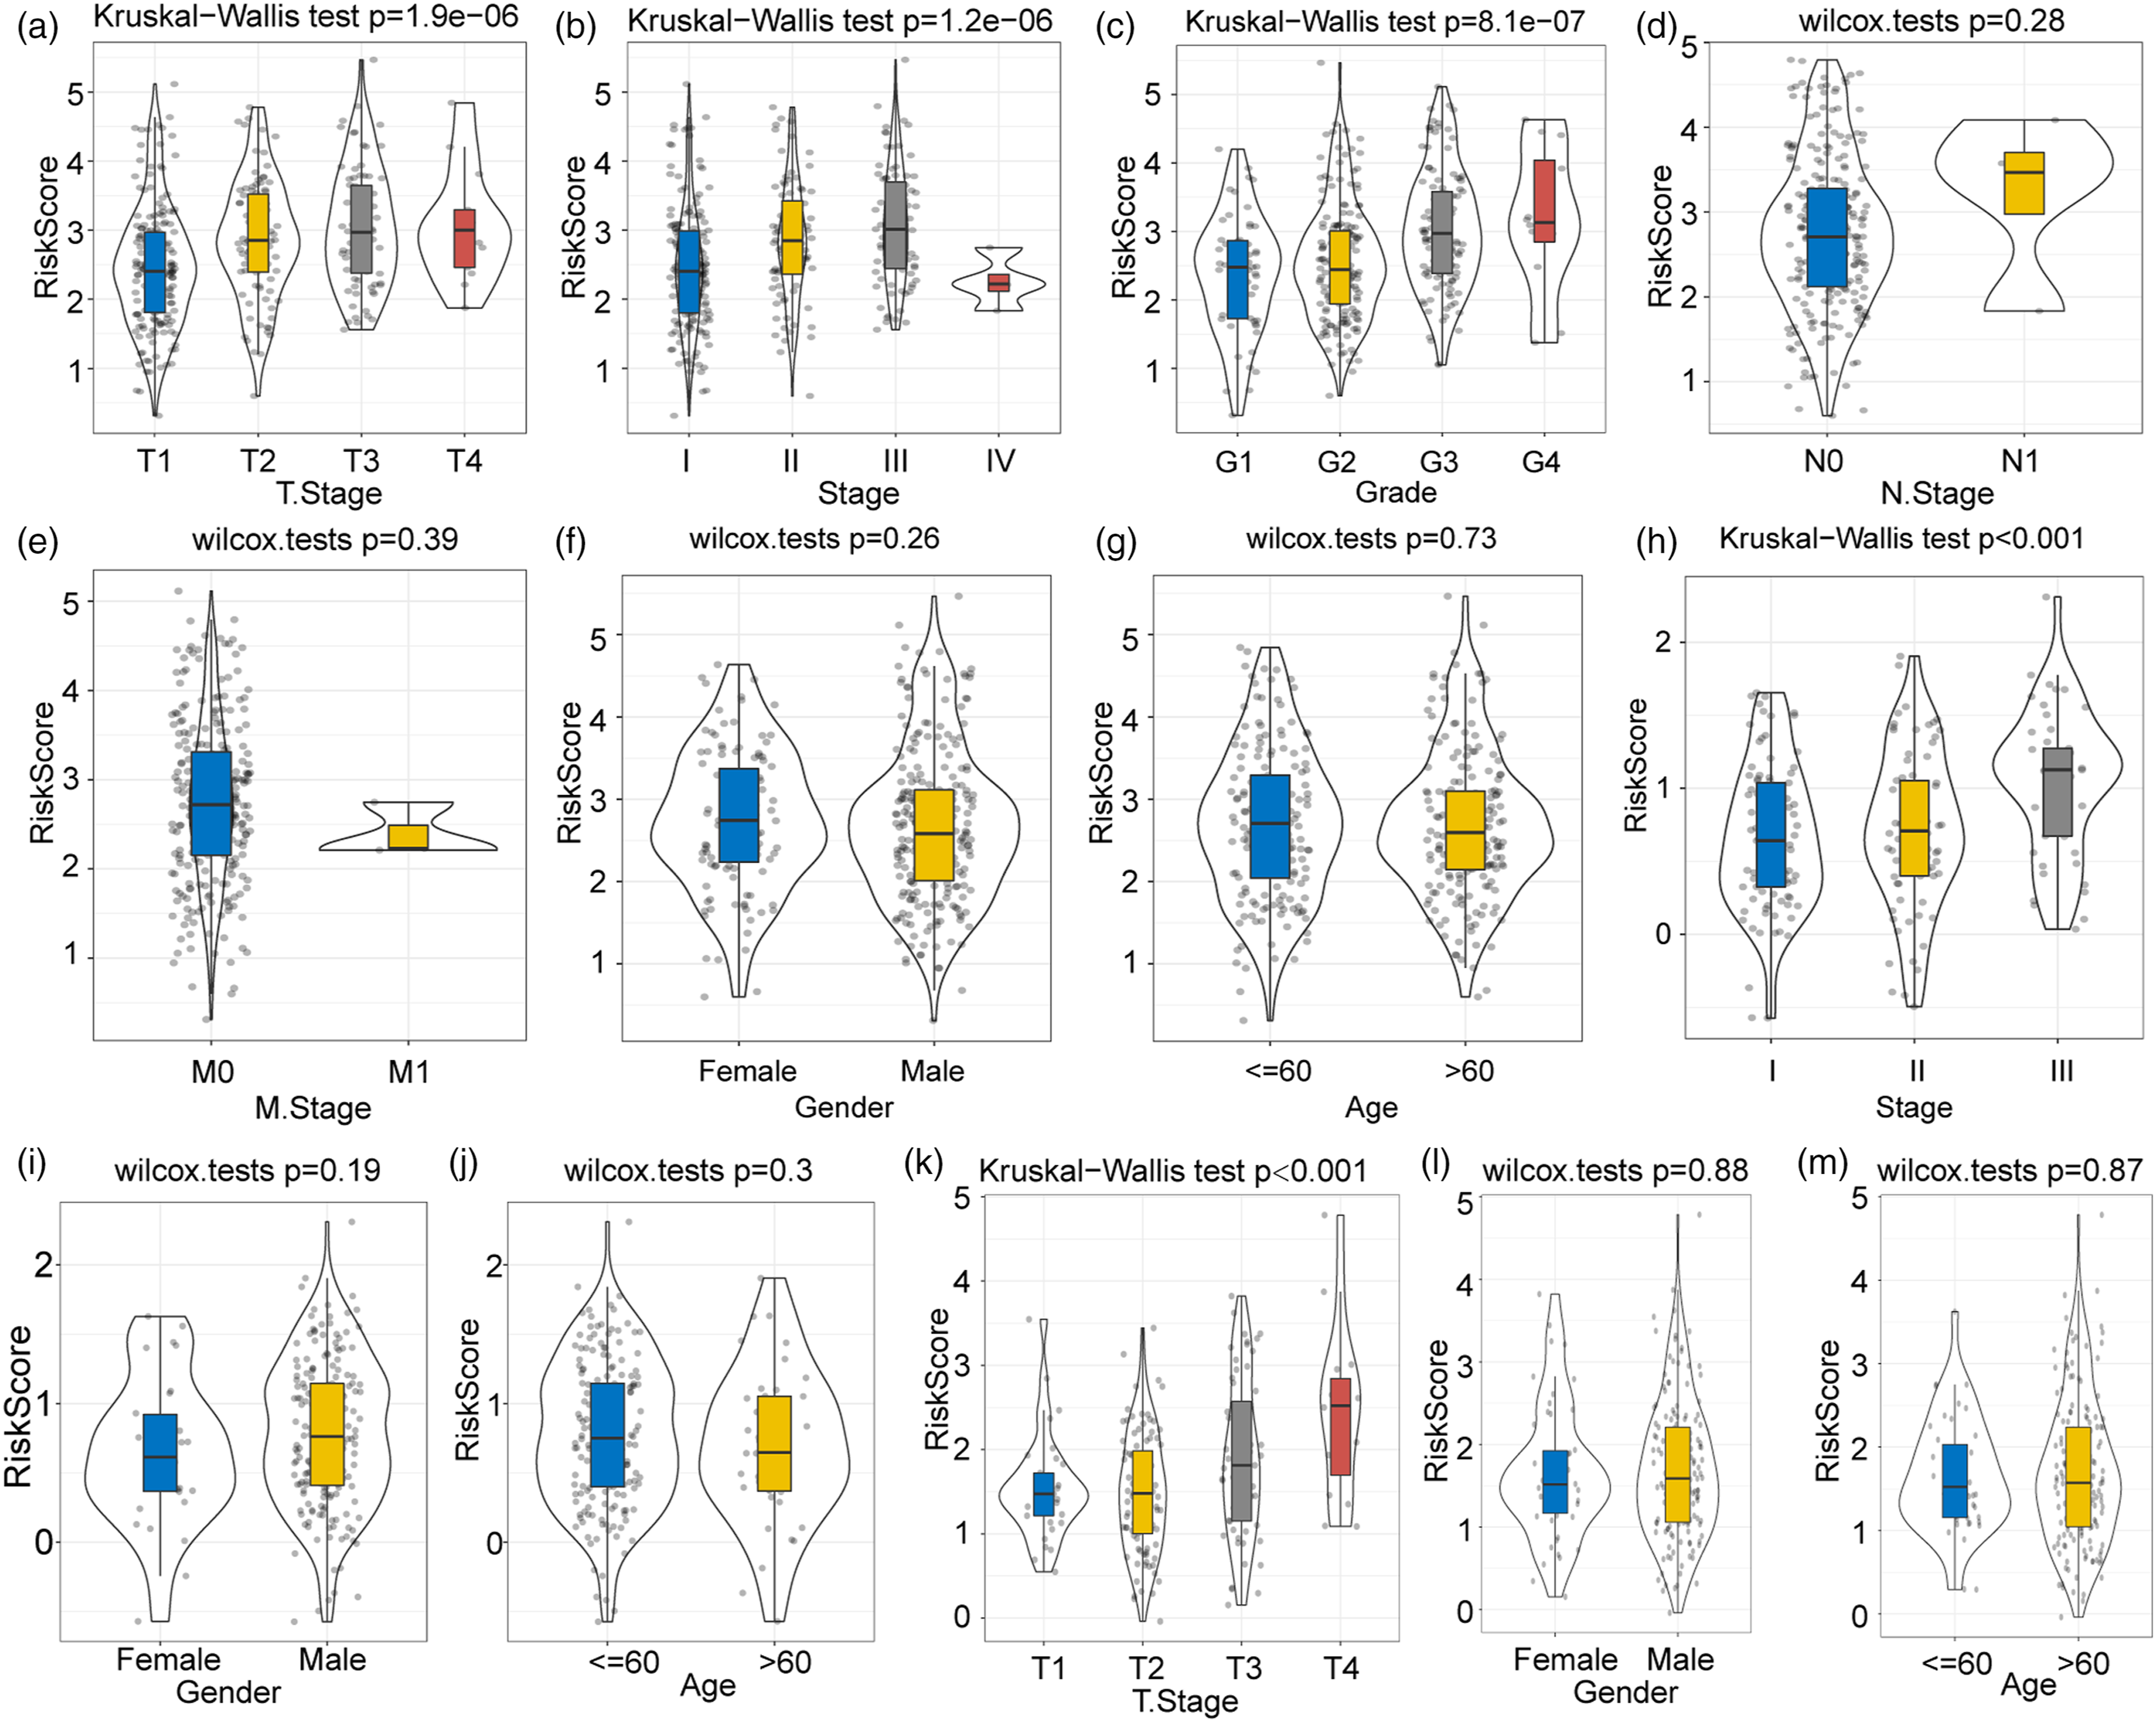
We examined the mutation landscapes of the high risk and low risk score subgroups and discovered that TP53 had the highest mutation frequency in both classes (Figure 7(a)). The homologous recombination defects (P = 1.3 × 10⁻¹²), fractions altered (P = 6.2 × 10⁻¹¹), and number of segments (P = 9.8 × 10⁻⁸) significantly differed between the high risk and low risk score subgroups. Tumour mutation burden did not significantly differ between the high risk and low risk score subgroups (P = .13) (Figure 7(b)). We investigated the correlations between the biological and functional signalling pathways and the risk score and found that the positively correlated signalling pathways included bile acid metabolism, fatty acid metabolism, xenobiotic metabolism, peroxisome, adipogenesis, and oxidative phosphorylation (Supplementary Figure 6(a)). Comparison of genomic profile mutation data for the high risk and low risk score subgroups. (a) Difference in mutation landscape between the high risk and low risk score subgroups. (b) Comparisons of genomic mutation features of the high risk and low risk score subgroups.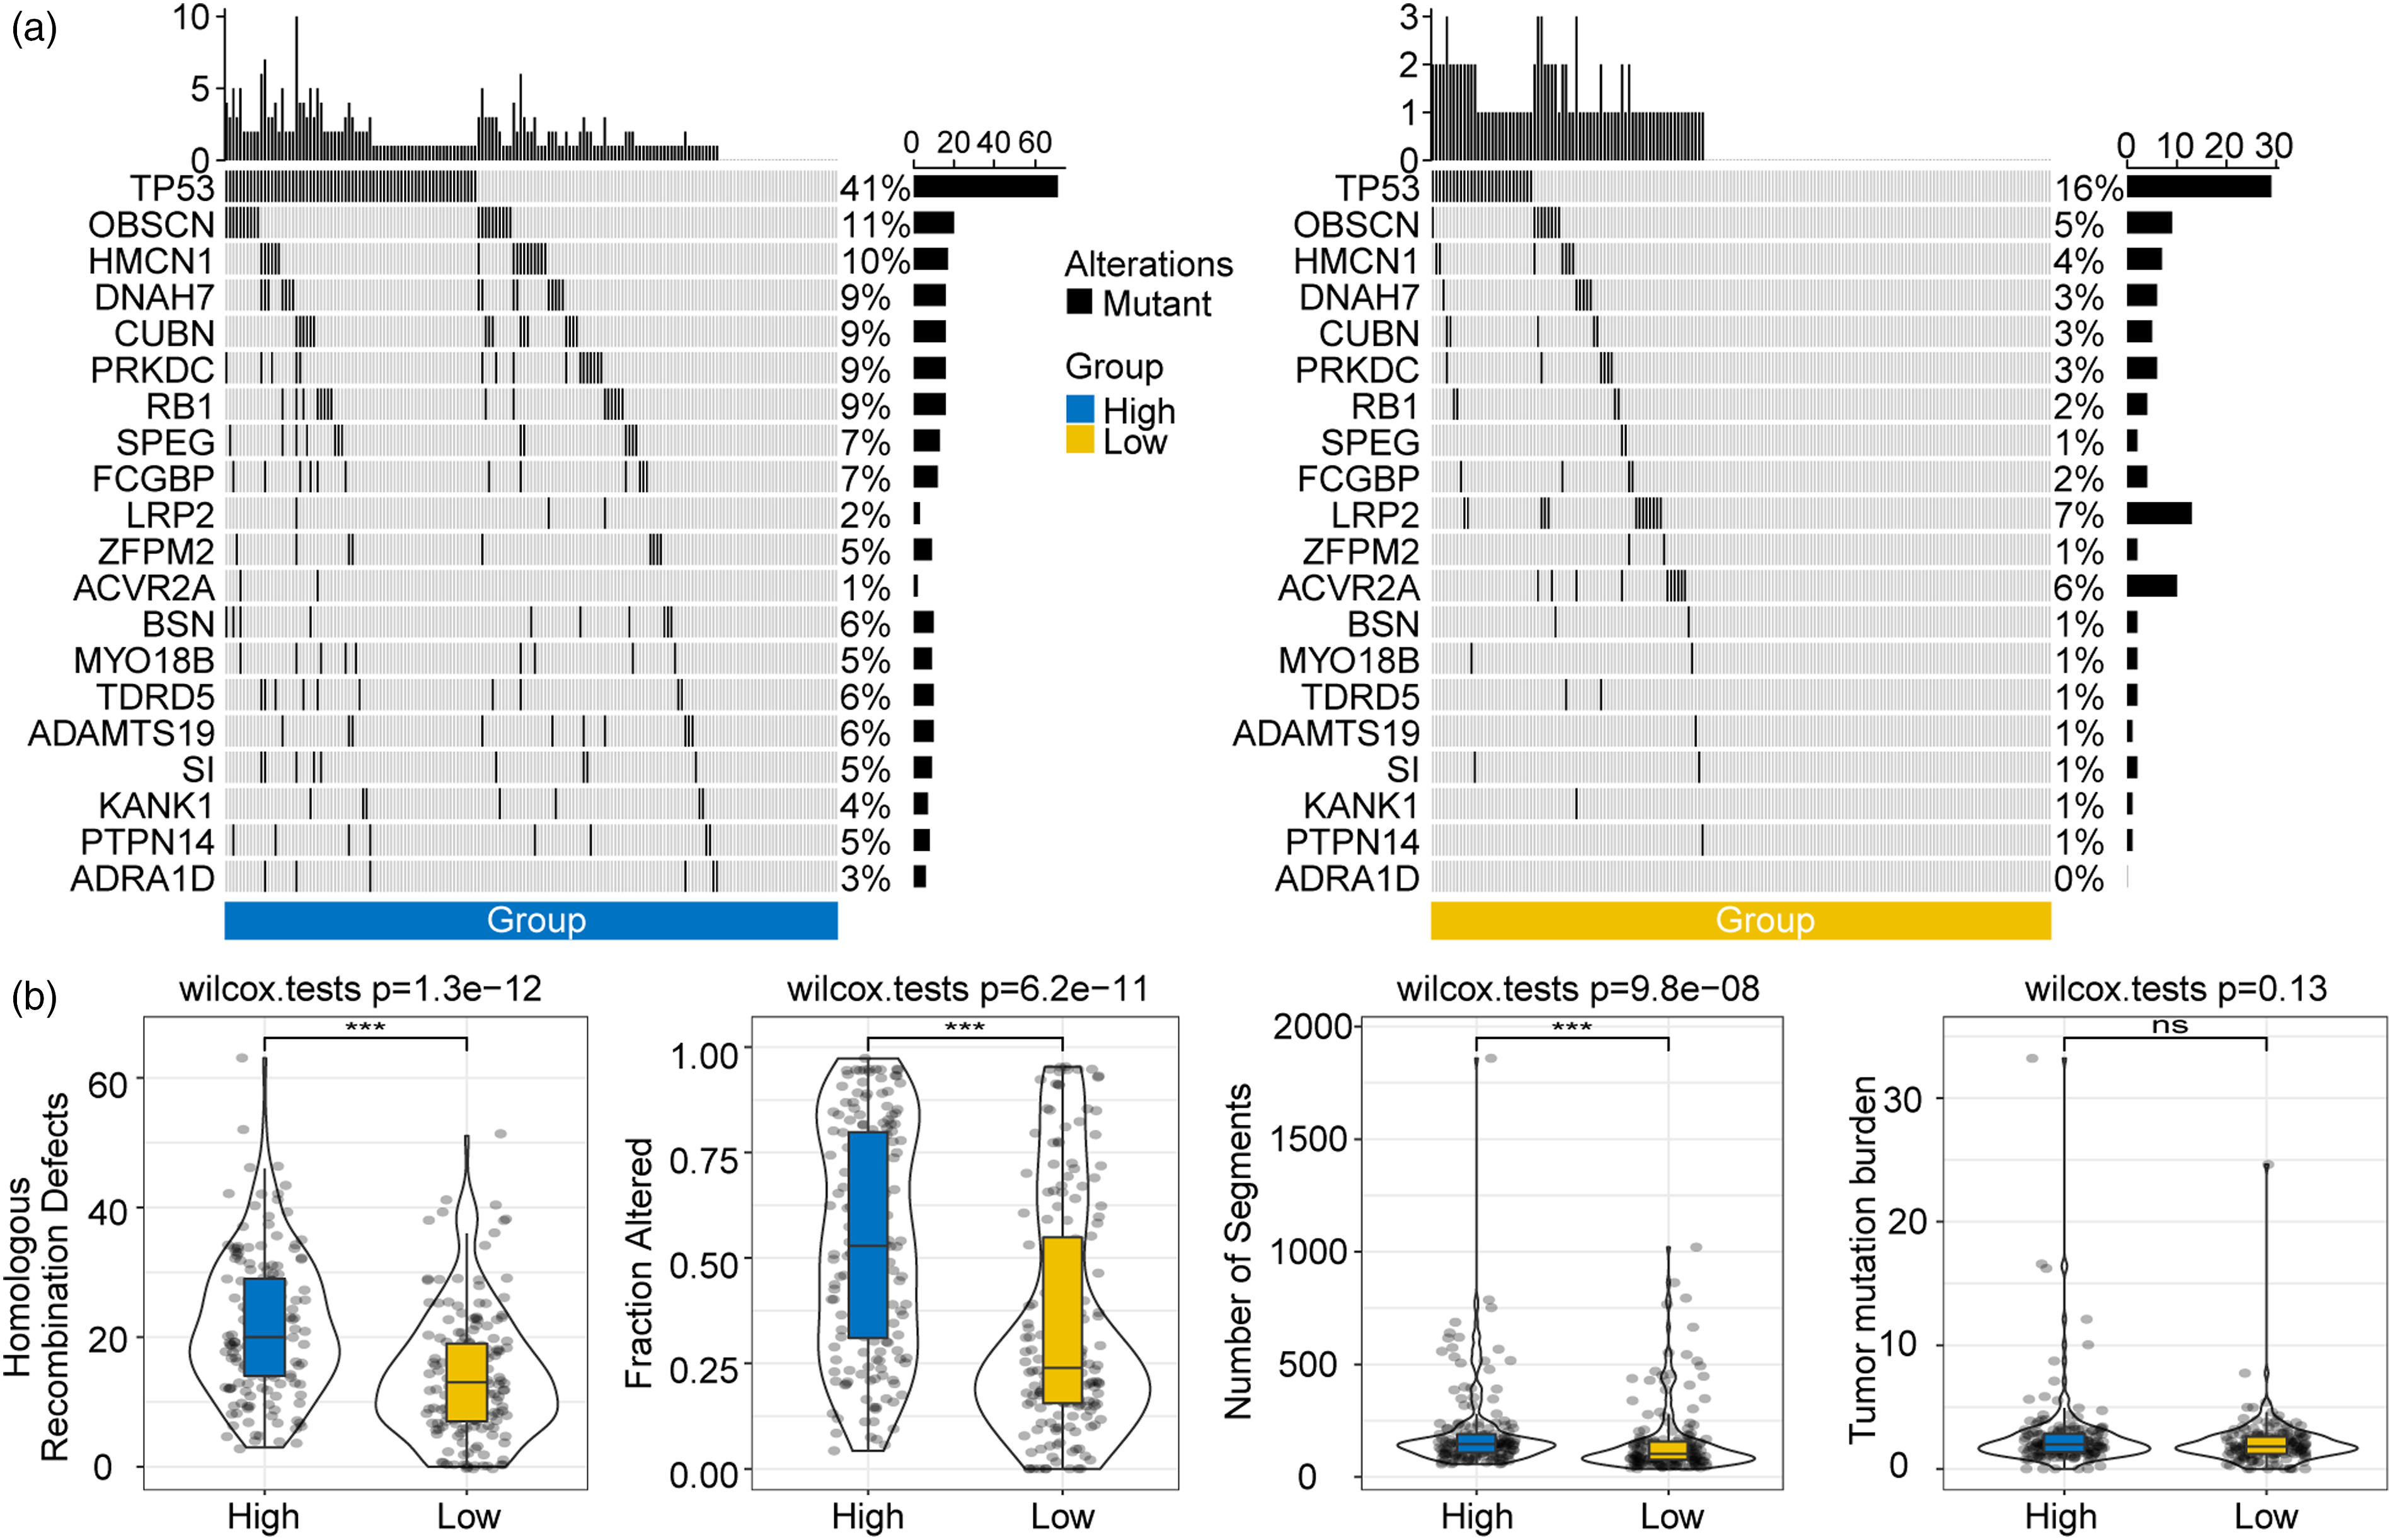
GSEA revealed that compared to the low risk score subgroup, 12 pathways were promoted in TCGA, 12 were promoted and 13 were inhibited in GSE14510, and 14 were promoted and 18 were inhibited in the high risk score subgroup in the HCCDB18 dataset. The active pathways in the high risk score subgroup were enriched mainly in tumour-related pathways such as the E2F target pathways, G2/M checkpoint, MYC target, and mitotic spindle signalling pathways in the TCGA, GSE14520, and HCCDB18 datasets (Supplementary Figure 6(b)).
We also analysed the GSE135222 and GSE91061 datasets to assess the clinical outcomes of patients administered immunotherapy. The Kaplan-Meier curve displayed significant differences in clinical outcomes between the high risk and low risk score subgroups. The progressive disease:stable disease (PD/SD) ratio was significantly higher in the high risk than in the low risk score subgroup. Hence, the patients in the latter were more likely to benefit from immunotherapy than those in the former (Supplementary Figure 7).
Construction of a risk score-based prognostic and predictive nomogram model
We analysed the age, gender, stage, T stage, grade, and risk scores of the patients with HCC in the TCGA cohort and noted that stage, risk score, and T stage were the most powerful parameters (Figure 8(a)). We calculated the Schoenfeld residuals for each of the three latter variables and found that each of them independently satisfied the proportional hazard assumption (Supplementary Figure 8). We classified the patients with HCC into the clusters C1, C2, C3, and C4 and discovered that based on their OS times, the patients in C4 had an extremely significantly poorer prognosis than those in C1–C3 (P < .0001) (Figure 8(b)). Prognostic model correction, calibration, and validation. (a) Patients with complete annotations including risk score, stage, gender, and age were used to build a survival decision tree and optimise risk stratification. (b) There were significant differences in OS among the risk subgroups. (c, d) Comparative analyses of the various groups. (e, f) Univariate and multivariate Cox analyses of the risk scores and clinicopathological features. (g) The nomogram predicted survival more effectively than all other clinicopathological features. (h) Nomogram model. (i) Calibration curves for nomogram predictions at 1, 3, and 5 years. (j) Nomogram decision curve.
C3 and C4 included patients with high risk scores whilst the patients in C1 and C2 had low risk scores (Figure 8(c)). Moreover, the patients in C1 had significantly higher % survival than those in C2–C4 (Figure 8(d)). Univariate and multivariate Cox regression analyses of the risk scores and clinicopathological features established that risk score was the most significant prognostic factor (Figure 8(e) and (f)). We combined the risk score with other clinicopathological features to establish a nomogram and quantify the risk and survival probability of the patients with HCC (Figure 8(g)). The risk score had the greatest impact on survival prediction. We also plotted calibration curves to evaluate the prediction accuracy of the model (Figure 8(h)). The prediction calibration curves for the calibration points at 1, 3, and 5 years were close to the standard curve (Figure 8(i)). Thus, the nomogram has good prediction performance.
We performed a decision curve analysis to assess the reliability of the model and found that the risk score and the nomogram were significantly more beneficial than the extreme curves. Therefore, the nomogram had greater survival prediction ability than the other clinicopathological features.
Discussion
The WNT signalling pathway may comprise one of the molecular mechanisms underlying tumorigenesis. Nevertheless, it remains to be determined how WNT-associated signalling pathways are connected to mutations associated with cancer onset and progression. Here, we constructed and validated a WNT score-based prognostic model that effectively predicted the clinical outcomes, pathological characteristics, mutation landscapes, and TME of HCC.
Under normal conditions, β-catenin is associated with E-cadherin-mediated cell-to-cell junctions and is degraded via the phosphorylation-related ubiquitin-proteasome pathway. The dysregulation of WNT signalling phosphorylates certain components, perturbs the β-catenin degradation complex, causes cytoplasmic β-catenin to translocate to the nucleus, and activates WNT target gene transcription. 25 The mutations associated with cancers mediate mutations in the genes involved in the WNT pathway. 26 In cancers, the components of the WNT pathway dysregulate β-catenin-related gene modification. 27 Moreover, WNT signalling is the predominant oncogenic driver in various cancers.28,29 Aberrant activation of the WNT pathway initiates tumorigenesis and progression in colorectal cancer. 30 In primary liver cancer, oncogenic hepatitis C, hepatitis B, and Epstein-Barr viruses as well as bacterial toxins modulate the components of the WNT pathway, thereby promoting the proliferation, differentiation, and survival of tumour cells that subvert normal biological processes. 29 Various negative feedback regulators balance the WNT signalling pathway by controlling WNT/β-catenin-dependent transcription and ubiquitylation of WNT receptor degradation.31,32
Uridine-cytidine kinase 1 (UCK1) is widely expressed in human skeletal muscle, heart, liver, and kidney tissues. UCK1 catalyses uridine and cytidine phosphorylation. In TCGA, UCK1 expression was significantly higher in HCC tissues than in adjacent normal liver tissues. UCKL1 upregulation, age, and microvascular factors could effectively predict cancer recurrence. 33 Myristoylated alanine-rich C kinase substrate-like protein-1 (MARCKSL1) is a conserved membrane-associated gene regulating cell migration, adhesion, secretion, cell shape, and vessel structure during angiogenesis.34,35 Zhu et al. (2019) 36 reported that MARCKSL1 was highly expressed in patients with HCC and short OS. P antigen family member 1 (PAGE1) may be associated with cancer progression. However, little is known about its roles in the molecular mechanisms of cancers. 37 Cui and Jiang (2022) 22 constructed a signature-based risk score model comprising seven genes (including PAGE1) for the prediction of HCC prognosis. The low risk score subgroup presented longer survival times and lower mortality rates than the high risk score subgroup. Killer cell lectin-like receptor B1 (KLRB1) inhibits the T-cell receptor CD161, and the latter may promote glioma progression and evolution by modulating T-cell dysfunction. 38
Here, we constructed and validated the WNT score based on a four-gene prognostic model which effectively evaluated prognosis, the TME, and therapy response. We identified two HCC subtypes and discovered that Cluster 1 had a worse prognosis than Cluster 2. They significantly differed in terms of tumour grade, T stage, and clinical stage but not in terms of age or gender. Tumor protein 53 (TP53) mutation was the most common in both clusters. Nevertheless, homologous recombination defects, fractions altered, number of segments, and tumour mutation burden were substantially higher for Cluster 1 than Cluster 2. The clusters also markedly differed in terms of their immune microenvironments and chemotherapy sensitivity. Wang et al. (2023) 39 divided HCC into two clusters based on their secretory pathway-related genes and compared their prognoses, adaptive and innate immunity, and immunotherapy sensitivity. Li et al. (2023) 40 classified patients with HCC into two clusters based on their intratumoral hypoxia gene transcriptomes and found that the they differed in terms of their tumour-infiltrating immune cells and genetic mutations. Here, we focused on genes associated with the WNT pathway to identify the HCC clusters and subgroups. The high risk score subgroup presented a poorer prognosis and advanced pathological features compared to the low risk score subgroup. Hence, aberrations in WNT signalling may lead to cancer onset and progression.
This study provided insights into clinical HCC treatment. Our four-gene prognostic predictive model simply and cost-effectively assesses patient prognosis. We analysed the immune features and immunotherapy and chemotherapy responses of different groups of patients with HCC. This information may help healthcare professionals assess immunotherapy and chemotherapy efficacy. We also integrated the risk scores with other clinicopathological features including stage and T stage and plotted a nomogram that demonstrated good prediction performance.
There were certain limitations to the present study. Time and cost constraints impeded the empirical elucidation of the precise mechanisms by which the four aforementioned genes affect tumorigenesis. Moreover, the diagnostic value of the four-gene WNT risk score-based model for HCC remains to be determined. Finally, the present study was retrospective and, therefore, less convincing than a prospective study.
The present work developed and validated a four-gene WNT risk score-based prognostic prediction model which could efficiently forecast the outcome and assess the clinicopathology of HCC.
Conclusion
The WNT score-associated, gene-based model developed and tested herein exhibited strong prognostic prediction ability and could, therefore, facilitate precision decision-making in the prognosis and treatment of HCC.
Supplemental Material
Supplemental Material - Development and evaluation of a risk score model based on a WNT score gene-associated signature for predicting the clinical outcome and the tumour microenvironment of hepatocellular carcinoma
Supplemental Material for Development and evaluation of a risk score model based on a WNT score gene-associated signature for predicting the clinical outcome and the tumour microenvironment of hepatocellular carcinoma by Penghui Li, Xiao Ma, Di Huang, and Xinyu Gu in International Journal of Immunopathology and Pharmacology
Footnotes
Author contributions
P.L. and X.M. contributed equally to this work. X.G. designed and guided the study. P.L. and X.M. analyzed the data and wrote the manuscript. D.H. drew the figures. All authors read and approved the final manuscript.
Declaration of conflicting interests
The author(s) declared no potential conflicts of interest with respect to the research, authorship, and/or publication of this article.
Funding
The author(s) disclosed receipt of the following financial support for the research, authorship, and/or publication of this article: This work was supported by the Science and technology Research program of Henan Province (212102310191) and Henan Medical Science and Technology Joint Building Program (20232096).
Supplemental material
Supplemental material for this article is available online.
Nomenclature
References
Supplementary Material
Please find the following supplemental material available below.
For Open Access articles published under a Creative Commons License, all supplemental material carries the same license as the article it is associated with.
For non-Open Access articles published, all supplemental material carries a non-exclusive license, and permission requests for re-use of supplemental material or any part of supplemental material shall be sent directly to the copyright owner as specified in the copyright notice associated with the article.