
Abstract
The objective of this study was to identify the prognostic biomarkers for hepatocellular carcinoma (HCC) by analyzing the N6-methyladenosine (m6A) RNA modification. HCC is a complex malignant tumor induced by various pathogenic factors. m6A RNA modification and its regulators influence the tumorigenesis and advancement of HCC. RNA sequencing and clinical data were extracted from the TCGA-LIHC and ICGC-LIRI-JP database. Single-cell RNA sequencing data were processed using Seurat and Harmony packages. ConsensusClusterPlus identified molecular subtypes, and ssGSEA quantified m6A regulator-related gene sets. Differentially expressed genes were analyzed, followed by the establishment of a risk model. qRT-PCR validated mRNA expression in Huh7, Hep 3B, and Hep G2 cells and normal hepatocytes. Four molecular subtypes based on m6A regulator transcriptional profiles of m6A regulators were identified, each exhibiting unique clinical, prognostic, and pathway characteristics. A robust risk model distinguished the high- and low-risk groups, revealing obvious differences in immune cells infiltration and chemotherapeutic drug sensitivity. qRT-PCR confirmed significant differential expression of key genes (TRNP1, KIF20A, and CFRHR3) in HCC cell lines and normal hepatocytes. In conclusion, the established risk model may serve as a perspective tool for prognostic prediction, and provide insights into the functions of m6A involved in HCC.
Introduction
Epigenetic modification, mainly comprising chromatin remodeling, DNA methylation, histone and RNA modification, can induce heritable phenotypic alteration without changing the DNA sequence.1–3 Chromatin remodeling dynamically regulates DNA accessibility by altering nucleosome positioning, while DNA methylation typically adds methyl groups to cytosine residues in CpG islands.4–6 Modifications in histone proteins affect the arrangement of chromatin and change the activity of genes. RNA modification, as an important mechanism of post-transcriptional regulation, occurs in different categories of RNA, affecting RNA stabilization and degradation.7,8 Over 150 distinct RNA modifications have been characterized through advanced sequencing technologies and mass spectrometry, with methylation-based modifications representing the most abundant and well-characterized categories.9–11 However, the biological significance of the majority of these RNA modifications remains largely unexplored due to existing technical constraints.
Hepatocellular carcinoma (HCC) is a multifaced malignant tumor caused by various factors, with hepatitis virus infections accounting for almost 50% of new cases.12,13 Additionally, several evidences show that RNA modifications can facilitate tumorigenesis and advancement of HCC via influencing expression patterns of key genes.13–15 Mechanistically, RNA and other epigenetic modifications can alter the liver cell transcriptome and epigenome, resulting in dysregulating and functionally impairing anti-tumor genes and oncogenes.16,17 RNA modifications are significant regulatory factors in HCC, and studying dysregulated post-transcriptional modifications function as a promising method to predicting the prognosis of HCC.
N6-methyladenosine (m6A) modification dynamically regulates the fate of RNA in HCC through regulators.18–21 Specifically, the m6A modification not only exert a pivotal function in the initiate and development of HCC, but impact the immune evasion and response to chemotherapy drugs capabilities of cancer cells.22,23 For instance, m6A regulators such as YTHDF1 promote HCC, while others such as METTL14 exhibit inhibitory effects on metastasis.24–26 These findings highlight the complex function of m6A in HCC and indicate its potential as a target for future personalized therapy.22,27 Despite the evidence from previous studies demonstrating the association between m6A modification and HCC, the exact mechanism in which m6A affects HCC are not yet clearly understood.
In this study, stable molecular subtypes were characterized via the consensus clustering method in HCC. Additionally, the key genes related to m6A regulators phenotype were determined through differential expression analysis. Ultimately, this study established a prognosis model using the above key genes, and assessed its predictive efficiency in training and validation cohorts, aiming to facilitate personalized management strategies for patients diagnosed with HCC.
Materials and methods
Acquisition of data
The data of RNA-seq and clinical information was attained from the TCGA-LIHC project, and 370 samples were considered as the training cohort following the filtering process. Two hundred twelve sample data were used for validation, data extracted from the Integrative Molecular Database of Hepatocellular Carcinoma database. 28 The data about single-cell RNA sequencing were obtained from 10 samples in the GSE149614 set. 29 In addition, 21 m6A regulators included in this study were sourced from the prior research. 30
Preprocessing of data
TCGA-LIHC RNA-seq data were pre-processed by removing samples lacking clinical follow-up or survival status, converting Ensembl IDs, and averaging expressions for genes. GSE149614 dataset was processed in R (version 4.3.0) using the Seurat package. Data reading was performed with the Read10X function. Filtering criteria included genes expressed in a minimum of three cells and cells expressing ⩾200 distinct genes, with mitochondrial gene ratios <15% and total gene counts between 500 and 600. Normalization was conducted using the SCTransform function, followed by RunPCA function. The differences between batches were adjusted using the Harmony software. FindNeighbors and FindClusters were performed to achieve cell clustering. Cell types were identified by referencing marker genes. 31
Identification of the molecular subtypes of m6A regulators
Using the ConsensusClusterPlus package, a consensus matrix was constructed to identify molecular subtypes associated with m6A regulators through clustering analysis. 32 The km algorithm and “1-Spearman correlation” were employed, with 500 bootstraps including 80% of training set patients each time. Cluster numbers ranged from 2 to 10, and the best number was defined via consensus cumulative distribution function (CDF). This process revealed four distinct molecular subtypes. Ultimately, four distinct molecular subtypes were identified.
Single-sample gene set enrichment analysis (ssGSEA)
ssGSEA allows for setting an enrichment score to each gene set within individual samples of a designated dataset, thereby quantifying its enrichment level. The relative enrichment of the gene expression dataset from individual samples can be estimated by comparing this gene set against a specific gene set (m6A regulators).
Establishment of a risk model
Differentially expressed genes (DEGs) across the four molecular subtypes were detected using the limma package, applying the thresholds of |log2FC| > 1 and P < 0.05. These DEGs were then intersected for preliminary gene screening. Univariate Cox regression further filtered for prognostic-associated genes, which were subsequently refined via multivariate Cox regression using LASSO regression from the glmnet package to identify significant prognostic genes. RiskScore was calculated as RiskScore = Σβi × Expi. Z-scores were used to standardize RiskScores, assigning patients into high-risk and low-risk groups with a threshold determined as “0.” Survival differences were evaluated by generating Kaplan-Meier curves and performing log-rank tests.
Correlation analysis of risk scores and drug sensitivity
Drug sensitivity was evaluated by calculating IC50 for TCGA-LIHC samples using the oncoPredict package. Further, Pearson correlation analysis was conducted to examine the relationship between drug sensitivity and RiskScore, setting the threshold to P < 0.05 and |cor| > 0.5.
Quantitative real-time polymerase chain reaction (qRT-PCR)
Huh7, Hep 3B and Hep G2 cells, as well as normal hepatocyte line (L02), were cultured in Dulbecco’s modified Eagle medium (Seven Biotech, China) supplemented with 10% fetal bovine serum (ExCell bio, China) at 37 °C in a humidified atmosphere with 5% CO2. The above cell lines were obtained from Baidi Biotech (Hangzhou, China). Total RNA was extracted using FreeZol Reagent (R711-01; Vazyme, China). HiScript III RT SuperMix (R323-01; Vazyme, China) was used to reverse-transcribe 1 μg of RNA into cDNA. Target gene expression was quantified by qRT-PCR using ChamQ Universal SYBR qPCR Master Mix (Q711-02; Vazyme, China) and relative RNA levels was calculated using 2−ΔΔCt method. Primer sequences are provided in Supplemental Materials.
Result
Identify molecular subtypes based on m6A regulators
ssGSEA quantified the enrichment scores of 21 m6A regulators in the TCGA-LIHC cohort, revealing notably higher scores in normal samples compared to HCC samples (Figure 1a). 13 of these regulators showed significant correlations with prognosis (P < 0.05; Figure 1b). Utilizing consensus clustering method applied to the expression profiles of these 13 genes, the best number of clusters was defined as four via CDF analysis (Figure 1c). Heatmap illustrated four distinct molecular subtypes when K = 4 (Figure 1d; Supplemental Table 1). Notably, patients with the C1 subtype exhibited better prognoses, while those with the C4 subtype had poorer outcomes (Figure 1e). Clinicopathological characteristics varied significantly among subtypes, with C4 patients showing more advanced stages, characterized by worse pathological grades and higher clinical stages (Figure 1f). These results showed the diverse prognostic and clinicopathological features across molecular subtypes.

Molecular subtypes based on m6A regulators in the TCGA-LIHC cohort.(a) The box plots of ssGSEA scores. (b) Univariate Cox analysis of m6A regulators in the TCGA-LIHC cohort. (c) Consensus CDF plots to determine the optimal number of clusters. (d) Heatmap of consensus clustering in the TCGA-LIHC cohort. (e) Kaplan-Meier (KM) curves of overall survival for HCC patients with four molecular subtypes. (f) Clinicopathological features of patients with four molecular subtypes in the TCGA-LIHC cohort.
Pathway characteristics of molecular subtypes
Utilizing hallmark genes from the MSigDB database, GSEA clarified these pathways, with an enrichment pathway considered significant at FDR < 0.05. Results showed that metabolic processes, including heme and fatty acid metabolism, were notably active in the C1 subtype. C4 subtype exhibited significant activation of inflammation- and angiogenesis-related pathways (Figure 2a). Comparative analysis of DEGs across subtypes identified 164 DEGs (Figure 2b; Supplemental Table 2). Functional enrichment analysis revealed significant enrichment in the Wnt, cell cycle, and metabolism-related pathways, based on the above DEGs (Figure 2c). A heatmap illustrated the expression levels of these DEGs alongside corresponding clinical features (Figure 2d). Together, comprehensive analysis provided insights into the distinct pathway activations and gene expressions characterizing each molecular subtype.
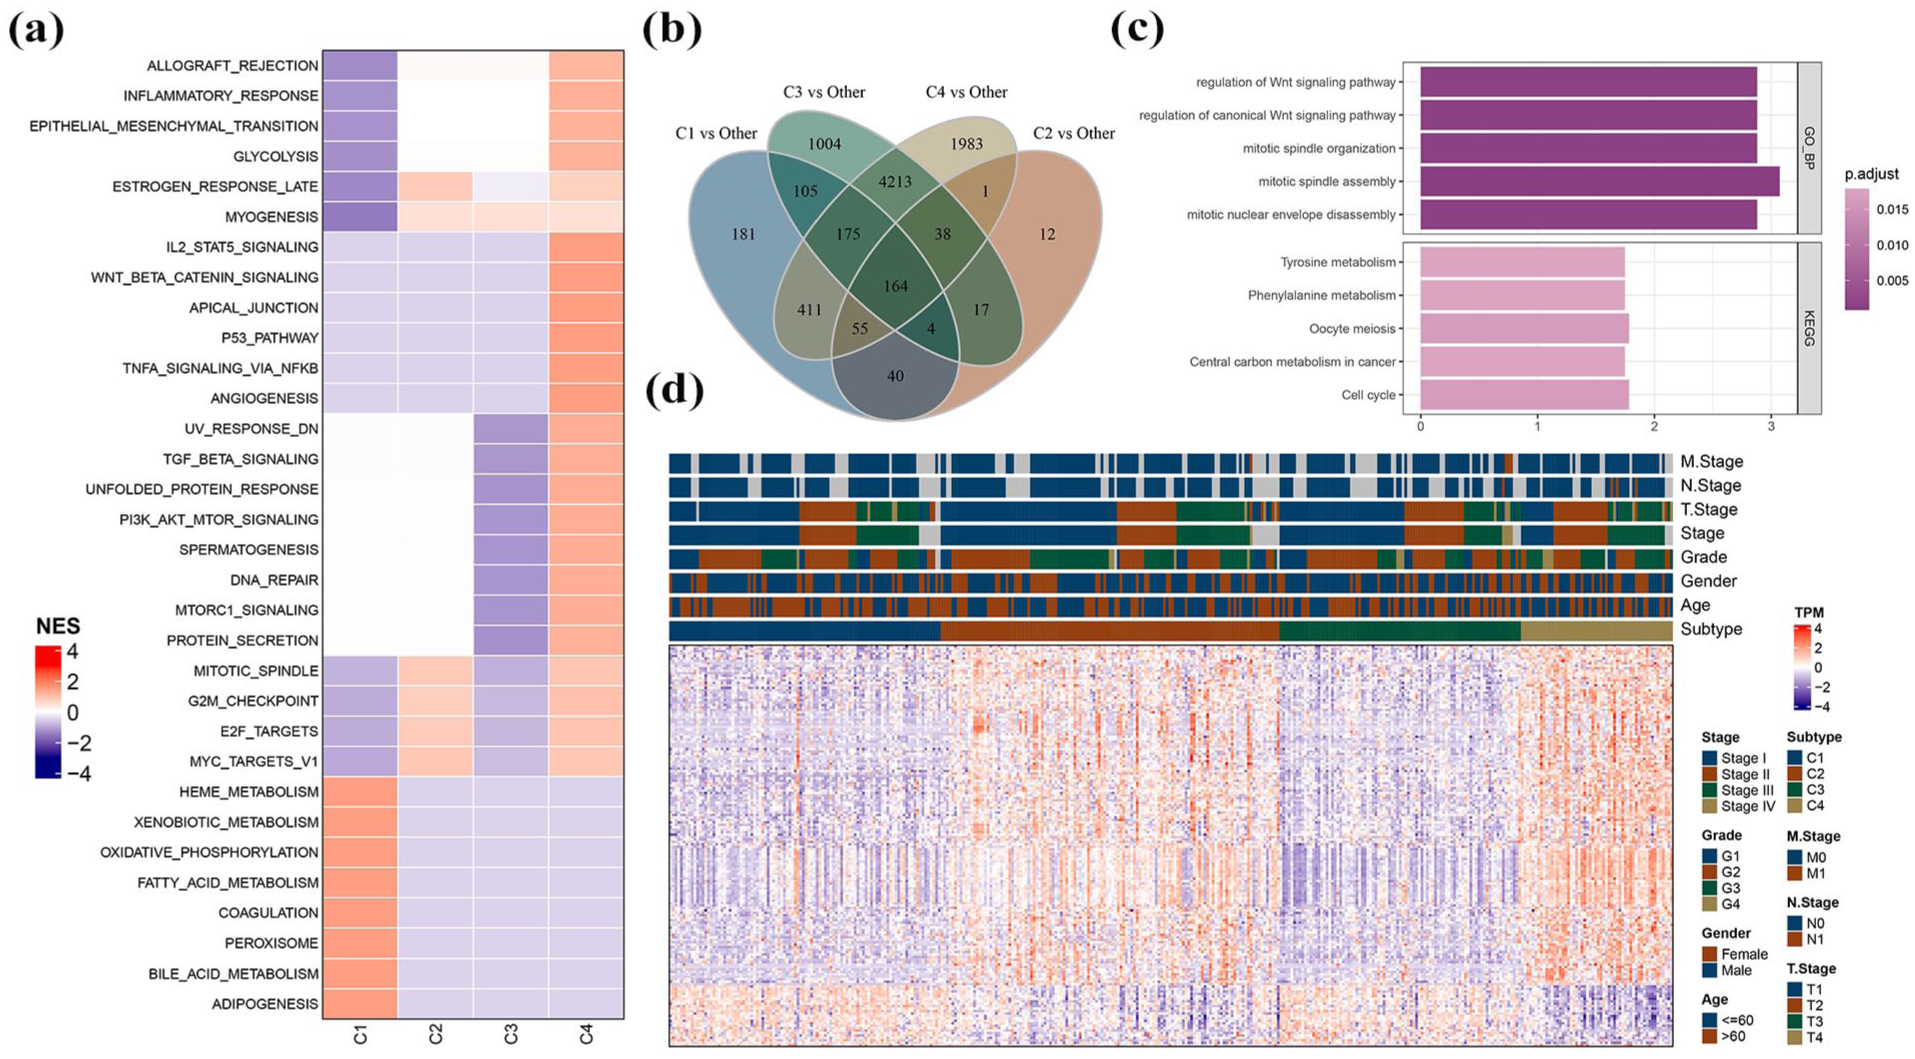
Pathway analysis between different molecular subtypes. (a) GSEA results in the TCGA-LIHC cohort. (b) Venn plots of results in differential expression analyses between different molecular subtypes in the TCGA-LIHC cohort. (c) GO and KEGG functional enrichment analyses of differentially expressed genes in the TCGA-LIHC cohort. (d) Distribution of DEGs between different molecular subtypes in the TCGA-LIHC cohort.
Establishment and confirmation of the clinical prognosis model
Univariate Cox regression of 164 DEGs identified 88 genes notably associated with prognosis (P < 0.05) in the training cohort. To refine the prognostic signature, LASSO regression was applied to these 88 genes. The coefficient shrinkage paths across λ values are depicted in Figure 3a and b. As λ increased, more coefficients approached zero (Figure 3a). A three-fold cross-validation approach was employed to develop the risk model, examining its confidence intervals for each lambda value. Six genes were identified as targets when lambda was set at 0.0482. Subsequently, step-up multivariate regression analysis was performed on these six genes. By applying the Akaike Information Criterion (AIC), which considers both the fit and the complexity of the model, the complex model was simplified by sequentially removing variables to minimize the AIC value. This process resulted in a risk model with fewer variables but adequate fit. Ultimately, three genes emerged as significant prognostic markers: TRNP1, KIF20A, and CFHR3, with CFHR3 acting as a protective factor (Figure 3c; Supplemental Figures 1A–I). The final risk model formula is: RiskScore = 0.123 × TRNP1 + 0.276 × KIF20A − 0.092 × CFHR3 (Figure 3c). Patients with higher CFHR3 expression exhibited better prognosis, earlier clinical stages, and lower AFP (Supplemental Figure 1G–M). TRNP1 and KIF20A showed significant upregulation in HCC to normal hepatocytes, whereas CFHR3 was markedly downregulated (Figure 3d and e). The RiskScore was assessed using the aforementioned formula and standardized via Z-score transformation. In the TCGA-LIHC cohort, 173 samples were stratified into the high-risk group and 197 into the low-risk group according to their RiskScores (Figure 3f). The high-risk group showed significantly poorer prognosis compared to the low-risk group (Figure 3g). ROC curves indicated robust prediction efficiency (Figure 3h). Similar robustness and accuracy were observed in the validation cohort, confirming the model’s performance (Figures 3i–k).

Establishment and validation of clinical prognosis models. (a) Trajectory of each independent variable with lambda value. (b) Confidence intervals based on lambda. (c) Key genes in the prognostic model. (d) Expression levels of TRNP1, KIF20A, and CFHR3 in L02, Huh7, Hep 3B, and Hep G2 cell lines. (e) Expression levels of TRNP1, KIF20A, and CFHR3 in normal and HCC tissues in the TCGA-LIHC cohort. (f) RiskScore, survival time, survival status, and expression levels of three key genes in the TCGA-LIHC cohort. (g) Kaplan-Meier (KM) survival curves between high-risk and low-risk groups in the TCGA-LIHC cohort. (h) ROC curves in the TCGA-LIHC cohort. (i) RiskScore, survival time, survival status, and expression levels of three key genes in the ICGC-LIRI-JP cohort. (j) Kaplan-Meier (KM) survival curves between high-risk and low-risk groups in the ICGC-LIRI-JP cohort. (k) ROC curves in the ICGC-LIRI-JP cohort.
RiskScore functions as a significant prognostic factor for patients with HCC
In the TCGA-LIHC, analysis of clinicopathological characteristics cohort revealed that elevated RiskScores correlated obviously with advanced pathological grades and higher clinical stages (Figure 4a). Both univariate and multivariate Cox regression analyses demonstrated that RiskScore serves as an independent predictor of prognosis (Figure 4b and c). To comprehensively assess patient prognosis, a nomogram was developed (Figure 4d). Within this nomogram, RiskScore showed the strongest influence on predicting survival outcomes. Calibration curves demonstrated that the model’s predictions closely aligned with ideal outcomes, confirming its accuracy (Figure 4e). Decision curve analyses (DCA) indicated that the risk model offered improved stability and potential benefits for patients compared to other clinicopathological predictors (Figure 4f).
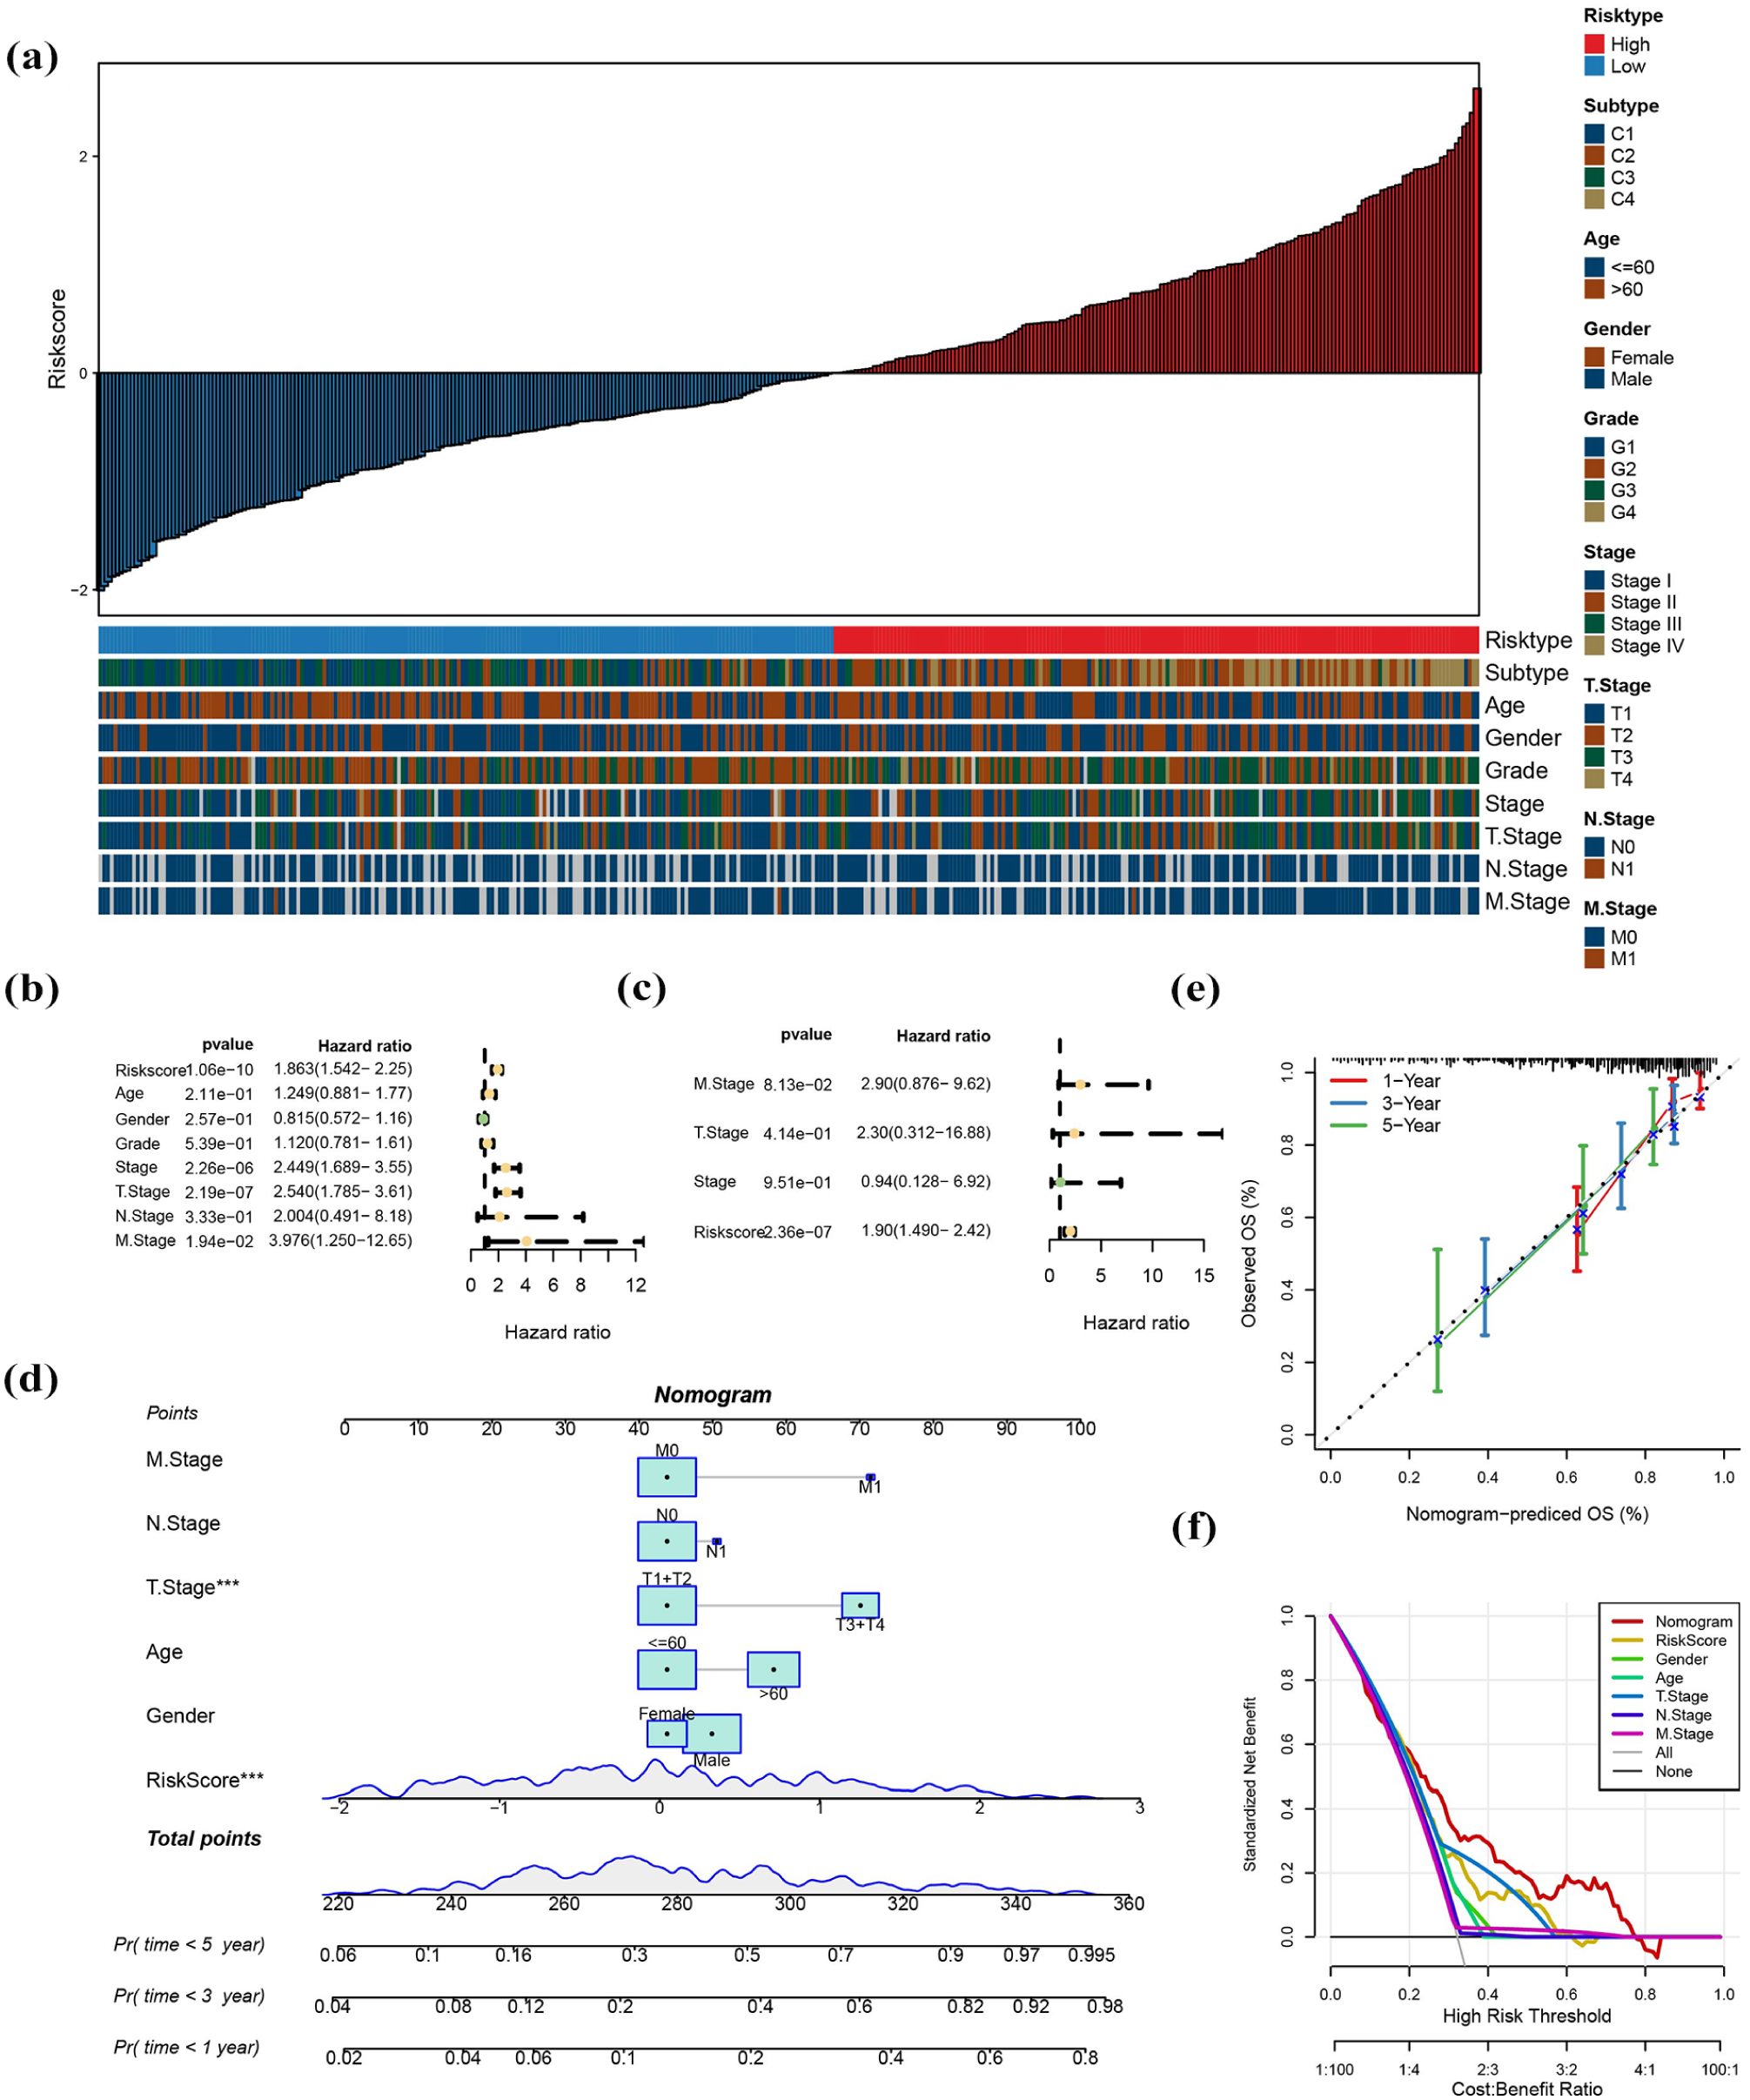
RiskScore functions as a significant prognostic factor for patients with HCC. (a) Differences in clinicopathological features between the high-risk and low-risk groups in the TCGA-LIHC cohort. (b and c) Univariate and multivariate Cox regression analyses. (d) Nomogram constructed with combining RiskScore and clinical features in the TCGA-LIHC cohort. (e and f) Calibration curves and decision curve analysis (DCA) for the nomogram in the TCGA-LIHC cohort.
Relationship between the risk model, immune microenvironment, and chemotherapeutic drug sensitivity
The TIMER platform evaluated the correlation between RiskScore and immune cell infiltration within the HCC microenvironment, 33 revealing significant abundance of various stromal cells and immune cells in the high-risk group (Figure 5a). Furthermore, analysis applied in the TCGA-LIHC cohort highlighted associations between the risk model and chemotherapeutic drug sensitivity. Specifically, eight chemotherapeutic drugs showed significant associations with RiskScore (FDR < 0.5, |cor| > 0.5), with relationships between RiskScore, key gene expression, and drug IC50 values illustrated in Figure 5b. KEGG enrichment analysis of DEGs investigate the potential biological pathways and molecular mechanisms associated with patients prognosis. Notably, top 10 pathways of normalized enrichment scores (NES) indicated that DNA replication and cell cycle pathways, which were essential for cell growth and division, were found to be notably more active in the high-risk HCC group. Conversely, metabolic pathways such as tyrosine metabolism and fatty acid degradation were obviously suppressed in patients classified as low-risk (Figure 5c and d).

The relationship between the risk model and immune microenvironment and chemotherapeutic drug sensitivity. (a) Differences in immune cell scores between high-risk and low-risk groups in the TCGA-LIHC cohort. (b) Correlation analyses between RiskScores, the key genes’ expression levels, and the IC50 values of the chemotherapeutic drugs. (c-d) GSEA between high-risk and low-risk groups in the TCGA-LIHC cohort.
scRNA-seq analysis
To further investigate the cell types related to the occurrence and development of HCC at the single-cell level, the scRNA-seq data of 10 samples in GSE149614 were downloaded. A total of 34,981 cells, including nine major cell subsets, were retained after cell filtering, standardization, dimensionality reduction, and clustering (Figure S2A, B). The above cells were divided into seven cell types based on the expression of maker genes in the clusters (Figure 6a–c; Supplemental Table 3), and the proportions of different cells in different samples were shown in Figure 6d. We compared the differences of the scores of m6A regulators among various cell types, and found that the scores of m6A regulators between different cells differed significantly and the score of m6A regulators in hepatocytes was the highest (Figure 6e). CFHR3, TRBNP1, and KIF20A exhibited significantly higher expression in hepatocytes compared with other cell types (Figure 6f).

scRNA-seq analysis. (a) UMAP of cell clusters. (b) Specific highly expressed genes in different types of cells. (c) Violin plot of marker gene expression levels for different types of cells. (d) Proportions of different types of cells in different samples. (e) Differential distribution of m6A regulators’ scores in different types of cells. (f) Expression levels of TRNP1, KIF20A, and CFHR3 in different types of cells.
Discussion
RNA modifications are intricately associated with various biological processes, including RNA degradation, stability, and interactions with RNA-binding proteins.34,35 The dysregulation of RNA modification is significantly associated with the occurrence and development of various diseases, especially cancers.36,37 m6A RNA modification is the most common type of RNA modifications, and its involvement in the initiation, advancement, and prognosis of HCC has attracted wide attention.38–40 Previous studies have confirmed that most m6A regulators, such as METTL3, WTAP, YTHDF1, are dysregulated and facilitate the progression of HCC, resulting in poor prognosis of HCC patients.11,41–43 However, the m6A regulator METTL14 can inhibit the metastasis of HCC by regulating sirtuin 6 (SIRT6) stabilization and the epidermal growth factor receptor (EGFR)-phosphoinositide 3-kinase (PI3K)-protein kinase B (AKT) signaling pathway, and be positively correlated with better prognosis of patients with HCC.44,45 According to the roles of m6A RNA modification in the progression and prognosis of HCC, m6A regulators may serve as important prognostic biomarkers.22,27,46,47 Therefore, m6A modification orchestrates a complex interplay of RNA stability, signaling pathway activation, and epigenetic reprogramming in HCC.48–50 Its regulators serve as prognostic biomarkers and therapeutic vulnerabilities, meriting further investigation in preclinical and clinical settings.51,52
Herein, ssGSEA was applied to evaluate the enrichment scores of 21 m6A regulators in the TCGA-LIHC cohort, revealing that the scores of m6A regulators in adjacent tissues were significantly higher than those in HCC tissues. Notably, 13 of the m6A regulators exhibited a strong correlation with prognosis of HCC patients. Additionally, we identified four distinct molecular subtypes of HCC through the analysis of the profiles of 13 m6A regulator genes. HCC patients with different molecular subtypes demonstrated significantly different prognostic outcomes and clinicopathological characteristics. Based on the above results, we identified three key genes (TRNP1, KIF20A, and CFHR3) that were closely related to prognosis, and constructed a nomogram with good and stable predictive power for predicting prognosis of patients with HCC. Furthermore, we explored the potential function. We further performed functional enrichment analysis and immune infiltration analysis to explore the functional mechanisms associated with this risk model, and identified eight chemotherapeutic drugs closely related to the RiskScore and three key prognostic genes, providing a reference for the personalized management of HCC.
The present study indicates that CFHR3 is a protective factor in HCC, as supported by previous findings.53,54 CFHR3 is a member of the human factor H protein family and has been associated with several non-cancerous diseases, such as age-related macular degeneration, nephropathy, and atypical hemolytic uremic syndrome.55–57 Dong et al. 58 suggested that CFHR3 was negatively correlated with the aerobic glycolysis phenotype, with increased aerobic glycolysis leading to a poorer prognostic outcome. Cancer cells often preferentially engage in glycolysis over oxidative phosphorylation due to the characteristic tumor microenvironment, like hypoxia. Zeng et al. 59 elucidated the regulatory effect of hypoxia on CFHR3, and found hypoxia reduced the expression of CFHR3, enhancing the proliferation and motility of HCC cells. However, overexpression of CFHR3 can reverse the promotive effect of hypoxia on HCC progression and suppress the growth and metastasis of HCC. Mechanically, the overexpression of CFHR3 downregulates the PI3K-AKT-mTOR signaling pathway to inhibit cell viability and promote cell apoptosis. 55 Additionally, decreased expression of CFHR3 was identified to be linked to the advanced stages and higher tumor grades in patients with HCC. 53 The downregulation of CFHR3 could occur due to miRNA-590-3p binding, which facilitated the phosphorylation of STAT3, resulting in inhibiting p53 expression.60,61 Previous studies showed that prognostic models were established based on mitophagy, fatty acid metabolism, and RTCL1, respectively.60–62 In these models, TRNP1 was a reliable predictor of prognosis in patients with HCC. Wang et al. 63 demonstrated that TRNP1 knockdown can induce apoptosis and senescence in HCC cells, thereby suppressing tumor growth. Kinesin family (KIF) proteins are crucial for intracellular transport, cellular morphogenesis, and cell survival. 64 KIF20A expression levels are elevated in nearly all cancer types. 65 Notably, KIF20A is significantly overexpressed in HCC tissues and drives tumor proliferation, invasion, and immune evasion.66,67 Similarly, this study demonstrated that the expression levels of KIF20A in HCC tissues and cells were higher than those observed in normal liver tissues and cells. Dysregulation of KIF20A can serve as an independent predictor for poor prognosis.68,69 Wu et al. 70 found that inhibiting KIF20A expression suppressed cell proliferation and promoted sensitivity to chemotherapy in HCC cells. Additionally, Chen et al. suggested that decreased KIF20A expression improved the efficacy of immunotherapy in HCC by promoting c-Myc ubiquitination. 71 Targeting KIF20A synergizes with PD-1 inhibitors by restoring c-Myc degradation and amplifying anti-tumor immunity.67,72 Therefore, CFHR3, TRNP1and KIF20A may serve as a novel therapeutic target and prognostic biomarker for HCC, and may promote the personalized management of HCC patients.
Emerging evidence demonstrates that m6A modification profoundly shape the immunosuppressive tumor microenvironment by regulating immune cells.73,74 The demethylase FTO has been shown to drive tumorigenesis while simultaneously suppressing anti-tumor immunity in HCC. 75 Targeting FTO not only inhibits tumor growth but also enhances the activation and recruitment of tumor-infiltrating CD8+ T cells, thereby increasing the sensitivity of both anti-PD-1 and sorafenib treatments. 75 Particularly regarding TAMs, the ALKBH5/MAP3K8 axis has been identified as a critical regulator of PD-L1+ macrophage infiltration in HCC. 76 This pathway promotes tumor progression by sustaining an immunosuppressive microenvironment through PD-L1 expression on tumor-associated macrophages. Additionally, Li and colleagues found that the deletion of transcription factor AP-2α in both hepatocytes and macrophages accelerated HCC progression by altering lipid metabolism pathways and enhancing the pro-inflammatory effects. 77 Concurrently, they demonstrated writer protein WTAP decreased the stability of AP-2α mRNA through a mechanism depending on the reader protein YTHDC1. Therefore, m6A modification can affect the immunosuppression and escape process by regulating the function of immune cells. Future studies can further explore the relationship between m6A modification and immunotherapy response, providing new strategies for personalized treatment.
We observed significant activation of DNA replication and cell cycle pathways in the high-risk group. The activation of these pathways is closely related to m6A modification, which has been demonstrated in previous studies. 78 The m6A reader protein YTHDF2 influences cell cycle progression by identifying m6A modification and facilitating the degradation of mRNAs that negatively regulate the cell cycle. 79 In contrast, IGF2BP3, another m6A reader protein, increases the stability of CCND1 mRNA by recognizing its m6A modification, thereby promoting the transition from the G1 phase to the S phase of the cell cycle. 80 However, comprehensive studies exploring the role of m6A modification in regulating the cell cycle in HCC remain limited and warrant further investigations.
This study has yielded several important results, however, there are certain limitations and shortcomings that should be noted. The primary issue is the ability to generalize model validation. Despite the use of TCGA-LIHC as a training cohort and validation via the ICGC-LIRI-JP dataset, there is a lack of externally validated data from the multicenter independent clinical cohort, which may undermine the general applicability of the predictive model in real healthcare environment. In terms of molecular mechanism, although key regulatory genes such as TRNP1, KIF20A and CFHR3 have been identified by bioinformatics analysis, the specific molecular interactions between these genes and their signal transduction pathways in the development and progression of HCC have not been studied in depth. The drug sensitivity analyses used in the study were based on calculated predictions (e.g., IC50 values), and these results may not fully reflect the in vivo situation. Additionally, the limited range of drugs selected may have missed some drugs that are effective in the treatment of HCC. Overall, this study provides a promising tool for prognostic prediction in HCC, but its limitations suggest that future studies need more external validation, more in-depth mechanistic explorations, and broader evaluation of clinical applications.
Conclusions
In conclusion, this study identified four distinct molecular subtypes in HCC based on regulators of m6A RNA modifications that exhibited different prognostic and clinicopathological characteristics. Through further analyses, a risk model including three key genes (TRNP1, KIF20A, and CFHR3) was constructed, which demonstrated good efficacy in predicting the prognosis and response to chemotherapeutic agents in HCC patients. This risk model may be a promising means of prognostic prediction and be helpful to select appropriate management strategies for HCC patients.
Supplemental Material
sj-docx-1-iji-10.1177_03946320251370847 – Supplemental material for Identification of prognostic biomarkers for hepatocellular carcinoma based on the m6A RNA modification
Supplemental material, sj-docx-1-iji-10.1177_03946320251370847 for Identification of prognostic biomarkers for hepatocellular carcinoma based on the m6A RNA modification by Jiachun Sun, Ziyi Xu, Yitao Fan, Bo Sun, Weizheng Wang, Mengjuan Xuan and Penghui Li in International Journal of Immunopathology and Pharmacology
Supplemental Material
sj-tif-2-iji-10.1177_03946320251370847 – Supplemental material for Identification of prognostic biomarkers for hepatocellular carcinoma based on the m6A RNA modification
Supplemental material, sj-tif-2-iji-10.1177_03946320251370847 for Identification of prognostic biomarkers for hepatocellular carcinoma based on the m6A RNA modification by Jiachun Sun, Ziyi Xu, Yitao Fan, Bo Sun, Weizheng Wang, Mengjuan Xuan and Penghui Li in International Journal of Immunopathology and Pharmacology
Supplemental Material
sj-tif-3-iji-10.1177_03946320251370847 – Supplemental material for Identification of prognostic biomarkers for hepatocellular carcinoma based on the m6A RNA modification
Supplemental material, sj-tif-3-iji-10.1177_03946320251370847 for Identification of prognostic biomarkers for hepatocellular carcinoma based on the m6A RNA modification by Jiachun Sun, Ziyi Xu, Yitao Fan, Bo Sun, Weizheng Wang, Mengjuan Xuan and Penghui Li in International Journal of Immunopathology and Pharmacology
Supplemental Material
sj-xlsx-4-iji-10.1177_03946320251370847 – Supplemental material for Identification of prognostic biomarkers for hepatocellular carcinoma based on the m6A RNA modification
Supplemental material, sj-xlsx-4-iji-10.1177_03946320251370847 for Identification of prognostic biomarkers for hepatocellular carcinoma based on the m6A RNA modification by Jiachun Sun, Ziyi Xu, Yitao Fan, Bo Sun, Weizheng Wang, Mengjuan Xuan and Penghui Li in International Journal of Immunopathology and Pharmacology
Supplemental Material
sj-xlsx-5-iji-10.1177_03946320251370847 – Supplemental material for Identification of prognostic biomarkers for hepatocellular carcinoma based on the m6A RNA modification
Supplemental material, sj-xlsx-5-iji-10.1177_03946320251370847 for Identification of prognostic biomarkers for hepatocellular carcinoma based on the m6A RNA modification by Jiachun Sun, Ziyi Xu, Yitao Fan, Bo Sun, Weizheng Wang, Mengjuan Xuan and Penghui Li in International Journal of Immunopathology and Pharmacology
Supplemental Material
sj-xlsx-6-iji-10.1177_03946320251370847 – Supplemental material for Identification of prognostic biomarkers for hepatocellular carcinoma based on the m6A RNA modification
Supplemental material, sj-xlsx-6-iji-10.1177_03946320251370847 for Identification of prognostic biomarkers for hepatocellular carcinoma based on the m6A RNA modification by Jiachun Sun, Ziyi Xu, Yitao Fan, Bo Sun, Weizheng Wang, Mengjuan Xuan and Penghui Li in International Journal of Immunopathology and Pharmacology
Footnotes
Author contributions
M.J.X. and P.H.L. designed the study. J.C.S. and Z.Y.X. acquired the data and drafted the manuscript. Y.T.F., B.S., and W.Z.W. revised the manuscript. All authors commented on previous versions of the manuscript and read and approved the final manuscript.
Data availability statement
The datasets used and/or analyzed during the current study are available from the corresponding author upon request.
Declaration of conflicting interests
The authors declared no potential conflicts of interest with respect to the research, authorship, and/or publication of this article.
Funding
The authors disclosed receipt of the following financial support for the research, authorship, and/or publication of this article: This study was supported by Henan provincial Medical Science and Technology Research Project (LHGJ20240415).
Ethics approval
Not applicable.
Informed consent
Not applicable.
Supplemental material
Supplemental material for this article is available online.
References
Supplementary Material
Please find the following supplemental material available below.
For Open Access articles published under a Creative Commons License, all supplemental material carries the same license as the article it is associated with.
For non-Open Access articles published, all supplemental material carries a non-exclusive license, and permission requests for re-use of supplemental material or any part of supplemental material shall be sent directly to the copyright owner as specified in the copyright notice associated with the article.