
Abstract
Acetaldehyde dehydrogenases (ALDH) 1B1 is associated with a poor prognosis in pancreatic cancer, colorectal cancer, and osteosarcoma. Overexpression of ALDH also impairs tumor immunity. However, it is unclear how ALDH1B1 is associated with patient prognosis and immune infiltration in different cancer types. This is an original research based on bioinformatics analysis. In this study, we investigated the expression and prognostic value of ALDH1B1 in pan-cancer specimens using several databases, including GEPIA2 and Kaplan–Meier Plotter. The GEPIA2 and TIMER2 databases were used to explore correlations between ALDH1B1 expression and immune infiltration in cancers, especially head and neck squamous cell carcinoma (HNSC) and stomach adenocarcinoma (STAD). Finally, the expression of ALDH1B1 was validated by qPCR and immunohistochemistry. The expression of ALDH1B1 differed in most cancers compared to normal tissue controls. ALDH1B1 has an important impact on the prognosis different cancer types, and the high expression of ALDH1B1 is inversely associated with survival in patients with HNSC. A significant positive correlation was identified between ALDH1B1 expression in HNSC and immune infiltration. The poor prognosis associated with high expression of ALDH1B1 may be related to the promotion of M2 polarization of tumor-associated macrophages. Furthermore, markers of immune cell infiltration, such as exhausted T cells and regulatory T cells showed different patterns of ALDH1B1-associated immune infiltration. ALDH1B1 can serve as a prognostic biomarker in pan-cancer types and is correlated with immune infiltration.
Introduction
Acetaldehyde dehydrogenases (ALDHs) are a family of NAD(P)+-dependent enzymes that oxidize endogenous and exogenous aldehydes to the corresponding carboxylic acids. To date, 19 human ALDH isozymes have been classified into 11 families and four subfamilies. 1 ALDHs are important cytoprotective enzymes; however, they are also associated with stem cell differentiation, cell proliferation, tumor formation, and tumor prognosis.2-5 Acetaldehyde dehydrogenase 1b1 (ALDH1B1), a member of the ALDH superfamily, is a mitochondrial enzyme. Recent studies have shown that ALDH1B1 is a new immunohistological marker for colorectal cancer, promoting changes in morphology, proliferation, migration, and increased resistance to chemotherapy of human colon adenocarcinoma (COAD).6,7 The proliferation of colorectal cancer can be inhibited with small molecule inhibitors of ALDH1B1. 8 ALDH1B1 is also overexpressed in some human pancreatic cancer cells and is associated with tumor initiating cells in pancreatic ductal adenocarcinoma.9,10 Although ALDH1B1 has been studied more extensively in colorectal and pancreatic cancers, the role of ALDH1B1 in pan-cancer is poorly studied. Furthermore, the effects of ALDH1B1 may vary in different cancers. For example, in some types of cancer, ALDH1B1 is associated with tumor progression and a poor prognosis; however, it can also serve as a marker of a good tumor prognosis and may even have different prognostic significance in various stages of the same tumor.7,11,12 Therefore, it is uncertain whether ALDH1B1 has a positive or negative impact on prognosis. An increasing number of studies have focused on analyzing the function of ALDH1B1 in disease. However, it is still unclear whether ALDH1B1 participates in the development of certain tumors and its prognostic impact on tumors. Therefore, we conducted a pan-cancer analysis of ALDH1B1.
The tumor microenvironment (TME) contains a variety of cells. Of these, infiltrating immune cells constitute a high proportion. 13 In contrast to the conventional concept that immune cells are an integral part of the antitumor strategy, the infiltration of immune cells into tumor tissues reflects a strategy adopted by tumor cells to avoid being killed.14-16 In addition to macrophages, almost all types of immune cells, including B cells, CD8+ T cells, CD4+ T cells, neutrophils, natural killer cells (NK), and dendritic cells (DC), are found in the TME, and some are associated with cancer progression. 14 In recent years, immunotherapies targeting the interactions between tumor and immune cells have been explored as an alternative to conventional anticancer therapies to reactivate adaptive and innate immune systems, thereby building a robust antitumor immune response. However, only a few patients with specific cancer types have responded well to current immunotherapies.15,17 Therefore, it is necessary to explore other potential targets.
ALDH1B1 is a mitochondrial enzyme. Metabolites of ALDH can affect the TME and induce immune cell differentiation, leading to tumor immunity. For example, the ALDH family converts retinoids to retinoic acid, which promotes the induction, function, and stability of regulatory T cells, thus compromising tumor immunity and contributing to the progression of various cancers. 18 In addition, retinoic acid polarizes intratumoral monocyte differentiation towards immunosuppressive tumor-associated macrophages (TAMs) and away from immunostimulatory DCs by suppressing DC-promoting transcription factor Irf4. 19
In this work, we explored the prognostic profile of ALDH1B1 in pan-cancer using online databases, including GEPIA2 and Kaplan–Meier Plotter. Next, we analyzed the potential relationship between ALDH1B1 expression and the level of immune infiltration using the TIMER2 and GEPIA2 databases. The results showed that ALDH1B1 may influence the prognosis of cancer patients through interaction with infiltrating immune cells.
Materials and methods
Gene expression analysis
We used Tumor immune estimation resource, version 2 (TIMER2) (http://timer.cistrome.org/) to analyze ALDH1B1 expression in tumor tissues and in adjacent normal tissues. 20 We used Gene expression profiling interactive analysis, version 2 (GEPIA2) (http://gepia2.cancer-pku.cn/#analysis) to compare the expression of ALDH1B1 in tumor and normal tissues, under the settings of log2 fold change (FC) cutoff = 1, p-value cutoff = 0.01, and “Match The Cancer Genome Atlas (TCGA) normal and GTEx (Genotype-Tissue Expression) data.” 21 The GEPIA2 tool was been used to analyze the expression of ALDH1B1 in all TCGA cancers at different pathological stages. The transformed expression data log2 (Transcripts per million [TPM] +1) were used for the box or violin plots.
Survival analysis
The Kaplan–Meier plotter (https://kmplot.com/analysis/) is capable of assessing the correlation between the expression of all genes (mRNA, miRNA, protein) and survival in more than 30,000 samples from 21 tumor types. We used a Kaplan–Meier plotter to analyze the relationship of ALDH1B1 expression with relapse-free survival (RFS) and overall survival (OS) in bladder carcinoma (BLCA), cervical squamous cell carcinoma (CESC), esophageal adenocarcinoma (ESCA), head-neck squamous cell carcinoma (HNSC), kidney renal clear cell carcinoma (KIRC), liver hepatocellular carcinoma (LIHC), lung adenocarcinoma (LUAD), sarcoma (SARC), stomach adenocarcinoma (STAD), thyroid carcinoma (THCA), and uterine corpus endometrial carcinoma (UCEC). The logrank p-values and hazard ratios (HRs) with 95% confidence intervals (CI) were calculated. 22 GEPIA2 was used to obtain the data from the disease-free survival (DFS) and OS significance map and survival plots of ALDH1B1 across all TCGA tumors. We used the cutoff-low (50%) and cutoff-high (50%) values to denote the expression thresholds to classify the high and low expression clusters. 21 Hypothesis testing was performed using the logrank test.
Immune infiltration analysis
TIMER is a Web server for comprehensive analysis of tumor-infiltrating immune cells. We used TIMER2 tool to analyze the relationship between ALDH1B1 expression and immune infiltration in all TCGA tumors. 20 We analyzed the relationship between ALDH1B1 expression and six types of immune cell infiltration in 39 tumors, including B cells, CD8+ T cells, CD4+ T cells, macrophages, DCs, and neutrophils. We also explored the correlation between the expression level of ALDH1B1 and tumor purity. We also explored the relationship between several immune cell-specific markers and ALDH1B1 expression to identify potential immune infiltrating cell subtypes. We selected the cell-specific markers from the R&D systems website (https://www.rndsystems.com/cn/resources/cell-markers/immune-cells). These cell-specific markers included markers of B cells, T-helper 1 (Th1) cells, T-helper 2 (Th2) cells, T-helper 9 (Th9) cells, T-helper 17 (Th17) cells, T-helper 22 (Th22) cells, follicular helper T cells (Tfh), CD8+ T cells, exhausted T cells, Tregs, monocytes, M1 macrophages, TAMs, M2 macrophages, NK cells, DCs, and neutrophils. Marker genes were plotted on the y-axis, and ALDH1B1 was plotted on the x-axis. We used scatter plots to analyze association between each immune gene marker and ALDH1B1expression. In the same way, in GEPIA2, gene expression analysis was conducted on the provided TCGA expression dataset. We used the Spearman’s method to determine the correlation coefficients. 21
Mutation analysis
We used cBioPortal (http://www.cbioportal.org/) tool to analyze ALDH1B1 mutations in pan-cancer specimens.
Clinical specimen collection and ethics approval
Gastric cancer samples and normal tissues were acquired from the Seventh Affiliated Hospital of Sun Yat-sen University and the First Affiliated Hospital of Sun Yat-sen University. Ethical approval for this study was obtained from the Sun Yat-sen University Health Science Institution Review Board (No. KY-2022-051-02). Samples were collected for real-time PCR and immunohistochemistry (IHC). All patients provided their informed consent in writing preoperatively.
Real-time PCR analysis
Total RNA was extracted from gastric cancer and adjacent normal tissues using AG RNAex Pro RNA reagent (Accurate Biology, CAT#AG21102) according to the manufacturer’s instructions. cDNA was synthesized using the Evo M-MLV reverse transcription Master Mix (Accurate Biology, CAT# AG11706). RT-qPCR was performed with a SYBR Green Pro Tag HS premixed qPCR kit (Accurate Biology, CAT# AG11701). The relative expression of total RNA was calculated using the 2−ΔΔCt method. The primer sequences for all the RNAs used for qPCR are recorded in Supplementary Table 1.
Immunohistochemistry
IHC was used to detect ALDH1B1 expression. Paraffin-embedded tissue sections were deparaffinized and rehydrated in serial xylene and graded ethanol solutions. Sections were boiled in citrate buffer solution (pH 6.0) for 10 min for antigen recovery. Endogenous peroxidase activity was quenched by incubating slides with 3% hydrogen peroxide for 10 min. After blocking with 5% goat serum for 30 min at room temperature, sections were incubated with primary antibody at 4°C overnight. The primary antibody used in this study was anti-RECK rabbit polyclonal antibody (ER64778) (Huabio, 1:100). The next day, the sections were washed with phosphate buffer solution (PBS) and incubated with the corresponding secondary antibody (goat anti-rabbit IgG H&L [HRP], ab205718, Abcam, 1:1000) for 1 h at room temperature. The sections were then rinsed with PBS and developed with a 3,3′-diaminobenzidine (DAB) solution for 4 min. Finally, the sections were dehydrated, washed, and mounted on coverslips. Brown or yellowish-brown staining in the cytoplasm of the cells was considered positive staining. Negative control sections were incubated with normal rabbit serum instead of primary antibody. Sections were observed using a microscope and images were taken.
Statistical analysis
We used the Kaplan–Meier plotter tool to evaluate survival curves. To compare survival curves, we used the logrank test to calculate the HR and logrank p-value in Kaplan–Meier Plotter and GEPIA2 tools. We used Spearman’s correlation to evaluate the correlation of gene expression. The t test or comparative t test was conducted to compare the differences among distinct groups. p < .05 was considered statistically significant.
Results
mRNA expression of ALDH1B1 in pan-cancer
TIMER2 was used to assess the differential expression of ALDH1B1 between tumor and adjacent normal tissues in the TCGA database. As illustrated in Figure 1, ALDH1B1 expression was significantly higher in breast invasive carcinoma (BRCA), COAD, LUAD, lung squamous cell carcinoma (LUSC) (p<.001), head and neck squamous cell carcinoma (HNSC), (head and neck squamous carcinoma-HPV positive (HNSC-HPV positive), rectum adenocarcinoma (READ), STAD (p < .01), glioblastoma multiforme (GBM) (p < .05) than in normal tissue. Conversely, ALDH1B1 showed lower expression in bladder urothelial carcinoma (BLCA), kidney chromophobe (KICH), KIRC, kidney renal papillary cell carcinoma (KIRP), LIHC, prostate adenocarcinoma (PRAD), THCA, UCEC (p < .001), cholangiocarcinoma (CHOL), pheochromocytoma and paraganglioma (PCPG) (p < .01), andCESC (p < .05) than in adjacent normal tissues. Particularly, only a minority of tumor types did not show differential expression, such as esophageal carcinoma (ESCA) and pancreatic adenocarcinoma (PAAD). ALDH1B1 expression in TCGA tumors versus adjacent normal tissues (if available) by TIMER2. *p < .05; **p < .01; ***p < .001.
As there were no corresponding normal tissue data for some tumors in TCGA, we further assessed differences in ALDH1B1 expression between tumors and normal tissues using the GTEx dataset. Using the setting of log2FC cutoff = 1, we found that diffuse large B-cell lymphoid neoplasm lymphoid neoplasm lymphoma (DLBC), ESCA, GBM, lower grade brain brain glioma (LGG), PAAD, skin cutaneous melanoma (SKCM), STAD, and thymoma (THYM) showed a higher expression in tumor tissues (p < .01) (Figure 2). However, under the settings of log2FC cutoff = 0.5, we found that BRCA, COAD, LUAD, LUSC, READ, ovarian serous cystadenocarcinoma (OV), and HNSC showed higher expression in tumor tissues (p < .01) (Supplementary Figure 1). Overall, we found that the expression of ALDH1B1 increased in most human tumors. Box plot showing the comparison of ALDH1B1 expression in DLBC, ESCA, GBM, LGG, PAAD, SKCM, STAD, and THYM (TCGA project) relative to the corresponding normal tissues (GTEx database). *p < .01.
We also analyzed the relationship between ALDH1B1 expression and tumor pathological staging using the GEPIA2 tool. We found only a few tumors with stage-specific expressional changes in ALDH1B1 expression, such as adrenocortical carcinoma (ACC), BLCA, KIRC, KIRP, LIHC, and THCA (Figure 3). In most cases, we did not find any obvious association (Supplementary Figure 2). Stage-dependent expression level of ALDH1B1. The main pathological stages (stage I, stage II, stage III, and stage IV) of ACC (a), BLCA (b), KIRC (c), KIRP (d), LIHC (e), and THCA (f) were evaluated and compared using TCGA data.
Prognostic value of ALDH1B1 in cancers
The Kaplan–Meier plotter was used to explore the relationships between ALDH1B1 expression and the prognosis of each cancer. ALDH1B1 expression was significantly associated with a total of 11 cancer types (Figure 4 Survival curves comparing high and low expression of ALDH1B1 in different types of cancer in the Kaplan–Meier Plotter. OS and RFS of BLCA (a and b), CESC (c and d), ESCA (e and f), HNSC (g and h), KIRC (i and j), LIHC (k and l), LUAD (m and n), SARC (o and p), STAD (q and r), THCA (s and t), and UCEC (u and v). The red curve represents patients with high expression of ALDH1B1.
As there were no corresponding normal tissue data for some of the tumors in the Kaplan–Meier Plotter database, next, we use GEPIA2 to construct a survival map to analyze the role of ALDH1B1 in each type of cancer (number of cancer types = 33). In particular, high expression of ALDH1B1 is associated with a negative prognosis of OS in four cancers, including ACC (p = .0082), HNSC (0.0034), MESO (0.011), and THYM (0.017). In contrast, high expression of ALDH1B1 is associated with positive OS in KIRC (p = .00021) (Figure 5(a)). The DFS analysis showed that high expression of ALDH1B1 was associated with a negative prognosis for patients with ACC (p = .0098) and CESC (p = .018). Conversely, high expression of ALDH1B1 correlated with excellent prognosis for KIRC (p = .000038) and STAD (p = .011) (Figure 5(b)). The relationship between ALDH1B1 expression and overall patient survival (a), and disease-free survival (b) was evaluated in all TCGA tumors using GEPIA2. Significant survival curves are presented.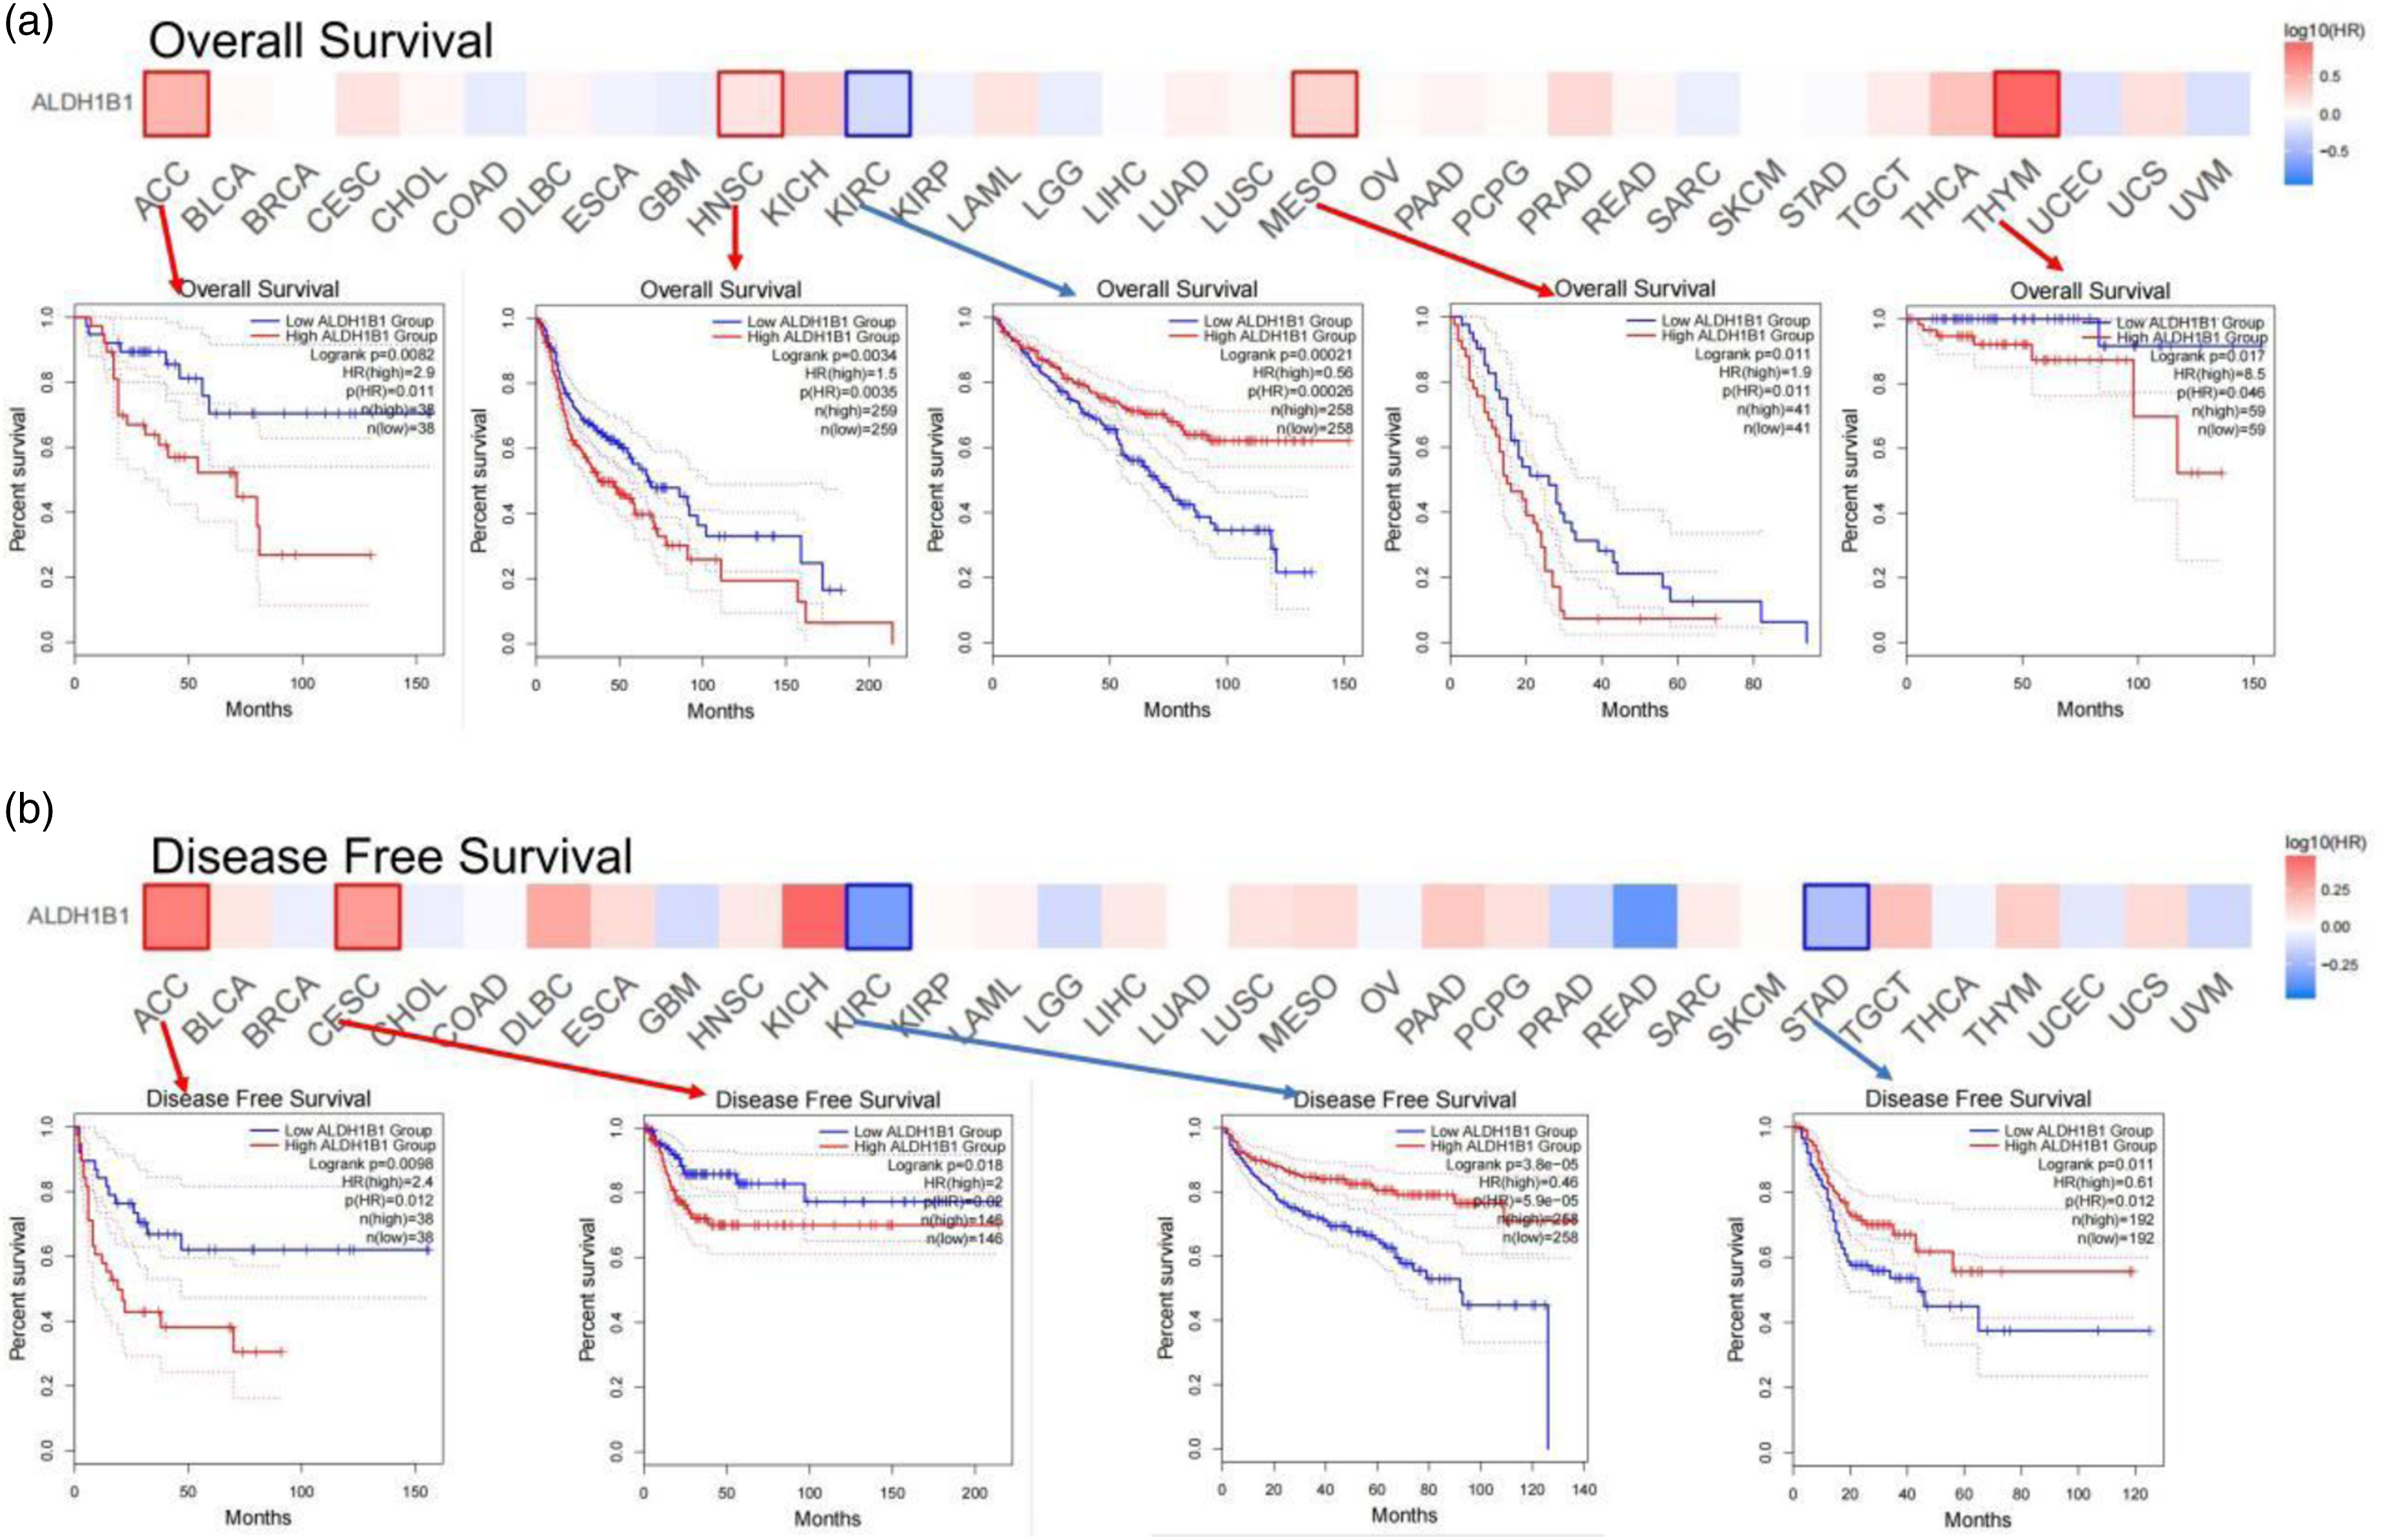
Immune infiltration analysis data
In the TME, immune cells can influence patient survival, and the prognostic role of ALDH1B1 in pan-cancer is supported by the above findings. Therefore, it is of interest to explore the relationship between immune infiltration and ALDH1B1 expression. We analyzed the relationship between ALDH1B1 expression and six types of immune cell infiltration in 39 tumors, including B cells, CD8+ T cells, CD4+ T cells, neutrophils, macrophages, and DCs. The results showed a significant correlation between ALDH1B1 expression and tumor purity in 12 types of cancer. Furthermore, ALDH1B1 expression was also significantly correlated with infiltration levels of B cells, CD8+ T cells, CD4+ T cells, macrophages, neutrophils, and DCs in 16, 19, 17, 23, 19, and 17 types of cancers, respectively (Supplementary Figure 4).
In the previous study, we found opposite results for HNSC and STAD in terms of relevance of ALDH1B1 expression (Figure 5). We also found that ALDH1B1 expression was associated with immune infiltration in HNSC and STAD (Figure 4(m), AG). Therefore, we further analyzed the association between immune infiltration and the prognosis of HNSC and STAD.
Correlation between ALDH1B1 expression and immune markers
Correlations between ALDH1B1 and immune cell markers in TIMER2.

Purity, correlation adjusted for tumor purity; None, correlation without adjustment; Cor, R value of Spearman’s correlation. *p < .01; **p < .001; ***p < .0001.
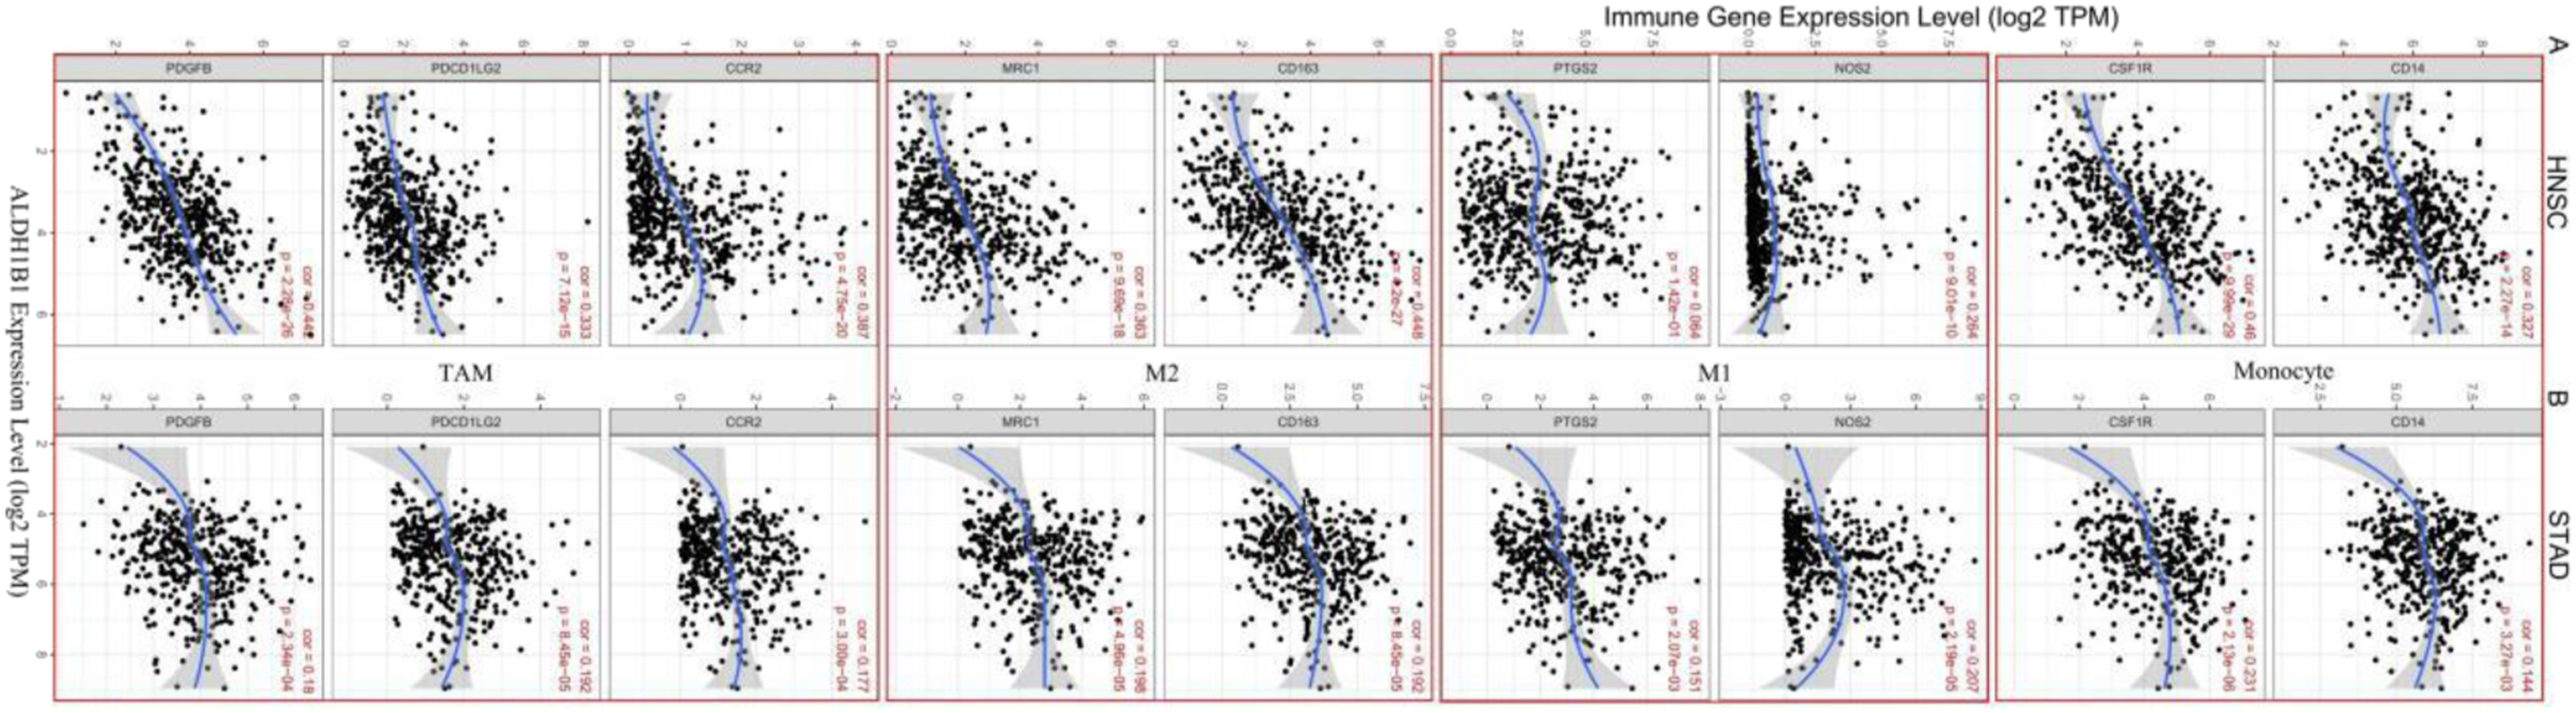
The expression of ALDH1B1 is associated with macrophage polarization and B cell infiltration in HNSC and STAD. Markers include NOS2 and PTGS2 from M1 macrophages, CD163 and MRC1 from M2 macrophages, PDGFB, PDCD1LG2, and CCR2 from TAM, and CD14 and CSF1R from monocytes. p < .05 was considered statistically significant.
Correlations between ALDH1B1 and genes markers of macrophages and monocytes in GEPIA2.

Tumor, correlation analysis in tumor tissue of TCGA; Normal, correlation analysis in normal tissue of TCGA. *p < .01; **p < .001; ***p < .0001.
Meanwhile, the expression of ALDH1B1 in HNSC and STAD was also differentially associated with the infiltration of Th1, Th2, Th9, CD8+ T cells, Treg, and NK cells. The association of ALDH1B1 with Th17, Th22, and DC cells was partially different in HNSC and STAD. Furthermore, ALDH1B1 in HNSC also correlated significantly with exhausted T cell markers such as CTLA4 and PD-1, whereas ALDH1B1 in STAD did not have such an association (Table 1). Thus, these results support our hypothesis that ALDH1B1 expression in HNSC and STAD correlates with immune cell infiltration in a different manner, which helps to explain the differences in patient survival.
Mutation and expression of ALDH1B1
ALDH1B1 was altered in 20 tumors and was not mutated in 10 tumors; the high frequency of ALDH1B1 mutation in HNSC ranked only after that of melanoma, with deletion and amplification being the main types of mutation (approximately 3.5%) (Figure 7(a)). Real-time PCR was used to assess the expression of ALDH1B1 in gastric cancer samples and adjacent normal tissues. The level of ALDH1B1 expression was higher in the tumor group compared to the normal group (p < .05) (Figure 7(b)). IHC staining of clinical gastric cancer samples and adjacent normal tissues further confirmed that the expression of ALDH1B1 was lower in the normal group compared to the tumor group (Figure 7(c)). Mutational status and expression of ALDH1B1. (a) The distribution of ALDH1B1 genomic alterations in the pan-cancer analysis is illustrated using cBioPortal. (b) qPCR validation of ALDH1B1 expression in tumor and normal tissue samples. (c) Immunohistochemical analysis showing that the expression of ALDH1B1 was higher in gastric cancer than in normal tissues (magnification, 200×).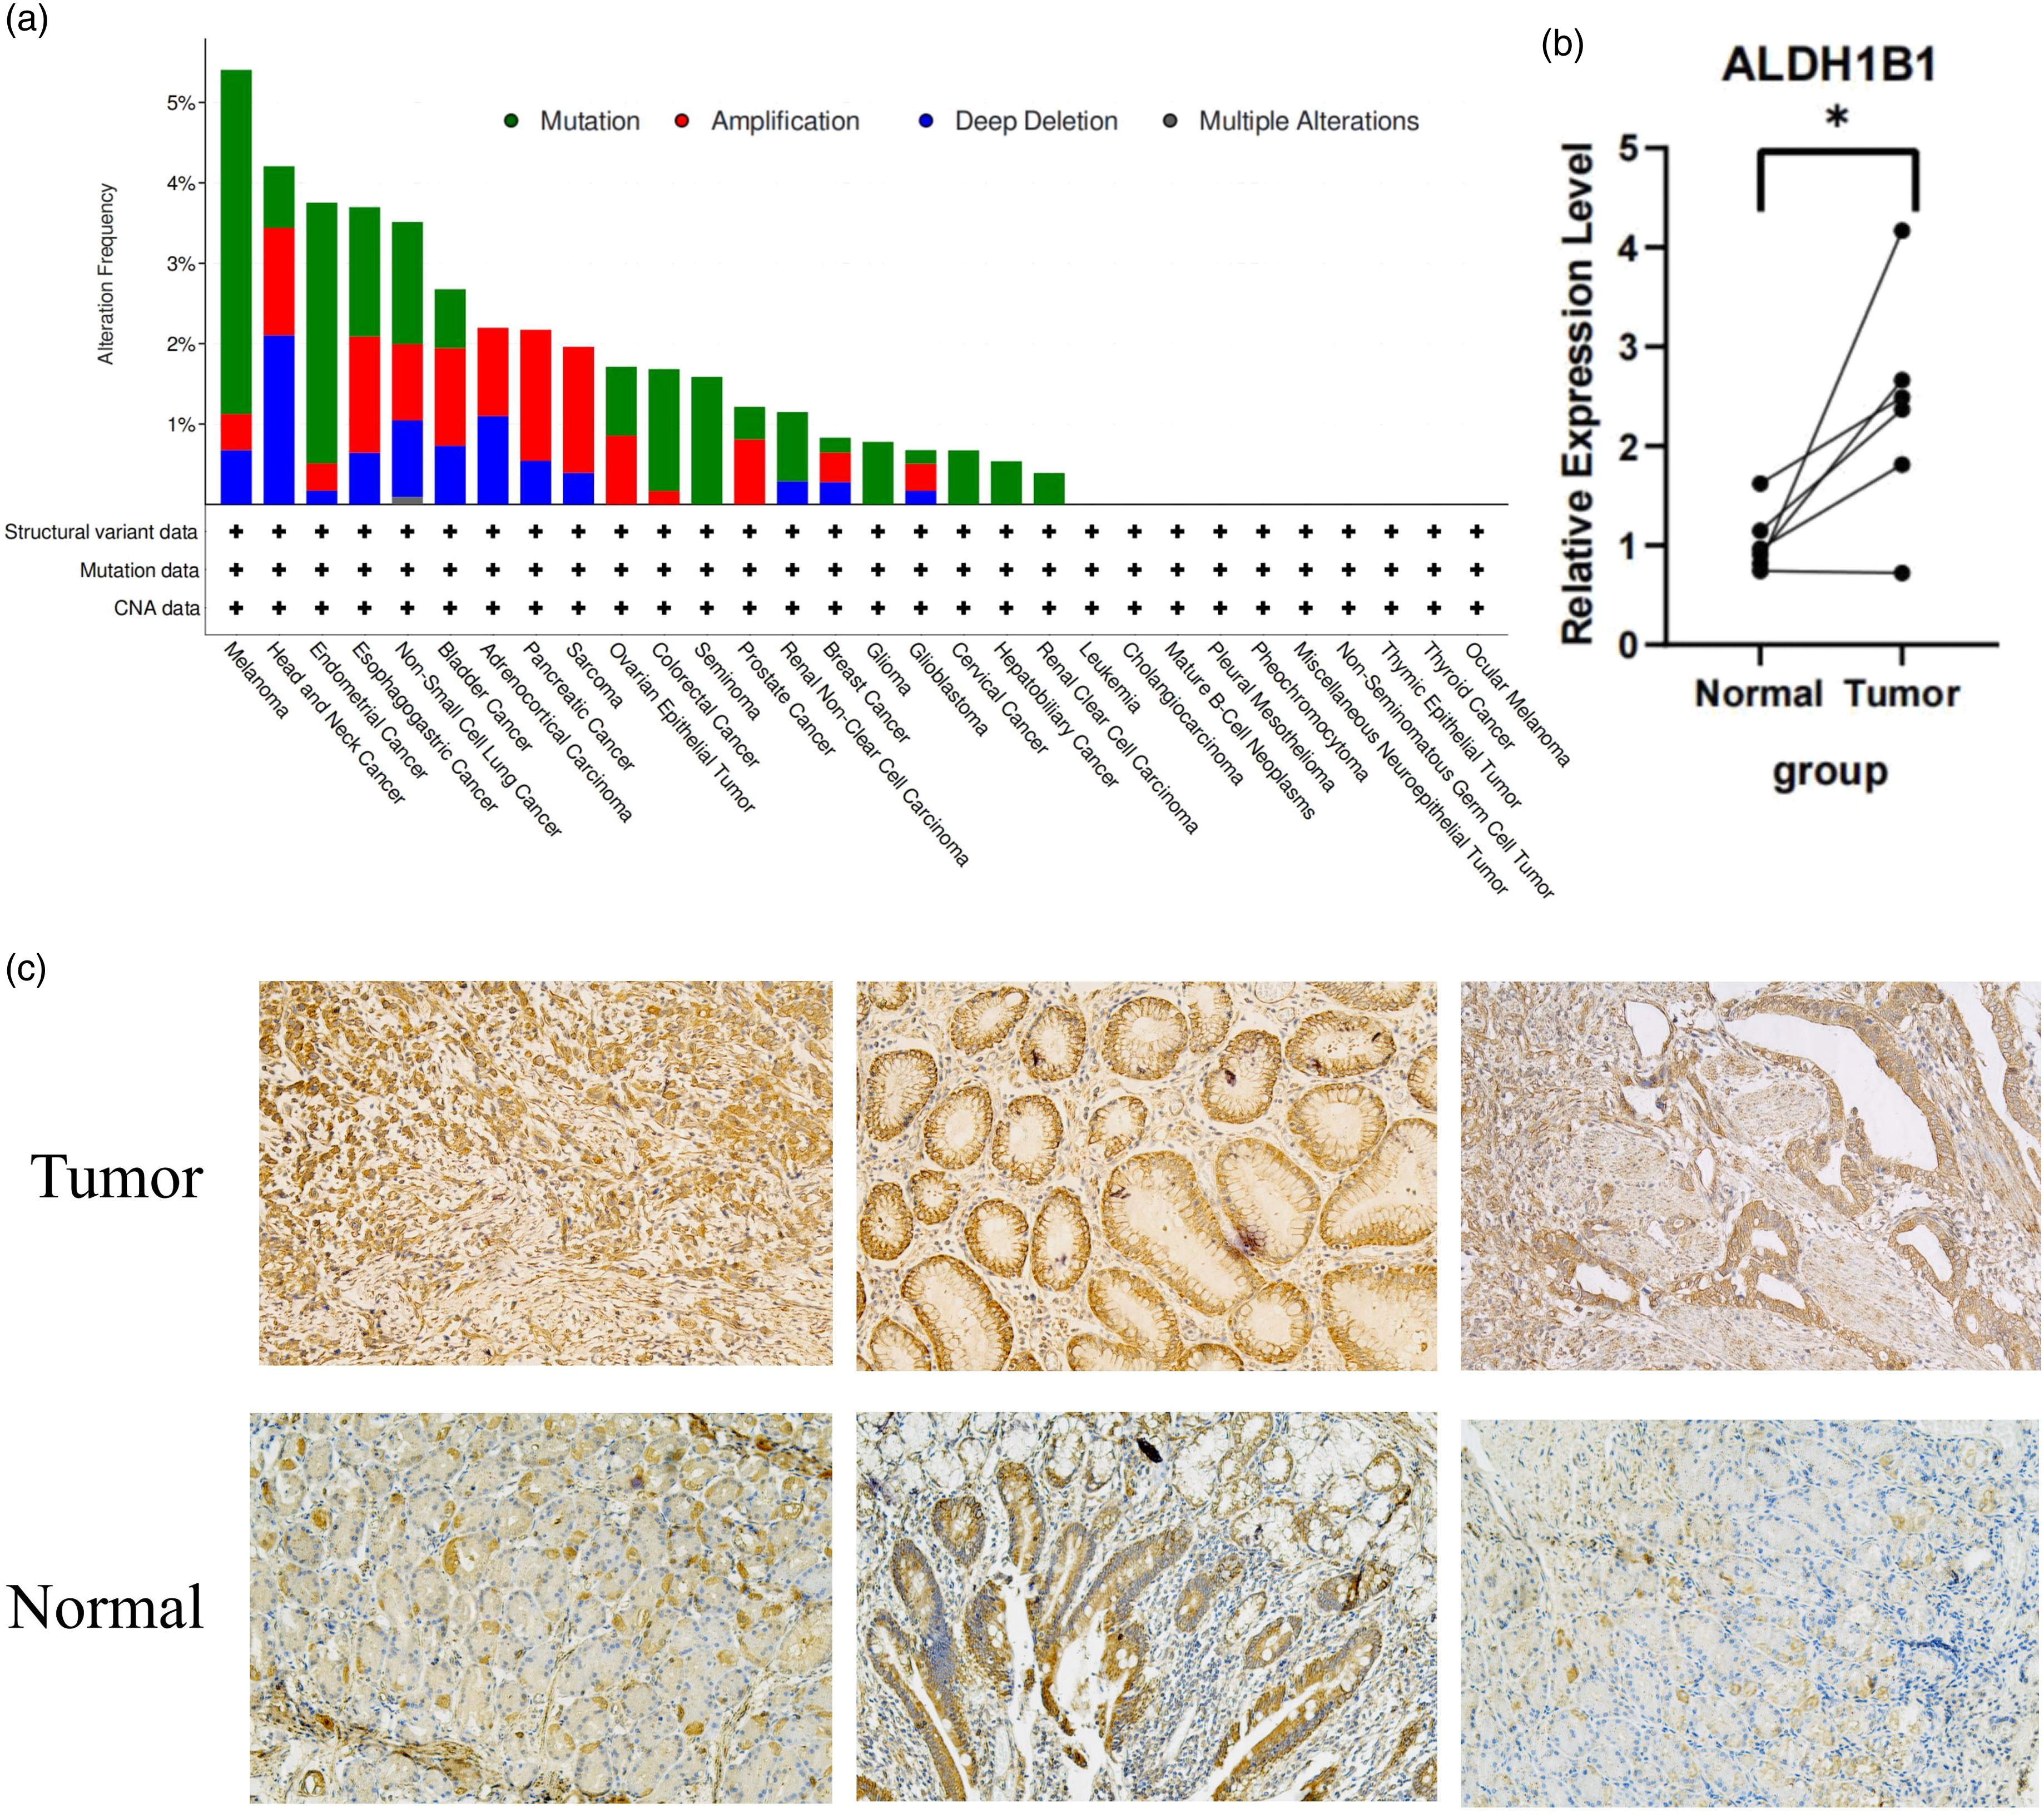
Discussion
ALDH1B1 does not have a clear physiological or pathophysiological role; however, recent studies have characterized the function of the enzyme. Specifically, ALDH1B1 is involved in beta cell development (in mice), 23 maintenance of sperm viability (in horses), 24 and metabolism of ethanol and retinoid (in humans). 25 Further studies have shown that ALDH1B1 is associated with diabetes, 26 pancreatic cancer,9,10 and osteosarcoma. 27 Additionally, ALDH1B1 is a new immunohistological marker in colorectal cancer, which promotes altered morphology, proliferation, blockage of the G2/M phase, epithelial-mesenchymal transition, migration, and increased resistance to chemotherapy in human COAD cells.6,7 ALDH1B1 is also associated with the modification of different tumor stem cell-related signaling pathways, such as PI3K/Akt, Notch, and Wnt/β catenin. 28
In this study, the expression of ALDH1B1 was explored using TCGA data in TIMER2 and TCGA and GTEX data in GEPIA2, and was evaluated to predict the its prognostic role in pan-cancer. In TIMER2, the expression of ALDH1B1 was higher in BRCA, COAD, LUAD, LUSC, HNSC, HNSC-HPV positive, READ, STAD, GBM tumors than in adjacent normal tissues. In BLCA, KICH, KIRC, KIRP, LIHC, PRAD, THCA, UCEC, CHOL, PCPG, and CESC, the expression of ALDH1B1 was lower than in adjacent normal tissues. However, analysis of TCGA and GTEX data in GEPIA2 showed that ALDH1B1 expression was higher in DLBC, ESCA, GBM, LGG, PAAD, SKCM, STAD, THYM, BRCA, COAD, LUAD, LUSC, READ, OV, and HNSC than in normal tissues. These variable expression levels of ALDH1B1 in tumors in various datasets are the result of different data-gathering methods and the underlying diverse biological mechanisms involved. However, we discovered that the expression of ALDH1B1 in HNSC and STAD had the opposite predictive value in the databases. The patient’s prognosis showed that high levels of ALDH1B1 expression in HNSC were associated with poor prognosis. In contrast, increased expression of ALDH1B1 was associated with good prognosis in STAD. In the Kaplan–Meier Plotter survival analysis, high levels of ALDH1B1 expression could serve as an independent risk factor for poor prognosis in CESC, HNSC, LUAD, THCA, and UCEC. These results suggested that ALDH1B1 is a potential biomarker to predict the prognosis of tumor patients.
Epigenetic signatures can predict patient prognosis and can provide new research directions and prospects for individualized treatment of patients.29,30 ALDH1B1, as an important enzyme for ethanol degradation in vivo, slows ethanol metabolism and leads to accumulation of ethanol when ALDH1B1 has a low expression level. The accumulation of ethanol will inhibit the activities of methionine synthase (MS/MTR) and methionine S-adenosyltransferase (MAT), 31 disrupt the production of S-adenosylmethionine (SAM), and lower SAM levels, leading to an imbalance of methylation donors to the epigenetic sequences. Long-term accumulation of ethanol can also directly inhibit DNA methyltransferases (DNMTs) and histone methyltransferases (HMTs), leading to hypomethylation of DNA and histones, resulting in dysregulated open chromatin and imbalanced gene regulation and expression. Alcohol consumption not only leads to cell damage and chronic inflammation, but also serves as a breeding ground for cancer cells, which can deplete the storage of methylation donors from one-carbon metabolism, leading to overall hypomethylation and enhanced dysregulation of gene transcription. 32 Nonetheless, similar to our study, ALDH1B1 is not only considered a “good” gene, but a risk factor for HNSCC. Similarly, the study by Leung et al. 33 also found that high expression of this gene leads to a poor OS in patients, which is related to epigenetic methylation reprogramming.
In our analysis, we found some notable findings. In particular, in HNSC, high expression of ALDH1B1 was correlated with poor OS prognosis in HNSC (p = .0034). The role of ALDH1B1 in HNSC has received little attention. Our findings may provide a new clinical biomarker to predict the OS of patients with HNSC.
Overexpression of ALDH also leads to tumor immunosuppression. 34 ALDH metabolites can affect the TME and induce immune cell differentiation, resulting in tumor immunity. 18 Another significant finding of our study was that ALDH1B1 expression was correlated with different levels of immune infiltration in cancer, particularly in HNSC and STAD. Our study found that ALDH1B1 expression was significantly associated with infiltration of CD4+ T cells and macrophages in STAD tumors; ALDH1B1 expression was strongly associated with infiltration of B cells, CD8+ T cells, CD4+ T cells, macrophages, neutrophils, and DCs in HNSC. A more detailed analysis revealed that in HNSC, the expression of ALDH1B1 was correlated with the labelling of almost all immune cells. In contrast, in STAD, ALDH1B1 expression was related to markers for Th17, Tfh, monocytes, M1/M2 macrophages, TAMs, and neutrophils. These results indicate that ALDH1B1 plays a significant role in the recruitment and regulation of immune cells, which can also contribute to the differential prognoses of HNSC versus STAD.
Selected genes and drugs that regulate the tumor immune microenvironment.

ALDH has a potentially important role in the induction and function of Treg cells, which are critical in the immune system and are involved in promoting immune tolerance and preventing aberrant immune responses to beneficial or harmless antigens. However, a massive presence of Treg cells in tumor tissue is often associated with pro-tumor effects, disease progression, and subsequent poor prognosis. 19 An elevated ratio of tumor-infiltrating FOXP3+ Treg cells to CD8+ T cells is associated with a poor prognosis. 42 In our study, in HNSC, the expression of ALDH1B1 was positively correlated with Treg cells and significantly correlated with FOXP3+ Treg cells (p < .0001). In STAD, the expression showed less correlation and was not correlated with FOXP3+ Treg cells (p > .05). T-cell exhaustion is also a marker of poorer tumor prognosis. 43 The use of PD-1 and CTLA4 inhibitors achieves better antitumor effects.17,44 We found that ALDH1B1 expression was positively correlated with T-cell exhaustion gene markers in HNSC (p < .0001); however, in STAD, ALDH1B1 expression was not associated with T-cell exhaustion (p > .05). Therefore, it is reasonable to speculate that immune infiltration may interact with ALDH1B1-mediated activity in tumors and immune cells.
There are limitations to this study that should be considered. First, we only validated predictions on a small scale. Further studies should be validated with larger sample sizes using diverse methodologies. Second, the database we interrogated did not provide information on post-translational modifications of ALDH1B1. As mentioned above, both phosphorylation and ubiquitination can interfere with the molecular function of ALDH1B1. Third, although we found that ALDH1B1 expression was correlated with immune cell infiltration and survival in cancer patients, we were unable to demonstrate that ALDH1B1 influenced patient survival through immune infiltration. Future prospective studies focusing on ALDH1B1 expression and immune infiltration in cancer populations will help provide reach more definitive conclusions.
Conclusion
In summary, we applied an integrated bioinformatics approach to show that ALDH1B1 can mediate immune infiltration and influence patient prognosis using a pan-cancer analysis. Our findings suggest that ALDH1B1 can potentially serve as a predictive biomarker for prognosis and that these findings may provide an immune-based antitumor strategy for cancer patients. We believe that immunotherapy that combines ALDH1B1 blockers and existing checkpoint inhibitors may represent an attractive antitumor treatment.
Supplemental Material
Supplemental Material - Prognostic and immunological role of acetaldehyde dehydrogenase 1B1 in human tumors: A pan-cancer analysis
Supplemental Material for Prognostic and immunological role of acetaldehyde dehydrogenase 1B1 in human tumors: A pan-cancer analysis by Celeste Glasgow and Emma Ballard in International Journal of Immunopathology and Pharmacology
Footnotes
Acknowledgements
We thank Tengyu Chen, Zhichao Liu, and Hui Ren for their help in experimental verification. We thank the public databases, including GEPIA, Timer, cBioPortal, and Kaplan–Meier plotter, for providing open access.
Author contributions
YK designed this study. YK and QJ extracted the information from the databases and analyzed the data. CZ, YH, and QW supervised the entire study. JF, YJ, and YK wrote the manuscript. TC, ZL, and HR completed the experimental validation. All authors contributed to the article and approved the submitted version.
Declaration of conflicting interests
The author(s) declared no potential conflicts of interest with respect to the research, authorship, and/or publication of this article.
Funding
The author(s) disclosed receipt of the following financial support for the research, authorship, and/or publication of this article: This work was supported by the grants from the Guangdong Provincial Key Laboratory of Digestive Cancer Research (No. 2021B1212040006), Sanming Project of Medicine in Shenzhen (No. SZSM201911010), Shenzhen Key Medical Discipline Construction Fund (No. SZXK016), Guangdong–Hong Kong–Macau University Joint Laboratory of Digestive Cancer Research (No. 2021LSYS003), and Open Fund of Guangdong Provincial Key Laboratory of Digestive Cancer Research (No. 2021B1212040006).
References
Supplementary Material
Please find the following supplemental material available below.
For Open Access articles published under a Creative Commons License, all supplemental material carries the same license as the article it is associated with.
For non-Open Access articles published, all supplemental material carries a non-exclusive license, and permission requests for re-use of supplemental material or any part of supplemental material shall be sent directly to the copyright owner as specified in the copyright notice associated with the article.