
Abstract
Objectives: We hope to identify key molecules that can be used as markers of asthma severity and investigate their correlation with immune cell infiltration in severe asthma. Methods: An asthma dataset was downloaded from the Gene Expression Omnibus database and then processed by R software to obtain differentially expressed genes (DEGs). First, multiple enrichment platforms were applied to analyze crucial biological processes and pathways and protein–protein interaction networks related to the DEGs. We next combined least absolute shrinkage and selection operator logistic regression and the support vector machine-recursive feature elimination algorithms to screen diagnostic markers of severe asthma. Then, a local cohort consisting of 40 asthmatic subjects (24 with moderate asthma and 16 with severe asthma) was used for biomarker validation. Finally, infiltration of immune cells in asthma bronchoalveolar lavage fluid and their correlation with the screened markers was evaluated by CIBERSORT. Results: A total of 97 DEGs were identified in this study. Most of these genes are enriched in T cell activation and immune response in the asthma biological process. CC-chemokine receptor 7 (CCR7) and natural killer cell protein 7(NKG7) were identified as markers of severe asthma. The highest area under the ROC curve (AUC) was from a new indicator combining CCR7 and NKG7 (AUC = 0.851, adj. p < 0.05). Resting and activated memory CD4 T cells, activated NK cells, and CD8 T cells were found to be significantly higher in the severe asthma group (adj. p < 0.01). CCR7 and NKG7 were significantly correlated with these infiltrated cells that showed differences between the two groups. In addition, CCR7 was found to be significantly positively correlated with eosinophils (r = 0.38, adj. p < 0.05) infiltrated in bronchoalveolar lavage fluid. Conclusion: CCR7 and NKG7 might be used as potential markers for asthma severity, and their expression may be associated with differences in immune cell infiltration in the moderate and severe asthma groups.
Introduction
Asthma is a common chronic disease of the airways and is characterized by respiratory symptoms of cough, wheezing, shortness of breath, and chest tightness. 1 The main feature of asthma is the narrowing of airways often caused by immune cell infiltration and activation (eosinophils, neutrophils, and lymphocytes). This underlying immunological basis of asthma has been proven to be critical in guiding effective diagnosis and efficient personalized treatment. 2
Given the heterogeneous nature of asthma, diverse clinical phenotypes have been identified. The most clinically relevant one is based on the responses to corticosteroids (CS), the mainstream asthma therapy. 3 According to this classification, patients are grouped into those sensitive to CS (moderate asthma, MA) and those not sensitive to CS (severe asthma, SA). 4 Although only 5–10% of asthmatic patients belong to the latter category, SA patients’ healthcare expenditure constitutes more than 50% of all asthma medical costs. 3 A clinician needs to identify asthma severity to adequately manage CS application since for SA, this classical treatment sometimes does more harm than good. 5 To some extent, eosinophilia or granulocytes in blood and sputum may suggest the clinical efficacy of CS therapy. 6 However, it is not straightforward enough to measure sputum eosinophils, and the specificity of eosinophils or neutrophils in peripheral blood is extremely low. 7
T helper cell subsets, the key components in adaptive immune responses in humans, play a pivotal role in the pathogenesis of asthma and dominate the efficiency of glucocorticoids in the treatment of inflammatory processes. 8 MA often presents with T helper type 2 (Th2) inflammation, and the pathways involved, that is, IL-4, IL-13, and IL-5 signaling, can be well controlled by hormonal therapy. The situation for SA is somewhat more complicated since this subtype of asthma including type-2 and non–type-2 endotypes. 9 Approximately 50% SA are associated with a non- (or low-)Th2 cytokine signature, and often have mixed granulocytic inflammation comprising both neutrophils and eosinophils populated in the upper or lower airways. 10 SA patients are usually female with an older age at onset of disease, need a higher dose of CS, and are obese. In the non-Th2 asthma pathological processes, the innate proinflammatory TNF-α, IFN-γ, and IL17A signaling pathways are activated and centered around Th1, NK, CD8 T cells, and other non- or low-Th2 cell status. Thus, the key features of T cell function and immunophenotypic differences highlight their utility as biomarkers in the prediction of asthma severity and drug treatment sensitivity. 11
Despite these preliminary understandings of the asthma phenotype, our knowledge of the specific immune mechanism behind asthma is far from sufficient, especially for SA. 12 Steroid-refractory asthma remains a clinical challenge. 13 In this study, we used bioinformatics methods to explore the transcriptional signature of bronchial alveolar lavage (BAL) cell pellets from asthma patients with different severities and validated the results in our local clinical samples. We found that the expression of CC-chemokine receptor 7 (CCR7) and natural killer cell protein 7(NKG7) might be applied for the identification and assessment of asthma severity in bronchoalveolar lavage fluid (BALF) or peripheral blood mononuclear cells (PBMCs). We also evaluated their correlation with immune cell infiltration in asthmatic BALF. In this way, we hope to elucidate the molecular mechanism that underlies SA, which may lead us to identify receptors and bridging molecules that can be useful in asthma severity prediction and guide better health care.
Materials and methods
Acquisition of RNA information
Clinical samples of MA and SA were retrieved from the Gene Expression Omnibus (GEO) database. A total of 74 BAL samples were targeted from GSE74986, including 28 MA and 46 SA samples. 14 MA participants were from the Study of the Mechanisms of Asthma (MAST, clinicaltrials.gov: NCT00595153). SA patients were participants in the BOBCAT study as described. 7 All microarray analysis information of the selected samples was downloaded for further analysis. Since all micro information obtained was from a public database, no patient consent or ethics committee of approval was required.
Data process
The original expression matrix was downloaded from the GEO database through the GEOquery package, and the probes corresponding to multiple molecules were removed. When probes matched with the same molecule were encountered, only the probe with the maximum signal value was retained. 15 We also checked the sample standardization through a box diagram, and then the limma package was applied to screen the difference between MA and SA samples. The p value was adjusted by Benjamini and Hochberg’s method. The differentially expressed genes (DEGs) were selected under the following criteria: at least a 1.5-fold change between the MA and SA groups with adj. p value < 0.05.
Enrichment analysis
The gene set enrichment analysis (GSEA) algorithm was applied to detect associations of functionally related gene sets with a phenotype of interest by sequencing the degree of differential expression between two types of samples. 16 The analysis detects changes in the expression of collections of genes rather than individual genes and therefore can include subtle changes in expression and provide better enrichment results. Database for Annotation, Visualization and Integrated Discovery (DAVID) v6.8 enabled us to conduct biological interpretation of DEG lists in asthma. 17 Moreover, a functional enrichment analysis tool (FunRich) was employed to predict the differential gene pathways involved. Thus, the core pathways associated with the DEGs can be targeted. 18
Gene cluster identification and protein–protein interaction (PPI) network analysis
The DEGs between the two asthma groups were uploaded to STRING to obtain the closeness and centrality of the PPI data. 19 Then, the results were visualized by Cytoscape v.3.7.1 and used for cluster analysis by the Molecular Complex Detection (MCODE) plug-in. 20 Finally, the gene cluster with the highest score was input into STRING again to visualize the biological processes this gene cluster was involved in.
Evaluation of immune cell infiltration
CIBERSORT was used to calculate the immune cell infiltration in each sample by uploading the gene expression matrix data. 21 After we obtained the infiltration matrix, different R packages were applied to visualize the results. Principal component analysis (PCA) clustering analysis and box figures were performed by ggplot2, and a correlation heatmap of each infiltrating immune cell was calculated and visualized with the corrplot package. 22
Correlation analysis between core genes and infiltrating immune cells
We conducted Spearman correlation analysis on core genes and infiltrating immune cells as referenced. 23 In brief, the ggstatsplot package (https://github.com/IndrajeetPatil/ggstatsplot) was used to perform calculations, and ggplot2 was used to visualize the results.
External validation patient cohort
Two candidate genes for asthma severity were selected for further confirmation. For this, we recruited 40 nonsmoking asthma participants, consisting of 24 MA patients and 16 SA patients, at Xiangya Hospital from May 2019 to May 2020. At enrollment, the patients underwent a workup that included spirometry, exhaled nitric oxide (FeNO), blood tests, and medication. Both the asthma diagnosis and the level of severity were determined according to the Global Initiative for Asthma (GINA) recommendations. 24 An individual was eligible for enrollment if he or she was 18–60 years of age; was HAN nationality; was diagnosed with asthma by a clinician more than 1 year prior to recruitment; was a nonsmoker; was able to perform spirometry; agree to join the study and sign written informed consent. Patients were excluded if they had a conflicting disease, such as diabetes mellitus, cancer, or another respiratory condition, including COPD, emphysema, or bronchiectasis. Informed consent of local patients was obtained before beginning the study.
PBMC separation and real-time quantitative reverse transcriptase PCR (RT-qPCR)
PBMCs were isolated by density gradient centrifugation with Ficoll-Paque (GE Healthcare) from collected peripheral venous blood. Fresh isolated PBMCs were then subjected to erythrocyte lysis and washed for total RNA extraction with TRIzol reagent (Invitrogen, Life Technology). The RNA was then reverse transcribed into cDNA according to the manufacturer’s instructions and subjected to real-time PCR amplification with the following primers: CCR7, forward 5’-CATGCTCCTACTTCTTTGCATC-’3, reverse 5’-CATGCTCCTACTTCTTTGCATC-’3; NKG7, forward 5’-GATGTTCTGCCTGATTGCTTTG-’3, reverse 5’-GGACAAGGACAAGAGAGATGG-’3; and GAPDH, forward 5′- GGTGAAGGTCGGAGTCAACG-3′, reverse 5′-CAAAGTTGTCATGGATGACC-3′.
Fold change was calculated with 2−ΔΔCt normalized to GAPDH as internal reference using Excel (Microsoft). For samples without a naive control, gene expression was calculated with 2−ΔCt× 1000 normalized to GAPDH as internal reference.25 All procedures were conducted in triplicate.
Cell culture studies
In order to assess the effects of asthma medications on CCR7 and NKG7 levels, we isolated PBMC from six healthy volunteers consist of three female and three males; All volunteers were Han nationality and the median age was 43years (range 36–48 years). Then, PBMC were cultured in RPMI 1640 medium supplemented with 10% human serum (Gemini Bio-Products) and then treated with 10−5 M dexamethasone for 12 and 24 h. RNA of cell samples was then collected for RT-PCR.
Results
Sorting of sample information and identification of DEGs
Based on the sample information acquired from the data expression matrix, 97 DEGs were identified. As illustrated in the volcano plot (Figure 1), compared with the MA group, 56 genes were upregulated and 41 genes were downregulated in the SA group. The selection criteria for DEGs were as follows: adj.p value < 0.05 and log2 fold change > 1.5. Volcano plot of differentially expressed genes in MA and SA BALF samples. Blue dots represent significantly downregulated genes in SA samples, and red dots represent significantly upregulated genes. MA, moderate asthma; SA, severe asthma; BALF, bronchoalveolar lavage fluid.
T cell-associated pathways and immune response enriched in the SA group
Bioinformatics tools, such as GSEA, DAVID, and FunRich, were applied to conduct enrichment analysis of the sample genes. We first uploaded all the expression data in GSEA software based on the curated gene sets from an overall level of expression profile. The significantly enriched gene sets were set as p value < 0.05 and false discovery rate (FDR) < 0.25. As shown in Figure 2, T cell-associated pathways and immune response pathways were significantly enriched, including the gene sets Notch1 target (NES = 2.41, p < 0.05), Th1 cytotoxic (NES = 2.38, p < 0.05), IL-12 pathway (NES = 2.11, p < 0.05), cell migration (NES = 1.91, p < 0.05), cytokine receptor interaction (NES = 1.76, p < 0.05), and T cell receptor signaling pathway (NES = 1.579, p < 0.05). Gene set enrichment analysis of whole gene values between MA and SA using the h.all.v 6.2.symbols.gmt [Hallmarks] gene set database. NES, normalized enrichment score. Significant gene sets were cut off by FDR < 0.25 and p value < 0.05.
We next used DAVID and FunRich software to process the Gene Ontology (GO) and pathway enrichment of these 97 DEGs in the asthma samples. The GO enrichment results indicated that these genes were mainly associated with T cell activation and immune response in the biological process category. The specific results are illustrated in a bar chart (Figure 3(a)), and only the one with an adj. p value < 0.05 is presented. The Cytoscape ClueGO plug-in was then further used to visualize the sophisticated network of biological processes (Figure 3(b)). Enrichment of the 97 differentially expressed genes in the asthma samples. (a), Bar chart of the top five biological processes sorted using DAVID GO terms with respect to the value of adj.p to which they correspond. (b), GO terms visualized using the ClueGO/CluePedia plug-in from Cytoscape. The values of p ≤ 0.05 indicate the node size and the node color code corresponding to the specific functional class in which they participate. DAVID, Database for Annotation, Visualization and Integrated Discovery.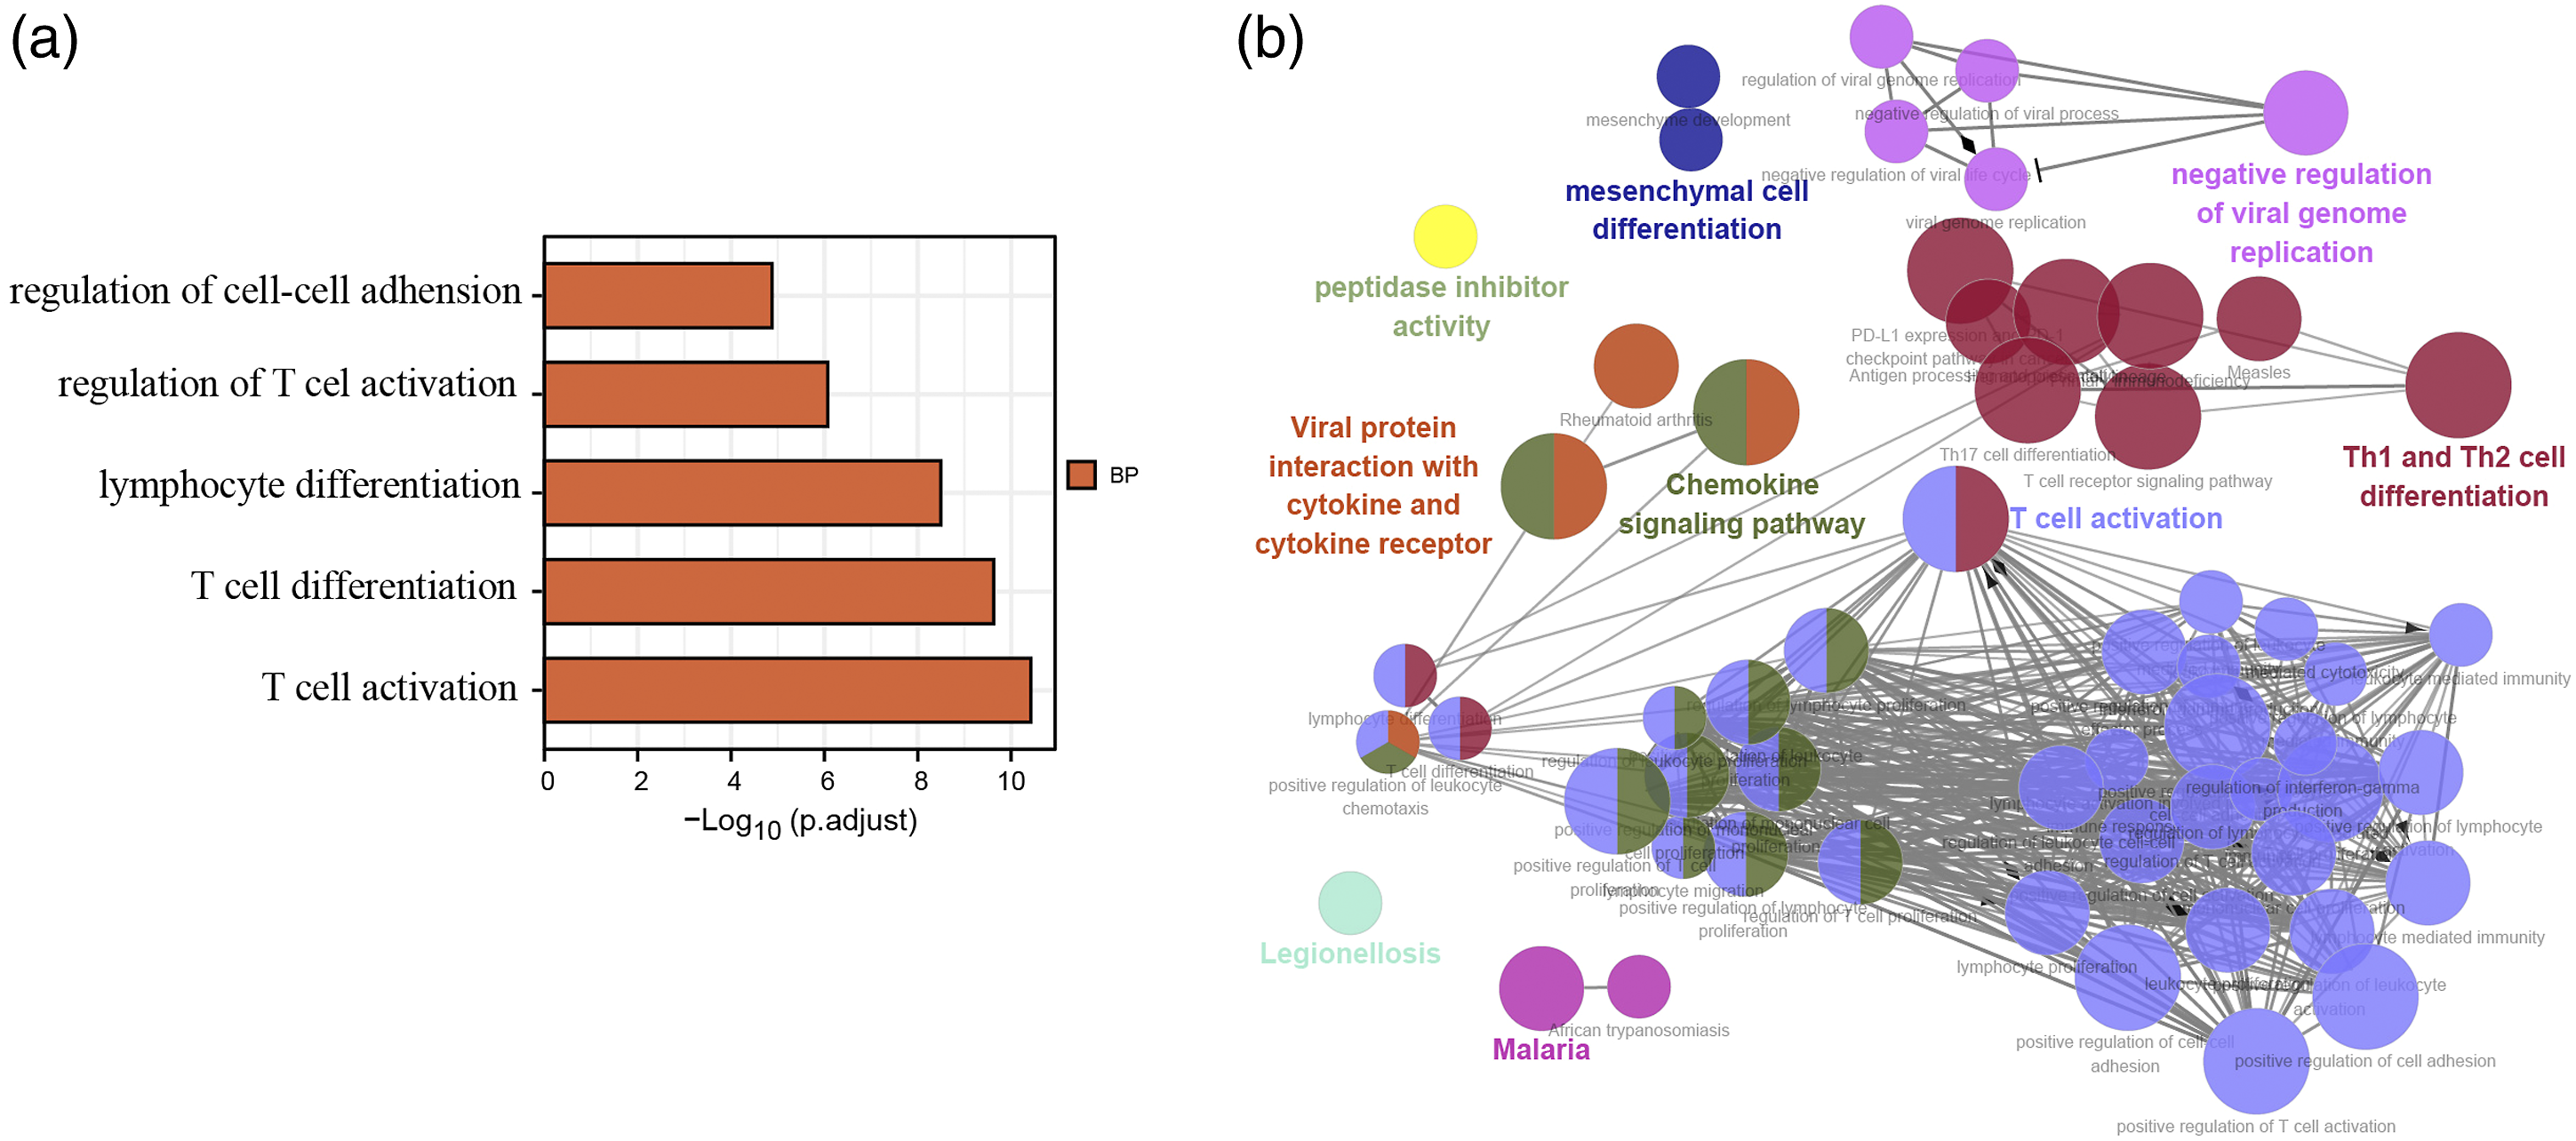
All 97 genes showing significant differential expression were then processed with FunRich. By analysis of these targeted genes, T cell-related pathways were highlighted. TCR signaling in naïve CD8 T cells and downstream signaling in naïve CD8 T cells were highly enriched in SA patients with adj.p < 0.05 (Figure 4). Functional enrichment analysis tool screened six biological pathways with a p value < 0.05.
Construction of a PPI network and further exploration of the gene clusters involved in the immune system–related biological pathway
Hub genes are the central communication and transport hub for several intersecting cellular pathways.
26
Thus, we imported all 97 DEGs into STRING, and 91 nodes and 295 edges were identified. The clustering coefficient was 0.476 with a PPI enrichment p value < 1 × 10⁻¹⁶. Next, we used Cytoscape to further display genes that were functionally close to each other, as shown in Figure 5(a). MCODE was applied since this algorithm detects densely connected regions in large PPI networks that may represent molecular complexes and applies the calculated interaction strengths and local connectivity within the network to group proteins into clusters.4,27 We identified three clusters in all these gene inputs (Table 1). The first gene cluster included 17 genes with the highest scores. The biological process enrichment of these 17 genes showed that they were mainly involved in the regulation of the immune response, leukocyte activation, and regulation of immune system processes according to the FDR value (Table 2) (Figure 5(b)). Construction of a PPI network of DEGs by STRING analysis. (a), Construction of a PPI network of DEGs by STRING analysis and molecules related to the same signaling are colored the same. (b), STRING analysis shows the interaction between genes in cluster 1; molecules related to immune response are colored in red, molecules related to leukocyte activation are colored in green, molecules related to regulation of immune system processes are colored in purple. Specific data of gene clusters from STRING using MCODE function. Top five biological processes enriched in cluster 1


Screening and verification of diagnostic markers
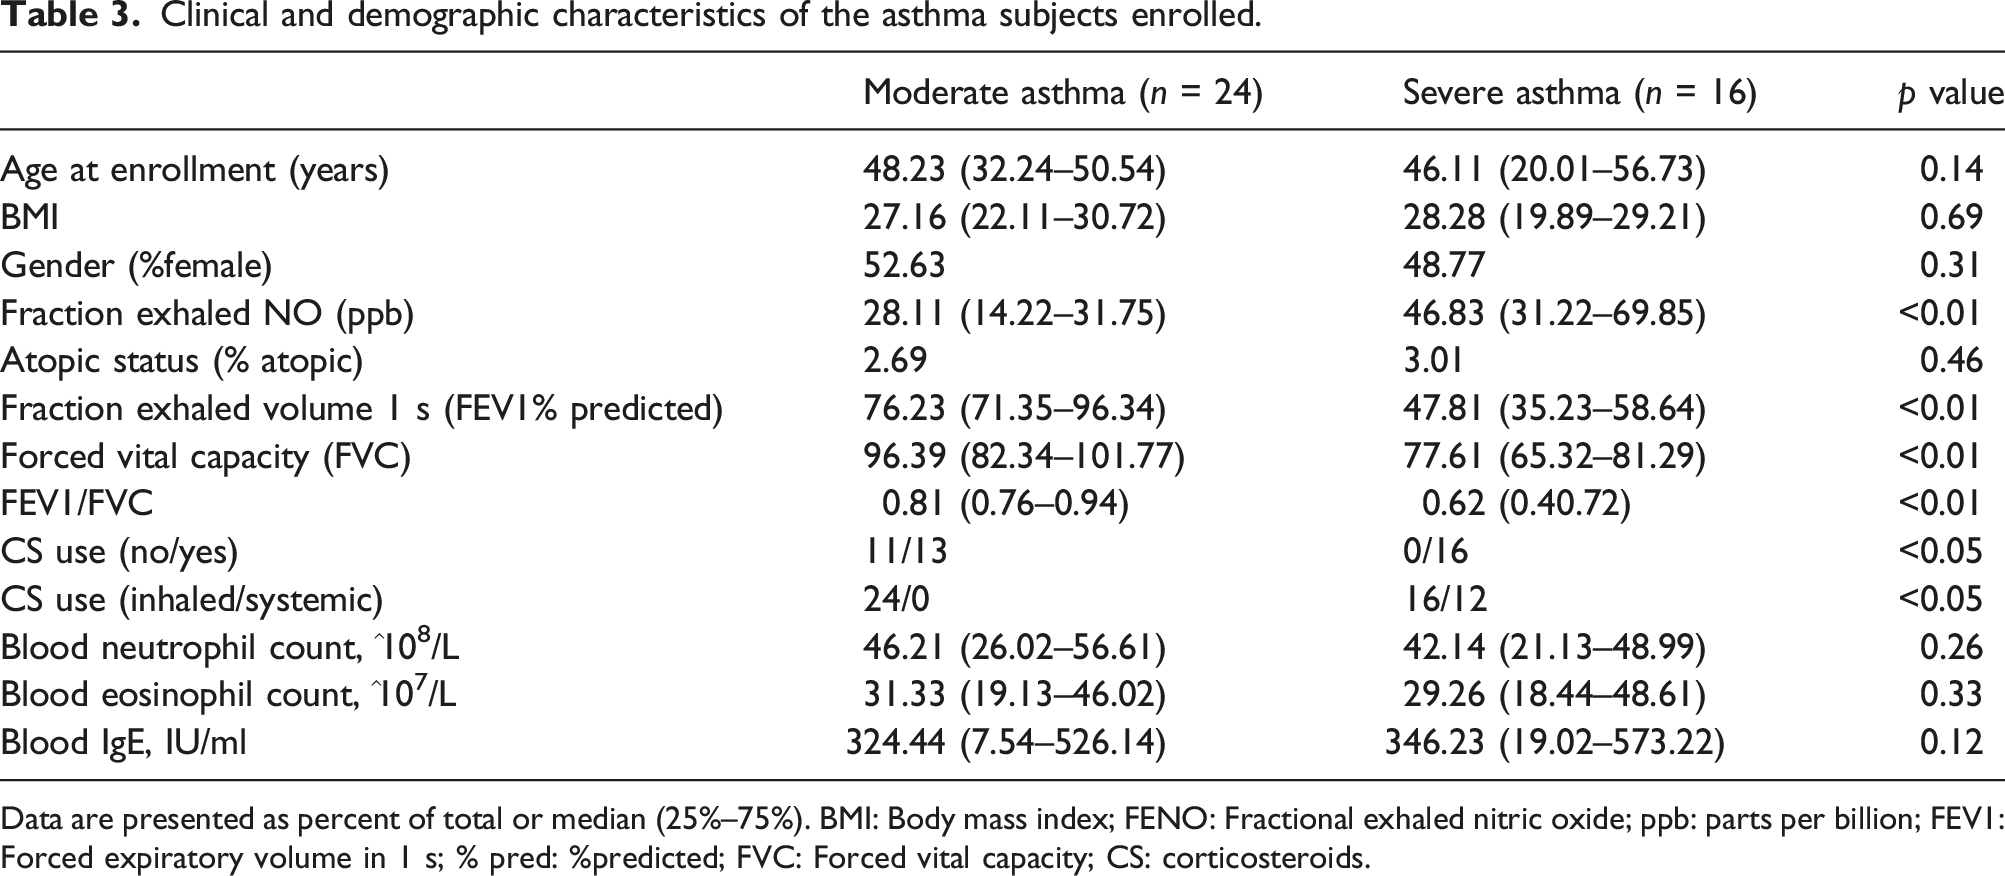
We next used least absolute shrinkage and selection operator (LASSO) logistic regression and the support vector machine-recursive feature elimination (SVM-RFE) algorithms on the 17 genes identified in the first cluster (Figure 6(a) and (b)). Nine and four genes remained representative diagnostic markers (Figure 6(c)). The intersection of LASSO and SVM-RFE led us to focus on CCR7 and NKG7 as diagnostic markers for asthma severity prediction (Figure 6(c)). To verify the diagnostic efficacy of these two genes, we validated them in a locally asthmatic set consisting of 40 asthma subjects (24 with MA and 16 with SA). The baseline clinical characteristics are detailed in Table 3. We tested CCR7 and NKG7 mRNA expression in PBMCs and investigated their value in asthma severity diagnosis. As shown in Figure 6(d), the index combining CCR7 and NKG7 has a higher area under the curve (AUC) value (AUC = 0.851, p < 0.05) than CCR7 (AUC = 0.789, p < 0.05) and NKG7 alone (AUC = 0.767, p < 0.05). Since severe asthmatic is usually under higher inhaled corticosteroids dose or oral glucocorticoid therapy, we also test the effects of corticosteroids on PBMC CCR7 and NKG7 expression. PBMC from healthy volunteers (n = 6) were treated with vehicle or with 10−5 M dexamethasone for 12 and 24 h. None of these two genes expression changed after exposure to dexamethasone at any of the time points assessed (Figure 6(e)). Screening and validation of biomarkers for asthma severity from genes in cluster 1. (a), Least absolute shrinkage and selection operator (LASSO) logistic regression algorithm to screen diagnostic markers. Each color represents an individual gene. (b), Diagnostic marker screened by the support vector machine-recursive feature elimination (SVM-RFE) algorithm. (c), Venn diagram illustrating the intersection of diagnostic markers obtained by the two algorithms. (d), ROC curves of CCR7 and NKG7 in asthma severity prediction. CCR7 (red line), NKG7 (yellow line), and index of the two genes combined (dark line). (e), CCR7 and NKG7 expression of PBMC from healthy volunteers (n = 6) with vehicle or with 10−5 M dexamethasone for 12 and 24 h. Clinical and demographic characteristics of the asthma subjects enrolled. Data are presented as percent of total or median (25%–75%). BMI: Body mass index; FENO: Fractional exhaled nitric oxide; ppb: parts per billion; FEV1: Forced expiratory volume in 1 s; % pred: %predicted; FVC: Forced vital capacity; CS: corticosteroids.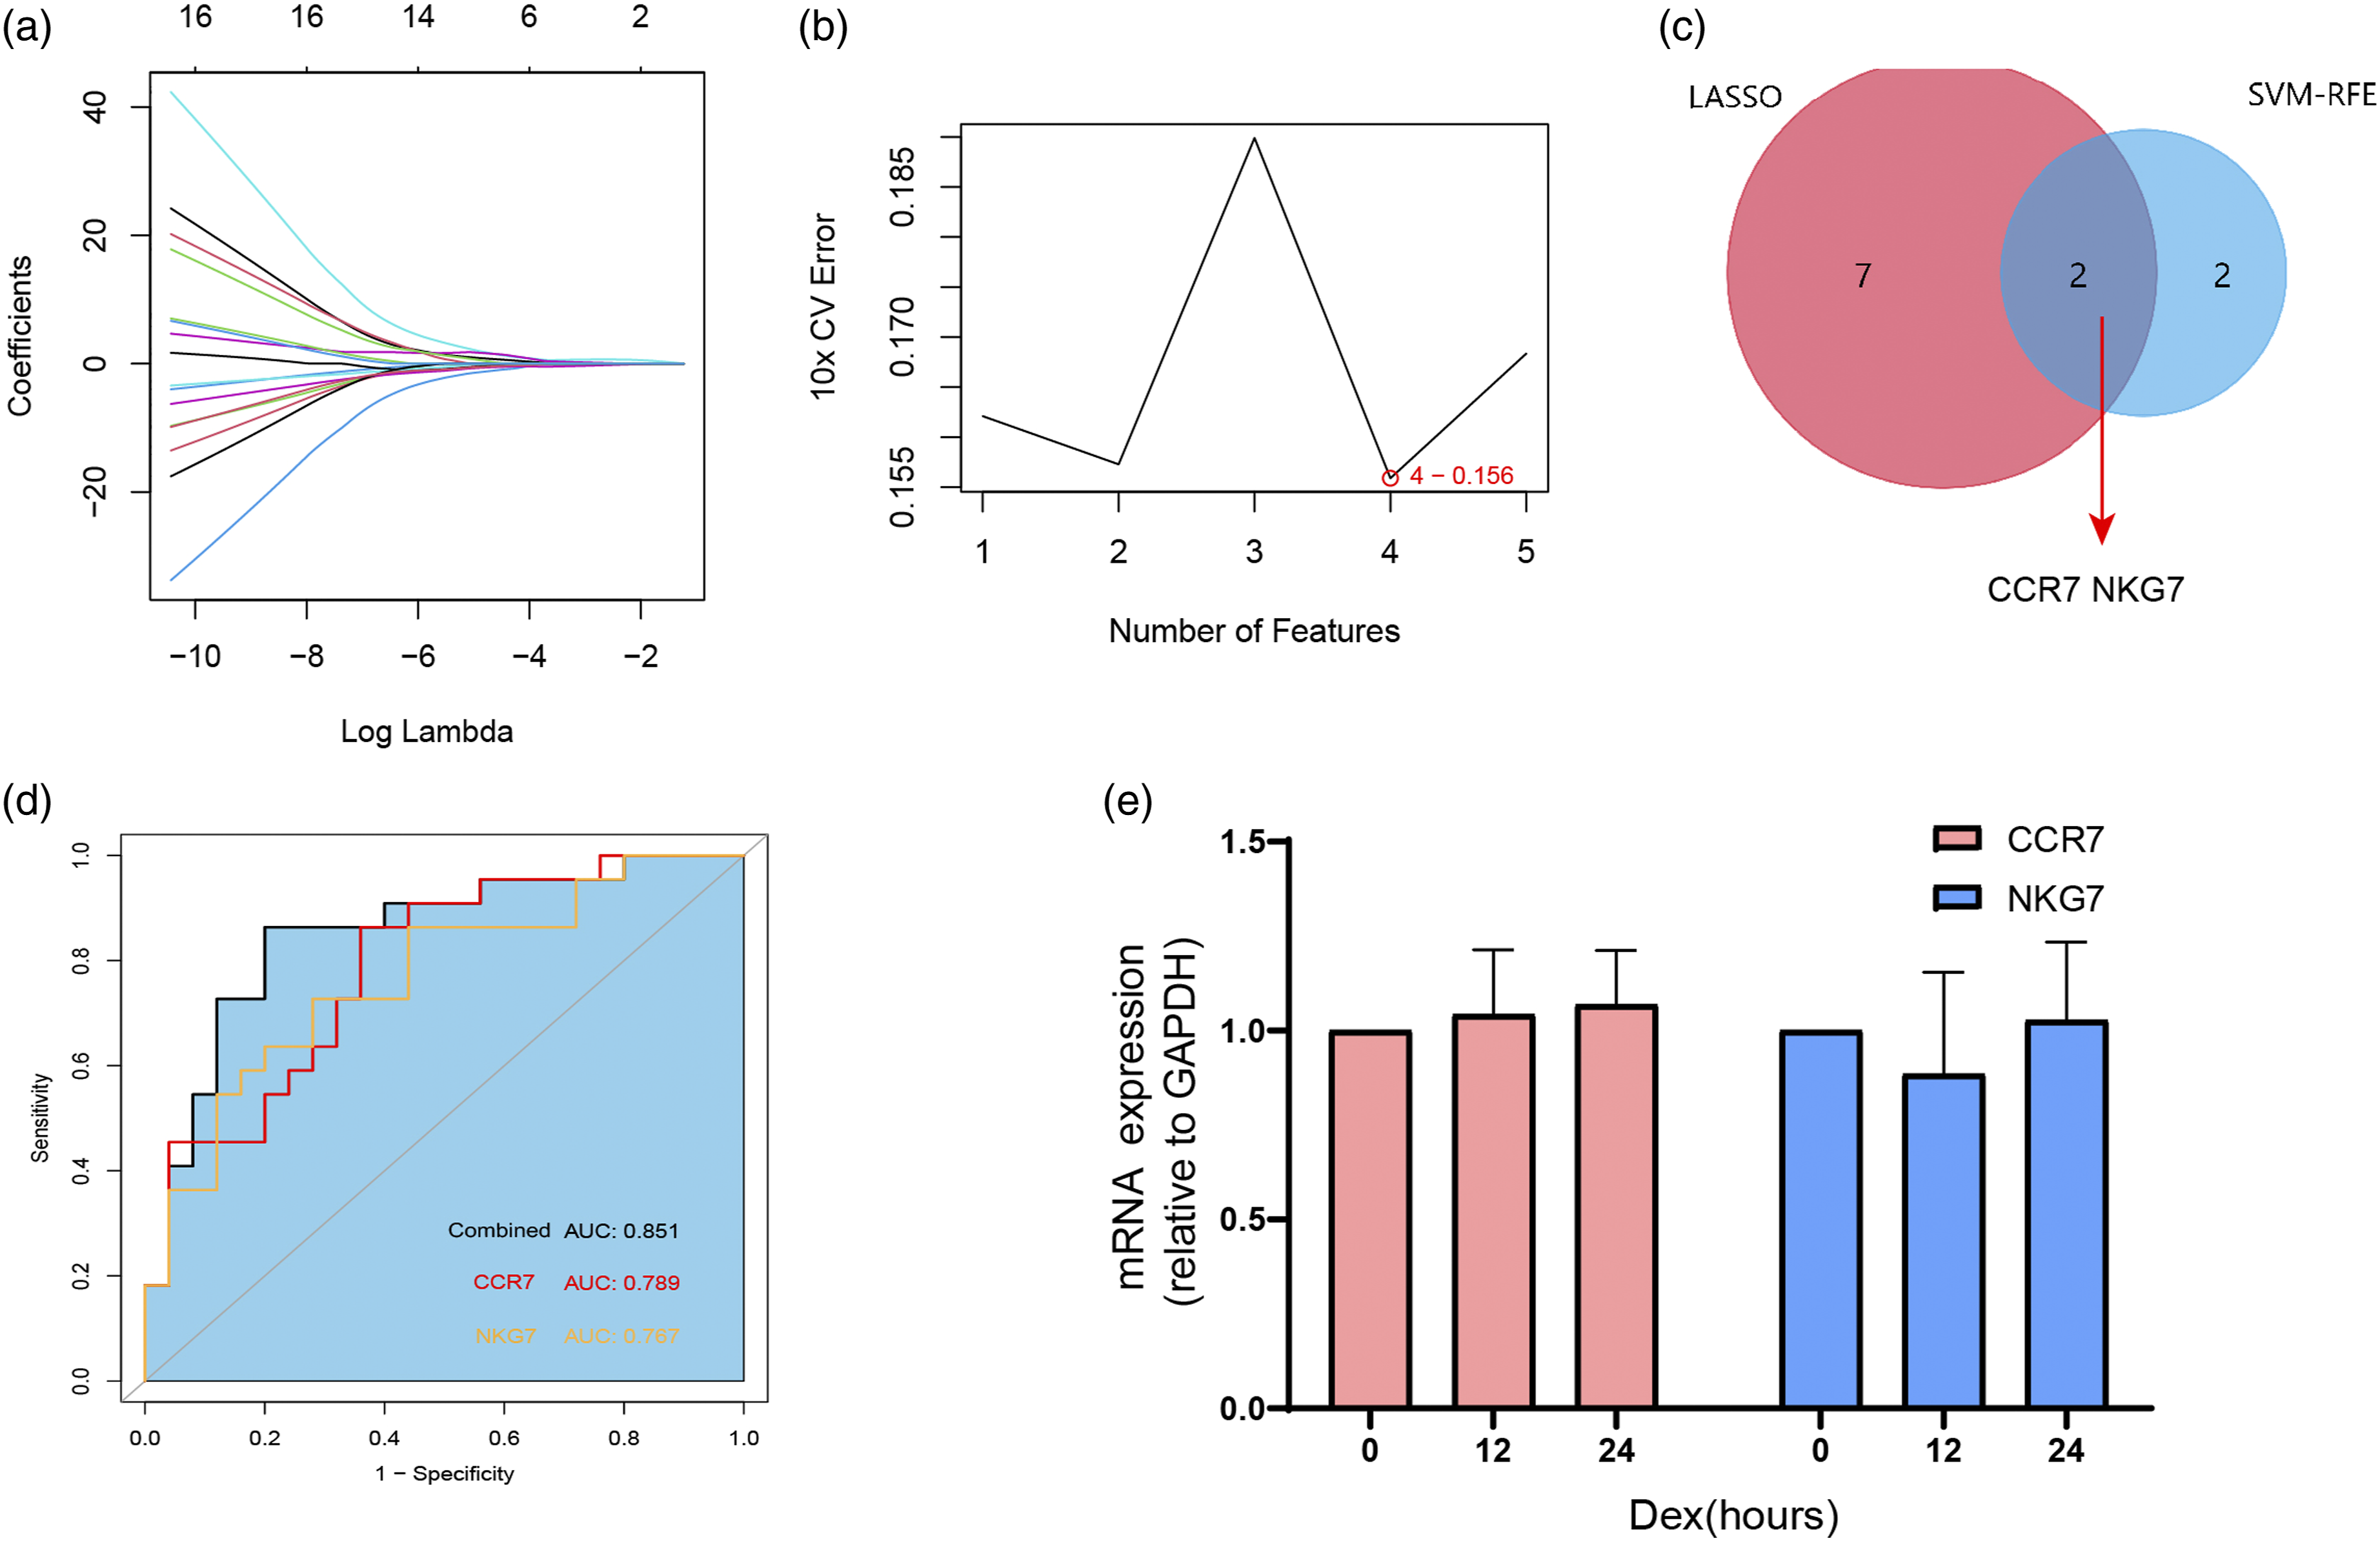
Infiltrated cells in BALF from MA and SA
CIBERSORT provides a way to profile the immune cell types (22 immune cells) in each sample. By performing the calculation, we found that seven types of immune cells were extremely low in all samples (Supplementary materials 1). Therefore, these cells (naïve B cells, plasma cells, naïve T cells, follicular helper T cells, regulatory T cells, resting NK cells, and resting dendritic cells (DCs)) were removed in the next analysis. We next conducted PCA on the results of CIBERSORT, which can obtain principal components (PCs) by searching for maximal variance.
28
As shown in Figure 7(a), immune cell infiltration variance was significant between the MA and SA groups. A correlation heatmap of the infiltrating immune cells is shown in Figure 7(b). Activated memory CD4+ T cells were positively correlated with most of the other immune cells, such as gamma delta T cells, resting mast cells, eosinophils and neutrophils, but negatively correlated with M0 macrophages, M2 macrophages and activated mast cells. Resting memory CD4 T cells showed the same trend as activated memory CD4 T cells but were highly positively correlated with activated NK cells and negatively correlated with CD8 T cells. Immune cell infiltration in asthma BALF. (a), Principal component analysis (PCA) plot of immune cell infiltration between moderate asthma cases and severe asthma cases. (b), Correlation heatmap of infiltrated immune cells. The area size of squares indicates the strength of the correlation, with red representing a positive correlation and blue representing a negative correlation. (c), Violin diagram of the proportion of immune cells in the two asthma groups. (d), Correlation of CCR7 and NKG7 with infiltrated immune cells in asthmatic BALF. Blank squares indicate a nonsignificant correlation, red colors indicate a positive correlation, and blue colors indicate a negative correlation. p < 0.05 was considered statistically significant.
We next compared the immune cell infiltration between the MA and SA groups (Figure 7(c)). CD8 T cells, resting and activated memory CD4 T cells, activated NK cells and activated mast cells were significantly higher in SA patients than in MA patients. Surprisingly, neutrophils were lower. We also noticed that macrophage subtypes, such as alternative macrophages (M2), were higher in patients with SA.
Given these variances in infiltrated immune cells, we next further analyzed the correlations between CCR7 and NKG7 and immune cells (Supplementary materials 2). Both these genes had positive correlations with resting and activated memory CD4 T cells, gamma delta T cells, and activated NK cells (Figure 7(d)). In contrast, M0 macrophages and M2 macrophages were negatively correlated with CCR7 and NKG7. We also found that CCR7 was the only gene identified to be positive for eosinophils (r = 0.375, adj.p = 0.014).
Discussion
SA, with symptoms that are refractory to standard treatments, is recognized as an important and emerging area of unmet need in asthma. 29 While most asthmatics are sensitive to glucocorticoid treatment, severe or treatment-resistant asthma accounts for a main fraction of the asthma management budget and consumes a disproportionate amount of health care resources. Therefore, an early and systematic assessment of asthma severity is particularly important for timely “add-on” therapies and improving quality of life. With rapid advances in genomic and bioinformatic analyses, a much larger volume of data can be collected and analyzed for screening molecular markers. Similarly, tools such as CIBERSORT provide a unique window into the immune cell infiltration patterns of diseases that can be well integrated to reveal molecular biomarkers. In this study, we aimed to identify markers for asthma severity and further hope to reveal the immune cell infiltration in asthma BALF with different severities.
By downloading asthma expression profile data from the GEO database, we identified 97 DEGs, including 56 upregulated genes and 41 downregulated genes in SA patients. Then, multiple tools, including GSEA, DAVID and FunRich, were applied to conduct gene enrichment analysis. The enrichment results indicated that there was a fluctuation in immune cell function, especially T cells, in SA, which is consistent with the findings of available studies showing that T-lymphocyte subsets are implicated in asthma pathobiology and play a central role in airway inflammation. 30
To find the best SA markers, we used machine learning algorithms such as LASSO and SVM-RFE on genes from the top gene enrichment cluster. The former is a machine learning method that works by identifying the variables with λ at the smallest classification error.22,31 The latter is proposed by and based on SVM,31,32 which searches for the best variable by subtracting the feature vectors generated by SVM. 32 These two methods helped us screen feature variables and build a classification model correctly. We finally focused on CCR7 and NKG7 since they were the only DEGs remaining when the two algorithms overlapped. Both genes were later well verified their value in asthma severity in our local asthma cohort.
Given the heterogeneous clinical attributes of asthma, researchers have focused on identifying and enumerating discrete immune cell populations in the upper and lower airways for better asthma management. In this study, we also tried to explore the constitution of immune cells in BALF using CIBERSORT. We found that BALF from SA subjects had lower percentages of neutrophils. There are some studies referred a high neutrophils infiltration in SA airway. 25 However, as we mentioned before, non–type-2 inflammatory endotype is only observed in some patients with SA. 2 And, neutrophilia in BALF is only a feature of some non–type-2 inflammatory endotype. Mahesh et al. also proposed that neutrophilic inflammation per se may not portend poor lung function, as T cells and associated cytokine weights have greater importance in asthma pathophysiology. 2 In our report, memory B cells, CD8 T cells, activated and resting CD4 T cells, and activated NK cells were significantly higher in the SA group. CCR7 and NKG7 stand out as SA biomarkers since these two genes are highly expressed on CD4 T cells and NK cells.
The encoded product of CCR7 is a 7-transmembrane domain, G-protein-coupled receptor that belongs to the CXC chemokine family31. CCR7 is highly expressed on the surfaces of DCs and initial B, T, and Treg cells. Lung alveolar DCs, as the main component of antigen-presenting cells, are responsible for orchestrating the immune reaction by constantly sampling inhaled antigens during asthma. 33 Under physiological states, DCs are maintained at an immature state until pathogen-associated molecular patterns (PAMPs) are sensed, which initiates the maturation and migration of DCs by upregulating CCR7. We observed no significant changes in DCs between the two groups, which may be due to the particularities of BALF, which contains extremely low levels of DCs, as we found. However, CCR7 on other cells, such as T cells and fibrocytes, was also associated with asthma. Chun-Yu Lo et al. compared the expression of CCR7 on fibrocytes (isolated from the adherent fraction of PBMCs) from healthy subjects and patients with nonsevere asthma and SA. They found that CCR7 on fibrocytes from SA presents resistance to the inhibitory effect of dexamethasone in contrast to non-severe and control fibrocytes. 34 Similarly, Matthew et al. investigated the potential signatures of T cell subset phenotypes by collecting fresh whole blood and found that CCR7+ memory CD4+ T cells were the only cells that displayed significant clinical implications in atopic asthma. These studies are consistent with our findings that CCR7 is positively correlated with activated memory CD4 T cells and eosinophils in BALF from asthmatic patients. It is possible that aberrant CCR7 expression underlies the pathological processes of asthma and may be useful to predict asthma severity.
Natural killer cell granule protein 7 (NKG7) is a 17 kDa type III integral membrane protein that was first found to be highly expressed on NK cells and T cells. 35 Susanna et al. revealed that NKG7-deficient NK and CD8 T cells show less efficient killing of target cells. 36 We hypothesize that the differential expression of NKG7 between SA and MA is mainly due to functional changes in NK and CD8 T cells. These cells are currently receiving increased attention due to their potential involvement in the etiology of asthma, particularly in more severe cases. Using postmortem peribronchial tissue samples, Sullivan and coworkers documented an aberrant CD8 T cell deviation dominated by activated cytotoxic CD8 lymphocytes in patients who died as a result of acute asthma. 37 Hamzaoui et al. found an enlargement of the CD8+ CD28− T-cell subset in SA, which expressed higher inner-cytoplasmic perforin. 38 In this report, we also found a positive correlation between NKG7 and activated NK cells. All this evidence demonstrated that NKG7 has the potential to be a novel indicator of the asthma immune cellular environment.
We further validated the values of CCR7 and NKG7 as asthma severity markers using blood samples collected locally. The expression of CCR7 and NKG7 performs well in differentiating SA from MA. More importantly, we found that the index combining these two genes had a higher diagnostic efficiency than each individual index. It is a pity that we did not perform the validation on cells obtained from BALF but on PBMC instead. The origin of cells found in BAL is not the same as cells found in blood and the best way to verify our results is to perform validation on cells obtained from BAL. However, almost all patients we recruited refused bronchial alveolar lavage. Thus, we failed to obtain informed consent for BALF sample collection. Actually, bronchial alveolar lavage is an invasive, expensive procedure with an established risk of complications especially for severe asthma patients. In China, it is not a routine procedure for asthma medical management. Blood is the most convenient and often the only available clinical sample. 39 It is easily obtained from individuals and can be isolated without intensive purification procedures that potentially alter cellular gene expression patterns. 40 As revealed in other study, 41 the main cells in PBMC from asthma patients are CD4+T cells, CD8+ T cells, B Cells, NK cells and monocytes. By contrast, Hui Li, et al. 42 applied single-cell transcriptomic analysis on asthma BALF reveals that the main cells are alveolar macrophages, monocyte-derived DC, monocyte-derived macrophages, CD4+T, CD8+T, and NK cell. As we referred before, CCR7 is highly expressed on the surfaces of DCs while NKG7 is mainly on NK T cells. We suppose that during the pathophysiological process of severe asthma, there is an increased chemotaxis of these two cells from peripheral blood to lung airway. This remains to be confirmed, but has intriguing diagnostic implications.
There are several limitations of this study. First, the sample size selected for validation studies was small and power analysis for sample size calculation was not done. Second, based on the bioinformatics research methods applied in the current study, the raw data we downloaded from GEO lack certain clinical data (pulmonary functions, atopy, types of therapy, and eosinophil counts), which weakens the reliability of our conclusion due to possible potential confounders. However, we screened biomarkers with two different machine learning methods and validated our results using local data, which partly strengthened the credibility of our results. Actually, studies of samples from asthmatics with established disease are potentially confounded by medication usage. Therefore, the differences we observed between moderate and severe asthma may due to exposure to these therapies. We addressed this by measuring PBMC CCR7 and NKG7 gene expression in response to dexamethasone. Although the results of these studies suggest that the expression of these two genes do not respond to effects of glucocorticoids in vitro, it is possible that some of the difference observed respond to pharmacologic treatment in vivo. We do not consider the influence of biotherapy since it is not a common and routine asthma treatment options in China for their low accessibility and high-price. In fact, we found none of our local asthma patients recruited received this treatment ever before. ROC curve analysis suggested that CCR7 and NKG7 may be useful markers for identifying SA. However, these two genes may be less useful for predicting a neutrophil-dominated SA phenotype since our correlation analysis revealed that they have no significant positive correlation with neutrophils in asthmatic BALF. A proportion of patients with SA have persistent airway eosinophilia despite therapy, which follows our findings. 43 Thus, more detailed studies are needed to increase our works’ clinical applicability given the phenotypic heterogeneity of asthma.
Conclusions
In summary, by using bioinformatics, our research indicates that T cells, NK cells and their associated pathways are important in SA. CCR7 and NKG7, which are molecules highly expressed on these cells, were identified by two machine learning algorithms as potential markers of asthma severity. We hope our work provides new ideas for SA diagnosis and management.
Supplemental Material
Supplemental Material—Identification of potential biomarkers and immune infiltration characteristics in severe asthma
Supplemental Material for Identification of potential biomarkers and immune infiltration characteristics in severe asthma by Yuanyuan Jiang, Shuanglinzi Deng, Xinyue Hu, Lisha Luo, Yingyu Zhang, Daimo Zhang, Xiaozhao Li, and Juntao Feng in International Journal of Immunopathology and Pharmacology.
Footnotes
Acknowledgments
The authors thank Dr. Zhao for helping with the blood sample collection.
Declaration of conflicting interests
The author(s) declared no potential conflicts of interest with respect to the research, authorship, and/or publication of this article.
Funding
The author(s) disclosed receipt of the following financial support for the research, authorship, and/or publication of this article: This research was supported by the National Natural Science Foundation of China (81873407, 81670027) and the Natural Science Foundation of Hunan Province (2018JJ2633).
Ethics approval
Since all micro information obtained was from a public database, no patient consent or ethics committee of approval was required for those patients. For locally collected human blood samples, written informed consent was received from participants prior to inclusion in the study. Samples were collected with approval from the Ethics Committee of Xiangya Hospital (201803479).
Ethical statement
For locally collected human blood samples, written informed consent was received from participants prior to inclusion in the study. Samples were collected with approval from the Ethics Committee of Xiangya Hospital (201803479).
Informed consent
Written informed consent was obtained by local subjects.
Supplemental Material
Supplemental material for this article is available online.
References
Supplementary Material
Please find the following supplemental material available below.
For Open Access articles published under a Creative Commons License, all supplemental material carries the same license as the article it is associated with.
For non-Open Access articles published, all supplemental material carries a non-exclusive license, and permission requests for re-use of supplemental material or any part of supplemental material shall be sent directly to the copyright owner as specified in the copyright notice associated with the article.