
Abstract
Purpose
To detect the prognostic importance of liquid–liquid phase separation (LLPS) in lung adenocarcinoma.
Methods
The gene expression files, copy number variation data, and clinical data were downloaded from The Cancer Genome Atlas cohort. LLPS-related genes were acquired from the DrLLPS website. The prognostic model based on LLPS was constructed by the Cox regression and LASSO regression analyses after the identification of LLPS-related differentially expressed genes (DEGs). Gene Ontology functional and Kyoto Encyclopedia of Genes and Genomes enrichment analysis were performed. The LLPS-related prognostic risk score was validated by GSE31210 and GSE72094. The overall survival of lung adenocarcinoma patients was predicted by plotting a nomogram. The biological features of the high-risk lung adenocarcinoma were evaluated by the CIBERSORT, ESTIMATE, Gene Set Variation Analysis, and Genomics of Drug Sensitivity in Cancer. Reverse transcription-quantitative polymerase chain reaction detected hub gene expression.
Results
A total of 91 DEGs were screened out in LLPS, among which 9 genes were discovered as prognostic biomarkers of lung adenocarcinoma. GRIA1, CRTAC1, MAGEA4, and MAPK4 were identified as hub genes by the LASSO Cox regression analysis. High-risk and low-risk groups were divided according to the risk index, with the high-risk group displaying a markedly worse outcome. CRTAC1 expression was significantly decreased, MAGEA4 and MAPK4 expressions were increased, while GRIA1 expression was altered in lung adenocarcinoma cells. Tumor microenvironment, signaling pathway enrichment, and drug sensitivity significantly differed between different risk groups.
Conclusions
This work proposed a prognostic tool based on the LLPS-related gene signature to offer prospective and effective biomarkers for lung adenocarcinoma prognosis.
Keywords
Introduction
Lung cancer stands for a heterogenous neoplasia of the respiratory system, which has been greatly proposed as a predominant driver of cancer mortality trends universally. 1 It has been projected that in 2022, globally, 2.5 million people suffered from lung cancer, which had a toll of 1.8 million deaths, separately holding 12.4% of total cancer cases and 18.7% of total cancer deaths. 2 With the altered disease spectrum of non-small cell lung cancer (NSCLC), which occupies the vast majority of lung cancer, lung adenocarcinoma (LUAD)—the most prevalent histologic variety of NSCLC—totals around 40% of NSCLC cases, standing for the highest proportion of lung cancer cases. 3 So far, the prognostic outcome of patients with LUAD is far from satisfactory despite the fact that therapeutic progress of LUAD is subjected to conventional treatment regimens: surgical resection, iatrochemistry and radiotherapy, coupled with the advent of immunotherapy and targeted therapy.4,5 Simultaneously, the clinical features of LUAD cannot be accurately covered by the traditional prognostic prediction system, including tumor staging and histological grading.6,7 Therefore, the identification of reliable prognostic signatures remains the primary focus in LUAD research to effectively forecast patients’ survival and to guide further advances in targeted therapies.
Liquid–liquid phase separation (LLPS) is a fundamental physicochemical process where intracellular distinct liquid-like condensates are assembled from biomacromolecule compartmentalization and aggregation. 8 Through the dynamic exchange with condensate components and surrounding structures, LLPS can maintain cellular homeostasis. 8 Currently, it is well established that LLPS can impact biological events including RNA metabolism, ribosome biogenesis, the DNA damage response, transcriptional regulation, as well as signal transduction.9,10 Numerous reports have supported that LLPS intervenes in the process of human diseases11–13 Particularly, emerging investigations have unraveled the association of dysregulated LLPS formation with human malignancies.14,15 Recent research has supported that LLPS-related gene signature may function as a potential prognostic predictor in breast cancer, 16 hepatocellular carcinoma, 17 endometrial cancer, 18 glioma, 19 and other human malignancies. It is worth noting that LLPS can be applied to the targeted therapy for lung cancer 20 ; LLPS is newly recognized as a prognostic tool and related to immune landscape of lung squamous cell carcinoma. 21 Nonetheless, whether LLPS is implicated in the prognostic prediction of LUAD remains to be untangled.
Accordingly, the endeavor of this work was to build a prognostic signature associated with LLPS by least absolute shrinkage and selection operator (LASSO) regression analysis in a discovery data set, prove the reliability of this model combined with prognosis prediction in the validation set, and further clarify the possible association of risk score with biological functions, immune response, and drug reactivity in LUAD.
Materials and methods
Data acquisition
The gene expression files of 535 tumor samples and 59 normal adjacent samples, and copy number variation data of LUAD patients were downloaded from The Cancer Genome Atlas (TCGA)-LUAD cohort (https://portal.gdc.cancer.gov/). Also, the corresponding clinical information of 242 patients were collected. GSE31210 and GSE72094 datasets from Gene Expression Omnibus (GEO; https://www.ncbi.nlm.nih.gov/geo/) were adopted as validation sets in the prediction model. The LLPS-related genes were acquired from data resource of liquid–liquid phase separation (DrLLPS) website (http://llps.Biocuckoo.cn/).
Identification of LLPS-related differentially expressed genes associated with LUAD prognosis
The R (edgeR); version 3.32.1) was to distinguish differentially expressed genes (DEGs) in LUAD. 22 The univariate Cox regression model was applied to screen LLPS-related DEGs associated with LUAD prognosis.
Functional enrichment analysis
Based on Gene Ontology (GO) terms and Kyoto Encyclopedia of Genes and Genomes (KEGG) pathways referring to the Molecular Signatures Database (MSigDB; v2023.1), the biological functions of the acquired LLPS-related DEGs associated with LUAD prognosis were evaluated with the R (clusterProfiler; version 3.18.1), the results of which were presented in Circos plots.
Identification of hub genes
The acquired LLPS-related DEGs associated with LUAD prognosis were subjected to LASSO regression analyses utilizing the R (glmnet; version 4.1.7) to obtain the candidate LLPS genes for the prognostic signature. Circos diagrams were to depict the landscape of genomic location. Besides, the survival analysis of the four candidate hub genes was also implemented and exhibited by using the Kaplan–Meier method.
Development and evaluation of the LLPS-related gene signature
Risk score was defined by the formula:
The construction of a nomogram
Nomograms were constructed to predict mortality at 1, 3 and 5 years by integrating patients’ model risk scores and clinical data using the R (survival; version 3.5.5) and R (rms; version 6.0.0). The clinical value of the nomogram was predicted by the calibration curve, area under the curve (AUC) curve, and decision curve.
Immune infiltration analysis
The Cell-type Identification by Estimating Relative Subsets of RNA Transcripts (CIBERSORT) method was applied to infer the relative composition of immune infiltrating cells.
Immune checkpoint analysis
The Estimation of Stromal and Immune cells in Malignant Tumors using Expression data (ESTIMATE) algorithm was applied to calculate the proportion of stromal and immune cells.
Gene set variation analysis
The enrichment score of GO and KEGG pathway in different risk groups was analyzed with the aid of the R gene set variation analysis (GSVA; version 1.38.2). The differences in enrichment scores between the two groups were measured by the R (limma; version 3.46.0).
Drug sensitivity analysis
According to Genomics of Drug Sensitivity in Cancer (GDSC; https://www.cancerrxgene.org/), the divergence in drug response in both low- or high-risk groups was estimated adopting the R (pRRophetic; version 0.5).
Cell culture
Human LUAD cell lines (A549, H1975, and H1793) and human bronchial epithelial cells (HBE) were all obtained from American Type Culture Collection (ATCC, Manassas, VA, USA) and were respectively grown in F-12K medium containing 10% fetal bovine serum (FBS), RPMI-1640 medium containing 10% FBS, DMEM/F-12 medium containing 5% FBS and keratinocyte serum free medium (K-SFM) supplemented with 0.05 mg/mL BPE, 5 ng/mL EGF, and 10 ng/mL cholera toxin.
Reverse transcription-quantitative polymerase chain reaction
Total RNA was extracted from cells using TRIzol reagent (Invitrogen) and the first strand cDNA was reverse transcribed from total RNA using the PrimeScript™ II 1st Strand cDNA Synthesis Kit (TaKaRa Bio, Dalian, China). Reverse transcription-quantitative polymerase chain reaction (RT-qPCR) was performed using an ABI 7500 RT-PCR system (Applied Biosystems) with SYBR® Premix Ex Taq™ Kit (TaKaRa Bio). Fold-change in expression was calculated using the 2−ΔΔCT method.
Statistics
All these analyses were performed using R (version 4.3.3) software (https://www.r-project.org/). One-way analysis of variance (ANOVA) followed by Tukey's post hoc test was used to evaluate statistical significance of differences by GraphPad Prism software (Version 8.0, San Diego, CA, USA). P values <0.05 were deemed as statistically significant, unless otherwise stated.
Results
Functional annotation of DEGs in LUAD
Based on the TCGA database, a total of 1384 differential genes in LUAD were ascertained, among which 412 were overexpressed and 972 were underexpressed in tumor samples by contrast with normal samples with threshold values of P<0.001 and |log2FC| >1, which were illustrated in Heatmap and volcano plots (Figure 1(a) and (b)). Furthermore, 71 DEGs in total were discovered to be related to LLPS after taking the crossover of DEGs and LLPS-related genes (Figure 1(c)). Next, the screened LLPS-related DEGs of LUAD were included in the univariate Cox regression model. As a result, nine prognostic LLPS-related DEGs were identified, including GRIA1, CA4, FAM107A, FHL1, CRTAC1, MAGEA4, MAPK4, PLP1, and GABRA4 (Figure 1(d). Through KEGG and GO analysis, the biological implications of these DEGs were detected (P-value cutoff <0.05) and the data elaborated that these LLPS-related DEGs were mostly enriched in GO terms including cell cycle, cell cycle phase transition, cell growth, metal ion transport, axon development, monoatomic ion transmembrane transport, membrane potential, trans synaptic signaling in the biological process (BP) category, and KEGG pathways including nitrogen metabolism, long-term potentiation, amyotrophic lateral sclerosis (ALS), proximal tubule bicarbonate reclamation, neuroactive ligand receptor interaction, as well as long-term depression (Figure 1(e) and (f)).
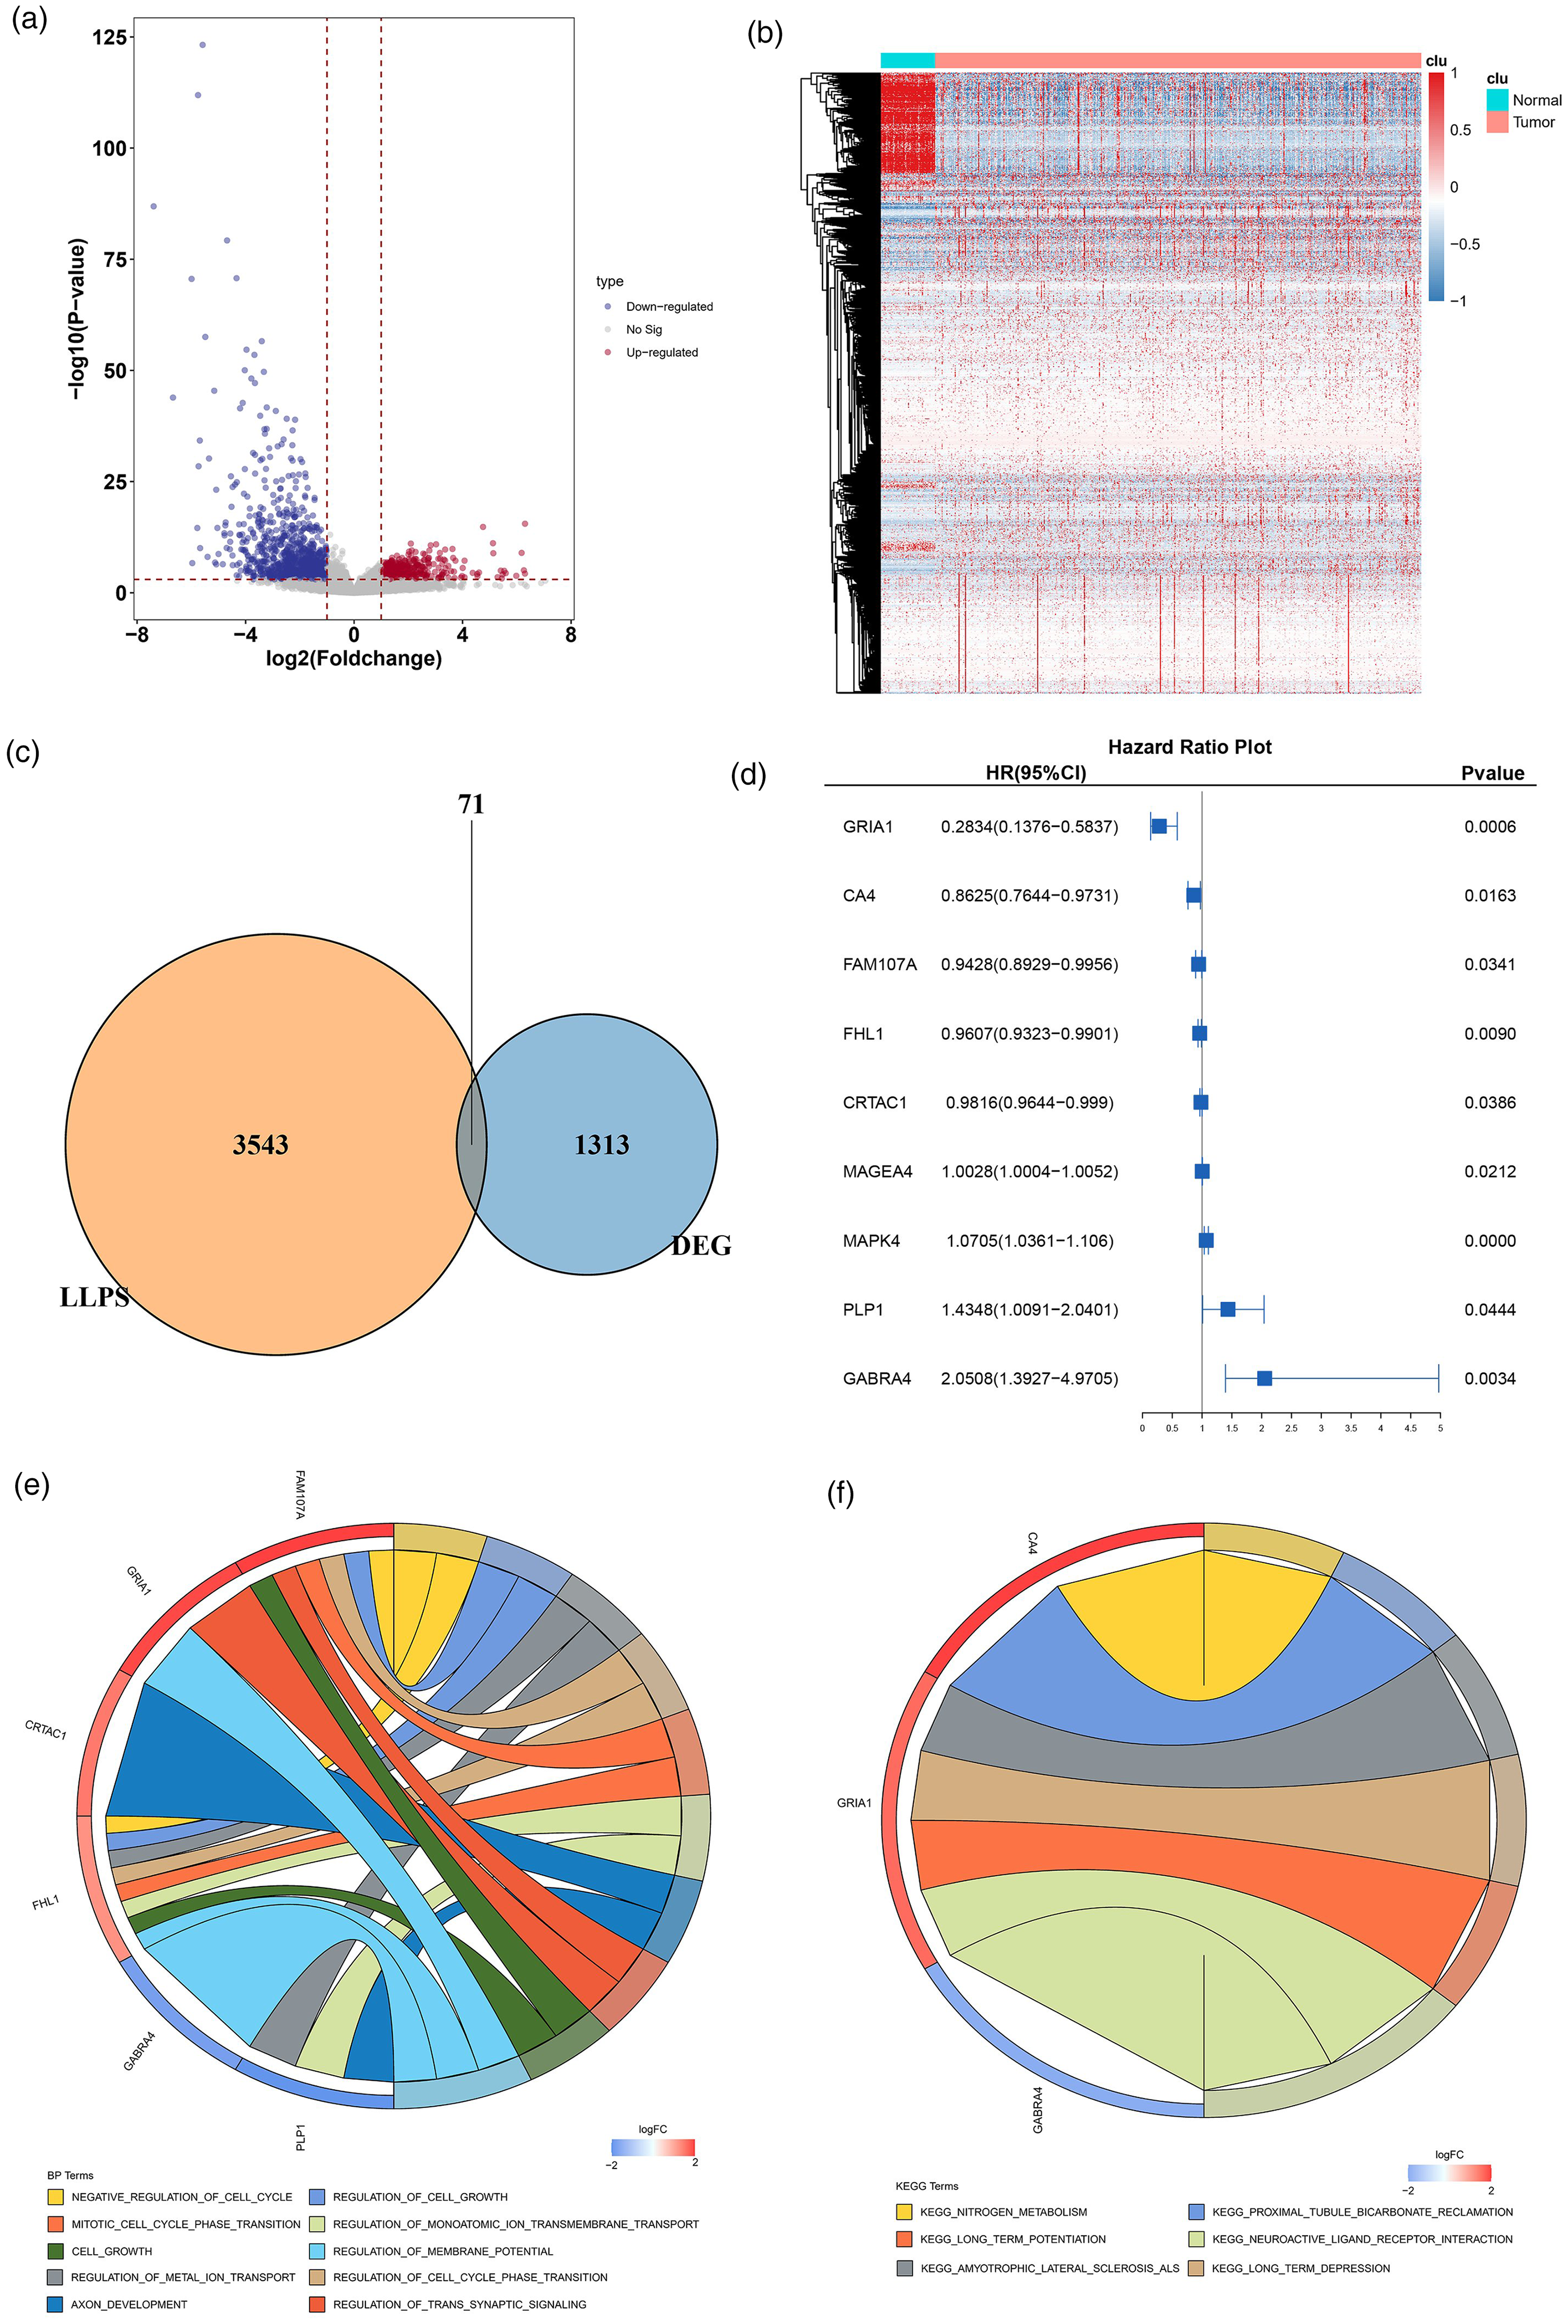
Functional annotation of DEGs in LUAD. (a) Volcano plots exhibiting significant DEGs. The filtering conditions were set as |Log2FC| > l and P < 0.05. Significantly under-expressed genes are labeled in blue. Significantly overexpressed genes are labelled in red. Genes showing no significant difference are labeled in gray. (b) Heat map exhibiting the expression of significant DEGs. Blue corresponds to lower gene expression and red corresponds to higher gene expression. (c) Venn diagram exhibiting LLPS-related DEGs. (d) The application of univariate Cox regression analysis to identify LLPS-related DEGs associated with the outcome of LUAD patients. (e) GO term of prognostic LLPS-related DEGs. (f) KEGG enrichment of prognostic LLPS-related DEGs.
Screening and validation of hub LLPS-related prognostic genes
To build a prognostic risk score signature consisting of the hub prognostic genes, the aforementioned nine genes were incorporated into the LASSO Cox regression analysis for further screening and validation. Eventually, GRIA1, CRTAC1, MAGEA4, and MAPK4 were identified (Figure 2(a) and (b)), the chromosome location information of which are depicted in Circos diagrams (Figure 2(c)). Through gene survival analysis, it was noticed that increased GRIA1 and CRTAC1 expressions significantly implied a better clinical outcome while elevated MAPK4 expression might account for a worse clinical outcome (Figure S1(a) to (d)). In addition, MAGEA4 expression was elevated in LUAD samples whereas GRIA1, CRTAC1 and MAPK4 expressions were all lowered in LUAD samples relative to normal samples (Figure S1(e)).
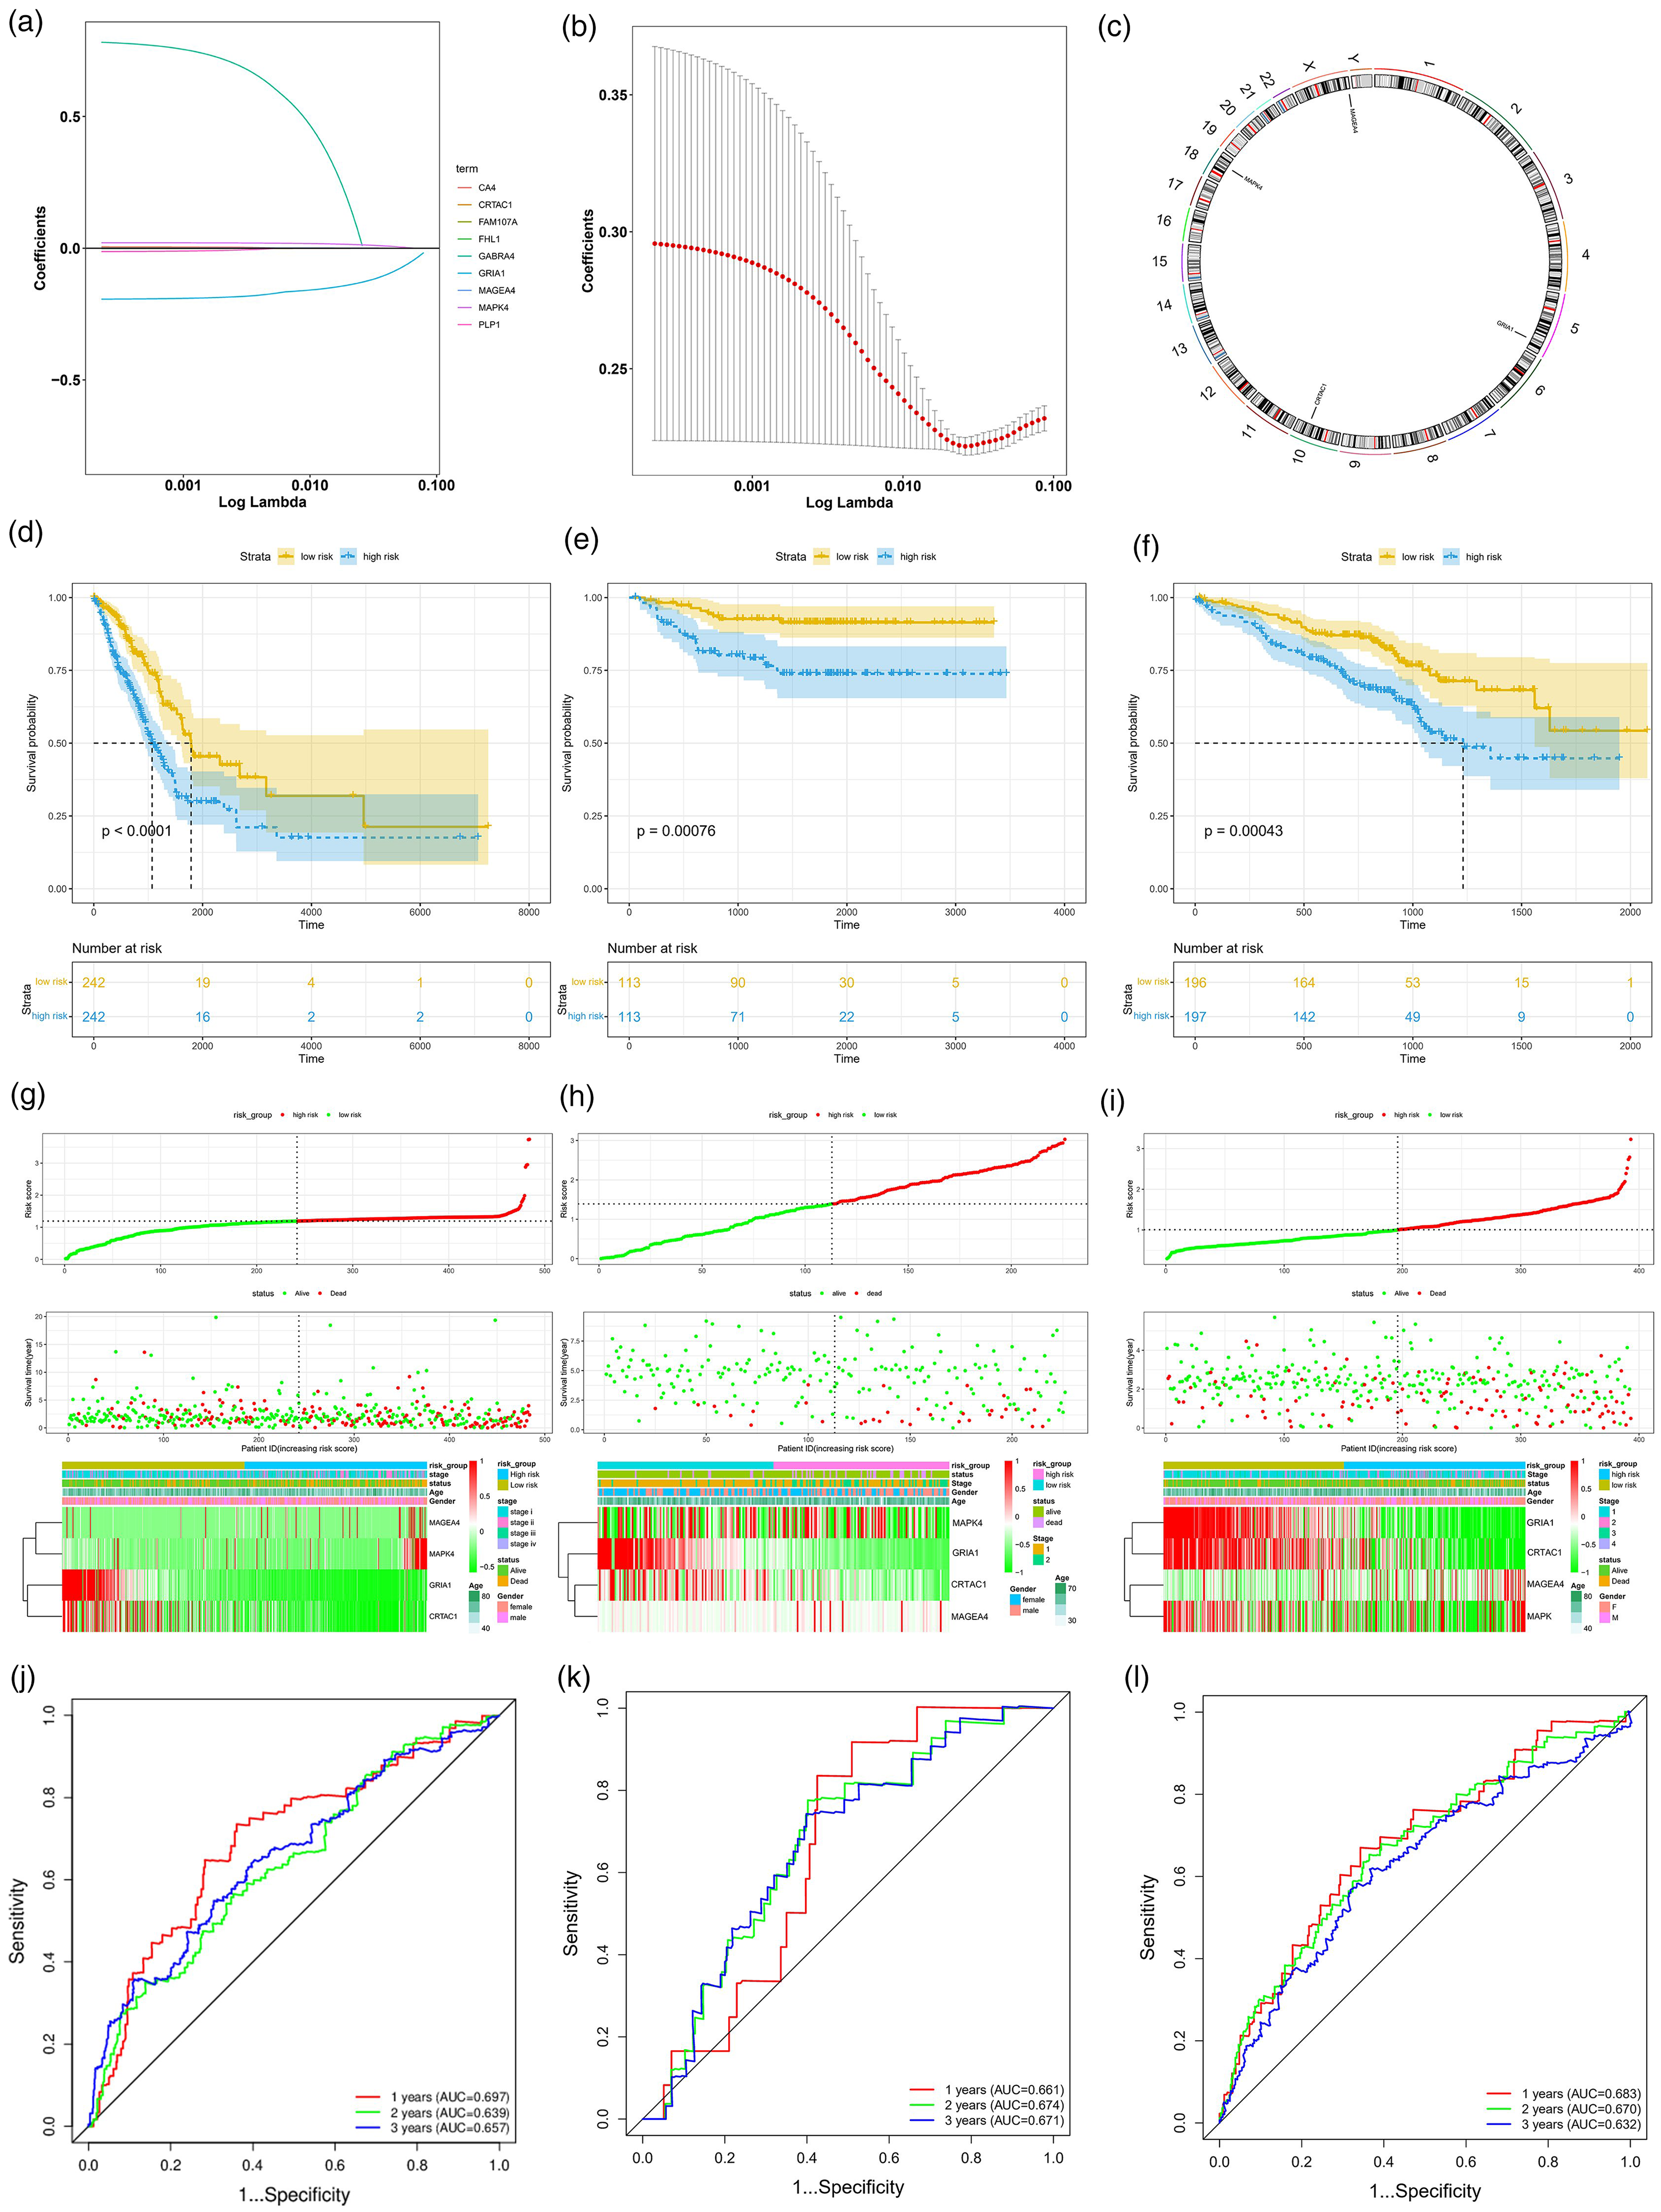
Screening and validation of hub LLPS-related prognostic genes. (a) The coefficient profiles of the prognostic LLPS-related DEGs by LASSO Cox regression. (b) Mean-squared error plotted versus log. (c) Chromosome location information of hub LLPS-related prognostic genes was visualized in Circos diagrams. Kaplan–Meier survival analysis in the (d) training cohort, (e) GSE31210 validation cohort, and (f) GSE72094 validation cohort. The survival status, the number of patients with different risk scores and the characteristics of hub LLPS-related prognostic genes in the (g) training cohort, (h) GSE31210 validation cohort, and (i) GSE72094 validation cohort. The ROC curves for 1-, 2-, and 3-year overall survival in the (j) training cohort, (k) GSE31210 validation cohort, and (l) GSE72094 validation cohort.
LLPS-related risk score was developed according to (−1.14947205804407*GRIA1) + (−0.00766226652396139*CRTAC1) + (0.00153610680962868*MAGEA4) + (0.0539672398383261* MAPK4). The samples in both the training and validation cohorts were sorted into high- and low-risk groups according to their median risk values. The overall survival of the patients with high-risk index was remarkably shorter than those with low-risk index (Figure 2(d) to (f)). The same finding was observed in Kaplan–Meier analysis which displayed the distribution of risk score, survival status, and survival time in both the training (TCGA) and validation (GSE31210 and GSE72094) datasets, suggesting a substantially effective performance for overall survival prediction in LUAD (Figure 2(g) to (1)). As shown in the ROC curves, the AUCs for 1, 2, and 3 years were 0.697, 0.639, and 0.657, respectively, in the TCGA training cohort; 0.683, 0.670, and 0.632 in the GSE72094 validation cohort; and 0.661, 0.674, and 0.671 in the GSE31210 validation cohort, validating the efficacy of the predictive model (Figure 2(j) to (l)).
Subgroup analysis of clinical characteristics and construction of a nomogram
Notably, patients in the high-risk group are younger than those in the low-risk group (P<0.05) (Figure 3(a)). Intriguingly, no apparent differences in the distribution of metastasis were distinguished between the two subgroups (Figure 3(b)). Patients with stage I had a lower-risk score and patients with stage II or III had a higher-risk score (Figure 3(c)). As summarized in Figure 3(d) and (e), the high-risk subgroup contained a higher proportion of tumor and node. All these findings highlighted the specific clinical significance of the risk model based on LLPS-related genes.
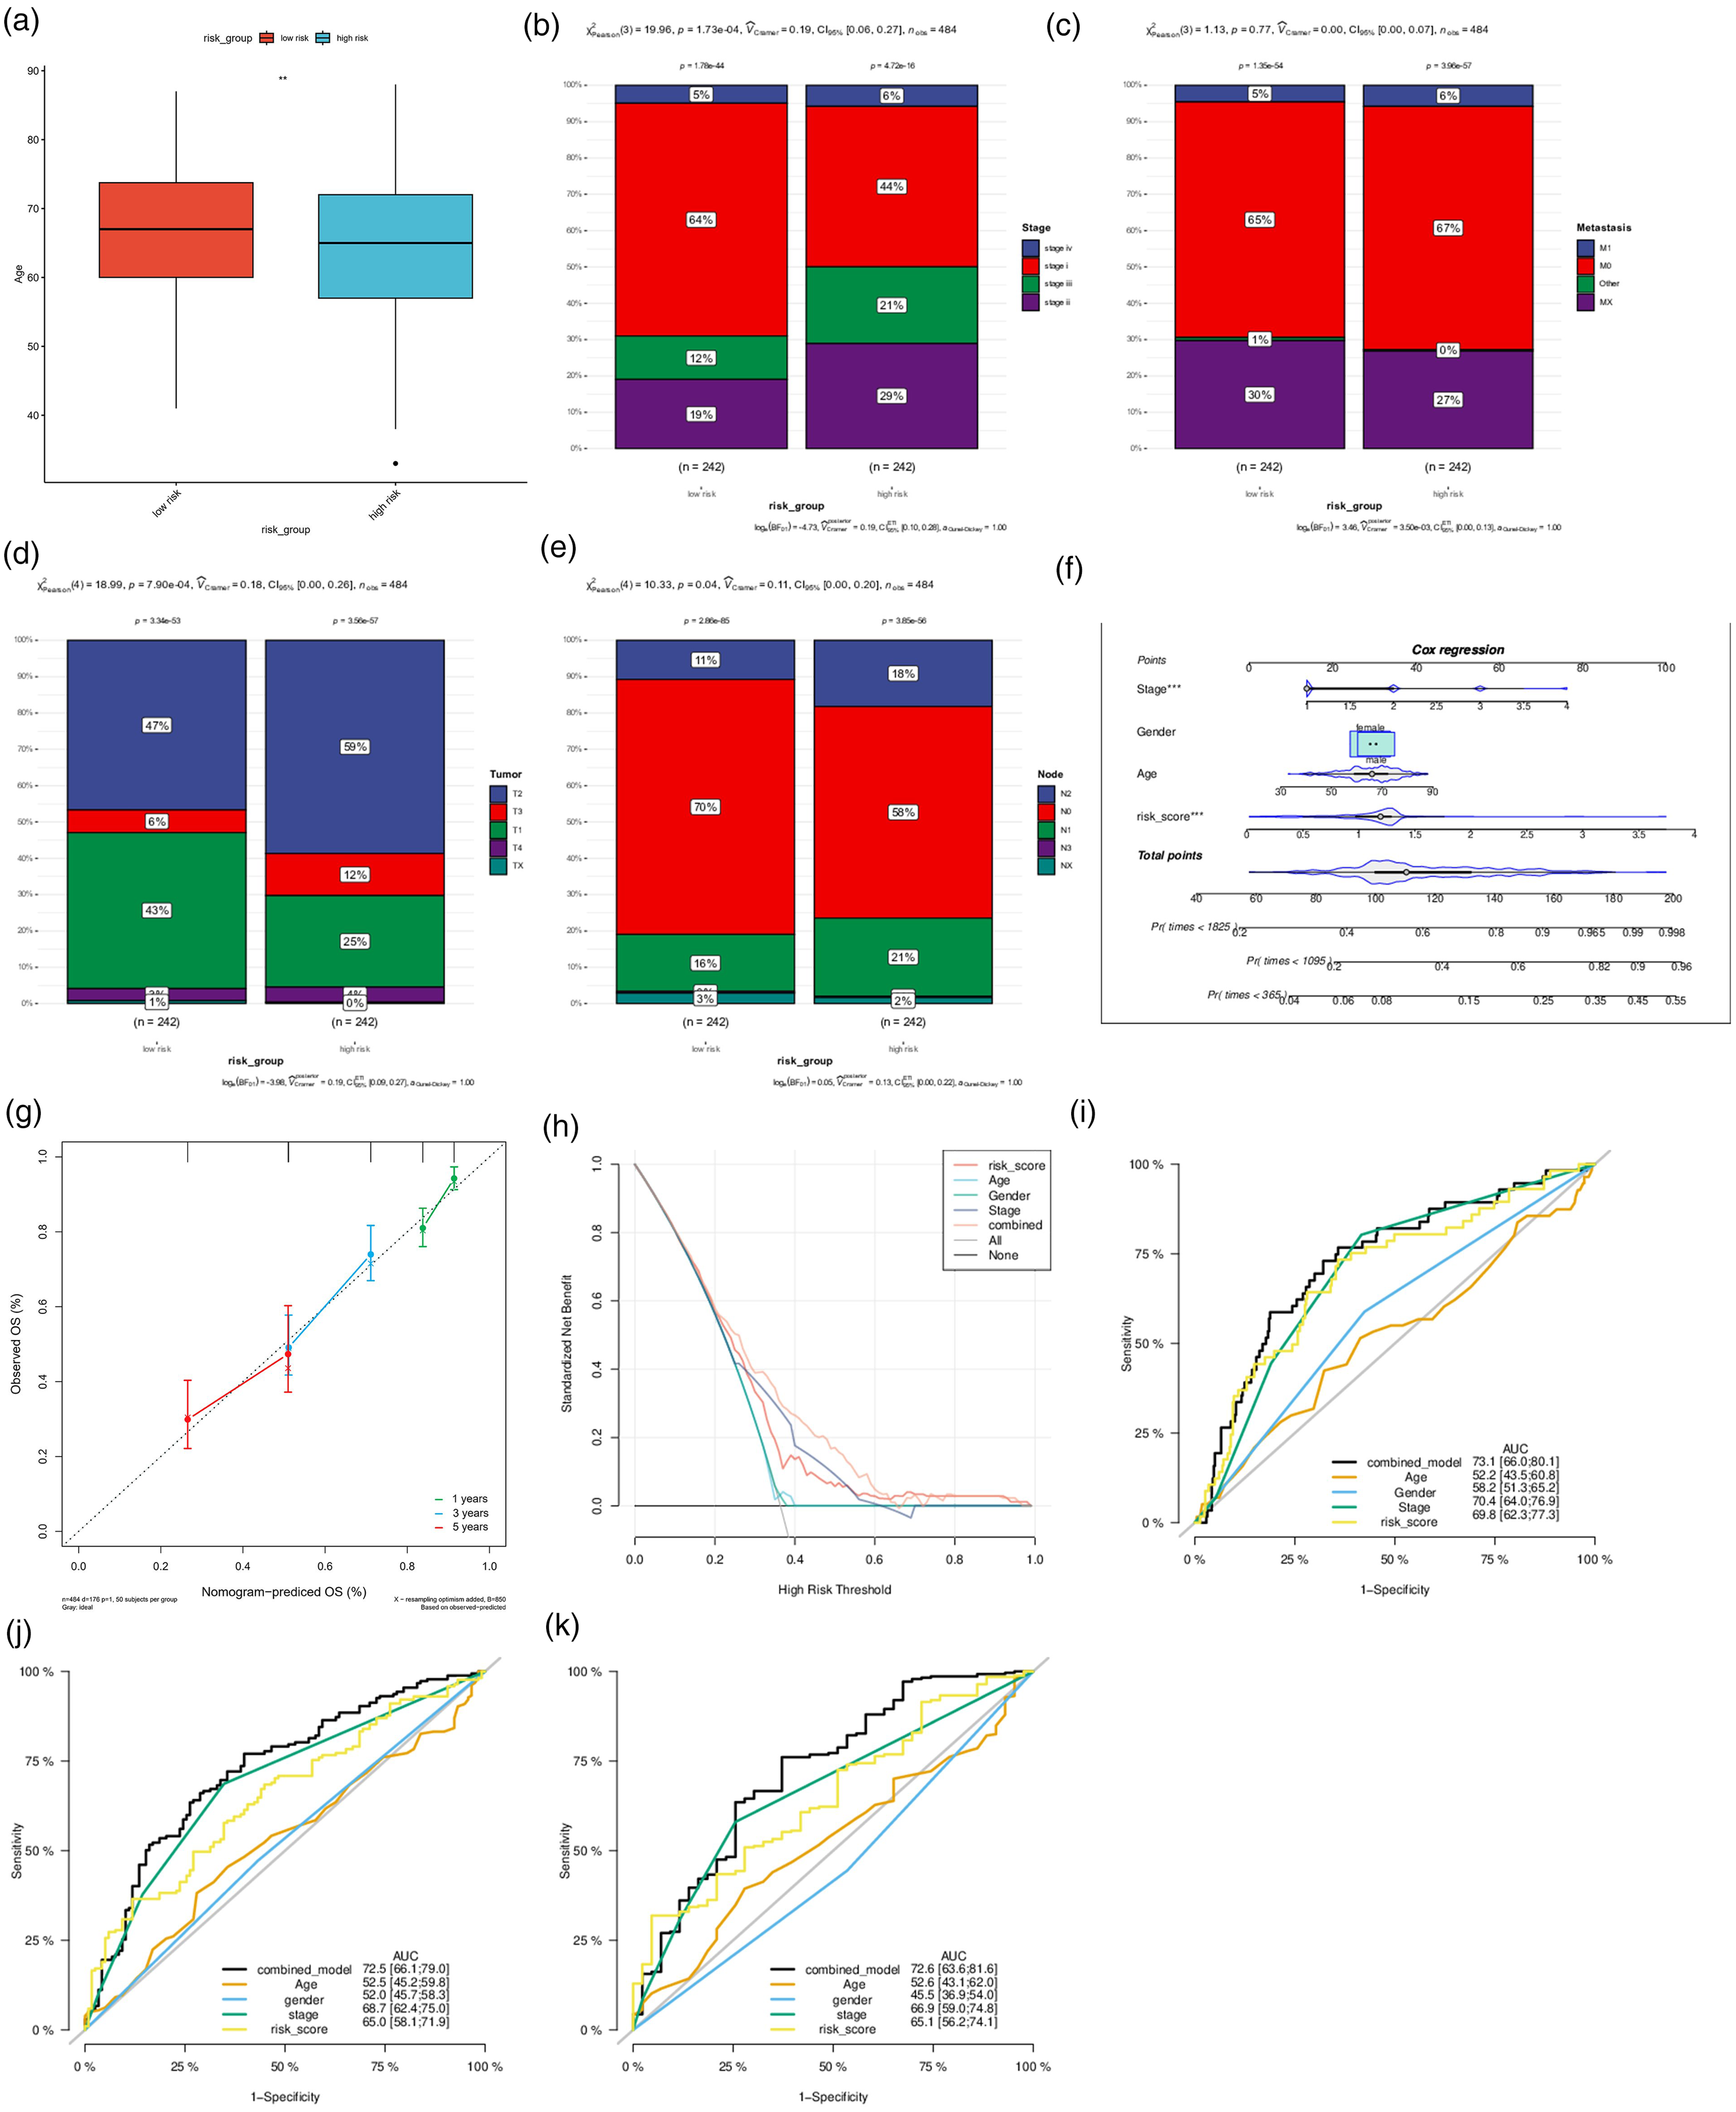
Subgroup analysis of clinical characteristics and construction of a nomogram. (a) The patients’ age when diagnosed in the risk groups. The distribution of LUAD patients with (b) different clinical stage, (c) distant metastasis, (d) tumor metastasis, and (e) node metastasis in the risk groups in percentage-staked bar plots. (f) Nomogram combining risk level and other clinical features predicted 1-, 3-, and 5-year overall survival of patients with LUAD. (g) Calibration curve, (h) decision curve, ROC curves for (i) 1-year overall survival, (j) 3-year overall survival, and (k) 5-year overall survival.
As revealed by a nomogram based on gender, age, clinical stage, and risk score, the nomogram could reliably predict the 1-, 3-, and 5-year overall survival of patients with LUAD, suggesting that the risk score is an essential predictive factor for overall survival (Figure 3(f) and (g)). From the decision curve, patients were noticed to benefit the most from clinical intervention based on the model value LLPS (Figure 3(h)). The diagnostic value of the model was assessed by AUC and it turned out that the AUC values of 1-, 3-, and 5-year overall survival were 0.731, 0.725, and 0.726, respectively, which were robustly higher than those associated with age (AUC = 0.522, 0.525, and 0.526, respectively), gender (AUC = 0.582, 0.520, and 0.455, respectively), tumor stage (AUC = 0.704, 0.687, and 0.669, respectively) and risk score (AUC = 0.698, 0.650, and 0.651, respectively) (Figure 3(i) to (k)), underlining the good and stable diagnostic significance of this model.
Correlation between LLPS and tumor immune landscape, immune checkpoint, and immunotherapy response in LUAD
With the adoption of the CIBERSORT inverse convolution method, the divergence in immune infiltrating cells between the high-risk group and low-risk group was visualized. B cells, monocytes, dendritic cells, M0 macrophages, M1 macrophages, mast cells, neutrophils, natural killer (NK) cells, and T cells prominently differed between the two risk groups (Figure 4(a)), whereas risk values possessed a significant correlation with the other immune cell types except neutrophils (Figure 4(b); Figure S2). At the same time, immune checkpoints including CD28, CD86, CD274 (PD-L1), and PD-1 (PDCD1) expressions were forced in patients with low-risk scores, while no evident alternations on CTLA4 and CD80 expressions were noticed between the risk groups (Figure 4(c) to (h)). According to the ESTIMATE algorithm, immune scores, stromal scores, and estimate scores were declined in the low-risk group compared with the high-risk group (Figure 4(1) to (K)).
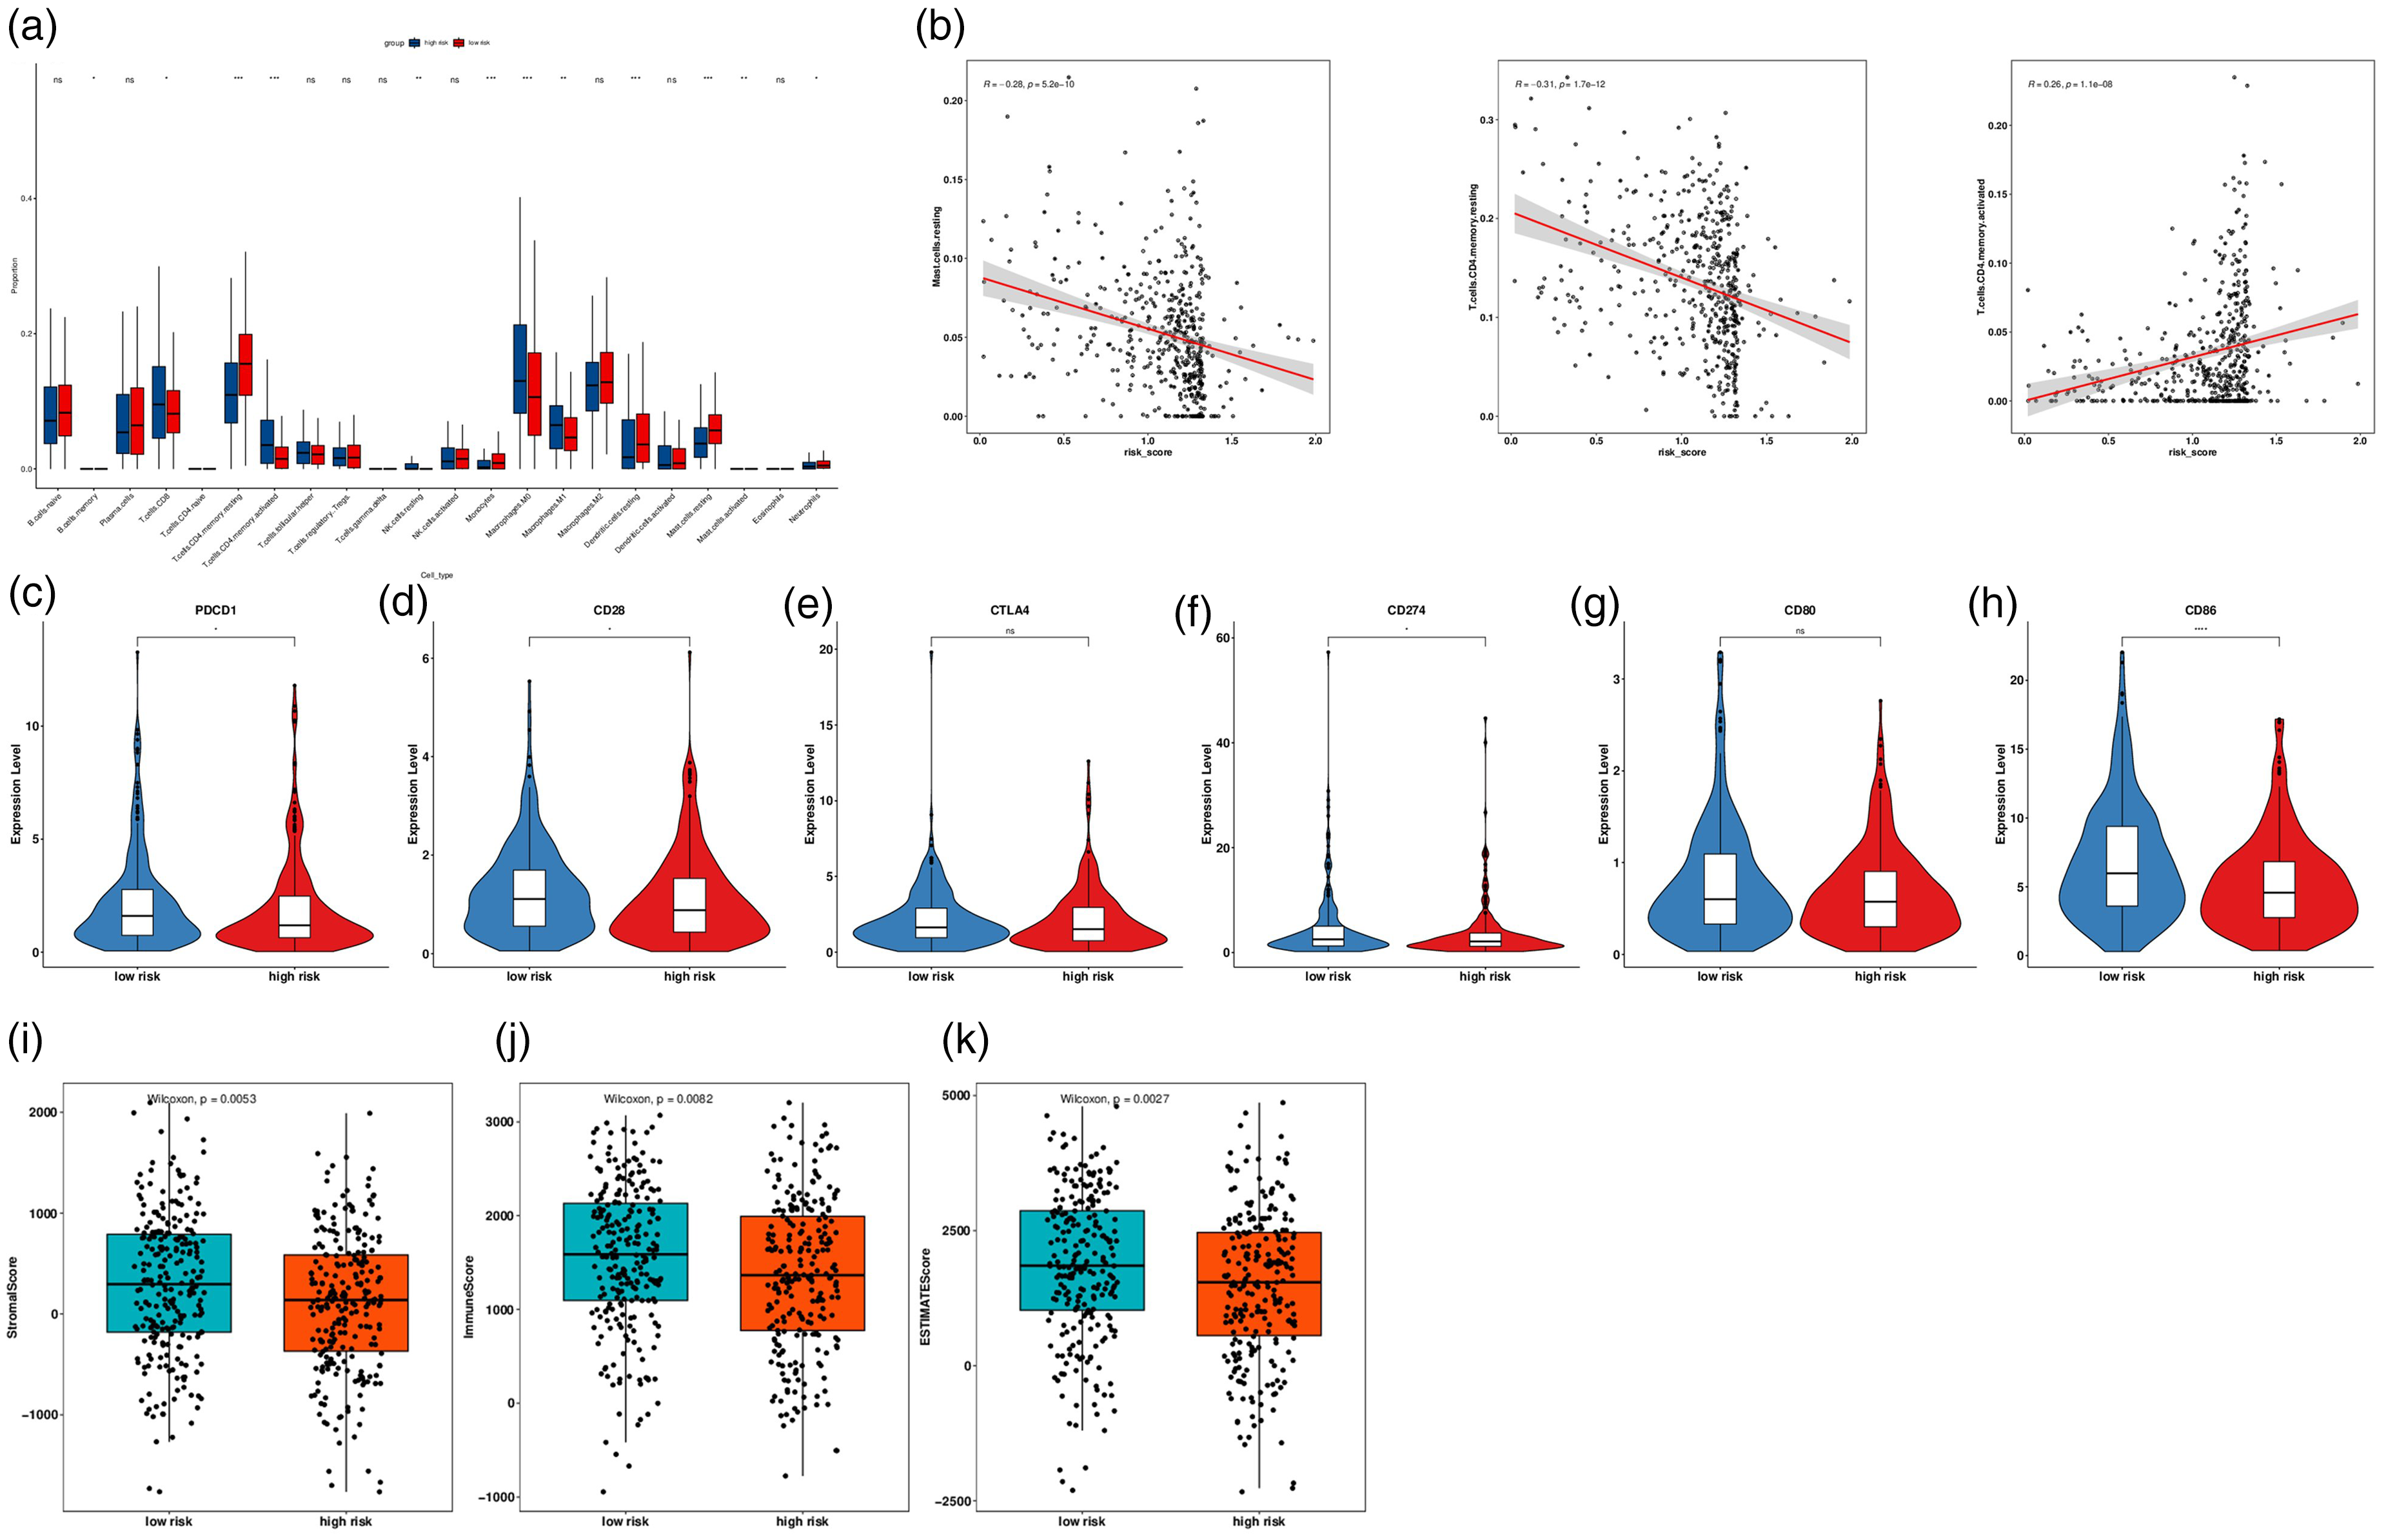
Correlation between LLPS and tumor immune landscape, immune checkpoint, and immunotherapy response in LUAD. (a) The proportional differences of specific 22 immune fractions in risk groups in the stacked bar chart. (b) Correlation analysis of the most significant immune cell types and risk index. The expression of immune checkpoints (c) PDCD1, (d) CD28, (e) CTLA4, (f) CD274, (g) CD80, and (h) CD86 in different risk groups in the Violin chart. (i) ESTIMATE score of stromal cells. (j) ESTIMATE score of immune cells. (k) ESTIMATE score.
Functional enrichment analysis and correlation between LLPS and drug responsiveness in LUAD
Functionally, GSVA was implemented to specify the abundant GO terms and KEGG pathways to determine the possible pathways connected with the risk level in LUAD. As a result, a total of 3338 GO terms in the BP category and 95 KEGG pathways profoundly differed between the high-risk group and low risk-group (P<0.05). The partial top results were portrayed in Figure 5(a) and (b). GO terms in the BP category including phagocytosis, actin polymerization dependent cell motility, core promoter binding, connective tissue replacement involved in inflammatory response wound healing, wound healing involved in inflammatory response, antibody-dependent cellular cytotoxicity, mitochondrial ATP synthesis coupled electron transport, vitamin biosynthetic process, NK cell chemotaxis, immune complex clearance, AMP salvage, type II hypersensitivity, DNA helicase activity, DTTP metabolic process, peptidyl lysine oxidation, response to tumor cell, myeloid dendritic cell activation, protein localization to CENP-A containing chromatin, and KEGG pathways including pathogenic Escherichia coli infection, proteasome, toll-like receptor signaling pathway, chemokine signaling pathway, cytokine-cytokine receptor interaction, Nod-like receptor signaling pathway, NK cell mediated cytotoxicity, B cell receptor signaling pathway, leishmania infection, glycosphingolipid biosynthesis globo series, cell cycle, systemic lupus erythematosus, primary immunodeficiency, hepatopoietic cell lineage, DNA replication, intestinal immune network for immunoglobulin A production, graft versus host disease, type Ⅰ diabetes mellitus, ribosome, allograft rejection were up-regulated in the high-risk group.
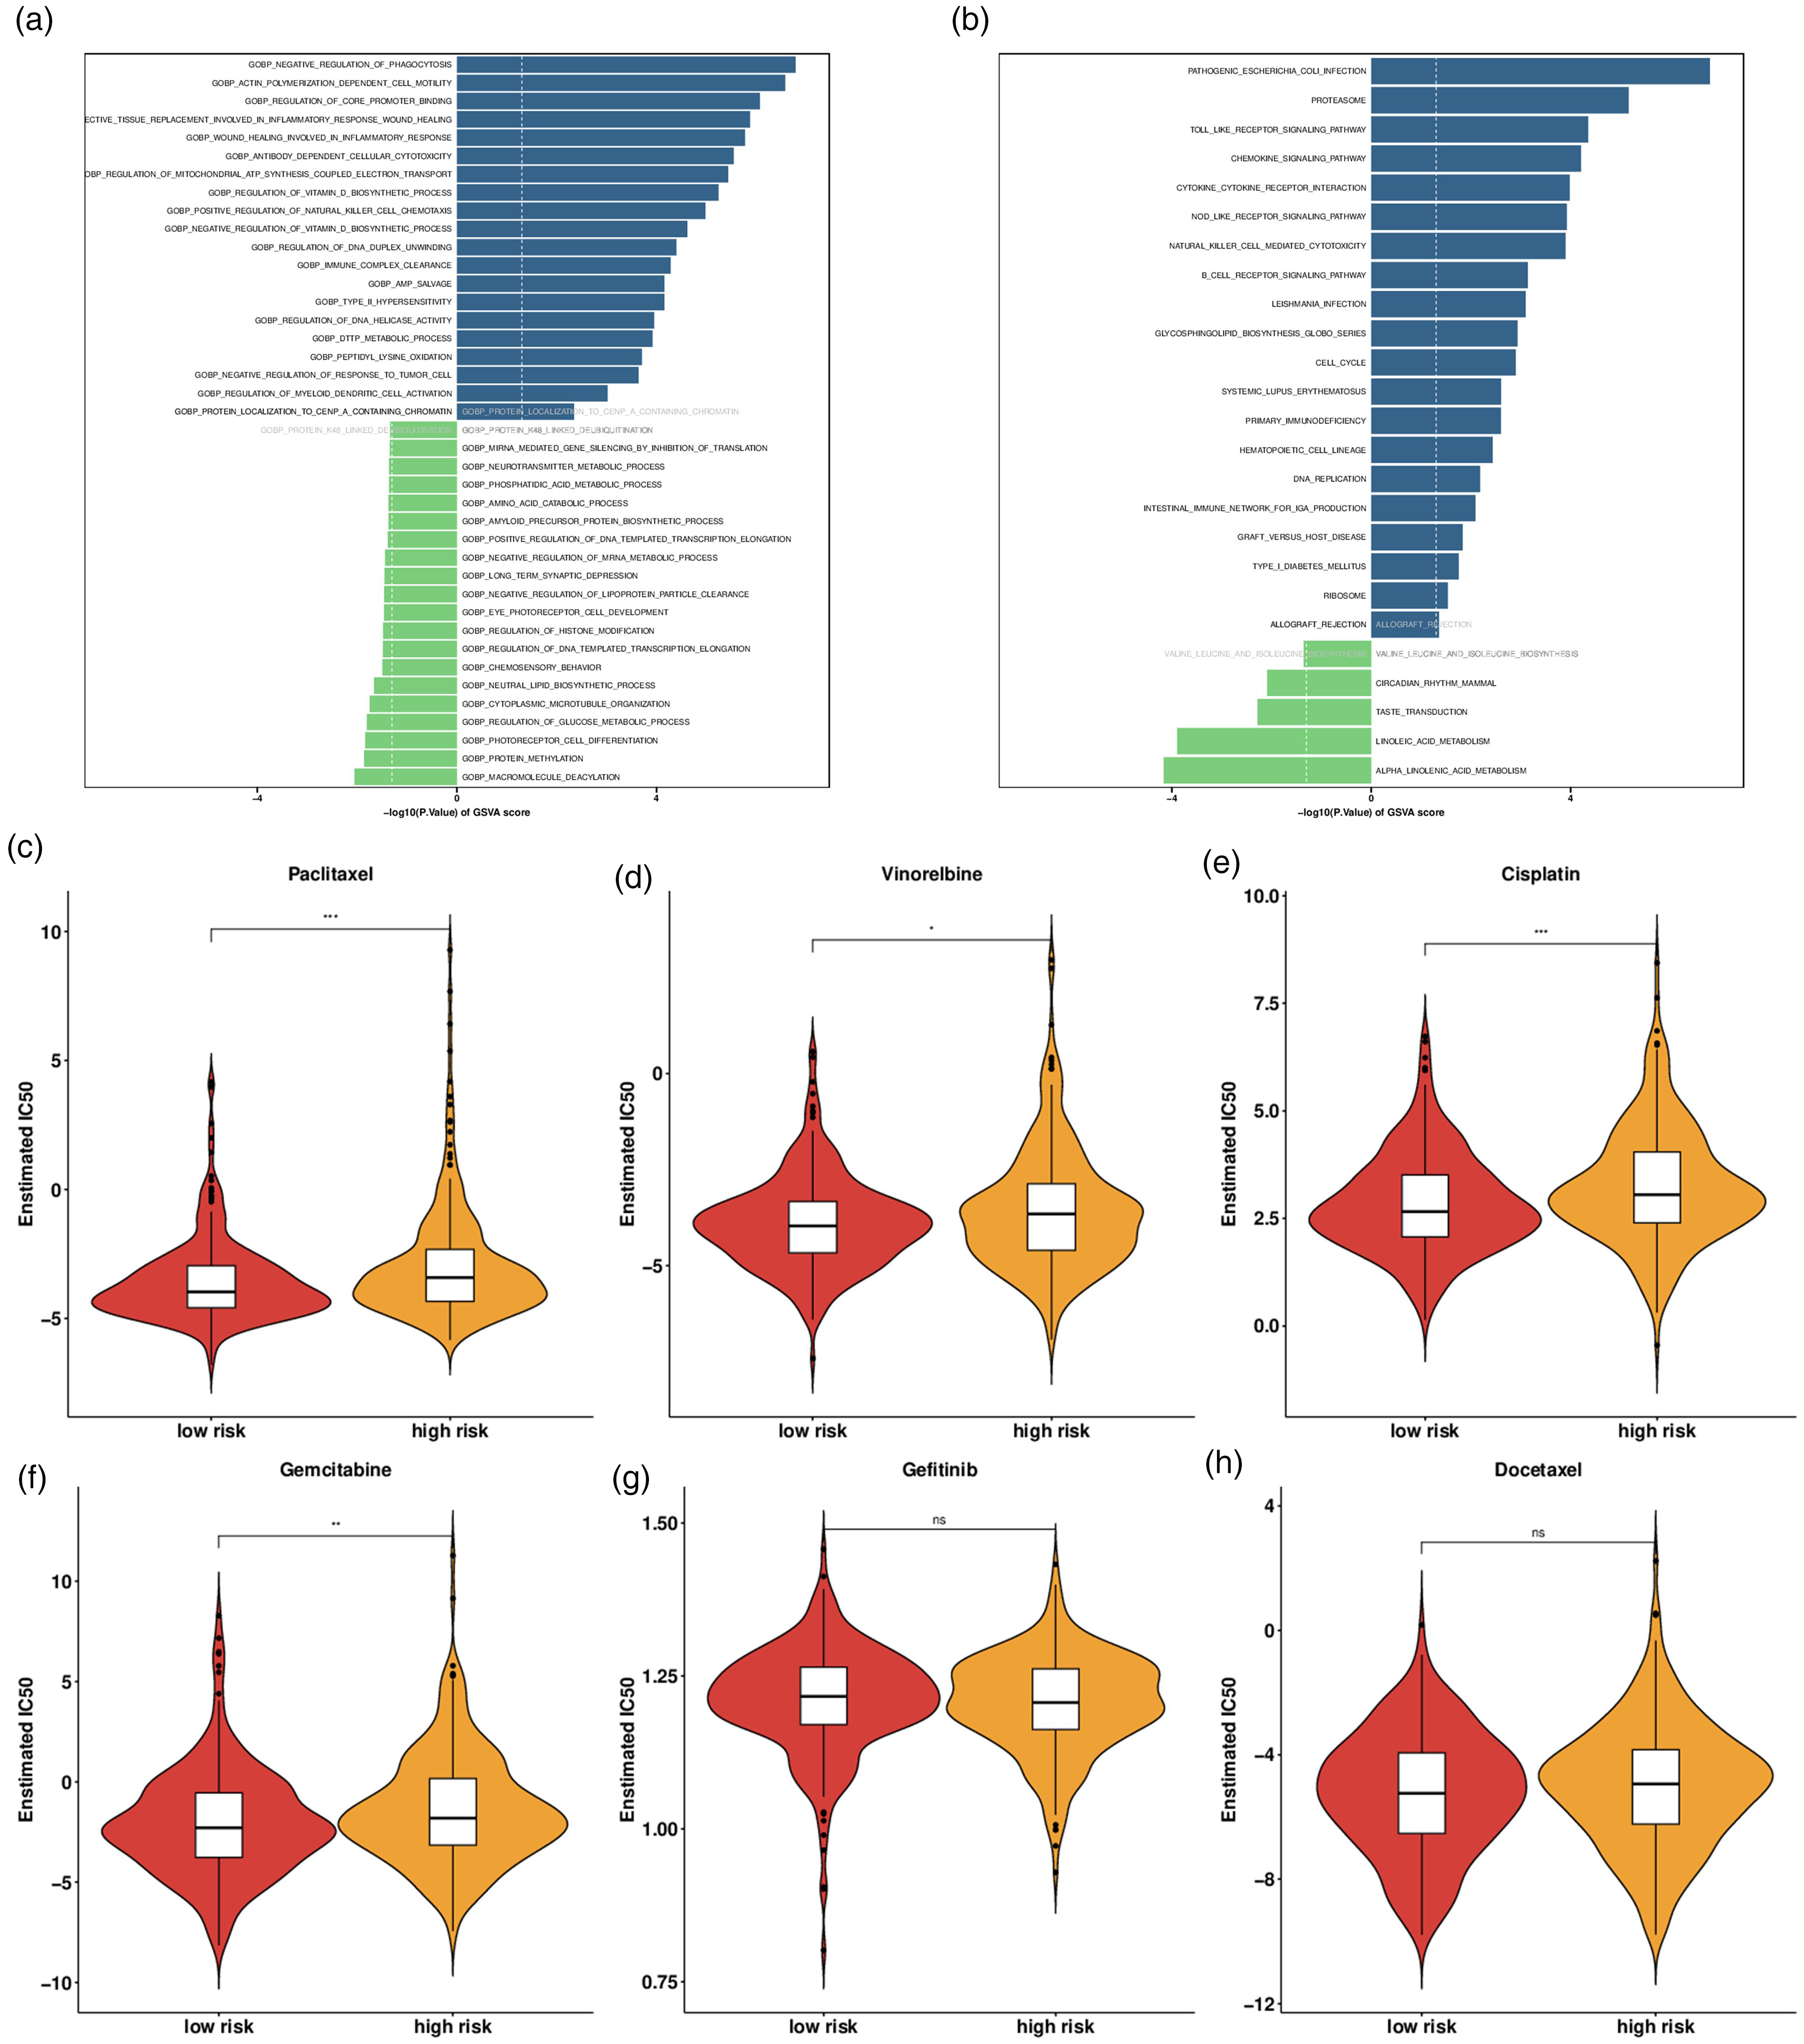
Functional enrichment analysis and drug responsiveness analysis in LUAD. (a) GO enrichment analysis. (b) KEGG enrichment analysis. The response to (c) paclitaxel, (d) vinorelbine, (e) cisplatin, (f) gemcitabine, (g) gefitinib, and (h) docetaxel in different risk groups.
With the purpose of screening the potentially effective anti-LUAD drugs, the pRRophetic package was employed to estimate the reactivity of chemotherapeutic drugs including vinorelbine, gemcitabine, gefitinib, paclitaxel, cisplatin, and docetaxel in the risk groups. The low-risk group was more sensitive to paclitaxel, vinorelbine, gemcitabine and cisplatin than the high-risk group (Figure 5(c) to (h)).
Expression of hub genes in LUAD cells
Through reverse transcription-quantitative polymerase chain reaction (RT-qPCR), it was discovered that compared with HBE cell line, CRTAC1 expression was significantly decreased in LUAD cell lines including A549, H1975, and H1793. GRIA1 expression was elevated in A549 cells while it declined in H1793 cells. MAGEA4 expression was increased in H1975 cells and MAPK4 was overexpressed in A549 and H1975 cells (Figure S3).
Discussion
As a novel concept for the elaboration of the organization of living cells, LLPS has been known to participate in various biological events including chromatin organization, genomic stability, DNA damage response and repair, transcription, and signal transduction via assembly of numerous membraneless organelles.11,23 In recent years, massive researches have emerged regarding the role of LLPS in tumor formation and advancement, involving diverse cellular processes.14,24,25 Nowadays, evidence is mounting that LLPS may possess non-negligibly prognostic values in cancers, such as hepatocellular carcinoma, 17 breast cancer, 26 endometrial cancer, 18 and ovarian cancer. 27 Importantly, LLPS may contribute to the development of targeted therapy and LLPS-based drug delivery systems in lung cancer. 20 In particular, Zhuge et al. 21 have introduced LLPS as a dependable tool for predicting the prognosis of lung squamous cell carcinoma. However, a specific LLPS-based gene signature has not been generated to predict the outcome of LUAD patients.
In this study, prognostic LLPS-related DEGs were obtained from LLPS-related DEGs in LUAD by the single variable Cox regression and the functional enrichment was preliminarily analyzed. The optimal hub genes were selected from the prognostic LLPS-related DEGs to set up the optimized prognosis prediction model by the subsequent LASSO Cox regression analyses with a robust predictive value and low correlation between each other to prevent overfitting—the efficacy of which was also testified combined with the relevant clinical information and gene expression profiles in the training cohort. The newly generated LLPS-related gene signature in LUAD was composed of four genes including glutamate receptor 1 (GRIA1), cartilage acidic protein 1 (CRTAC1), melanoma antigen family A4 (MAGEA4), and mitogen-stimulated protein kinase 4 (MAPK4). Belonging to the α-amino-3-hydroxy-5-methyl-4-isoxazolepropionic acid receptor (AMPAR), a major subtype of ionotropic glutamate receptors in the endogenous nervous system, GRIA1 (also referred to GluR1 or GluA1) has been unsurprisingly supported to aggravate neuronal damage. 28 It is worth noting that GRIA1 has been identified as a potential biomarker for prognosis in bladder cancer 29 and LUAD. 30 CRTAC1, a glycosylated extracellular matrix (ECM) protein of human chondrogenic tissue, has been clarified to suppress cell growth and metastasis in bladder cancer in vitro.31,32 Importantly, CRTAC1 enhances the sensitivity of non-small cell lung cancer to cisplatin. 28 CRTAC1 expression is reduced in LUAD samples and can be identified as a prognostic biomarker for LUAD. 33 MAGEA4, a subtype of melanoma antigen gene family A (MAGEA) family, is a member of cancer/testis antigens (CTAs). The prognostic value of MAGEA4 has been well documented in cancers 34 ; LUAD is also included.35,36 Moreover, MAGEA4 accelerates LUAD cell death. 37 As regard to MAPK4, as an atypical MAPK, MAPK4 is largely demonstrated to produce multifaceted activities in human malignances, such as gastric cancer, 38 glioma, 39 breast cancer, 40 and ovarian cancer 41 . Expectedly, MAPK4 is covered in the prognostic model of LUAD 42 and facilitates LUAD development. 43 Consistently, in the four-LLPS gene risk score prognostic signature, LUAD patients in the high-risk group were discovered to be closely associated with shorter overall survival. Moreover, the risk score was noticed to be strongly linked with age, clinical stage and TNM stage. The nomogram based on clinical information and risk level also implied the accuracy, good clinical value, and good performance in the prediction of LUAD prognosis. All these findings hinted that LUAD patients with a high-risk score should be followed up more frequently and accept more active management than those with a low-risk score, underscoring that LLPS might offer a valuable reference for the personalized management of LUAD patients. Furthermore, in LUAD cells, CRTAC1 was found to be significantly downregulated while GRIA1, MAGEA4, and MAPK4 were highly expressed.
The tumor microenvironment (TME) composed of macrophages, T cells, bone marrow derived inflammatory cells, NK cells, fibroblasts, B cells, extracellular matrix, as well as diversified signaling molecules is widely viewed to be complicated and heterogeneous. 44 The crosstalk among cells is deemed to have a tight link with LUAD invasion, growth, and metastasis; components of the TME can represent biomarkers mediating the detection, treatment, and prognosis of LUAD.45,46 During this study, through comparing the immune landscapes of high- and low-risk populations using the CIBEROST algorithm, a total of 12 immune cell types were found to robustly differ between the two risk groups, among which 11 immune cell types had a significant correlation with risk values except neutrophils. Immune checkpoints are pathways responsible for the maintenance of self-tolerance and assistance with anti-cancer immunity dependent on the release of repressive signals into TME. 47 PD-L1, a ligand for PD-1, is expressed on macrophages, the most important antigen-presenting immune cells, and overexpressing PD-L1 in tumors results in an inhibitory signal that promotes T-cell exhaustion, allowing tumors to escape the immune system. 48 CD86 is a molecule expressed on antigen-presenting cells that provides the costimulatory signals required for T cell activation and survival that can bind to CD28 and regulate T cell activation. 49 Immune checkpoint blockade (ICB) therapy targeting PD-1/PD-L1, CD86, and CD28 has shown durable clinical benefits in NSCLC.50,51 Herein, it appeared that the expressions of immune checkpoints including CD28, CD86, CD274 (PD-L1), and PD-1 (PDCD1) were negatively concerned with risk score. In the context of immunotherapy, it was observed that immune scores, stromal scores, and estimate scores had positive correlation with risk level using the ESTIMATE algorithm. To conclude, LLPS-based gene signature might provide prospective targets for LUAD-specific immunotherapy. Concurrently, via GO and KEGG analyses, the abundant molecular and biological pathways were displayed. It turned out that signaling pathways related to immune response were activated in the high-risk group.
Moreover, immune checkpoint inhibitors can modulate the cytotoxic effect of chemotherapy in LUAD cells. 52 Chemotherapy is a primary therapeutic approach for LUAD and chemotherapy resistance remains a major obstacle in LUAD prognosis. Paclitaxel, vinorelbine, gemcitabine, and cisplatin are commonly used clinical chemotherapeutic agents for lung cancer53–56. From the current bioinformatics data, it was noticed that low risk patients might respond well to paclitaxel, vinorelbine, gemcitabine, and cisplatin in contrast with high-risk patients.
Conclusion
Taken together, our work developed a prognostic classification model for patients with LUAD based on LLPS containing GRIA1, CRTAC1, MAGEA4, and MAPK4 and further ascertained the possible association of risk score with biological functions, immune response, and guide optimal immunotherapy and drug reactivity in LUAD, which might allow for LUAD risk assessment, prognostic classification, and guide optimal immunotherapy and drug therapy. This study also has some limitations. First, the association between the expression pattern of these genes and the prognosis of LUAD patients needs to be explored in clinical samples. Second, the function of the LLPS-based prognostic model still needs to be determined via in vitro and in vivo experiments. Finally, the lack of a specific sample size may lead to bias in the results, and the results may not be generalized to the general population since the samples are not representative enough. A cohort study with a larger sample size will be conducted in the future.
Synopsis
In this study, we determined the prognostic significance of LLPS and its association with immunotherapy and drug sensitivity in LUAD patients. Patients with high risks trended towards worse outcomes. This suggests that the establishment of LLPS may be of great prognostic value to LUAD patients.
Supplemental Material
sj-docx-1-jbm-10.1177_03936155241310887 - Supplemental material for Establishment of liquid–liquid phase separation-related prognostic model in lung adenocarcinoma and systematic analysis of its clinical significance
Supplemental material, sj-docx-1-jbm-10.1177_03936155241310887 for Establishment of liquid–liquid phase separation-related prognostic model in lung adenocarcinoma and systematic analysis of its clinical significance by Yan Chen, Cheng Huang and Wei Wei in The International Journal of Biological Markers
Footnotes
Author contributions
Yan Chen designed the study, and wrote the original paper. Cheng Huang collected and assembled the data and revised the paper. Yan Chen and Wei Wei analyzed and interpreted the data. All authors reviewed the manuscript.
Declaration of conflicting interests
The authors declared no potential conflicts of interest with respect to the research, authorship, and/or publication of this article.
Funding
The authors received no financial support for the research, authorship, and/or publication of this article.
Data available statement
Data will be made available on reasonable request.
Ethics statement
Not applicable.
Supplemental material
Supplemental material for this article is available online.
References
Supplementary Material
Please find the following supplemental material available below.
For Open Access articles published under a Creative Commons License, all supplemental material carries the same license as the article it is associated with.
For non-Open Access articles published, all supplemental material carries a non-exclusive license, and permission requests for re-use of supplemental material or any part of supplemental material shall be sent directly to the copyright owner as specified in the copyright notice associated with the article.