
Abstract
Introduction
Breast cancer is one of the most prevalent types of cancer and a leading cause of cancer-related death among females worldwide. Anoikis, a specific type of apoptosis that is triggered by the loss of anchoring between cells and the native extracellular matrix, plays a vital role in cancer invasion and metastasis. However, studies that focus on the prognostic values of anoikis-related genes (ARGs) in breast cancer are scarce.
Methods
Gene expression data were obtained from The Cancer Genome Atlas (TCGA), Gene Expression Omnibus (GEO), and Molecular Taxonomy of Breast Cancer International Consortium (METABRIC) databases. Five anoikis-related signatures (ARS) were selected from ARGs through univariate Cox regression analysis, LASSO regression analysis, and multivariate Cox regression analysis. Subsequently, an ARGs risk score model was established, and breast cancer patients were divided into high and low risk groups. The correlation between risk groups and overall survival (OS), tumor mutation burden (TMB), tumor microenvironment (TME), stemness, and drug sensitivity were analyzed. Moreover, RT-qPCR was performed to verify the gene expression levels of the five ARS in breast cancer tissues. Furthermore, a nomogram model was constructed based on ARGs risk score and clinicopathological factors.
Results
A novel ARGs risk score model was constructed based on five ARS (CEMIP, LAMB3, CD24, PTK6, and PLK1), and breast cancer patients were divided into high and low risk groups. Correlation analysis showed that the high and low risk groups had different OS, TMB, TME, stemness, and drug sensitivity. Both the ARGs risk score model and the nomogram showed promising prognosis predictive value in breast cancer.
Conclusion
ARS could be used as promising biomarkers for breast cancer prognosis predication and treatment options selection.
Plain Language Summary
Introduction
With gradually increased morbidity and mortality, breast cancer places a heavy burden on women worldwide.1–3 Although certain breakthroughs have been achieved in conventional breast cancer treatment involving surgery, radiation, and chemotherapy, metastasis and recurrence are still the leading causes of poor prognosis in breast cancer patients.4–7 Therefore, comprehensive analysis of the molecular mechanisms and crucial details about cancer metastasis, as well as identification of markers that are related to the prognosis and individualized treatment of breast cancer patients are urgently required.
Anoikis, a specific type of programmed cell death, plays a vital role in tumor progression. 8 Anoikis is activated by the detachment of cells from neighboring cells or from the extracellular matrix (ECM) and then promoting the apoptosis of detached cells through extrinsic (cell surface death receptor-mediated) and intrinsic apoptotic pathways (mitochondrial pro-apoptotic proteins -mediated),8,9 which plays an essential role in maintaining tissue integrity and homeostasis by preventing the attachment of dislodged cells to an unfavorable niche for abnormal survival and proliferation.9–11 Therefore, anoikis is an intrinsic physiological process that inhibits tumor invasion and metastasis. However, detached tumor cells may develop anoikis resistance through multiple signaling pathways such as PI3K-Akt, Wnt/β-catenin, TGF-β/Smad, and NF-κB pathways,12,13 which allow cancer cells to survive under unfavorable anchorage-independent conditions till ultimately secondary tumor formation. Therefore, anoikis resistance is one of the hallmarks of cancer expansion and metastasis.13,14 In this regard, the identification of gene signatures associated with anoikis may be used to predict tumor metastasis, survival and prognosis.
In recent years, an increasing number of anoikis-related genes (ARGs) have been identified to associate with the prognosis of various tumors, including lung cancer, 15 gastric cancer, 16 endometrial cancer, 17 ovarian cancer1 18 and pancreatic cancer, 19 further demonstrating the potential value of ARGs as prognostic biomarkers and therapeutic targets for human cancers. Furthermore, several ARGs risk score models have been constructed and evaluated to predict the prognosis of different cancer types like lung adenocarcinoma, 20 glioblastoma, 21 endometrial carcinoma, 22 colorectal cancer, 23 prostate cancer 24 and ovarian cancer. 25 Besides, several studies have demonstrated an association between breast cancer and anoikis,26–29 for example, bone morphogenetic protein 4 (BMP4) enhanced the expression of stem cell genes and anti-apoptotic genes to promote anoikis resistance and chemoresistance in MDA-MB-231 triple-negative breast cancer cell. 28 Interleukin 17A (IL-17A) promotes angiogenic activity, modulates the immune landscape, and enhances anoikis resistance to favor cancer metastasis. 29 However, these studies mainly focused on single or few ARGs in breast cancer.26,27,30,31 Studies that focus on the prognostic values of ARGs in breast cancer are scarce. In addition, the correlation between ARGs and tumor immune microenvironment in breast cancer has not been fully evaluated. Hence, a comprehensive analysis is required to fully investigate and clarify the potential relationship between ARGs and the prognosis of breast cancer, and additional efforts are needed to construct multi-gene models for the prediction and treatment of breast cancer.
In this study, we first identified differentially expressed ARGs between normal and breast cancer tissues. Secondly, five anoikis-related signatures (ARS) were selected and the ARGs risk score model was established and evaluated based on the expression of these ARS (CEMIP, LAMB3, CD24, PTK6, and PLK1), GSE20685 and METABRIC datasets were used as the external validation sets to verify the robustness of the model, then breast cancer patients were divided into high and low risk groups according to their risk score, we showed the association between ARGs risk score and overall survival (OS), tumor mutation burden (TMB), tumor microenvironment (TME), stemness, and drug sensitivity in breast cancer. Furthermore, three breast cancer subtypes were identified based on the expression of ARS, and we performed the comparisons of TMB, drug sensitivity, and stemness among breast cancer subtypes. Moreover, a nomogram model was constructed based on ARGs risk score and clinicopathological factors, decision curve analysis (DCA) and calibration curves validated the clinical predictive capacity and reliability of nomogram model. Collectively, anoikis-related gene signatures could be used as promising biomarkers for prognostic prediction and individualized treatment of breast cancer patients.
Methods
This study was approved by the medical ethics review committee of Harbin Medical University Cancer Hospital (150 Haping Road, Harbin 150081, China) on July 13, 2022, with the approval number KY2022-23. Informed consent was acquired from patients. The reporting of this study conforms to REMARK guidelines. 32
Data Collection and Preprocessing
The RNA-seq data and corresponding clinical information of breast invasive carcinoma (BRCA) were obtained from The Cancer Genome Atlas (TCGA, https://portal.gdc.cancer.gov/) database to construct the risk model, which includes 113 normal tissues and 1118 tumor tissues. Gene expression profiles were converted to transcripts per million (TPM) through Strawberry Perl software, and then log2-transformation for normalization. In addition, the gene expression profiles of the external validation cohort data were downloaded from the Gene Expression Omnibus (GEO) and Molecular Taxonomy of Breast Cancer International Consortium (METABRIC) databases. The gene expression and clinical information of GSE20685 for 327 breast cancer patients were downloaded from the GEO (https://www.ncbi.nlm.nih.gov/geo/) database, the probes were converted into gene symbols according to the corresponding platform annotation file. The gene expression and clinical information of 1980 breast cancer patients were downloaded from the METABRIC database through cBioPortal (https://www.cbioportal.org/). Somatic mutation data of breast invasive carcinoma (BRCA) were obtained from TCGA, copy number variation (CNV) was collected from UCSC Xena data portal (https://xena.ucsc.edu/). Strawberry Perl software (https://www.perl.org/, Version 5.30.0) was used for gene id conversion.
347 anoikis-related protein coding genes were selected from the GeneCards (https://www.genecards.org/) database with a gene relevance score >1.0, and 137 ARGs were identified from Harmonizome (https://maayanlab.cloud/Harmonizome/) database (Table S1). Finally, a total of 366 merged ARGs were included in the analysis (Table S1, Figure S1a). By using the “limma” R package, the differentially expressed ARGs between normal and breast cancer tissues in TCGA were identified with screening criteria of false discovery rate (FDR) < 0.05 and absolute log2 fold-change > 1. Furthermore, heatmap and volcano plot were generated by the “pheatmap” R package to visualize these differentially expressed ARGs. The gene ontology (GO) enrichment analysis and Kyoto Encyclopedia of Genes and Genomes (KEGG) pathway enrichment analysis were also performed using the “clusterProfiler” R package to clarify the potential biological mechanism and functions of these differentially expressed ARGs.
Establishment and Evaluation of ARGs Risk Score Model Based on Differentially Expressed Genes
Firstly, Univariate Cox regression analysis of differentially expressed ARGs was performed to identify the OS-associated genes in TCGA-BRCA dataset. Meanwhile, we constructed an interaction network map of these OS-associated ARGs. Additionally, we used “maftools” R package 33 to analyze the somatic mutation data and used “RCircos” R package 34 to analyze the CNV data of these OS-associated ARGs. Then, the TCGA-BRCA set was randomly divided into the train and test sets at a ratio of 1:1 (Table S2). Least absolute shrinkage and selection operator (LASSO) regression analysis and multivariate Cox regression analysis were performed in the training cohort to identify ARS. The ARGs risk score was based on the correlation coefficients (Table S3) and the expression levels of the ARS. The calculation formula of risk score model was as follows: Risk score = (0.122790895427633 × expression of CEMIP) + (−0.100485553572218 × expression of LAMB3) + (0.139966046343163 × expression of CD24) + (0.1876362166733 × expression of PTK6) + (0.258418817270052 × expression of PLK1). Subsequently, the median risk score (1.03001614066725) in train set was used as a cut-off to divide patients at the train and test cohorts into high and low risk groups. Moreover, K-M survival analysis was performed to evaluate the prognosis differences between high and low risk groups in train, test and all sets. Time-dependent ROC curves were performed to assess the sensitivity and specificity of the risk score model to predict OS in the train, test and all sets. In our analysis, GSE20685 and METABRIC datasets were used as the external validation sets to verify the robustness of the model. Meanwhile, clinicopathological traits, such as age, gender, T, N and M stage were also taken into account in subgroup studies to verify the effectiveness of our risk score model in predicting prognosis.
Comparison of Tumor Immune Microenvironment, TMB and Stemness Between High and Low Risk Groups
In order to evaluate the differences in immune microenvironment between high and low risk groups. ESTIMATE algorithm 35 was applied to quantify the immune score, stromal score and ESTIMATE score. CIBERSORT algorithm 36 was utilized to assess the infiltration levels of 22 types of immune cells. In addition, we used “maftools” R package to analyze the somatic mutation data between high and low risk groups, K-M survival analysis was performed to evaluate the prognosis differences between high and low TMB subgroups. Besides, stemness was assessed through the mRNA expression–based stemness index.
Analysis of Drug Sensitivity Among High and Low Risk Groups
The sensitivity of chemotherapy and targeted therapy agents, as well as some small-molecule inhibitors, were assessed among high and low risk groups in breast cancer by using “oncoPredict” R package. 37 In addition, we conducted Tumor Immune Dysfunction and Exclusion (TIDE) analysis (https://tide.dfci.harvard.edu/) to evaluate which group of patients in the high and low risk groups may benefit from immunotherapy.
Identification of Breast Cancer Subtypes
We constructed a consensus matrix (k = 3) using the “ConsensusClusterPlus” R package 38 and separate breast cancer patients into three subtypes (ARGcluster A-C) based on the expression of ARS. T-distributed stochastic neighbor embedding (t-SNE) analysis and Uniform Manifold Approximation and Projection (UAMP) analysis were utilized to validate the distribution of different clusters through the “Rtsne” R package and “umap” R package. Kaplan-Meier (K-M) survival analysis using the “survival” and “survminer” R packages was performed to illustrate the prognosis differences between ARGcluster A-C. Furthermore, the comparisons of TMB, drug sensitivity, and stemness among breast cancer subtypes were performed through the “ggplot2” R package and “ggpubr” R package. In addition, we quantified the immune infiltration of 23 types of immune cells and the immune score of 13 immune-related pathways among different breast cancer subtypes using the single-sample gene set enrichment analysis (ssGSEA) 39 with the “GSVA” R package.
Construction and Validation of the Nomogram Containing the ARGs Risk Model
Univariate Cox regression analysis and multivariate Cox regression analysis were used to identify the independent prognostic factors to predict the overall survival of breast cancer patients among risk score and clinicopathological factors, including age, gender, T stage, N stage, and M stage. Then a clinical predictive nomogram model was established by “rms” R package. Furthermore, the clinical predictive capacity and reliability were validated by decision curve analysis (DCA) and calibration curves.
RT-qPCR Assays
Ten pairs of clinical samples (breast cancer tissues and their adjacent normal tissues) were collected from the Harbin Medical University Cancer Hospital. The total RNA was extracted using TRIzol Reagent (Invitrogen, 15596-026), which was then transcribed into cDNA using the Prime Script RT Reagent Kit (Vazyme, R333-01). The real-time PCR reactions were performed using the SYBR Green Master kit (Roche, 04913914001). The cycle threshold (CT) data were analyzed using the 2−ΔΔct method and normalized to beta-actin. The primer sequences of five ARS used were as follows: CEMIP-f, 5′-CACGGTCTATTCCATCCACATC-3′; CEMIP-r, 5′-GGTTCGCAAAACAATCGGCT-3′; LAMB3-f, 5′-AGCCTCACAACTACTACAG-3′; LAMB3-r, 5′-CCAGGTCTTACCGAAGTCTGA-3′; CD24-f, 5′- CTCCTACCCACGCAGATTTATTC-3′; CD24-r, 5′-AGAGTGAGACCACGAAGAGAC-3′; PTK6-f, 5′- TGCCCCATTGGGATGACTG-3′; PTK6-r, 5′-GTACAGCGCCAGGATGTGTTT -3′; PLK1-f, 5′-GCACAGTGTCAATGCCTCCAAG-3′; PLK1-r, 5′-GCCGTACTTGTCCGAATAGTCC -3′.
Statistical Analysis
Statistical analysis in this study was conducted by the R software (version 4.2.2, https://www.r-project.org) and GraphPad Prism (version 8.0.2). Statistical significance was set at P value < 0.05 (“*” P value <0.05; “**” P value <0.01; “***” P value <0.001; “****” P value <0.0001).
Results
Determination of Differentially Expressed ARGs in Breast Cancer
Initially, to explore the expression traits of ARGs in breast cancer, we collected the gene expression data of 113 normal tissues and 1118 tumor tissues from the TCGA-BRCA database. Among 366 ARGs included in this study (Table S1, Figure S1a), 106 differentially expressed ARGs were identified between normal and breast cancer tissues. Furthermore, a heatmap (Figure 1(A)) and a volcano plot (Figure 1(B)) were generated to visualize these differentially expressed ARGs. In addition, we performed GO and KEGG pathway functional enrichment analysis to clarify the potential biological mechanism and functions of these differentially expressed ARGs. KEGG analysis demonstrated that these genes were mainly enriched in pathways including Focal adhesion, PI3K-Akt signaling pathway, Ras signaling pathway, HIF-1 signaling pathway, and ECM-receptor interaction (Figure 1(C)). Moreover, GO analysis identified that these differentially expressed ARGs significantly enriched in several biological processes or cellular components, such as positive regulation of MAPK cascade, epithelial cell proliferation, collagen−containing extracellular matrix, cell−substrate junction, and focal adhesion (Figure 1(D)). Taken together, these results suggested that ARGs may be involved in the proliferation and metastasis of breast cancer. Determination of differentially expressed ARGs in breast cancer. Heatmap (A) and volcano plot (B) of differentially expressed ARGs between breast cancer and normal tissues. (C) KEGG enrichment analysis of differentially expressed ARGs. (D) GO pathway enrichment analysis of differentially expressed ARGs.
Establishment and Evaluation of the ARGs Risk Score Model Based on Differentially Expressed ARGs
To clarify the potential impact of differentially expressed ARGs on the prognosis of breast cancer patients, we performed univariate Cox regression analysis on the differentially expressed ARGs and identified 10 genes associated with overall survival in TCGA-BRCA database, the hazard ratio and P value of these OS-associated ARGs were described in Figure 2(A). Moreover, a network map was constructed to visualize the correlation between these OS-associated ARGs and prognostic value for breast cancer (Figure 2(B)). The results showed that most of the OS-associated ARGs were positively correlated with each other. Meanwhile, we researched the somatic mutation profile of these OS-associated ARGs in breast cancer; mutation data showed that mutation altered in 30 (3.03%) of 991 samples, with LAMB3 exhibiting the highest gene mutation rate (Figure 2(C)). Furthermore, all 10 OS-associated ARGs accompanied with copy number alterations according to the analysis of CNV (Figure 2(D)), LAMB3, PTK6, CD24, CEMIP, SPIB, MAD2L1, PLK1, NTRK2, and EDA2R exhibited widespread CNV frequency gain, whereas only MMP13 exhibited CNV frequency loss (Figure 2(E)). These data indicated that CNV alterations may affect the expression of corresponding genes. Establishment and evaluation of ARGs risk score model based on differentially expressed ARGs. (A) Forest plot shows OS-associated ARGs screened through univariate Cox regression analysis. (B) The interaction network map of OS-associated ARGs. (C) Somatic mutation profile of OS-associated ARGs in breast cancer. (D) The localization and CNV of OS-associated ARGs on 23 chromosomes. (E) CNV frequency of OS-associated ARGs. (F) K-M survival curve analysis, risk score distribution, survival status of patients, and the expression of ARS in TCGA all sets. (G) K-M survival curve analysis, risk score distribution, survival status of patients, and the expression of ARS in TCGA train set. (H) K-M survival curve analysis, risk score distribution, survival status of patients, and the expression of ARS in TCGA test set. (I) K-M survival curve analysis, risk score distribution, survival status of patients, and the expression of ARS in GEO set. (J) K-M survival curve analysis, risk score distribution, survival status of patients, and the expression of ARS in METABRIC set.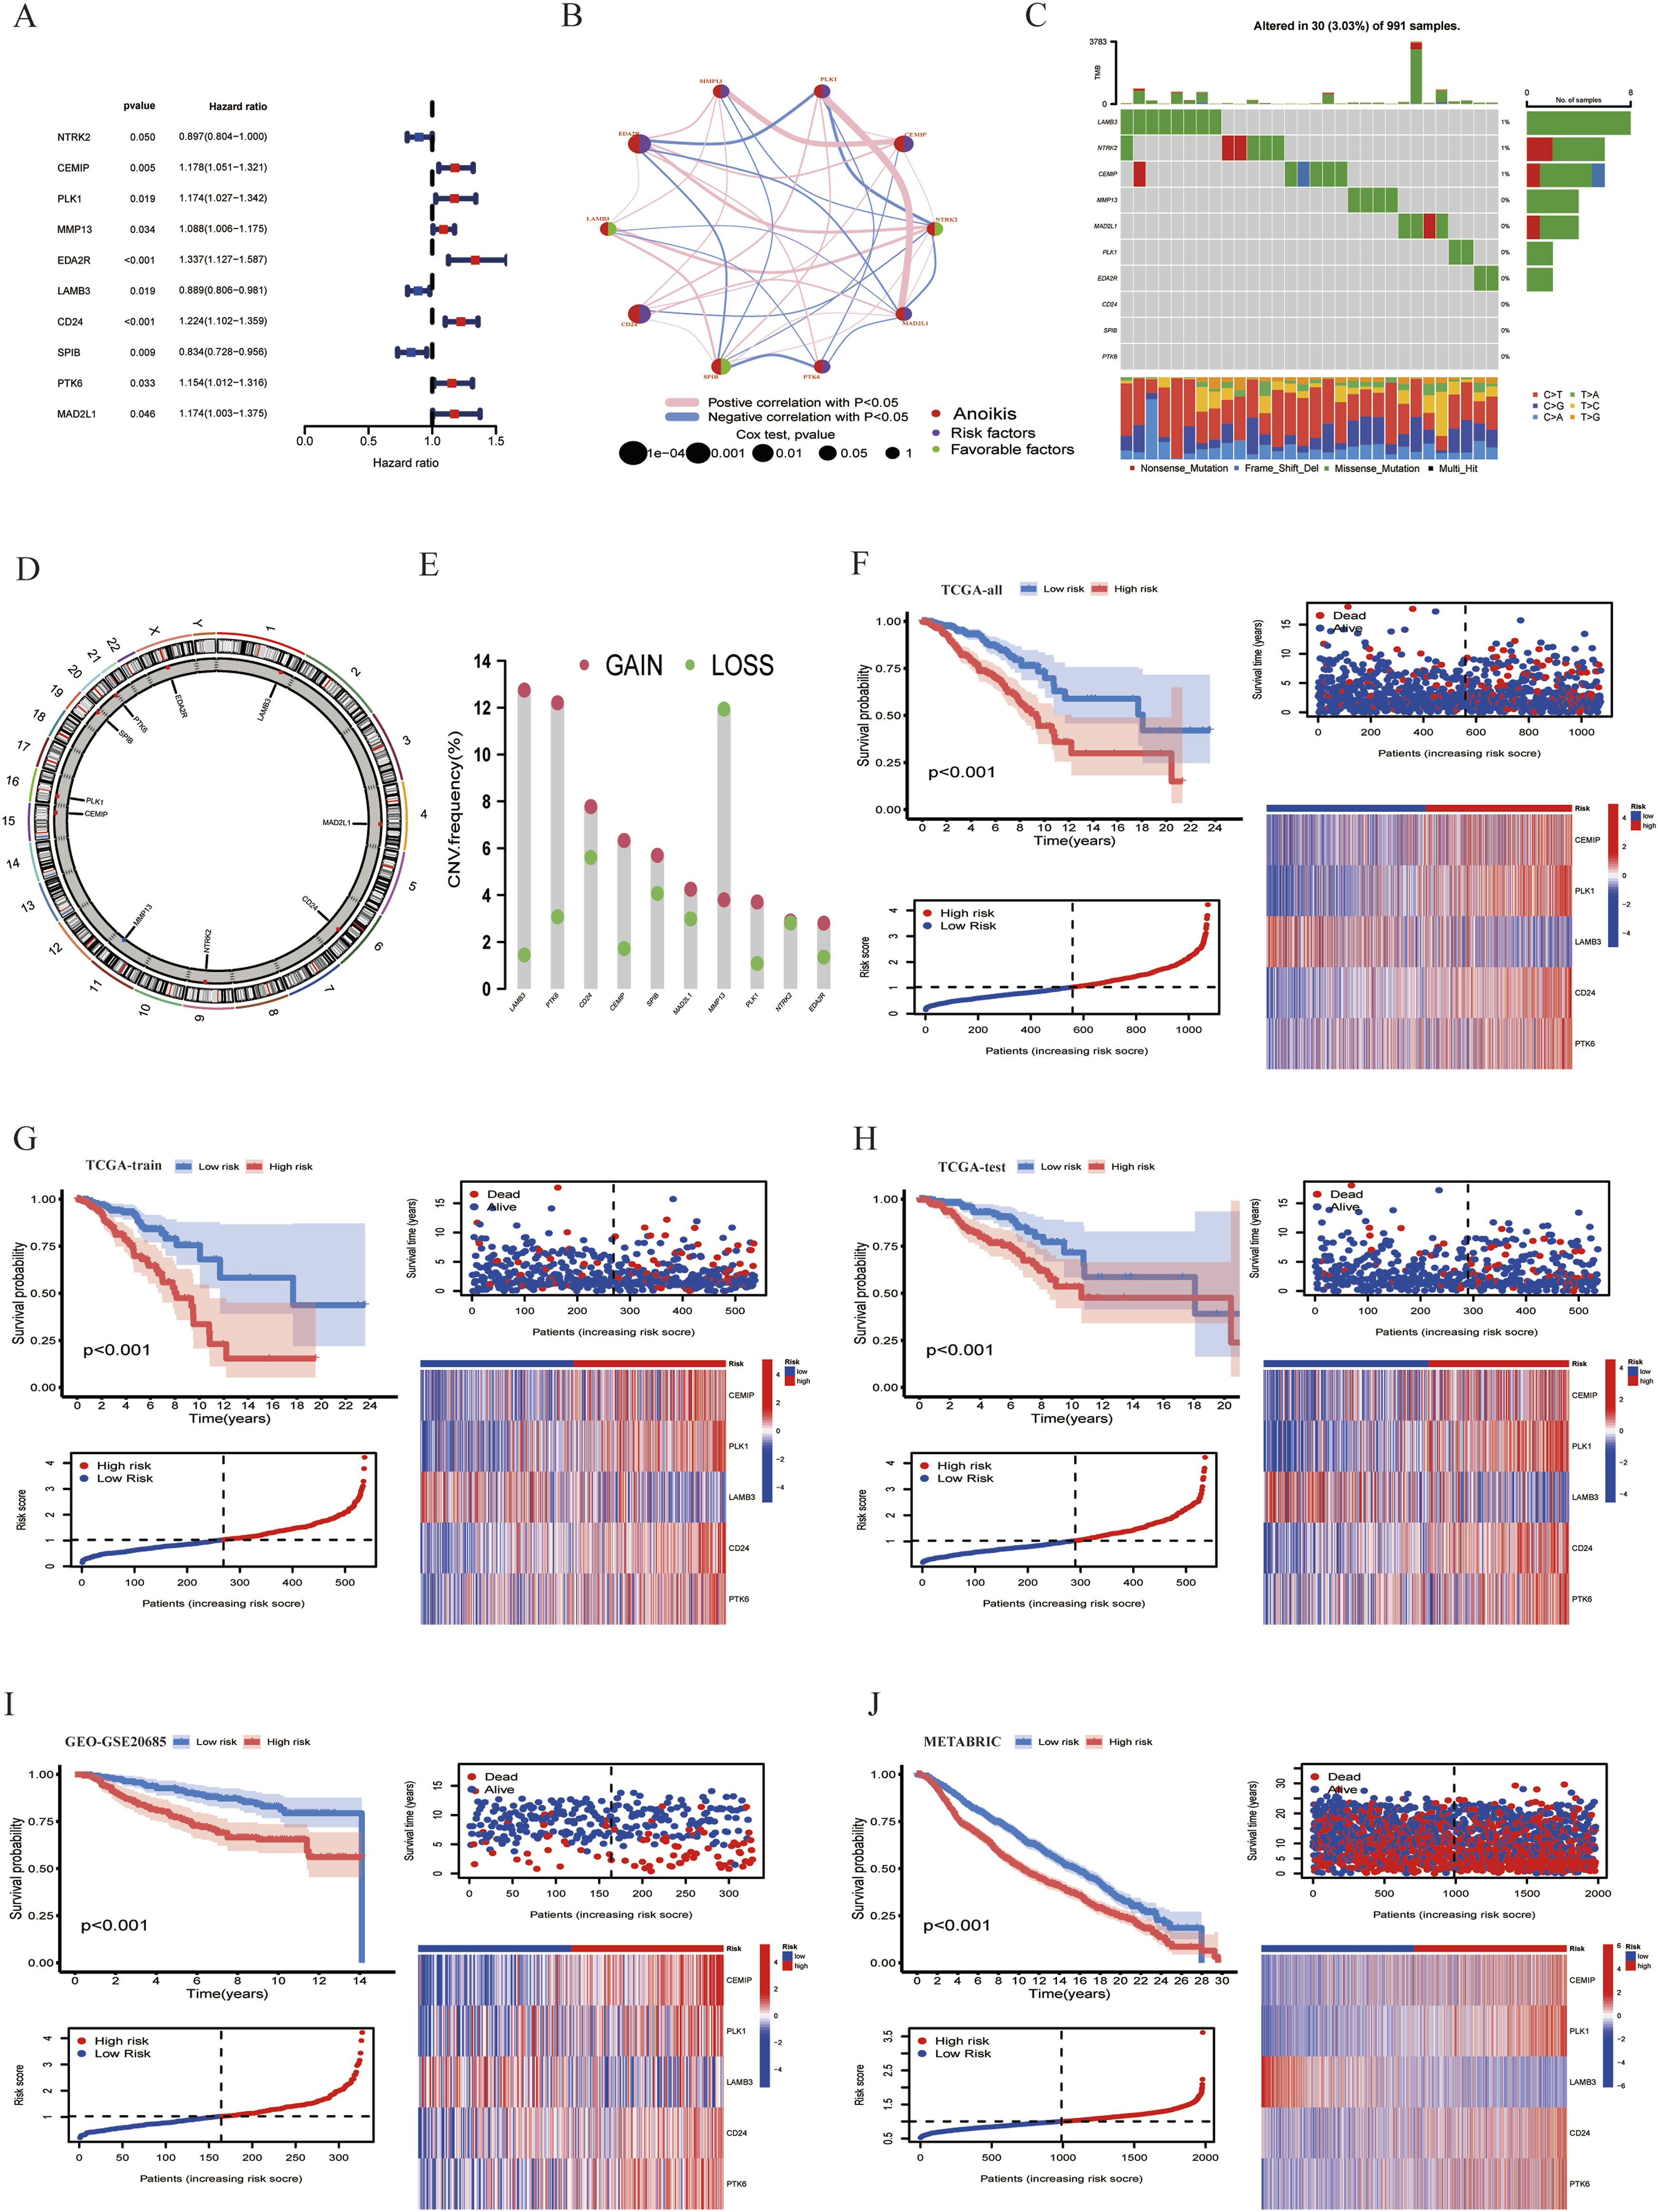
Since previous results have demonstrated that anoikis plays a vital role in the development, progression and prognosis of breast cancer, we hypothesized that an anoikis related risk model could provide an opportunity to predict the prognosis of breast cancer patients. Therefore, the TCGA breast cancer patients were randomly divided into the train and test sets at a ratio of 1:1. And there was no significant difference in clinicopathological traits between the train set and the test set (Table S2). Based on the OS-associated ARGs identified through univariate Cox regression analysis, LASSO regression analysis was performed to reduce model overfitting (Figure S1b). Finally, 5 anoikis-related signatures (ARS) were selected by multivariate Cox regression analysis, namely CEMIP, LAMB3, CD24, PTK6, and PLK1. The ARGs risk score was based on the correlation coefficients (Table S3) and the expression levels of the ARS. Subsequently, the risk scores for each patient were calculated and the median risk score in train set (1.03001614066725) was used as a cut-off to divide patients at the train and test cohorts into high and low risk groups, PCA analysis showed that high and low risk groups were well separated in train and test sets (Figure S1 c-d). Furthermore, K-M survival analysis was performed on train, test and all sets, and the result revealed that patients with breast cancer in the high risk group had a significantly shorter OS compared to the low risk group (Figure 2(F)–(H)). Time-dependent ROC curves and area under the ROC curve (AUC) were performed to assess the sensitivity and specificity of the risk score model to predict OS in the train, test and all sets (Figure S1 e-g), and it was found that the ARGs risk model possessed a satisfactory discriminative performance. Compared with the low risk group, patients in high risk group revealed a higher mortality and expression of CEMIP, CD24, PTK6, and PLK1 in train, test, and all sets (Figure 2(F)–(H)). Furthermore, GSE20685 and METABRIC datasets were used as the external validation sets to verify the robustness of the model, GSE20685 and METABRIC cohorts were categorized into high and low risk groups using the same formula, Consistent with the results of the TCGA dataset, the breast cancer patients in high group combined with a shorter OS (Figure 2(I)–(J), Figure S1 h-i).
In addition, to further verify the effectiveness of our risk score model in predicting prognosis. Clinicopathological traits, such as age, gender, T, N and M stage were also taken into account in subgroup studies, the result showed that except for M1 and MALE subgroups, the survival rate of the high risk group was lower than that of the low risk group in majority breast cancer subgroups (Figure S1j-s). Consequently, promising prognosis predictive value was demonstrated for this ARGs risk score model in breast cancer patients.
Comparison of TME, TMB and Stemness Between High and Low Risk Groups
Previous studies have demonstrated that somatic mutations are associated with tumor development and progression.40–42 Therefore, we analyzed the mutation profile of the top 20 genes with the highest frequency of gene mutations in the high risk and low risk groups (Figure 3(A)–(B)). The results showed that the TMB of the high-risk group was higher than that of the low-risk group (Figure 3(C)) and the risk score was positively correlated with TMB (Figure 3(D)), the mutation rates of the tumor suppressor genes TP53 and PTEN in the high risk group (43% and 5%) is higher than that in the low-risk group (21% and 4%), while the mutation frequency of the oncogene PIK3CA in the high risk group (29%) is lower than that in the low-risk group (38%). In addition, survival analysis showed that the prognosis of the low TMB group was better than that of the high TMB group (Figure 3(E)), and when combined with TMB, the high risk group with high TMB presented the worst prognosis (Figure 3(F)). This suggested that the TMB was related to prognosis, and breast cancer patients with higher TMB and risk score combined with shorter survival. Comparison of TME, TMB and stemness between high and low risk groups. (A) Somatic mutation profile in high risk group. (B) Somatic mutation profile in low risk group. (C) Differences in tumor mutation burden between high-risk and low-risk groups. (D) The correlation between tumor mutation burden and risk score in breast cancer. (E) K-M survival curve analysis the prognosis difference between high and low TMB subgroups. (F) K-M survival curve analysis the prognosis differences between high and low risk groups combined with TMB. (G) ESTIMATE analysis between the high and low risk groups. (H) The correlation between risk score and stromal score in breast cancer. (I) The correlation between risk score and immune score in breast cancer. (J) The correlation between risk score and ESTIMATE score in breast cancer. (K) The relationship between risk score and immune checkpoints. (L) The correlation between the expression of 5 ARS, risk score and immune cell infiltration in breast cancer. (M) CIBERSORT algorithm to analysis the difference of immune cell infiltration between high and low risk groups of breast cancer patients. (N) Differences in stemness index between high-risk and low-risk groups. (O) The association between stemness index and risk score.
Next, we evaluated the differences in immune microenvironment between high and low risk groups. ESTIMATE algorithm was applied to calculate the stromal score, immune score, and ESTIMATE score in high and low risk groups, it was found that high risk group revealed lower stromal score, immune score, and ESTIMATE score compared to low risk group (Figure 3(G)), and ARGs risk score was negatively correlated with stromal score (Figure 3(H)), immune score (Figure 3(I)), and ESTIMATE score (Figure 3(J)) in breast cancer. Given the significant differences in immune score between these two groups, the infiltration levels of 22 types of immune cells were further analyzed through CIBERSORT algorithm to better clarify the immunological landscape. The results showed that the risk score was positively correlated with M2 macrophages, M0 macrophages, Neutrophils, and resting NK cells, while negatively correlated with Plasma cells, resting Mast cells, Eosinophils, activated NK cells, naive B cells, Monocytes, resting Dendritic cells, and CD8 T cells (Figure 3(L), Figure S2). Besides, the association analysis between 5 ARS and the infiltration of immune cells demonstrated that the ARS affects many immune cells (Figure 3(L)). According to our study, the high and low risk groups also differed significantly in the number of immune cells infiltrated, high risk groups exhibited more infiltration of M2 macrophages, M0 macrophages, and resting NK cells, and lower infiltration of naive B cells, Plasma cells, CD8 T cells, resting Dendritic cells, and resting mast cells (Figure 3(M)). Additionally, the risk score was negatively correlated with many immunosuppressive receptors and ligands, such as PD-1, BTLA, TNFSF14, CD200 and CD200R1 according to the analysis of immune checkpoints (Figure 3(K)). These data indicated that the prognostic differences between high and low risk groups may partially result by the differences in their immune microenvironment.
Besides, we analyzed the differences in stemness index between high and low risk groups. It was shown that the stemness index of patients in the high risk group was closer to 1 (Figure 3(N)), and there is a positive correlation between the stemness index and risk score (Figure 3(O)), suggesting that breast cancer cells from high-risk patients exhibit more stem cell characteristics and less differentiation.
In addition, we also assessed the gene expression data of 5 ARS in breast cancer based on TCGA-BRCA database, among them, CEMIP, CD24, PTK6, and PLK1 were highly expressed in cancer tissues than that of the normal tissues, while the expression of LAMB3 was higher in normal tissues (Figure 4(A)). To further validate the expression of these genes, we conducted RT-qPCR analysis in paired tissues from 10 breast cancer patients (Figure 4(B)), and the mRNA expression showed a consistent trend with TCGA database. Furthermore, the correlation of ARS gene expression levels with stemness index, stromal score, immune score, and ESTIMATE score in breast cancer were summarized in Figure 4(C), which suggested that these ARS may regulate tumor progression via modulating of the cell stemness and immune microenvironment. Expression, stemness and immune correlation of 5 ARS in breast cancer. (A) Differential expression of 5 ARS between breast cancer and normal tissues. (B) RT-qPCR validation the mRNA expression of 5 ARS in cancerous tissues and the adjacent normal tissues (n = 10). (C) The correlation of ARS gene expression levels with stemness index, stromal score, immune score, and ESTIMATE score in breast cancer.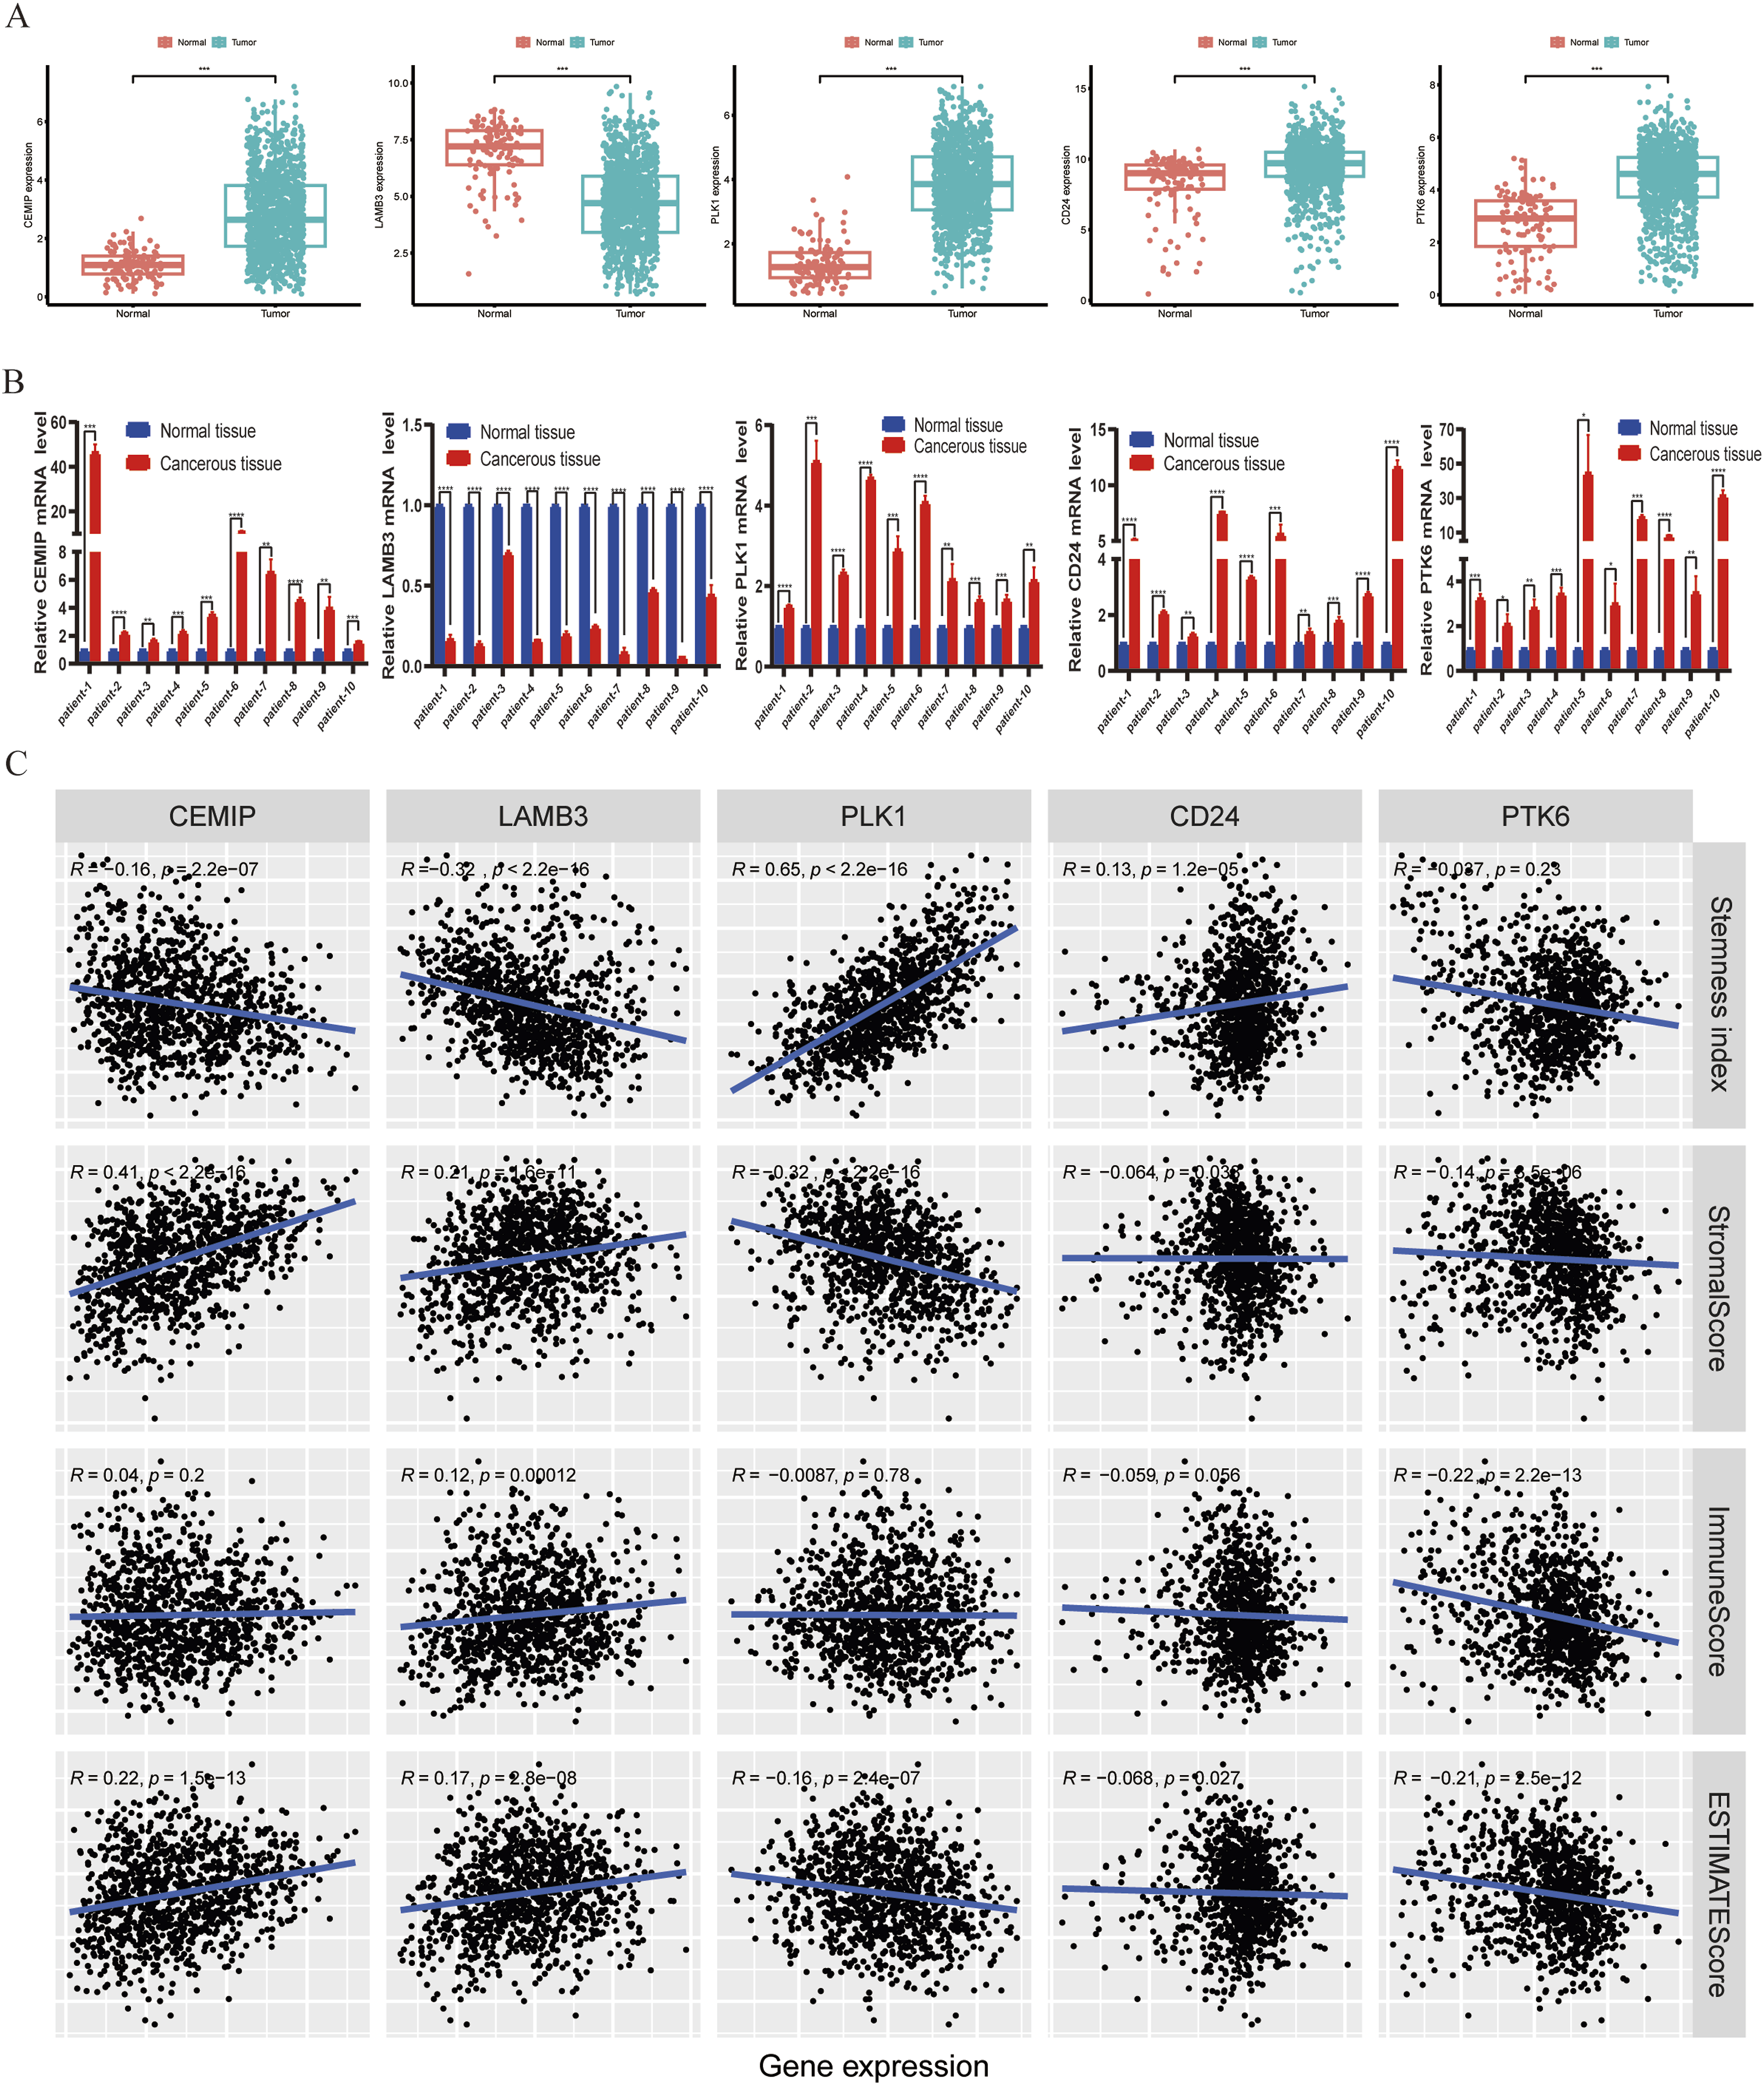
Correlation of Risk Score with Drug Sensitivity and Response to Immunotherapy
To further explore the potential clinical application value of the ARGs risk score model. The sensitivity of chemotherapy and targeted therapy agents, as well as some small-molecule inhibitors, were assessed among high and low risk groups in breast cancer (Table S4). Figure 5 listed the differences in sensitivity between the high and low risk groups to several common drugs currently used to treat breast cancer. Compared with the low risk group, the high-risk group had higher IC50 values and lower sensitivity to a variety of traditional chemotherapy and endocrine therapy drugs, including Tamoxifen (Figure 5(A)), Epirubicin (Figure 5(B)), Oxaliplatin (Figure 5(C)), Docetaxel (Figure 5(D)), and Teniposide (Figure 5(E)). Furthermore, the sensitivity of CDK4/6 inhibitor (including Palbociclib and Ribociclib) and PARP inhibitor Olaparib were decreased in high risk group (Figure 5(F)–(H)). Moreover, the sensitivity of Zoledronate,43–45 which is used in the treatment and prevention of breast cancer with bone metastasis, is also decreased in high risk group (Figure 5(I)). However, the sensitivity of ErbB-2 and EGFR inhibitor, namely Lapatinib and Sapitinib, is higher in high risk group than that in low risk group (Figure 5(J)–(K)). In addition, considering the different immune microenvironment landscapes between high risk and low risk groups, we performed TIDE analysis to evaluate which group of patients may benefit from immunotherapy. The result showed that the patients in the high risk group had a lower TIDE score, indicating that the patients in the high risk group had a lower likelihood of immune escape during immunotherapy and were more likely to benefit from immunotherapy (Figure 5(L)). In general, the ARGs risk score model may assist in making personalized clinical treatment decisions for breast cancer patients. Correlation of risk score with drug sensitivity and response to immunotherapy. (A-K). The relationship between risk score and drug sensitivity. (A) Tamoxifen. (B) Epirubicin. (C) Oxaliplatin. (D) Docetaxel. (E) Teniposide. (F) Palbociclib. (G) Ribociclib. (H) Olaparib. (I) Zoledronate. (J) Lapatinib. (K) Sapitinib. (L) Differences in response to immunotherapy between high-risk and low-risk groups.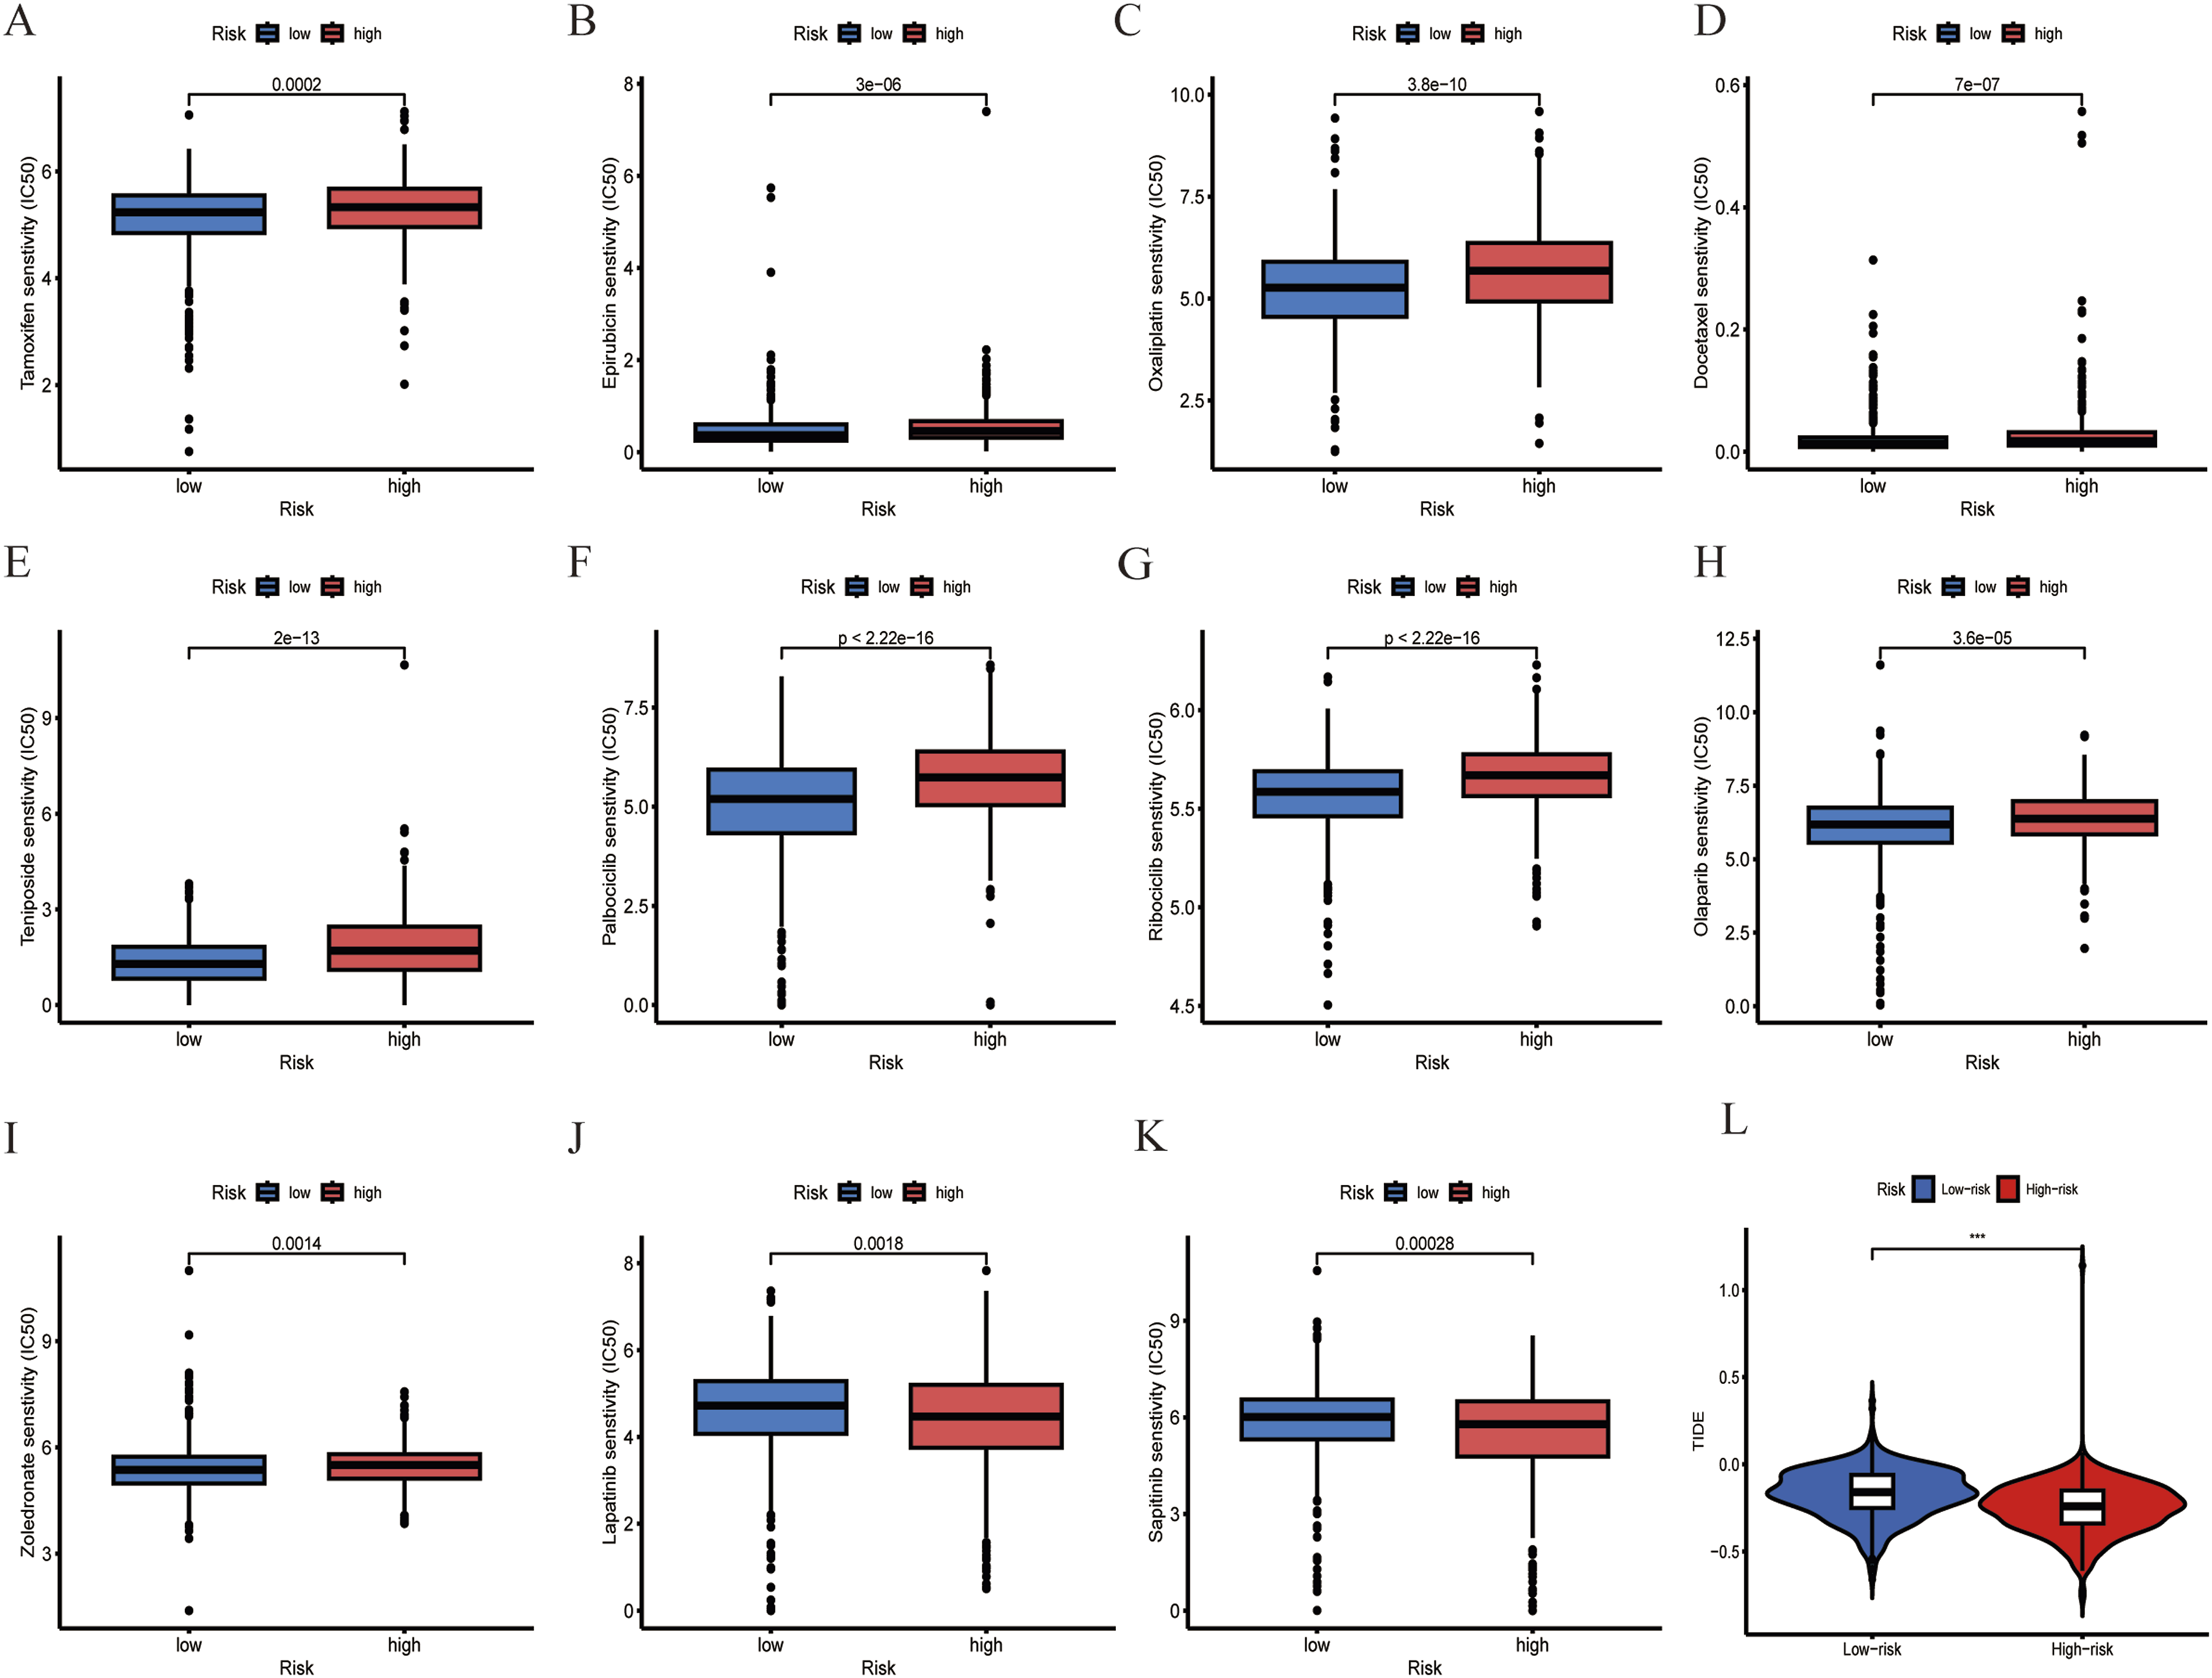
Construction and Validation of the Nomogram Containing the ARGs Risk Model
To further optimize clinical prediction models of breast cancer patients. The risk score and clinicopathological factors, including age, gender, T stage, N stage, and M stage were evaluated through univariate Cox regression analysis (Figure 6(A)) and multivariate Cox regression analysis (Figure 6(B)) to identify the independent prognostic factors to predict the overall survival of breast cancer patients. It was shown that risk score, age, T stage, N stage, and M stage were independent prognostic factors for patients with breast cancer. Then, we constructed a nomogram model based on the above independent prognostic factors to predict the 1-year, 3-year and 5-year survival of breast cancer patients (Figure 6(C)). Furthermore, the clinical predictive capacity and reliability of nomogram were validated by decision curve analysis (DCA) and calibration curve. The calibration curve showed a favourable agreement between the nomogram prediction and actual observation at 1, 3 and 5 years (Figure 6(D)), and DCA results demonstrated that the nomogram provided a higher net benefit at 3, 5, and 8 years compared with other independent prognostic predictors (Figure 6(E)–(G)). In general, satisfactory survival predictive value was indicated for this ARGs risk model and clinical factors integrated nomogram. Construction and validation of the nomogram containing ARGs risk model. (A) Univariate Cox regression analysis of clinicopathological factors and risk score. (B) Multivariate Cox regression analysis of clinicopathological factors and risk score. (C) Nomogram model construction based on independent prognostic factors. (D) Calibration curves of nomogram model at 1, 3, 5 years. (E–G) The DCA assess the net benefit of nomogram and other indicators at 3, 5 and 8 years.
Identification of Breast Cancer Subtypes
To further explore the application of these ARS in subtypes stratification of breast cancer patients, a consensus cluster analysis was performed and identified optimal cluster number (k = 3) exhibiting the highest correlation within the subtypes and weak correlation between subtypes (Figure S3a-j). Consequently, breast cancer patients were divided into three subtypes based on ARS, referred to as ARGcluster A, ARGcluster B, and ARGcluster C, respectively. UAMP and t-SNE analysis showed that three subtypes were well separated (Figure S3k-l). Furthermore, K-M survival analysis showed the survival difference between breast cancer subtypes, survival analysis revealed that ARGcluster A and B has a better prognosis than ARGcluster C (Figure 7(A)), and there was no difference in the survival between ARGcluster A and B (Figure S4a). Comparison of OS between groups with different risk scores in various ARG clusters showed that in both ARGcluster A and C, the survival rate was lower in the high-risk group than in the low-risk group, but there was no significant difference in survival in cluster B, which may have been due to the small number of high-risk patients in cluster B (Figure S4b).The differential expression of ARS between 3 breast cancer subtypes was shown in Figure 7(B). The heatmap visualized the correlation between breast cancer subtypes and ARS or clinicopathological factors (Figure S4c). The Sankey diagram showed the interrelationship between different breast cancer subtypes, risk groups, and clinical status. The patients in ARGcluster A and B were mainly concentrated in low risk group (Figure 7(C)). Moreover, the risk score is the highest in ARGcluster C (Figure 7(D)), which was consistent with their OS profile (Figure 7(A)). In addition, ARGcluster A and B were mainly concentrated in Luminal A (a subtype combined with better prognosis) breast cancer (Figure 7(F)). Besides, our analysis revealed that the TMB and stemness index were higher in ARGcluster C (Figure 7(E) and (G)), which may contribute to the poor prognosis of patients in ARGcluster C. To further analyze the immune microenvironment landscapes of the breast cancer subtypes, the ssGSEA algorithm was used to quantify the immune infiltration of 23 types of immune cells and the immune score of 13 immune-related pathways among different breast cancer subtypes. The results showed that the immune infiltrates in ARGcluster A were generally higher than in ARGcluster B and C, especially for activated B cell, activated Dendritic cells, Macrophage, Natural killer T cell, Type 1 T helper cell, Type 17 T helper cell, and Type 2 T helper cell (Figure S4d). Consistent with this, the immune score of immune-related pathways were prevalently higher in ARGcluster A except for the Type I IFN Response pathway (Figure S4e). Identification of breast cancer subtypes (A). K-M survival analysis between different subtypes in breast cancer. (B). Differential expression of ARS in breast cancer subtypes. (C). The distributions among ARGclusters, risk groups, and clinical status. (D). Differences in risk score between breast cancer subtypes. (E). Differences in tumor mutation burden between breast cancer subtypes. (F). The distributions among ARGclusters and molecular subtypes. (G). Differences in stemness index between breast cancer subtypes. (H-S). The correlation between ARGclusters and drug sensitivity. (H). Docetaxel. (I). Epirubicin. (J). Oxaliplatin. (K). Teniposide. (L). Cyclophosphamide. (M). Fulvestrant. (N). Zoledronate. (O). Palbociclib. (P). Ribociclib. (Q). Olaparib. (R). Lapatinib. (S). Sapitinib.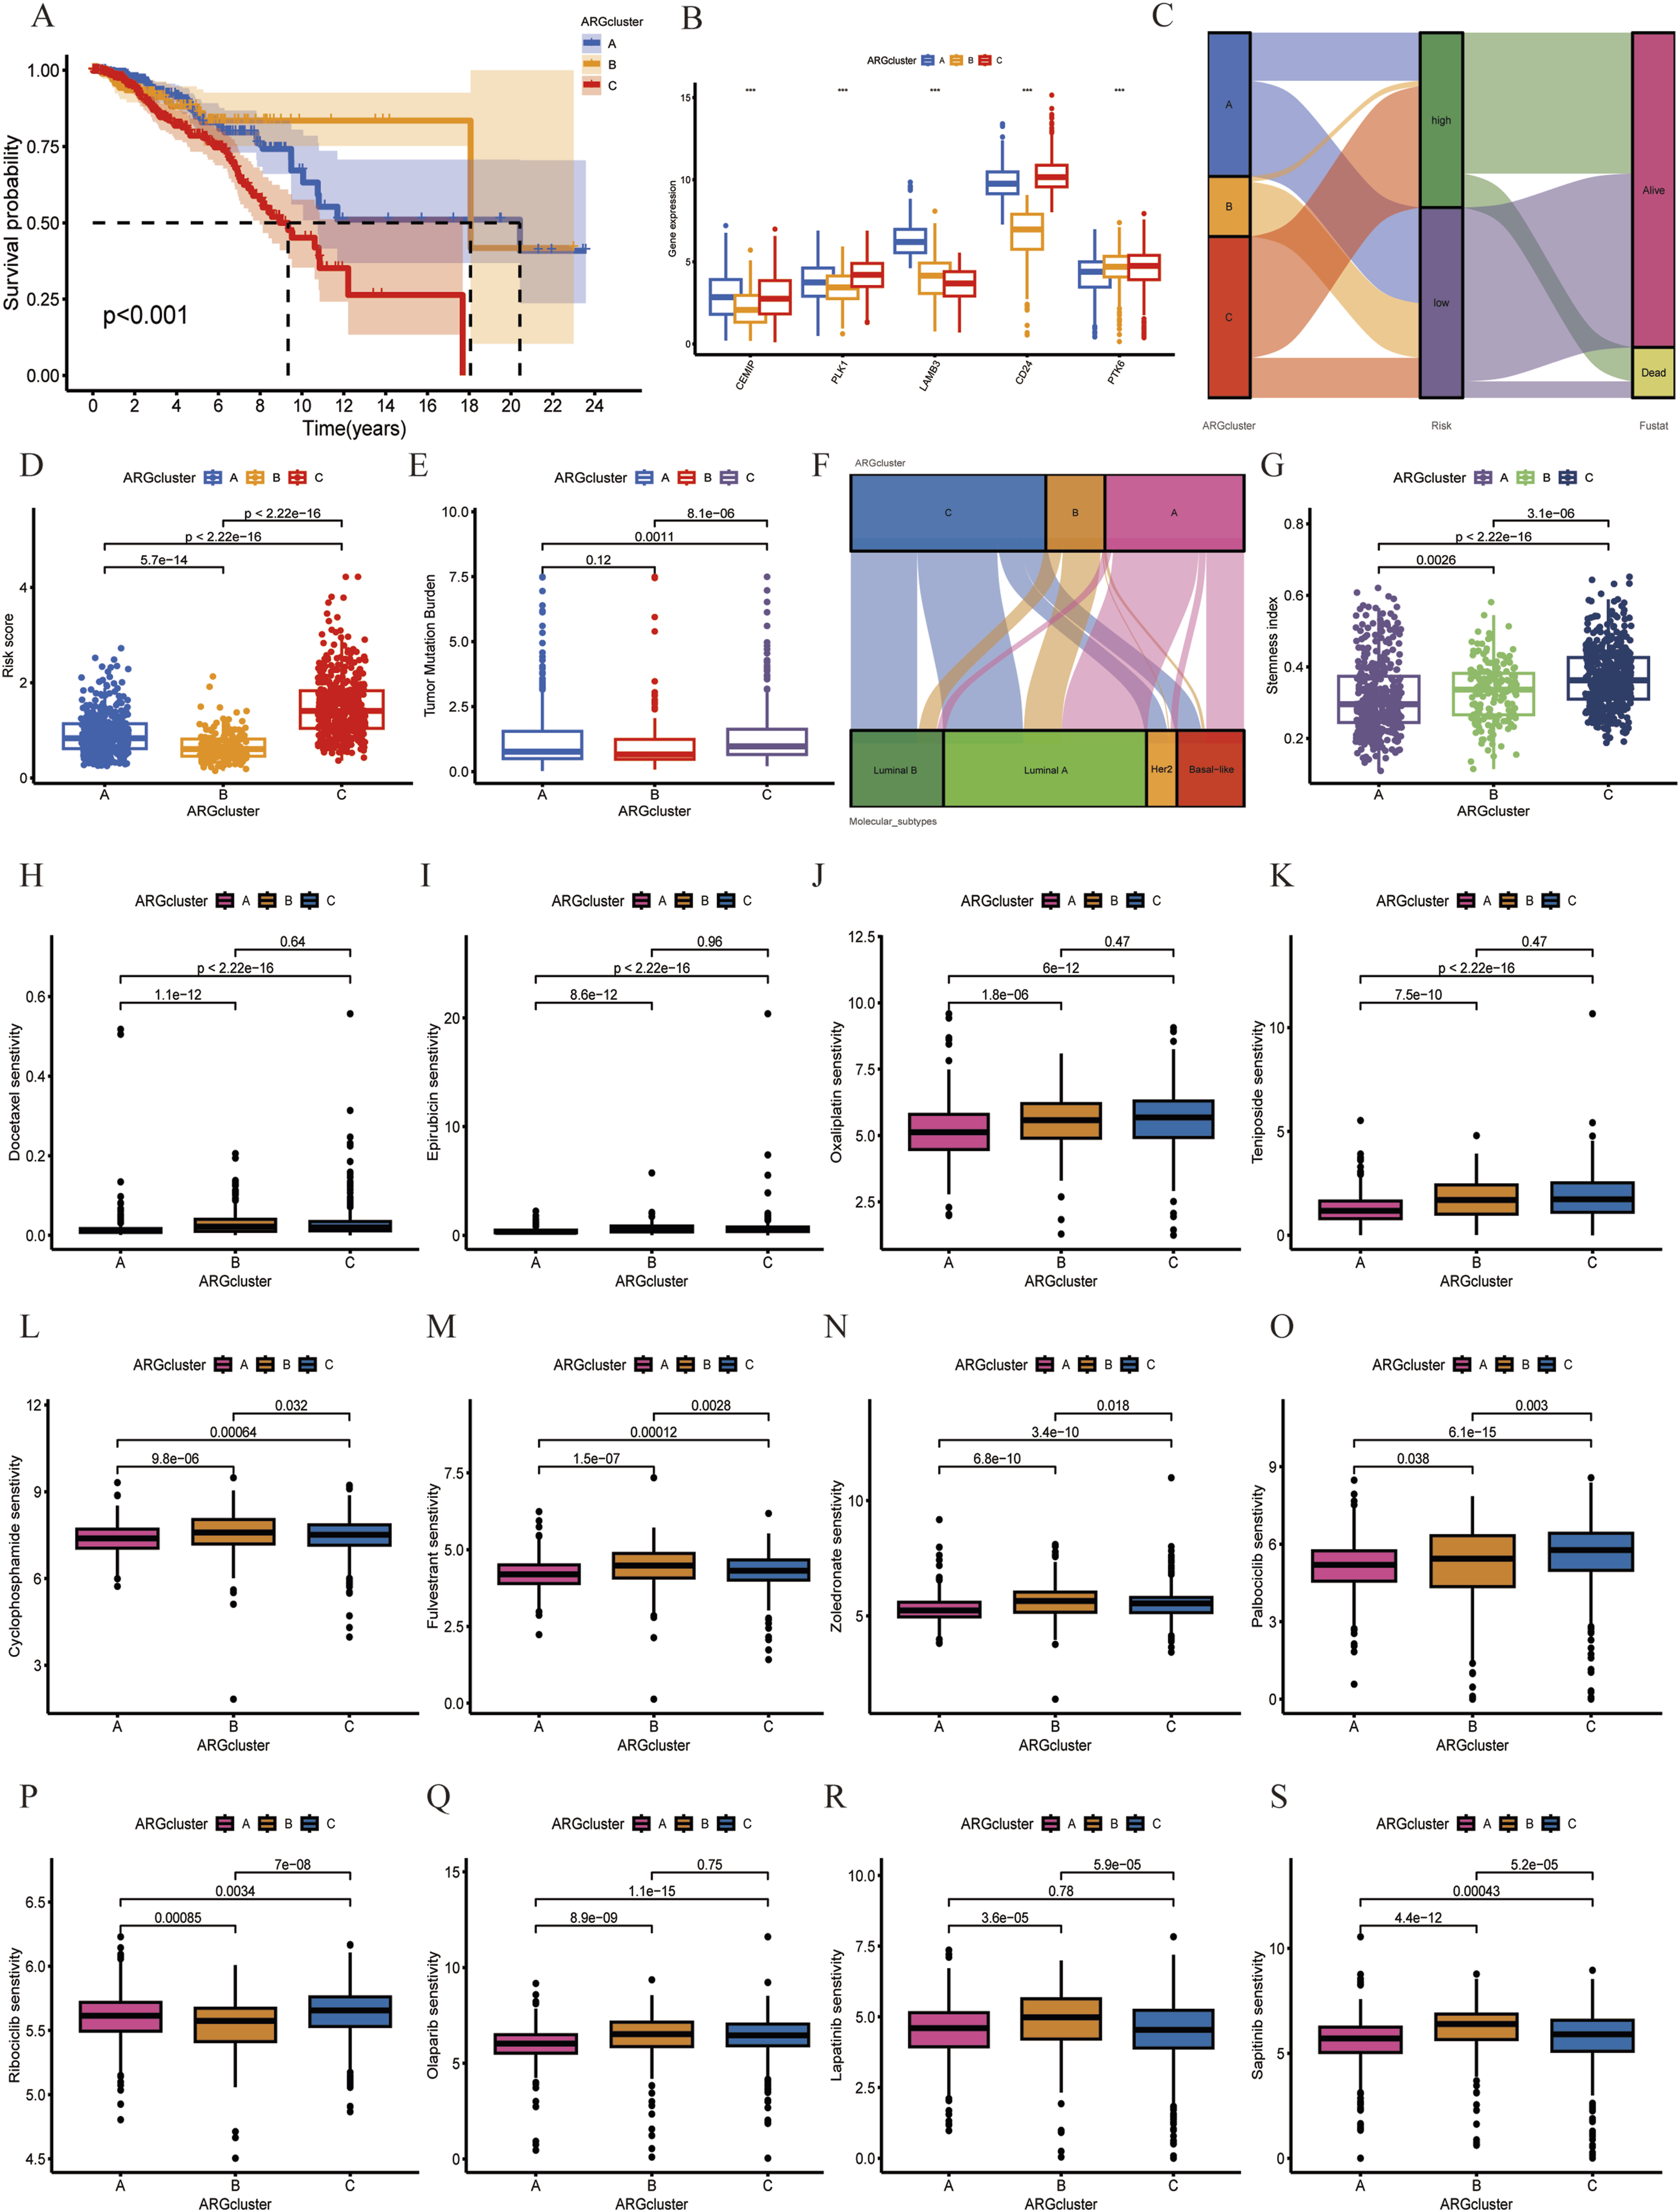
Furthermore, the drug sensitivity analysis results (Table S5) showed that ARGcluster A was more sensitive to most drugs than ARGcluster B and C (Figure 7(H)–(S)), including traditional chemotherapy drugs such as Docetaxel, Epirubicin, Oxaliplatin, Teniposide, Cyclophosphamide, the CDK4/6 inhibitor inhibitors (including Palbociclib and Ribociclib) and PARP inhibitor Olaparib, as well as ErbB-2 and EGFR inhibitors such as Lapatinib and Sapitinib.
In general, these data demonstrated that the stratification of subtypes was correlated with immune regulation, overall survival and drug sensitivity of breast cancer.
Discussion
Breast cancer is a highly heterogeneous disease with gradually increased incidence and mortality among females worldwide.1–3 Exploration of markers that related to the prognosis and individualized treatment of breast cancer patients are urgently required. In recent years, a variety of specialized cell death types have been identified, such as necroptosis, disulfidptosis, ferroptosis, and anoikis, therefore, clarifying the underlying mechanisms of these cell deaths and targeting the process of cell death has promising prospects in cancer treatment.46–50 However, Anoikis is a specific type of cell death that is widely involved in the regulation of tumor progression,18,20–25,51 the studies that focus on the prognostic values of ARGs in breast cancer are scarce. Besides, the relationship between anoikis and immune microenvironment in breast cancer remains unclear. Hence, in this study, we established a prognostic model based on ARGs, and investigated the correlation between ARGs risk groups and OS, TMB, TME, stemness, and drug sensitivity in breast cancer.
In this study, we first identified differentially expressed ARGs between normal and breast cancer tissues. Functional enrichment analysis demonstrated that these differentially expressed ARGs were enriched in tumor proliferation and metastasis-related pathways. Secondly, 10 OS-associated ARGs were identified based on differentially expressed ARGs, then five anoikis-related signatures (ARS) were selected from ARGs and the ARGs risk score model was established and evaluated based on the expression of these five ARS (CEMIP, LAMB3, CD24, PLK1, and PTK6), breast cancer patients were divided into high and low risk groups according to their risk score. K-M survival analysis revealed that patients with breast cancer in the high risk group had a significantly shorter OS compared to the low risk group. Several studies have demonstrated a correlation between these ARS and anoikis resistance in tumors,30,51–56 for example, the AMPK/β-catenin pathway triggers the overexpression of CEMIP in prostate cancer, which promotes PDK4-mediated metabolic reprogramming to promote invasion and anoikis resistance. 57 Additional investigation revealed that transcription factor ATF4 triggers the transcription of CEMIP to promote the dissociation of Bcl-2/Beclin1 complex, which leads to protective autophagy and anoikis resistance in prostate cancer. 54 LAMB3 is involved in promoting the invasion and metastasis of some types of cancer by activating multiple signal pathways.52,53,56,58 However, our research showed that LAMB3 was low expressed in breast cancer tissue and positively correlated with prognosis. The potential mechanism remains for further investigation. CD24 is a glycosylated GPI-anchored surface protein that is overexpressed in many tumors, the binding of CD24 to tumor-associated macrophages-expressed Siglec-10 activating an inhibitory signaling cascade mediated by SHP-1/SHP-2, which promoting tumor immune evasion, genetic ablation or addition of a CD24 blocking antibody can trigger phagocytosis-mediated tumor clearance and increase survival. 59 PLK1 is overexpressed in a variety of tumors and acts as a key regulator of in the whole process of mitosis, targeting PLK1 has promising prospects in tumor therapy. 60 PTK6, an intracellular non-receptor kinase, promotes Epithelial-Mesenchymal Transition (EMT) and anoikis resistance of triple negative breast cancer cells by modulating E-cadherin expression via Snail protein degradation, PTK6 kinase inhibitor inhibits metastatic lung colonization in vivo. 30 Further research was required to clarify the underlying mechanisms of these ARS in the progression of breast cancer.
Moreover, we showed the association between risk subgroups and TMB, TME, and stemness in breast cancer. Previous studies have demonstrated that somatic mutations are associated with tumor development and progression.40–42 Therefore, we analyzed the mutation profile of the top 20 common gene mutations in the high risk and low risk groups, and found that the mutation rates of the tumor suppressor genes TP53 and PTEN is higher in high risk group, while the mutation frequency of the oncogene PIK3CA is lower in high risk group, the TMB of the high-risk group was higher than that of the low-risk group and the risk score was positively correlated with TMB. Furthermore, survival analysis showed that the prognosis of the low TMB group was better than that of the high TMB group, and when combined with TMB, the high risk group with high TMB presented the worst prognosis. Recently, TME have been identified as a new hotpot of research for breast cancer, so we evaluated the differences in immune microenvironment between high and low risk groups. It was found that high risk group revealed lower stromal score, immune score, and ESTIMATE score compared to low risk group, and there was a considerable difference in the infiltration ratio of immune cells between high-risk and low-risk groups. Additionally, the risk score was negatively correlated with many immunosuppressive receptors and ligands, such as PD-1, BTLA, TNFSF14, CD200, and CD200R1 according to the analysis of immune checkpoints, suggesting that ARGs regulate tumor progression partly via modulation of tumor immune response. Moreover, it was shown that the stemness index of patients in the high risk group was closer to 1, indicating that breast cancer cells from high-risk patients exhibit more stem cell characteristics and less differentiation, which may be responsible for the poor prognosis and chemoresistance.
Besides, compared to the high risk group, patients with breast cancer in the low risk group may benefit from conventional chemotherapy and CDK4/6 inhibitor therapy but are not sensitive to EGFR inhibitor therapy. However, patients in the high risk group had a lower TIDE score, indicating that the patients were more likely to benefit from immunotherapy, which may result from the negative correlation between risk score and immune checkpoints, demonstrating the ARGs risk score model may assist in making personalized clinical treatment decisions for breast cancer patients.
In addition, breast cancer patient can be classified into three subtypes based on the expression of ARS, referred to as ARGcluster A, ARGcluster B, and ARGcluster C, the expression of CEMIP, PLK1, CD24 and PTK6 is higher in ARGcluster C, whereas the expression of LAMB3 is lower compared with ARGcluster A and ARGcluster B. Furthermore, different from ARGcluster A and ARGcluster B, ARGcluster C was combined with higher risk score, TMB, stemness index and poor overall survival. The infiltration of immune cells and the immune score of immune-related pathways were prevalently higher in ARGcluster A, and ARGcluster A had lower IC50 values and higher sensitivity to a variety of chemotherapy and targeted therapy agents. Which indicate that ARS can be used to predict the prognosis, immune microenvironment and drug sensitivity of breast cancer patients.
Despite the promising results from bioinformatics analysis of the relationship between breast cancer and anoikis, some limitations still existed in our study that remained to be considered. Firstly, the present study is based on a few clinicopathological factors obtained from TCGA, GEO and METABERC databases. TCGA database only records whether a patient received therapy, but it lacks information on specific drugs and treatment dosages, which could lead to bias in the study results. Moreover, due to the unavailability of neoadjuvant therapy related data in public databases, the predictive effectiveness of this model in neoadjuvant chemotherapy patients requires further validation. To solve these problems, the comprehensive and large-scale local clinical datasets are particularly important. In our future work, we will collect and analyze the clinicopathological data from patients in our breast cancer treatment center, including molecular subtypes, treatment regime and prognosis, classify the patients into different subgroups and use the corresponding clinical tissue samples to verify the robustness of the risk model that constructed by public datasets. Secondly, the ARGs studied here are mainly protein-coding genes without consideration of the non-coding RNA genes, whereas anoikis-related non-coding genes, such as long non-coding RNAs and microRNAs, play a vital role in tumor progression, thus the prognostic role of these anoikis-related non-coding genes in breast cancer needs to be further investigated. Additionally, an online platform co-constructed by multicenter clinicians may be the best way to facilitate the use of this model in clinical practice, but there are many challenges and limitations in applying this model to clinical practice in the future, for example, anoikis patterns may dynamic change during the progress of cancer treatment, including neoadjuvant chemotherapy, surgery, chemotherapy, radiotherapy, and targeted therapy. Therefore, dynamic monitoring of ARGs and real-time updating of clinicopathological data are essential for the building of an online platform to facilitate the application of the model by clinical doctors. Finally, while this study identified novel five ARS for breast cancer prognosis predication and treatment options selection, the underlying molecular mechanisms of ARS waited to be clarified based on in vitro and in vivo experimental analyses.
Conclusions
In summary, the present study identified a novel prognostic model based on five ARS. This ARGs risk score model was capable of independently predicting the prognosis of breast cancer patient. Furthermore, the risk subgroups based on risk scores were closely related to tumor immunity, stemness, TMB and drug sensitivity. Collectively, our research provided promising biomarkers for breast cancer prognosis predication and treatment option selection. Further explorations and experimental analyses are required to elucidate the underlying mechanisms of these ARS in breast cancer.
Supplemental Material
Supplemental Material - Identification of Novel Anoikis-Related Gene Signatures to Predict the Prognosis, Immune Microenvironment, and Drug Sensitivity of Breast Cancer Patients
Supplemental Material for Identification of Novel Anoikis-Related Gene Signatures to Predict the Prognosis, Immune Microenvironment, and Drug Sensitivity of Breast Cancer Patients by Jiena Liu, Hao Wu, Qin Wang, Shengye Jin, Siyu Hou, Zibo Shen, Liuying Zhao, Shouping Xu, and Da Pang in Cancer Control
Footnotes
Acknowledgments
We thank all the study participants for their contributions to this study.
Author Contributions
JNL and HW analyzed the data and drafted the manuscript. QW, LYZ, SYJ, SYH and ZBS downloaded the data and prepared the figures. DP and SPX participated in the design of the manuscript and helped to draft and modify the manuscript. All authors read and approved the final manuscript.
Declaration of Conflicting Interests
The author(s) declared no potential conflicts of interest with respect to the research, authorship, and/or publication of this article.
Funding
The author(s) disclosed receipt of the following financial support for the research, authorship, and/or publication of this article: This work was supported by funding from the National Natural Science Foundation of China (Grant Numbers: 81972706, 82173235, 82103325, 82202996), The Fundamental Research Funds for the Provincial Universities (Grant Number: 2022-KYYWF-0288), Heilongjiang Postdoctoral Financial Assistance (Grant Number: LBH-Z22219), Heilongjiang Provincial Natural Science Foundation Outstanding Youth Project (Grant Number: YQ2023H022), China Postdoctoral Science Foundation (Grant Number: 2023MD734172) and Haiyan Fund Project of Harbin Medical University Cancer Hospital (Grant number JJMS 2022-17, JJYQ2024-06).
Ethical Statement
Data Availability Statement
The public datasets to support the results of this subject can be gained from TCGA (https://portal.gdc.cancer.gov/), GEO (https://www.ncbi.nlm.nih.gov/geo/), UCSC Xena (https://xena.ucsc.edu/) and TIDE (![]() ).
).
Supplemental Material
Supplemental material for this article is available online.
References
Supplementary Material
Please find the following supplemental material available below.
For Open Access articles published under a Creative Commons License, all supplemental material carries the same license as the article it is associated with.
For non-Open Access articles published, all supplemental material carries a non-exclusive license, and permission requests for re-use of supplemental material or any part of supplemental material shall be sent directly to the copyright owner as specified in the copyright notice associated with the article.