
Abstract
Introduction
Colorectal cancer has emerged as a concerning health problem, ranking the third most common form of cancer in both men and women. The phosphatase and tensin homologue (PTEN) protein is widely known for its role as an inhibitor of the phosphatidylinositol 3-kinase/protein kinase-B/mammalian target of rapamycin (PI3K/Akt/mTOR) pathway, playing a major role inhibiting tumor development. Previous studies investigated the role of this protein in the PI3K pathway and how it affected colorectal cancer. However, a standardized cut-off value for PTEN expression has not been established.
Methods
Immunohistochemistry was used in examining PTEN. The staining grade ranging from 0 to 3 was then multiplied by the number of 100 cancer cells counted, with total score between 0 and 300. In this study, receiver operating characteristic (ROC) curve was employed to determine the expression cut-off value for PTEN in colorectal cancer.
Results
This study showed statistically significant results (P < 0.001) in either tumor or non-tumor tissues by using the ROC curve with a cut-off value of 199.0. This study also revealed significant correlation between nodal status with PTEN (P = 0.008) and stage with PTEN (P = 0.019) with sensitivity 0.753 and specificity 0.728.
Conclusion
Semiquantitative assessment with cell counting multiplied by color intensity is a good method in determining PTEN expression. The use of immunohistochemical staining intensity and cell scoring with ROC cut-off is effective to elaborate the effects of PTEN in colorectal cancer (PTEN value > 199.0 was classified as strong and ≤ 199.0 as weak).
Introduction
Colorectal cancer (CRC) has emerged as a concerning health problem, ranking as the third-highest form of cancer in both men and women. Based on the International Agency for Research on Cancer, the incidence of CRC reached 7.8–12% between 2012 and 2015; with 15.2% for men and 10.2% for women in Southeast Asia.1,2 The World Health Organization 3 stated that cases of CRC in Indonesia had reached 27,772 in 2014, ranking as the second highest for men after lung cancer and the third highest for women after breast and cervical cancer, causing 18,353 deaths in the same year.
CRC is believed to have undergone pathways such as Wnt/β-catenin, transforming growth factor beta (TGF-β), Kirsten rat sarcoma viral oncogene homolog (KRAS) and phosphatidylinositol 3-kinase/protein kinase-B/mammalian target of rapamycin (PI3K/Akt/mTOR). The phosphatase and tensin homologue (PTEN) protein is a well-known inhibitor of the PI3K/Akt/mTOR pathway, which plays major role as tumor suppressor. Previous studies investigated the role of this protein in the PI3K pathway and how it affected CRC. Several studies showed that the expression of PTEN was diminished or even absent in the presence of CRC. Other biomarker, microRNA-21 also play a role in regulating PTEN gene by suppressing its function; resulting in uncontrolled activation of PI3K/AKT, fostering cancerous cell survival.4–7 Study conducted by Peng et al., stated that microRNA-21 could be diagnostic and prognostic biomarker for CRC; with sensitivity and specificity of 0.64 and 0.85 respectively.8 Immunoscoring assessment (CD8 + and CD3 + T cell densities) is also widely used in diagnosing CRC recurrence. Blair et al. calculated the risk of CRC recurrence through this assessment method and it was found to be robust, reproducible, quantitative, and standardized, providing a reliable estimate of risk of CRC recurrence.9 PTEN is a tumor suppressor biomarker acting through the PI3K pathway. Mutations or deletions of PTEN have been identified as contributors to CRC, where the loss of PTEN function activates PI3K persistently and affects cell proliferation, antiapoptotic features, lymphovascular invasion, metastasis, and cell metabolism. 10 PTEN inactivation would activate the PI3K pathway, which would increase cell proliferation, migration, invasion, and decreases apoptosis activity. PTEN is well known for its lipid phosphatase activity, which is crucial for its tumor suppressor function. Specifically, the process begins with Class I PI3Ks catalyzing PIP2 phosphorylation to generate the lipid signaling intermediate PTEN which dephosphorylates phosphatidylinositol—3, 4, 5—trisphosphate (PIP3), and PTEN antagonizes PI3K activity by dephosphorylating PIP3 (decreasing PI3K activity). PTEN also has a protein phosphatase activity, enabling it to dephosphorylate both itself and other protein substrates. Focal adhesion kinase is related to cellular adhesion as it inhibits cell migration and invasion through PTEN-mediated dephosphorylation. 11
Due to the fact that it was found to have direct effect on the pathway, PTEN has been found to be potential biomarker for CRC, although it has not been determined on to what extent PTEN could act as a predictive or prognostic biomarker regarding of how effective it would be. However, the study identifying the mutation PTEN as predictive response to anti-epidermal growth factor receptor (EGFR) therapy presents good target for pharmacological intervention in CRC treatment. Monitoring of anti-EGFR monoclonal antibodies (mAbs) treatment is done by observing the mutations in the PI3K gene with the loss of PTEN protein as new biomarkers. Another study showed that decreased expression of PTEN may be associated with poor prognosis for CRC. The study showed CRC patients with low expression of PTEN had a median survival of 9 months, while those with tumor expressing PTEN survived for 49 months on average.11–14 Meanwhile, study conducted by Serebriiskii et al. stated that PTEN deletions were linked to reduced survival rates, while PTEN mutations were associated with improved survival (median OS of 31.3 months vs 63.2 months).15 In order to prove PTEN as potential biomarker, a reliable detection method is essential to accurately measure its value. The immunohistochemical detection of PTEN in cancer cells has been identified as a crucial step in advancing PTEN's role as a biomarker.16–18 However, there has not been any standardized immunohistochemical scoring method in determining the cut-off values for PTEN expression.4–6 On the other hand, Maiques et al. used H-score system which ranged between 0 and 300.18 Hocking et al. and Noh et al. used scoring system where PTEN staining was valued as “0” for no staining, “1” for weak, “2” for moderate, and 3 for strong.6,19 Shroff et al. classified PTEN expression measurements into PTEN-low (expression score 1–100) and PTEN-high (expression score > 100) by using the median of PTEN expression as a cut-off.20 Another study conducted by Yazdani et al. utilized single method which is the immunohistochemical staining of PTEN to determine its expression either in CRC tissues or non-cancerous samples. In this study, we used the semiquantitative scoring method through combining cell counting with color intensity from immunohistochemistry examination. We also used a receiver operating characteristic (ROC) curve to create a dependable scoring system for identifying PTEN expression in CRC.21,22
Materials and methods
Patients and tissue samples
Patients with colorectal adenocarcinoma diagnosed at the age of 20 years and above at every stage were included. Exclusion criteria were patients with a prior history of CRC, patients who had adenocarcinoma with mucinous focus >50%, mucinous adenocarcinoma or signet ring cell carcinoma, or had undergone chemotherapy or radiotherapy. Samples were taken between January 2017 and December 2019 from patients who had been admitted to Cipto Mangunkusumo Hospital, MRCCC Hospital, and Siloam Hospital Kebon Jeruk, Jakarta, Indonesia. The resected tumor tissues along with adjacent normal tissues were included in the sample. Non-tumor tissue refers to tissue that is located at least ≥5 cm away from the proximal colorectal segment of cancer tissue displaying a tumor-free morphology. The primary tumor samples were embedded in paraffin blocks and examined through immunohistochemistry.
Immunohistochemistry
Paraffin blocks were cut into 3 µm sections and placed on a Poly-L-Lysine slide before it was warmed. Afterwards, deparaffinization was conducted followed by a rehydration process. The slide was then incubated with endogenous peroxidase at 3% H2O2, followed by a decloaking chamber for antigen retrieval with pH 9.0 tris-EDTA. The slide was then washed with phosphate-buffered saline (PBS), and incubated with a sniper block from Starr Trek™ Universal HRP Detection System Biocare (SHDB). Incubation with PTEN primary antibody (Abcam) was done at a concentration of 1:250. The slide was then rewashed with PBS and incubated with the secondary antibody Trekkie Universal Link (SHDB). Subsequently, it was then rewashed with PBS, then incubated with TrekAvidin-HRP (SHDB). Following another PBS wash, it was re-incubated with diaminobenzidine (DAB) solution (SHDB) with the addition of Betazoid DAB Buffer (SHDB) and Betazoid DAB Chromogen (SHDB). Hematoxylin Mayer solution was added for counterstaining followed by bluing of lithium carbonate. Then, the slide was dehydrated and followed by clearing with xylene. The color intensity was assessed by pathologists.
PTEN value
The slide was then examined using a light microscope with 400 × magnification (40 × objective lenses and 10 × eyepiece) by counting 100 cancer cells from 10 different fields. Immunohistochemical examination was done by determining the color intensity of the cell cytoplasm. The scoring system was determined according to the color intensities, ranging from 0 to 3, in which 0 represents no staining, 1 for weak staining, 2 for moderate staining, and 3 for strong staining of PTEN (Figure 1). Meanwhile, in this study we interpret the score value for 2 and 3 as strong staining of PTEN. The score multiplied by the number of 100 cancer cells counted, with the total score ranging between 0 and 300. This counting method showed a combination assessment of intensity of staining and number of cells, which expressed more reliable results.
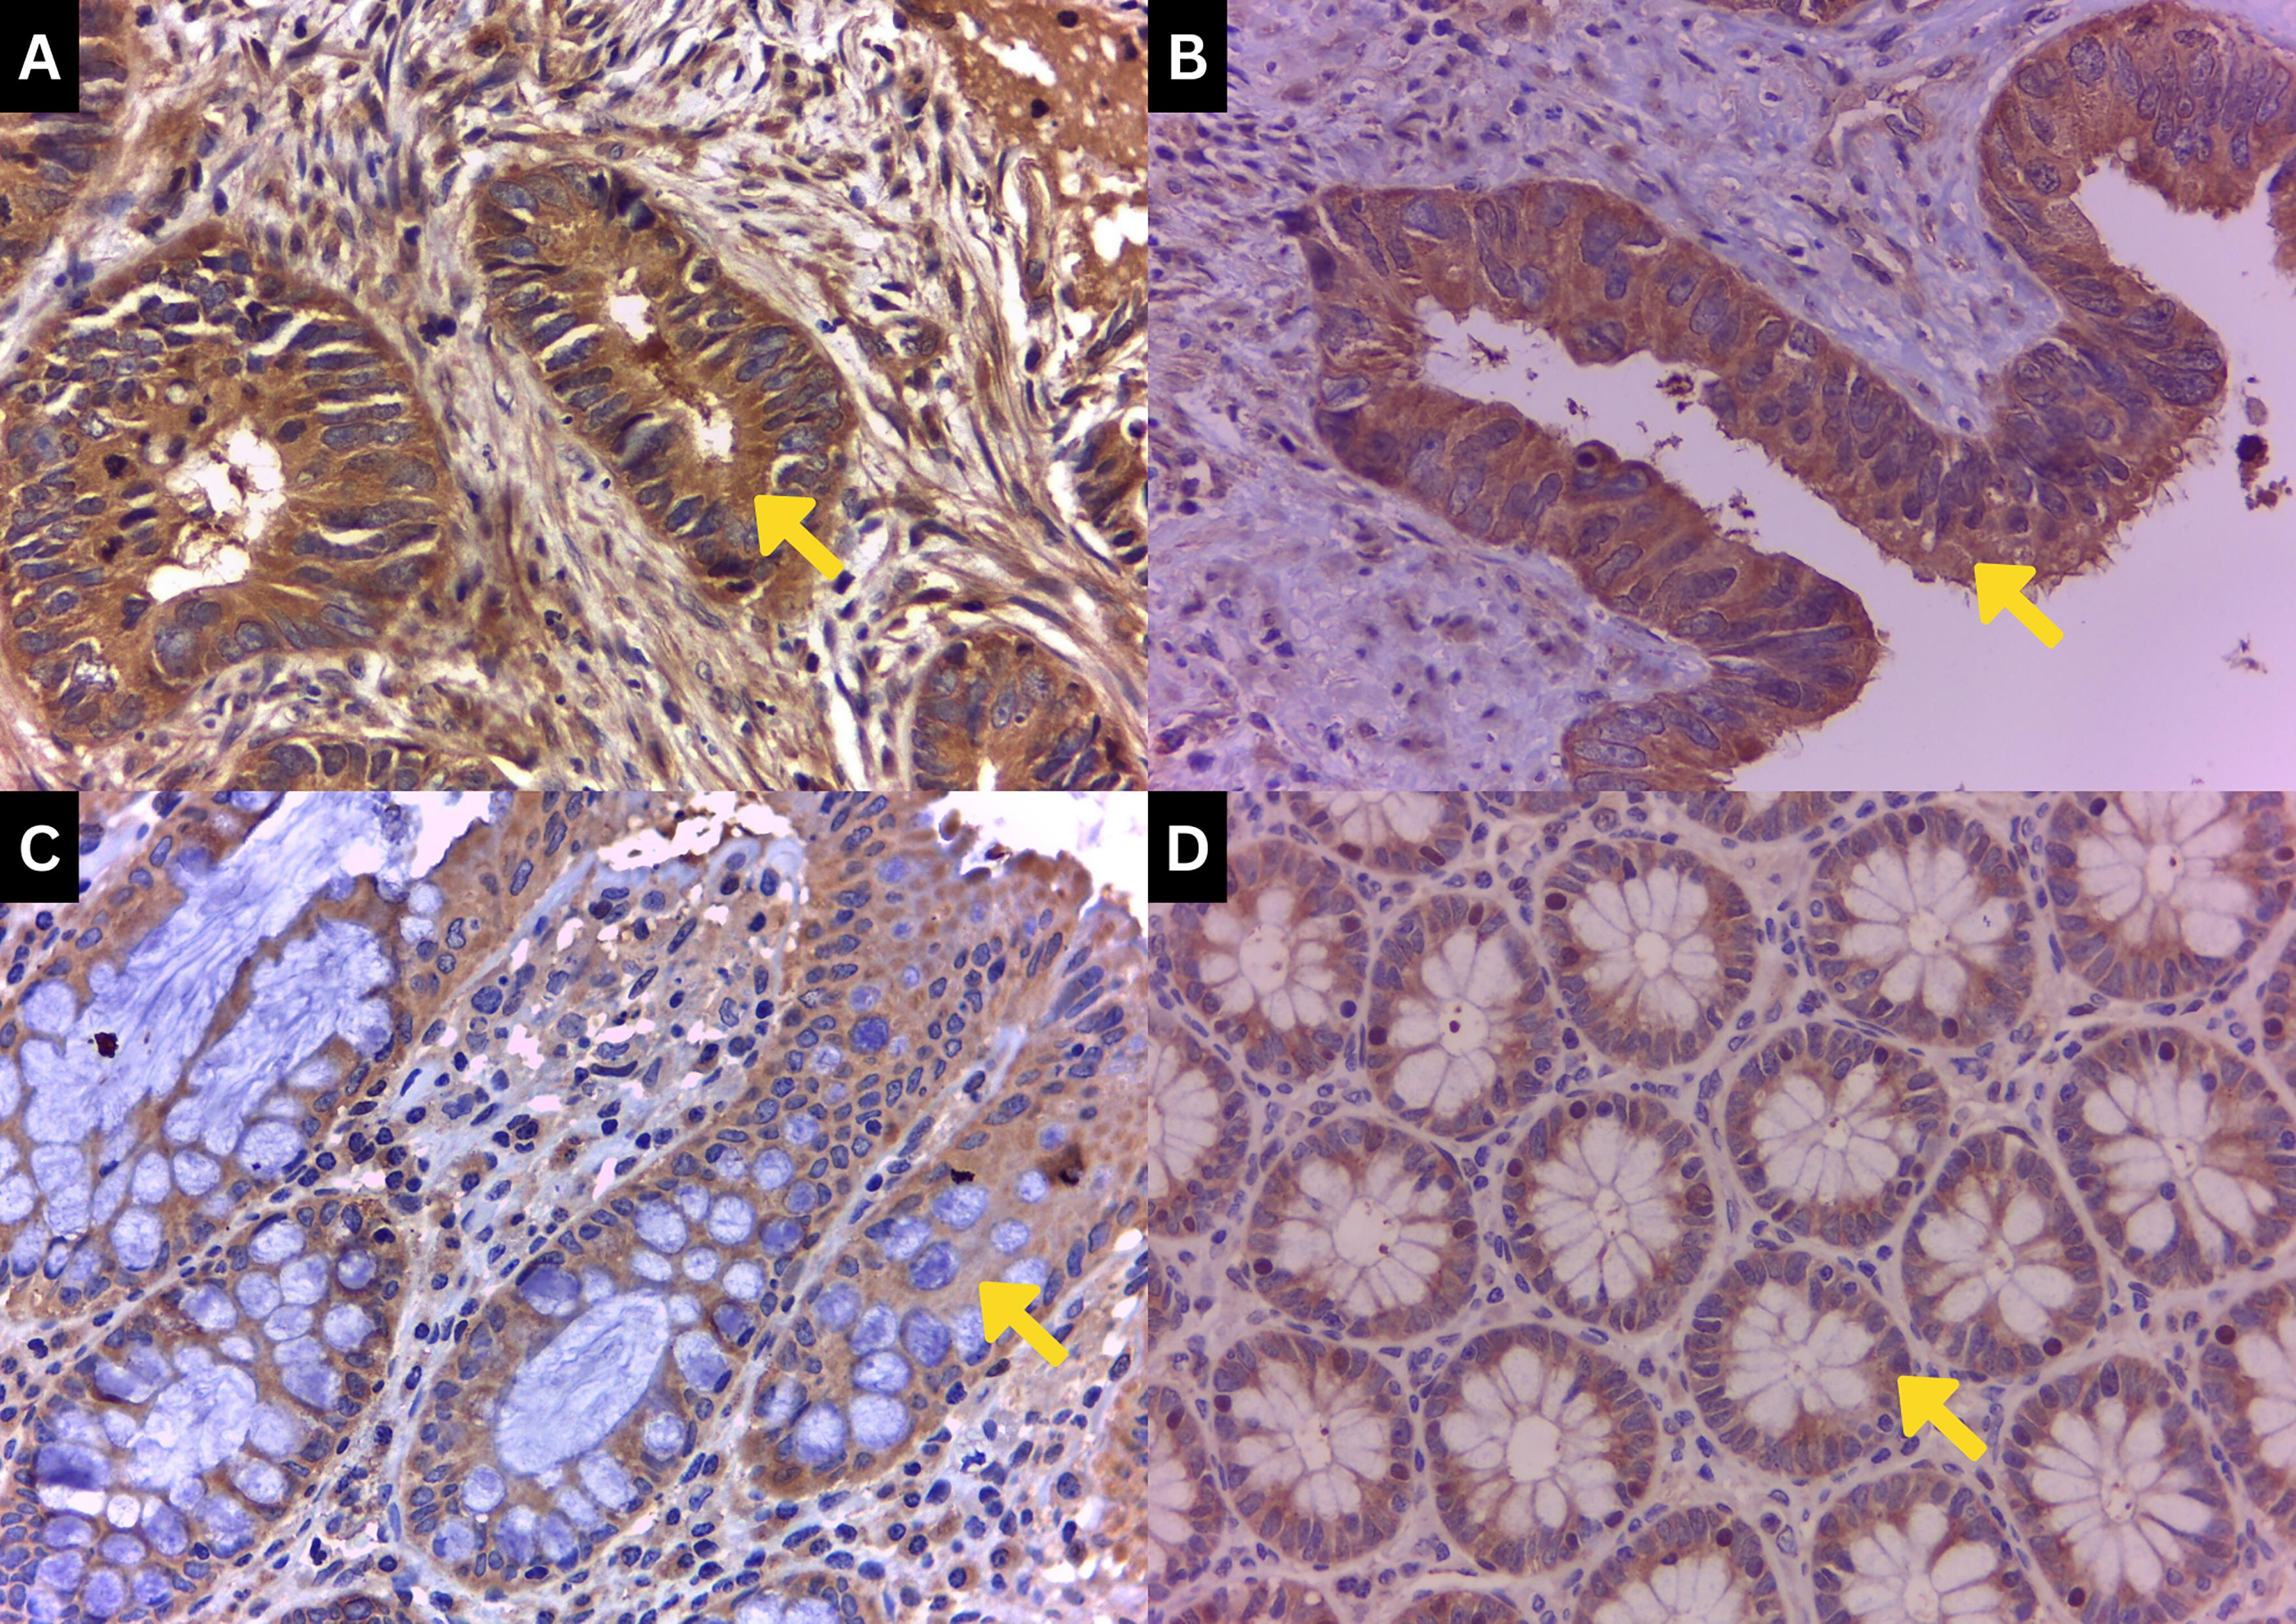
PTEN immunohistochemical staining grade. Staining was done with a magnification of 400 ×. (a) Strong PTEN expression of a tumor tissue with a dark brown color (grade 3). (b) Moderate PTEN expression of a tumor tissue with a light-dark brown color (grade 2). (c) Weak PTEN expression of a tumor tissue with a light brown color (grade 1). (d) PTEN expression of a non-tumor tissue with a light brown to no color (grade 0).
Cut-off value
To determine the cut-off value of PTEN, the ROC curve was used. This was determined by measuring the cancer diagnostic performance (sensitivity and specificity) through PTEN expression. The cut-off value was set from the tumor and non-tumor data that were analyzed with the ROC curve. If the area under the curve (AUC) did not meet the value of 60%, an alternative cut-off value would be set from the median value. PTEN expression was categorized as weak or strong based on the predetermined cut-off value.22,23
Statistical analyses
Statistical analyses were done using SPSS Statistics software. The data were summarized descriptively between normal and tumor tissues, patient age, gender, and tumor stage. PTEN expression scores from immunohistochemical examination were acquired from the score calculation and categorized into two groups: weak and strong expression based on the ROC curve (Figure 2).
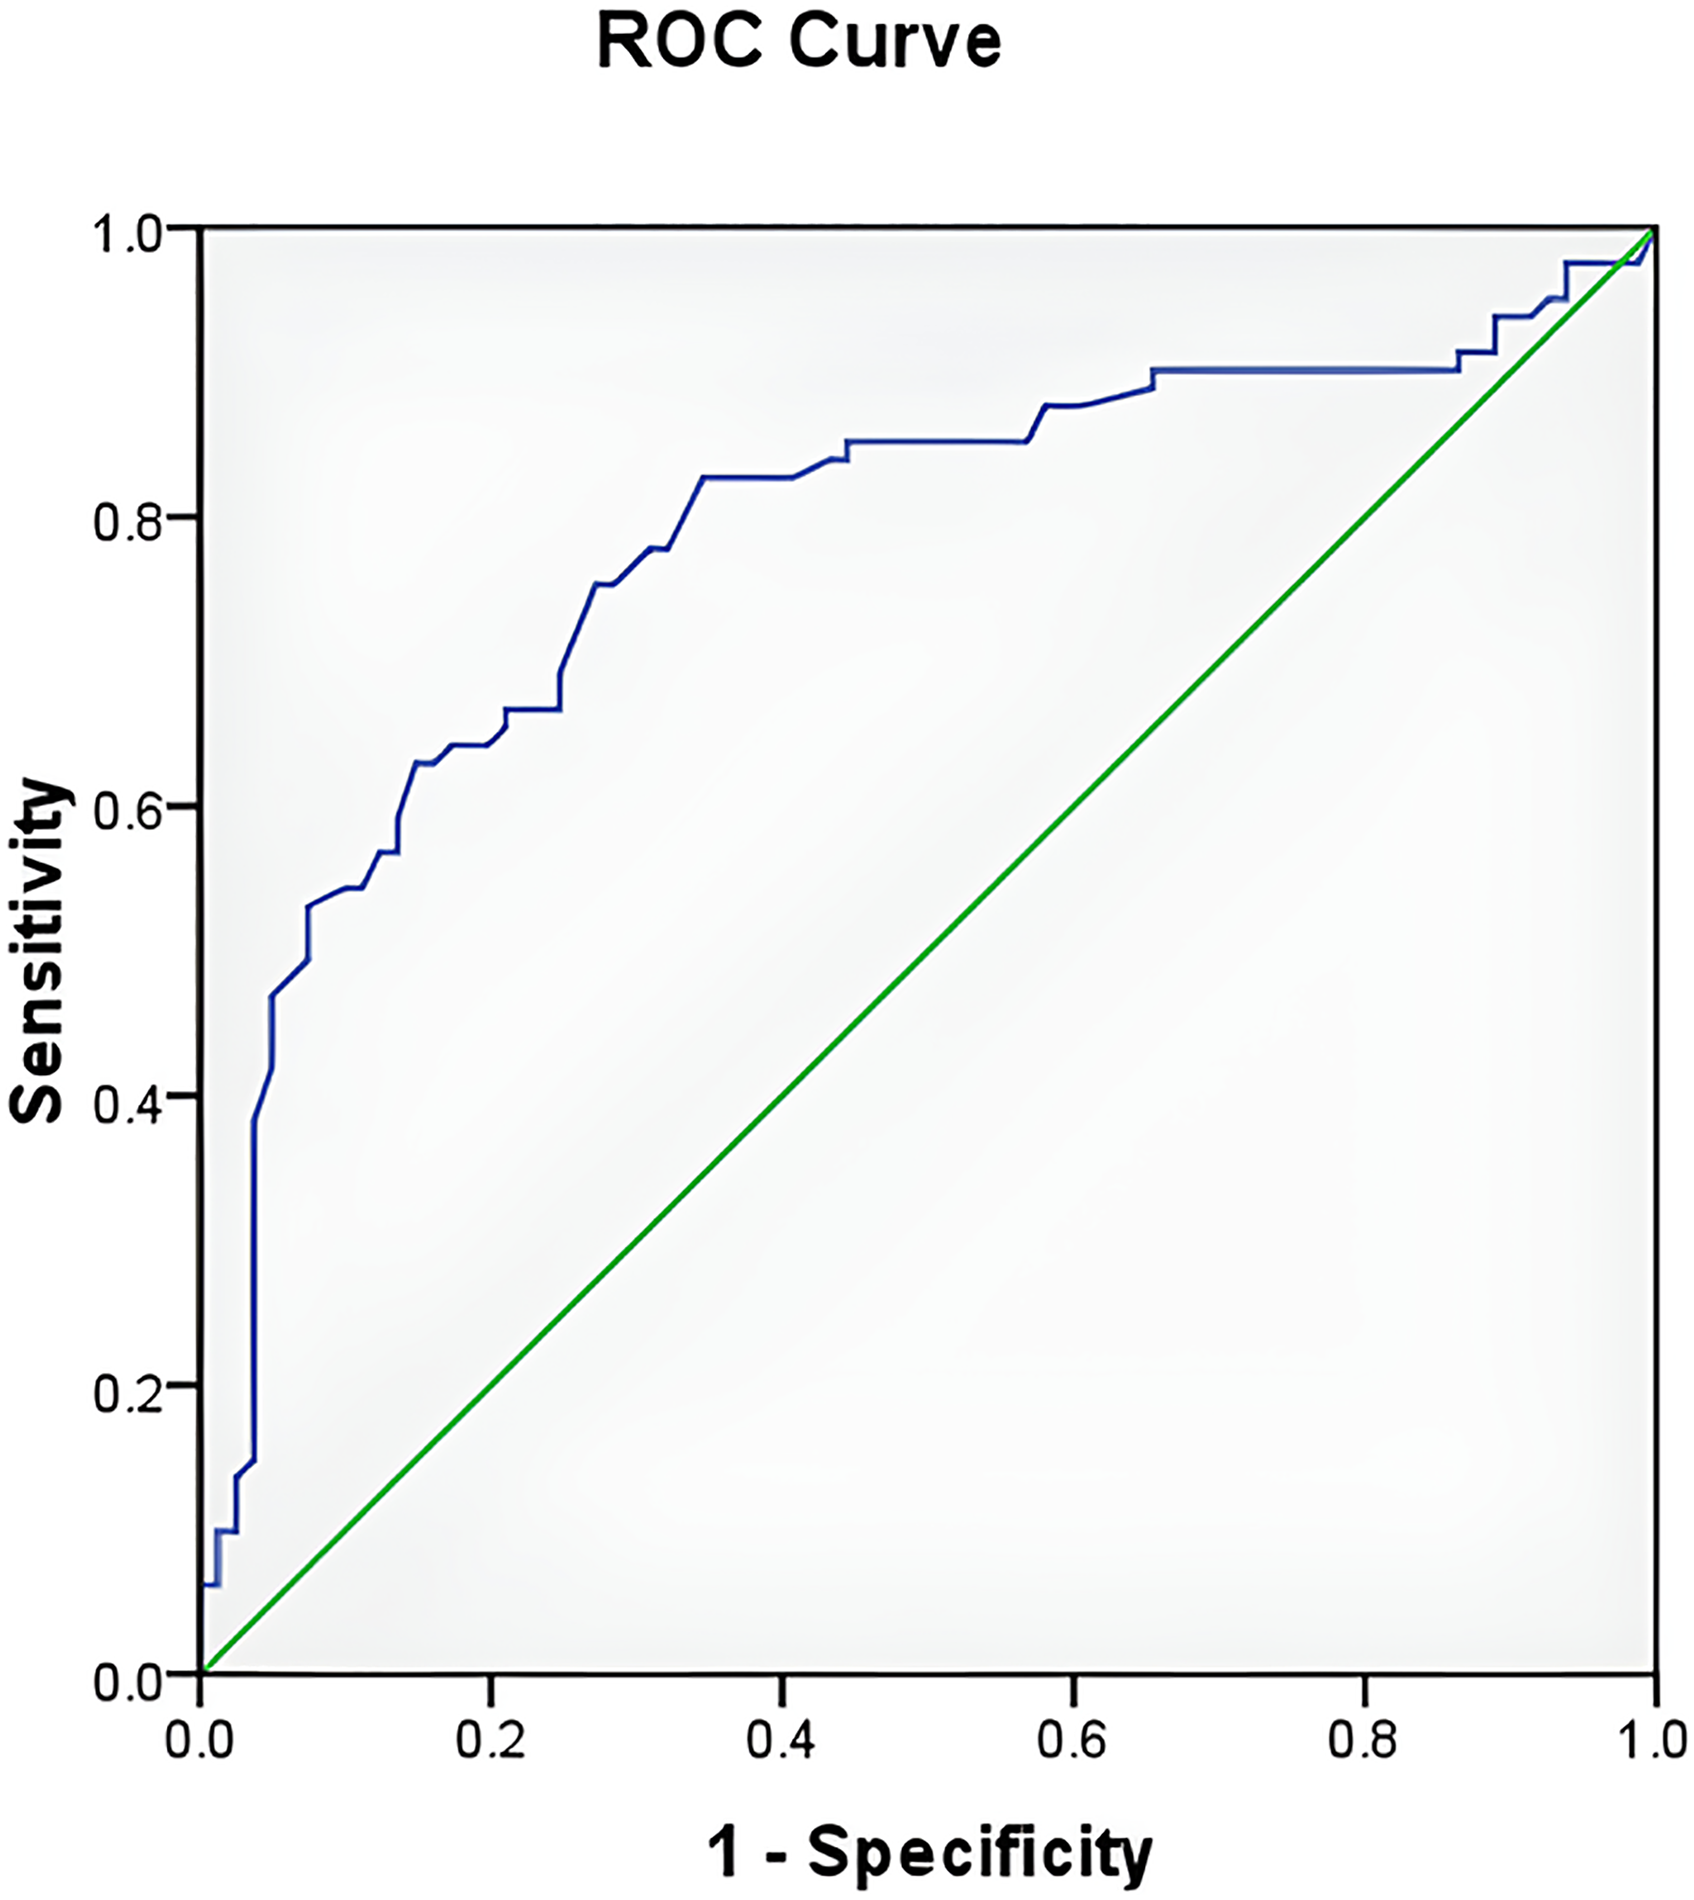
PTEN ROC curve. The cut-off value of PTEN was 199.0 with sensitivity 0.753 and specificity 0.728.
Results
Cut-off value
After statistical analysis by using the ROC curve, a cut-off value of 199.0 was determined for PTEN based on the AUC. Consequently, any PTEN value > 199.0 was classified as strong, while values ≤ 199.0 were deemed weak with a sensitivity 0.753 and a specificity 0.728.
Subject characteristics
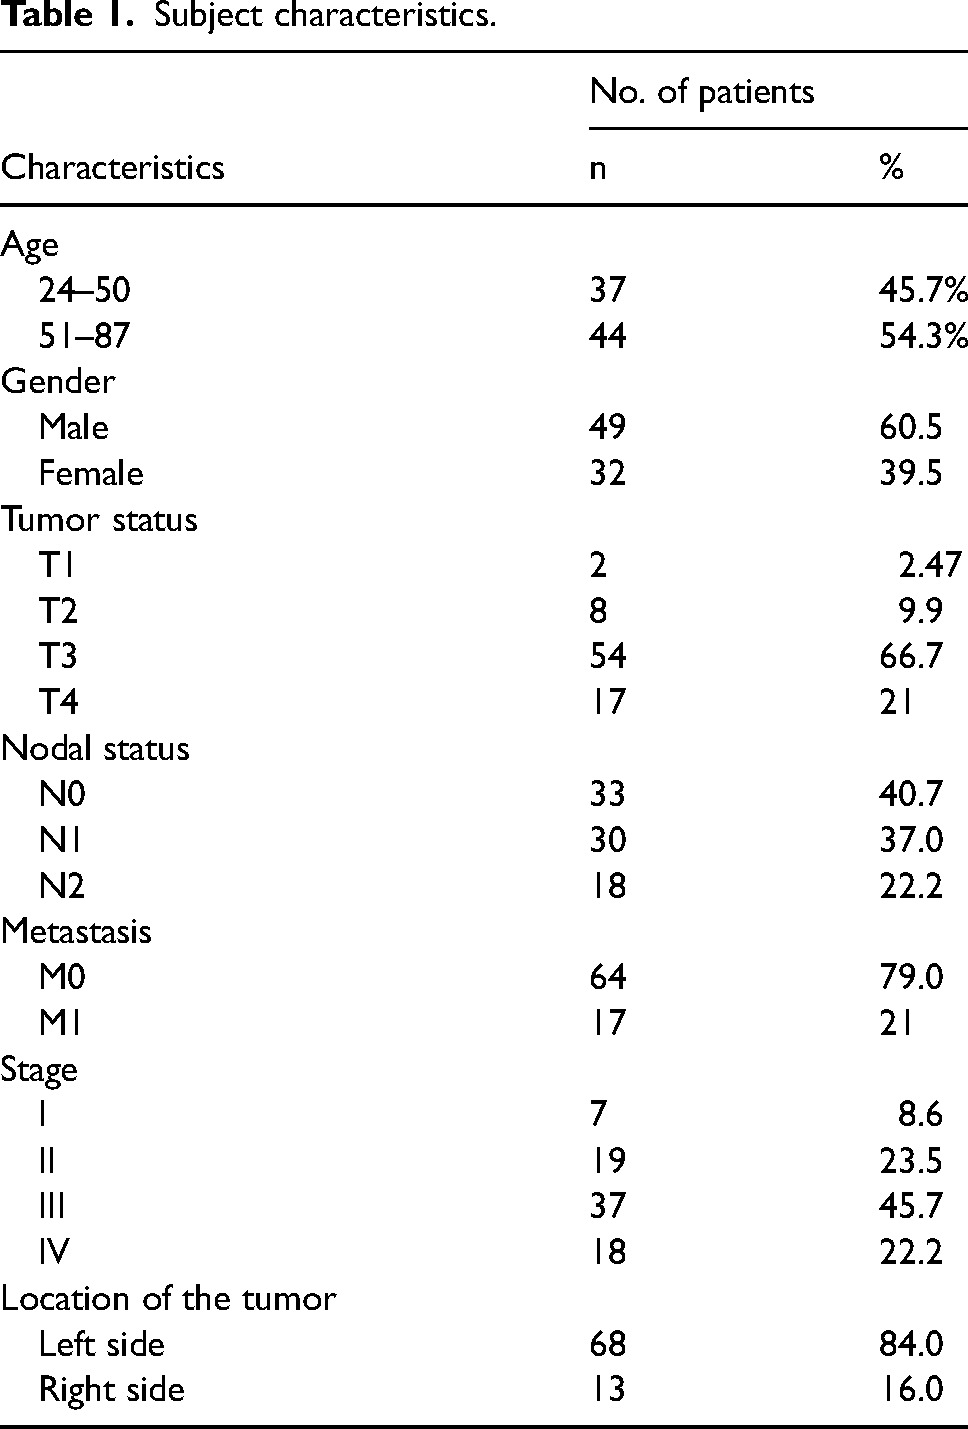
A total of 442 colorectal adenocarcinoma patients were registered and underwent surgery between January 2017 and December 2019. Subjects who fulfilled the inclusion criteria and agreed to participate reached 89 patients. However, 8 patient samples were not eligible for evaluation, leaving a total of 81 subjects analyzed for PTEN expression in patients with CRC. The age of the subjects ranged between 24 and 87 years old, with a mean of 53.4 (±15.2) and a median of 55 years old. Most patients were male (60.5%), most of them had stage III CRC (45.7%) with penetration of T3N1M0, and most of the tissue samples were located on the left side (84%). (Table 1)
Subject characteristics.
PTEN expression status
PTEN expression was seen through immunohistochemical staining continued by calculating its color intensities. Figure 1 shows the cytoplasmic color intensity of PTEN in both tumor and non-tumor tissues, showcasing a light brown color for weaker PTEN, a light–dark brown color for moderate PTEN expression of tumor tissue, and a dark brown color for strong PTEN expression of a tumor tissue. Staining intensities were quantified and split into two groups using a ROC cut-off at 199.0. Results showed weak PTEN expression was 72.9% in tumor tissues and 24.7% in non-tumor tissues, while strong expression was found at 27.1% and 75.3% in tumor and non-tumor tissues, respectively. After a statistical evaluation was done, it was found that the P value was < 0.001 (Table 2).
PTEN expression in tumor and non-tumor tissues.
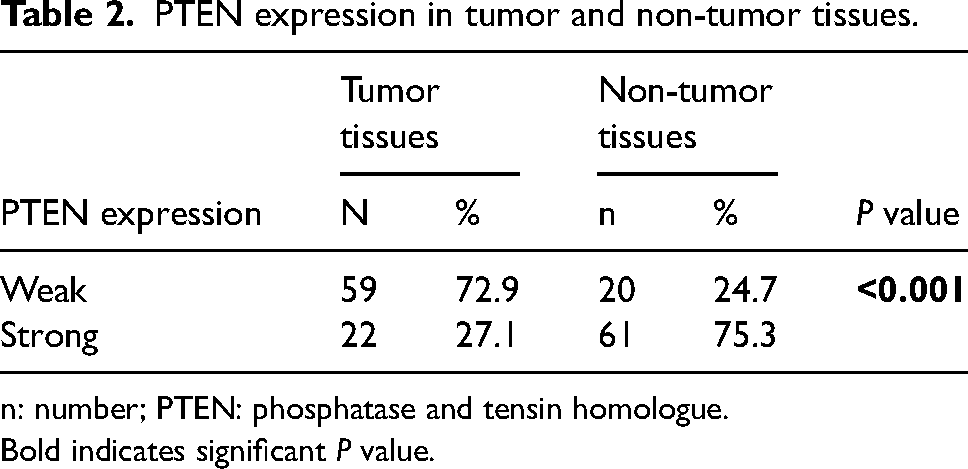
n: number; PTEN: phosphatase and tensin homologue.
Bold indicates significant P value.
When PTEN expression was analyzed with tumor penetrance, based on the tumor node metastasis (TNM) staging, it showed weak PTEN expression, which was found mostly in T3 tumor tissues (49.4%) with a P value of 0.367. Most weak PTEN expressions were also found in M0 tumor tissues (54.3%), and strong PTEN expression (24.7%) with P = 0.252. On the other hand, weak PTEN also showed a high percentage in nodal status N1 (P < 0.001). Weak PTEN was also superior in stage III of CRC, with a statistically significant result (P = 0.005). Based on tumor location, it showed that most tumor tissues with PTEN expression were located on the left side; specifically, 59.3% of the weak expression of PTEN was found in the tumor tissues located on the left side, and strong expression was also located mostly on the left side (24.7%). Furthermore, the right side showed a higher proportion of weak PTEN (12.3%; P = 0.643 (Table 3). We also analyzed the correlation between TNM status and stage with PTEN expression. We found significant correlation between nodal status with PTEN (P = 0.008) and stage with PTEN (P = 0.019).
PTEN expression based on tumor penetration and location and correlation analysis.
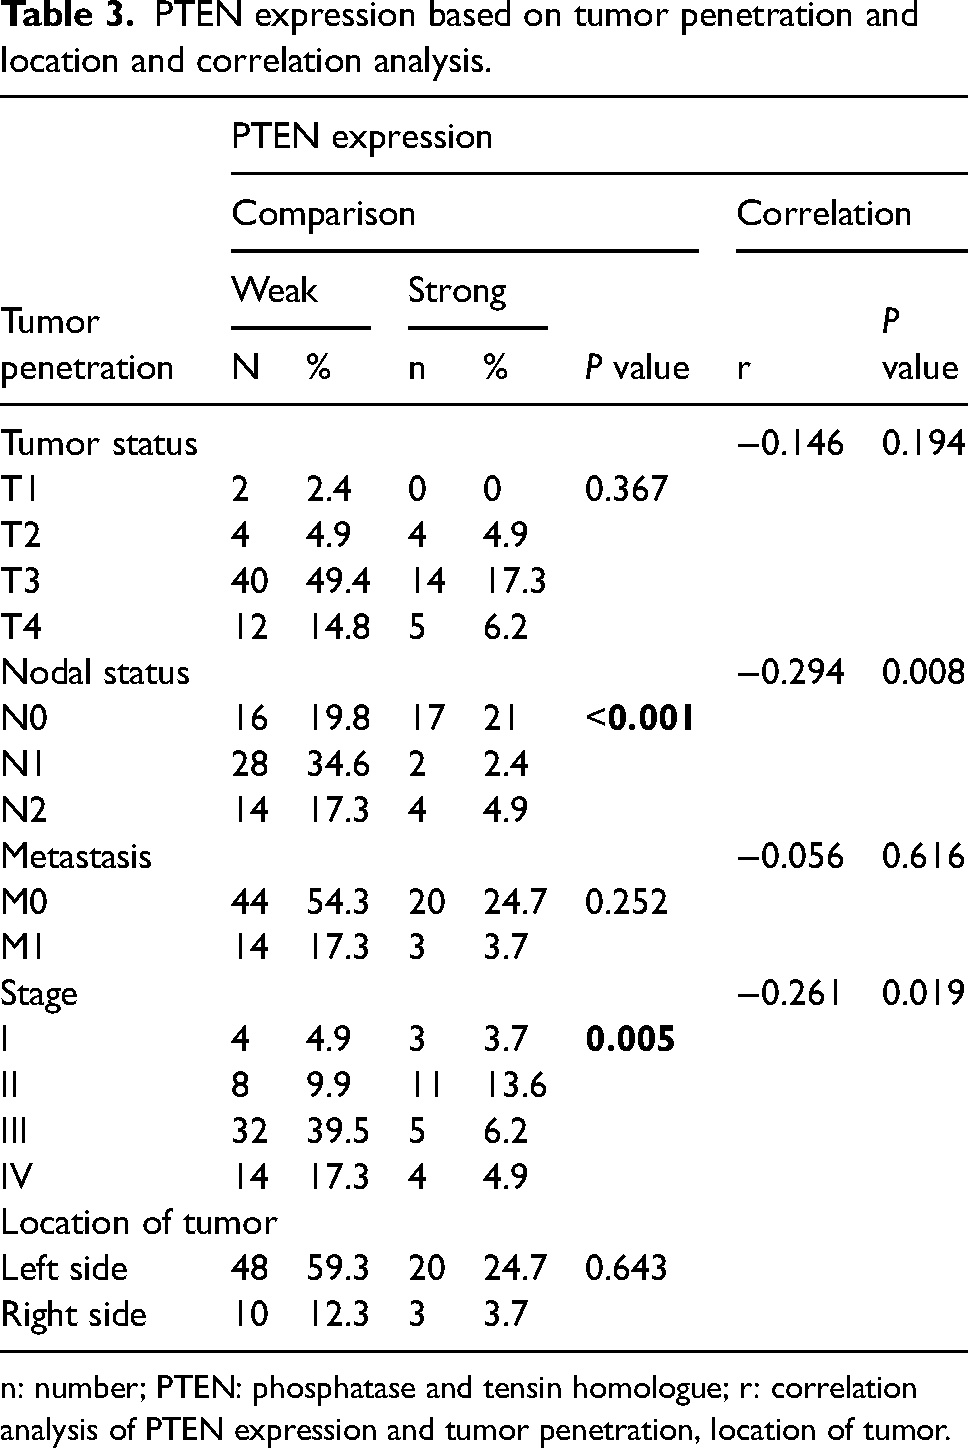
n: number; PTEN: phosphatase and tensin homologue; r: correlation analysis of PTEN expression and tumor penetration, location of tumor.
Discussion
PTEN is one of the tumor suppressor biomarkers acting through the PI3K pathway. PTEN works as a negative regulator, converting phosphatidylinositol-4,5-bisphosphate (PIP2) to phosphatidylinositol-34,5-triphosphate (PIP3), exerting direct influence on downstream pathway activities by antagonizing PI3K activity. Its effects were found in this study, where a low number of PTEN was significantly higher in tumor tissues. 12
This study discovered PTEN value > 199.0 classified as strong, while values ≤ 199.0 deemed weak with sensitivity 0.753 and specificity 0.728 (Figure 2). Meanwhile, the study by Ágoston et al. 24 had its own value of sensitivity and specificity (61% and 70%; respectively) by using immunohistochemical staining through three different PTEN antibodies.
In this study, most of the patients were men, with the majority having tumor penetration of T3N1M0 and stage III CRC (Table 1). Table 2 shows the PTEN expressions based on the cut-off we found (Figure 2), and most of the tumor tissues had a higher value of weak PTEN expression (72.9%); the remaining 27.1% had strong PTEN expression after immunohistochemical staining. These results showed a significant value that confirms the effect of PTEN in tumor tissues, especially in CRC. The low expression of PTEN in tumor tissues has been reported in many cases and proves the effect of PTEN in the development of cancer and, moreover, in the PI3K pathway.17,18,21,25 This study was in accordance with the research conducted by Yazdani et al. 18 investigating the prognostic effect of PTEN expression using semiquantitative assessment that divided the expression based on the PTEN immunostaining tumor cells with a scoring system between 0 for <5, 1 + for 5–25, 2 + for 25–50, and 3 + for >50%. The results showed that PTEN expression in CRC tissues was lower with statistically significant result (P < 0.001) compared to non-cancerous mucosa.
In this study, PTEN expression was analyzed according to tumor tissue location, where most of them were located on the left side, and a majority of weak PTEN expression was also found on the left side. However, a higher proportion of weak PTEN expression was found on the right side. Despite this, these results were not statistically significant, with a P value of 0.643 (Table 3). Consequently, it can be concluded that the measurements of PTEN expression using the cut-off value were not applicable based on tumor location. Another study showed that utilizing immunohistochemical staining to determine tumor location (specifically in the rectum and colon) and an intensity measurement grouped between loss and intact had a P value of 0.200, which was considered not statistically significant. 26
Noh et al., 19 who classified the expression of PTEN in prostate cancer to predict recurrence, calculated the expression of PTEN based on the three-tiered system (grades 0–3) and divided the results into two groups (grades 0–1 for low and 2–3 for high). The study showed that if compared with parameters such as age, PSA (Prostate-Specific Antigen), tumor volume, staging, margin, and more, only a couple of parameters showed P < 0.05—notably tumor volume, Gleason score, biochemical recurrence, and transcriptional regulator ERG (ERG).
On the other hand, Shroff et al. 22 who investigated the expression of PTEN for the prognosis in patients with ampullary adenocarcinoma by measuring low and high PTEN expression with a cut-off of 100 between the groups, found that tumors with low PTEN expression had a better overall survival compared to the patients with high PTEN expression. Patients with low PTEN tumors had shorter disease-free survival and overall survival compared to tumors with high PTEN, though this was not statistically significant.
We also analyzed the correlation between tumor, nodal, metastasis status and stage with PTEN expression (Table 3). We found a significant correlation between nodal status and stage with PTEN. These results are consistent with a study by Mirzapour Abbas Abadi et al., 12 which concluded that a loss of PTEN expression was positively related to lymph node metastasis (P = 0.002) and advanced tumor stage (P = 0.016). Another study by Liu et al. 27 also showed a negative correlation between PTEN expression with tumor size and metastasis. In addition, a study by Yazdani et al. found that positive PTEN expression was positively correlated with an advanced tumor stage (P = 0.011) and negatively correlated with tumor size (P = 0.007).21
Throughout other studies, there was not much evidence that supported the standardization of PTEN expression cut-off values to classify them as a potential reliable biomarker for cancer, especially CRC, due to the low value of statistical significance. However, we should keep in mind that most of the results consistently showed how the expression of PTEN influenced cancer development. Previous studies also did not show any methods used in determining PTEN diagnostic performance.
This study focused on the use of PTEN as a future biomarker. We found the cut-off value of PTEN, which can be used as a predictor for targeted therapies. There are limitations to this study. First, the research design only looks at the time values of the variables being examined, so they do not describe the processes that occur when the variables change. Second, this study only examined the expression of the PTEN protein in the PI3K pathway, so the effect of other proteins that interact with PTEN in inhibiting the progression of CRC is unknown. Finally, the non-linear pathways examined can be influenced by other pathways, so further research needs to be done.
Conclusion
Semiquantitative assessment with cell counting multiplied by immunohistochemical staining intensity is an effective method in determining PTEN expression. This is considered a novel method resulting in new PTEN cut-off value 199.0. The value > 199.0 was classified as strong expression and ≤ 199.0 as weak. This can be useful as both a predictive and prognostic biomarker in CRC.
Footnotes
Declaration of conflicting interests
The author(s) declared the following potential conflicts of interest with respect to the research, authorship, and/or publication of this article: This original research has been conducted according to the World Medical Association Declaration of Helsinki.
Funding
The author(s) received no financial support for the research, authorship, and/or publication of this article