
Abstract
Background
The comprehensive expression level and potential molecular role of Cyclin A2 (CCNA2) in uterine corpus endometrial carcinoma (UCEC) remains undiscovered.
Methods
UCEC and normal endometrium tissues from in-house and public databases were collected for investigating protein and messenger RNA expression of CCNA2. The transcription factors of CCNA2 were identified by the Cistrome database. The prognostic significance of CCNA2 in UCEC was evaluated through univariate and multivariate Cox regression as well as Kaplan–Meier curve analysis. Single-cell RNA-sequencing (scRNA-seq) analysis was performed to explore cell types in UCEC, and the AUCell algorithm was used to investigate the activity of CCNA2 in different cell types.
Results
A total of 32 in-house UCEC and 30 normal endometrial tissues as well as 720 UCEC and 165 control samples from public databases were eligible and collected. Integrated calculation showed that the CCNA2 expression was up-regulated in the UCEC tissues (SMD = 2.43, 95% confidence interval 2.23∼2.64). E2F1 and FOXM1 were identified as transcription factors due to the presence of binding peaks on transcription site of CCNA2. CCNA2 predicted worse prognosis in UCEC. However, CCNA2 was not an independent prognostic factor in UCEC. The scRNA-seq analysis disclosed five cell types: B cells, T cells, monocytes, natural killer cells, and epithelial cells in UCEC. The expression of CCNA2 was mainly located in B cells and T cells. Moreover, CCNA2 was active in T cells and B cells using the AUCell algorithm.
Conclusion
CCNA2 was up-regulated and mainly located in T cells and B cells in UCEC. Overexpression of CCNA2 predicted unfavorable prognosis of UCEC.
Introduction
Uterine corpus endometrial carcinoma (UCEC) is a primary gynecologic malignant disease—the second most common gynecologic malignancy in the world—and has high mortality.1,2 Studies have suggested that obesity elevates the risk of suffering from UCEC. 3 The global incidence and mortality rates of UCEC are alarming. According to GLOBOCAN statistics, in 2020, there were approximately 420,000 new cases and 974,000 deaths worldwide. 4 UCEC is ranked fourth in terms of fatality rates after breast cancer, rectal cancer, and lung cancer. 4 Due to predictive symptoms, most UCEC patients are able to be diagnosed in the early stage of the disease and have good prognosis after surgical resection, with 5-year survival rates at 90%. 5 However, although advanced or recurrent UCEC patients have been shown to benefit from adjuvant therapies like chemotherapy, radiotherapy, or endocrine therapy, the prognosis in such cases remains worrisome, and the 5-year survival rate of advanced UCEC patients is often as low as 17%.6–8 Currently, the prognostic prediction for UCEC patients is still limited to some clinicopathological parameters, such as age, the International Federation of Gynecology and Obstetrics (FIGO) stage, and pathological subtypes. 9 Patients at the same clinical stage show different clinical features such that these features cannot be used to completely accurately judge the prognosis of UCEC patients. 10 Most studies have reported that some changeable genes and molecules influence UCEC prognosis. 11 Therefore, identifying effective biomarkers is essential for UCEC diagnosis, prognostic prediction, and the provision of accurate UCEC therapy. 3
Cyclin A2 (CCNA2) is situated on the human chromosome 4 Q27 region with a full length of 7489 bp and is expressed throughout the human body. 12 The protein encoded by CCNA2 has the ability to activate cyclin-dependent kinase 2 (CDK2), which promotes the transition from the G1 to the S phase and from the G2 to the M phase. 13 In the cell cycle S phase, the CCNA2/CDK2 complex can phosphorylate some pivotal factors of DNA replication like CDC6 that are important for the initiation of DNA replication. 14 The CCNA2/CDK2 complex participates in cancer proliferation through phosphorylating some cancer proteins, and the high expression of CCNA2 accelerates cancer cell growth and chemoresistance once a tumor has formed.12,14 Current studies have reported that CCNA2 contributes to cancer cell proliferation in multiple tumors like lung cancer, breast cancer, and esophageal carcinoma.15–17 Nevertheless, Lee et al. 18 confirmed that the expression of CCNA2 rendered gastric cancer cell lines sensitive to PKI-1 inhibitors, and CCNA2 knockdown made gastric cell lines resistant to PKI-1 inhibitors. However, there are few reports on the relationship between CCNA2 and UCEC progression. Jiang et al. 12 utilized the Oncomine database to analyze the expression level of CCNA2 between pan-cancer and corresponding normal tissues and found that CCNA2 had higher expression in UCEC than in normal tissues. This provoked our consideration as to whether CCNA2 promotes UCEC progression.
In this study, we intended to analyze CCNA2 expression by utilizing large samples from a public database and in-house clinical UCEC samples. Additionally, we have examined the clinical significance of CCNA2 in UCEC, investigated the components of UCEC, and explored the relationship between the expression of CCNA2 and the UCEC immune environment, as well as the tumor mutation burden (TMB). The study design is shown in Supplemental Figure 1.
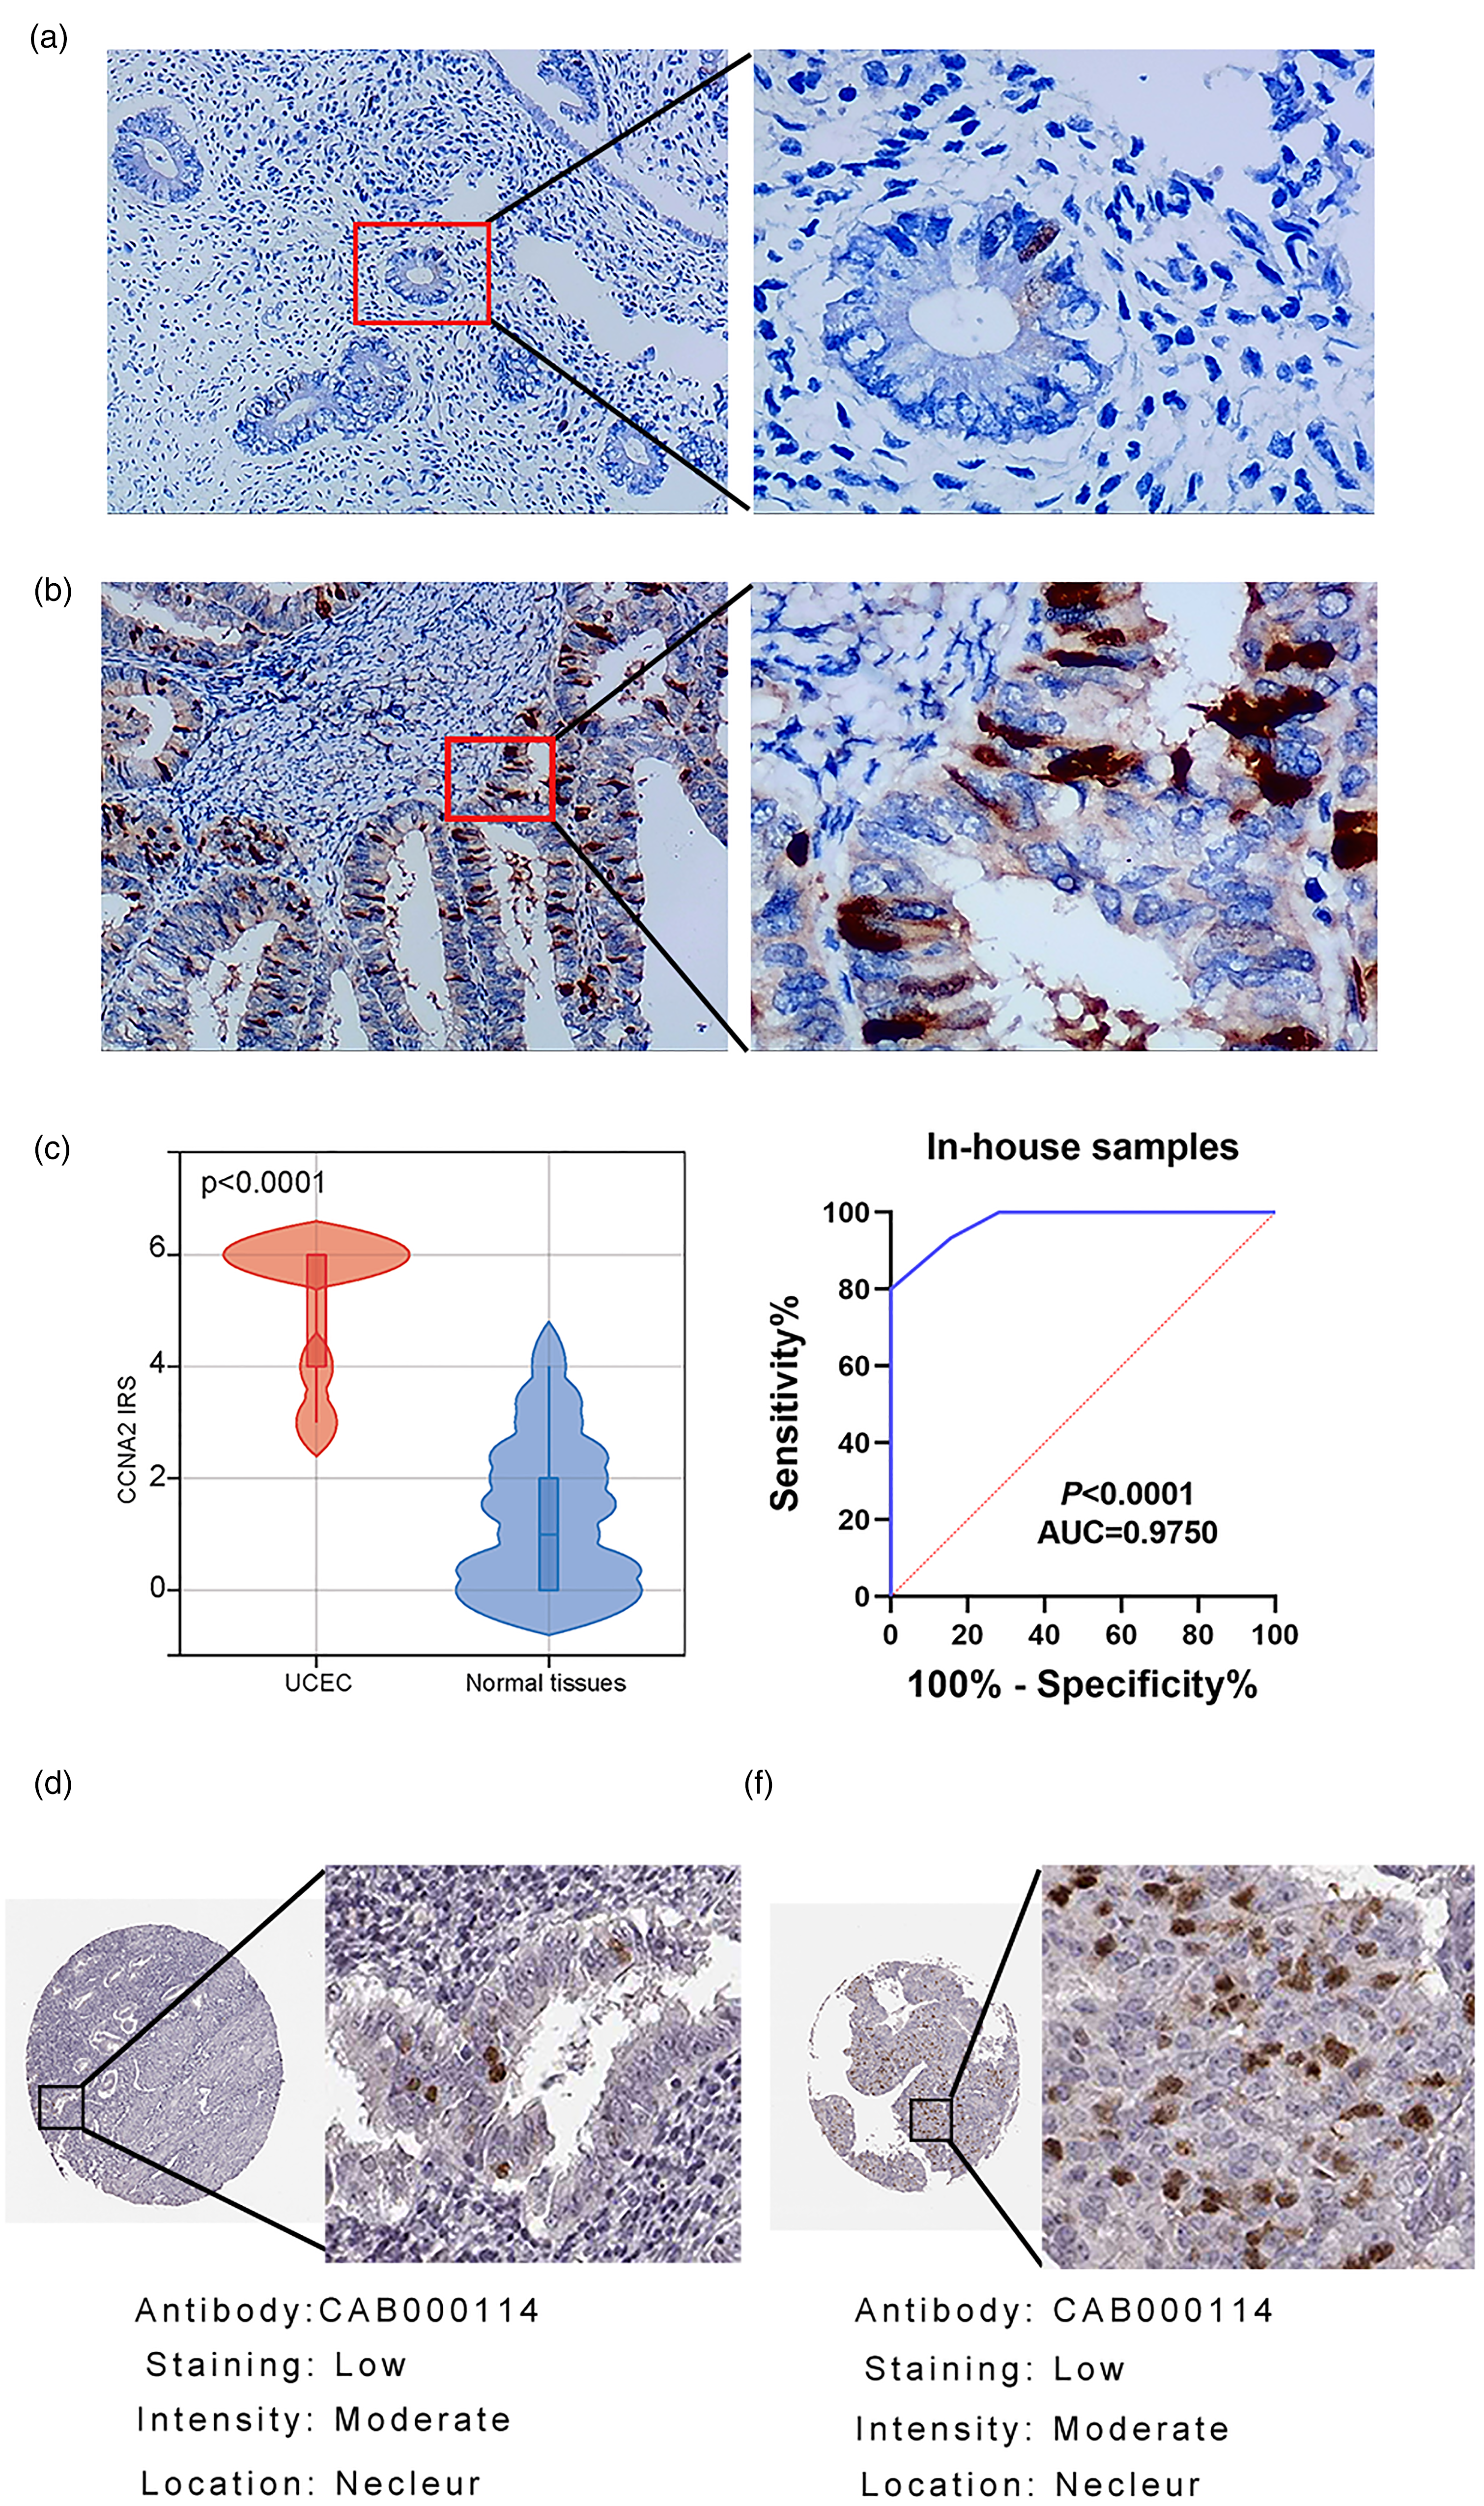
The protein expression of CCNA2. (a) Immunohistochemistry (IHC) for investigating the protein level of CCNA2 in normal endometrial tissues. (b) IHC for investigating the protein level of CCNA2 in UCEC tissue. (c) to (d) The protein level of CCNA2 was higher in UCEC tissues compared with normal endometrium tissues. (e) to (f) The expression of CCNA2 protein was overexpressed in UCEC compared to that in normal endometrial tissue using the Human Protein Atlas (THPA) database.
Materials and methods
In-house sample acquisition and data collection from public databases
We collected in-house UCEC tissues and normal endometrial tissues from the First Affiliated Hospital of Guangxi Medical University according to the following criteria: (a) All samples originated from surgical resection, and diagnoses were confirmed by pathological examination; (b) the UCEC patients did not receive radiotherapy, chemotherapy, or other related treatments; (c) the UCEC patients did not progress to metastatic disease; and (d) the clinical records of the patients were intact. Also, we collected samples from public databases: The Cancer Genome Atlas (TCGA), Gene Expression Omnibus (GEO), International Cancer Genome Consortium (ICGC), Genotype-Tissue Expression (GTEx) and ArrayExpress using the keywords “Uterine corpus endometrial carcinoma”. As shown in Supplemental Figure 2, we observed the following selection criteria: (a) The samples belonged to homo sapiens; (b) the series matrix contained UCEC samples and their control samples, or included either the former or the latter, which could eventually be merged into one series matrix including UCEC samples and their control samples; and (c) the enrolled samples in public datasets were not treated by physical, chemicals, and other treatments. Additionally, the clinical information of patients in the enrolled microarray datasets was collected. This information was required to include survival status, survival time, and some clinicopathological parameters such as age, clinical stages, and malignancy grades, among others.
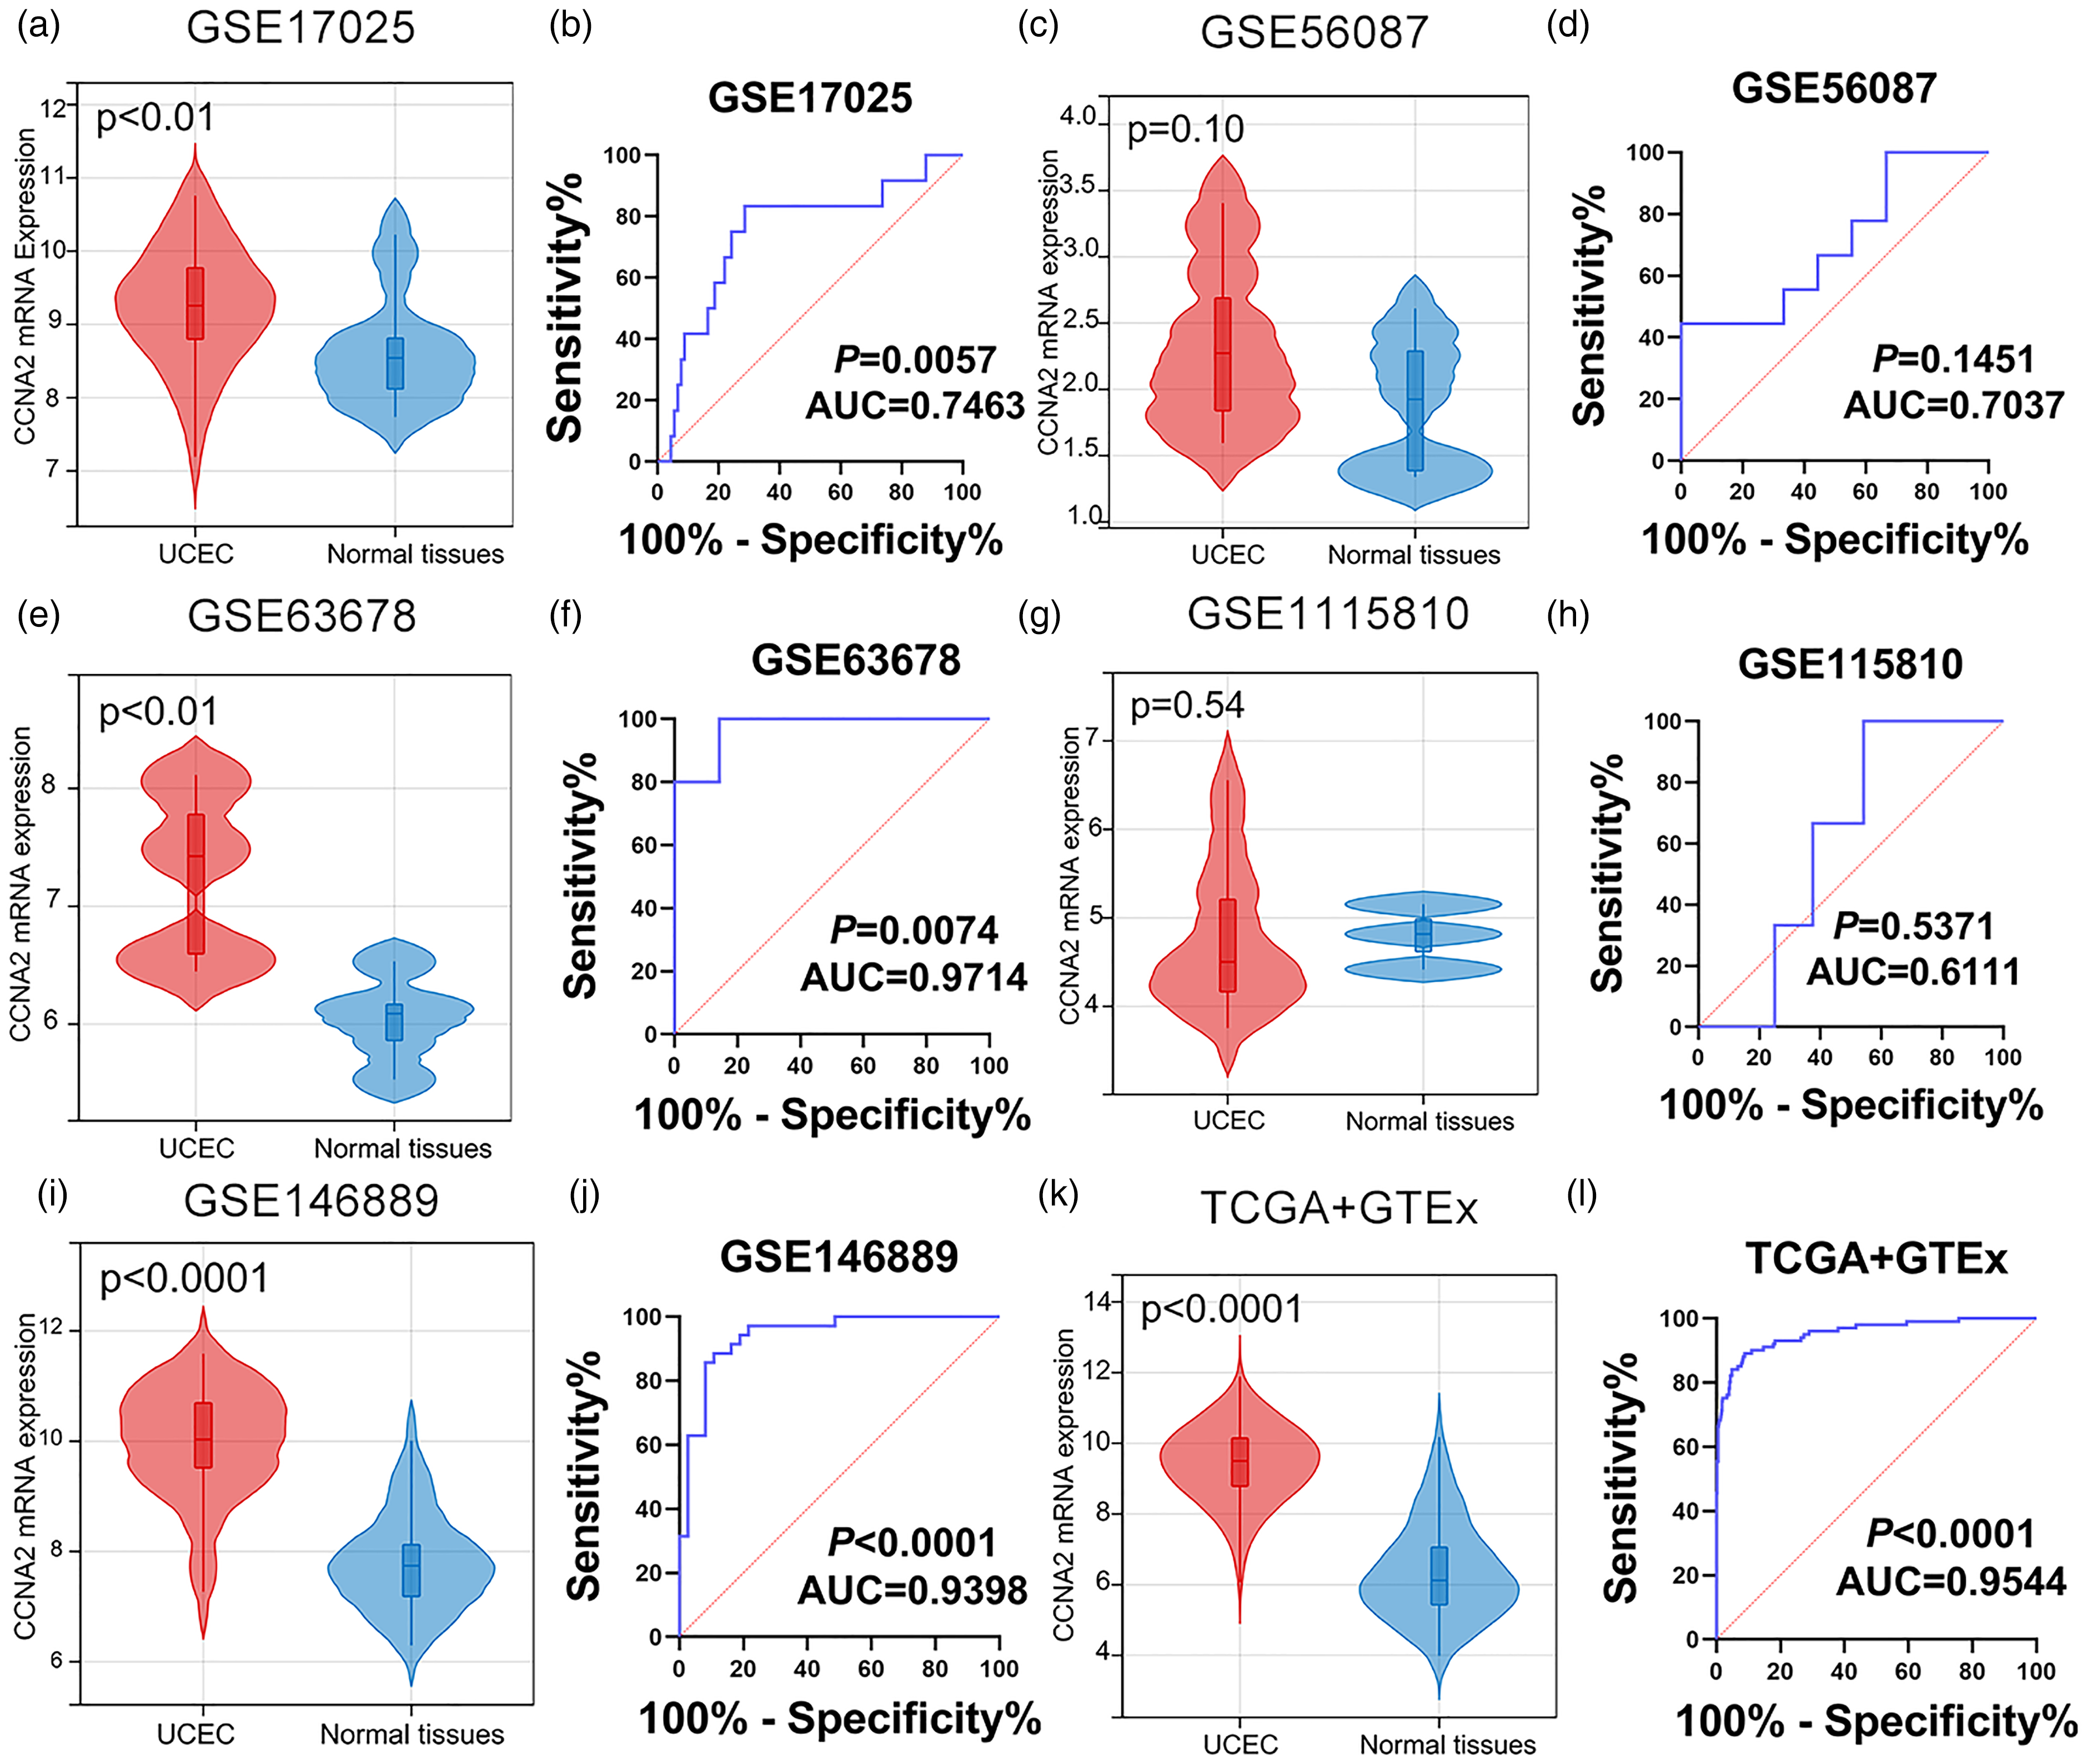
mRNA expression level of CCNA2. (a) to (l). The mRNA expression level of CCNA2 was compared between UCEC tissues and normal endometrial tissues in the six datasets from the public database.
Data processing and positive-correlated genes of CCNA2 identification
To replenish the lack of UCEC samples or the corresponding normal samples, some series matrices were merged and normalized via the dplyr and sva R packages. The series matrix of the enrolled microarray datasets from TCGA, GEO, ICGC, GTEx, and ArrayExpress databases was conducted via log2(x + 1) conversion. Then, the differential expressed analysis was carried out by running the limma packages, and the genes with |log2FC| > 1 and P < 0.05 were considered as the differential expressed genes (DEGs). In order to integrate the DEGs from the whole enrolled datasets, the standardized mean differences (SMDs) were calculated, and the DEGs with P < 0.05 and |SMD| > 0 were selected as up-regulated DEGs. The genes with the correlation coefficient r > 0.3 and P < 0.05 existing in three or more included series matrices were regarded as the positive-correlated genes of CCNA2 using Pearson correlation analysis. Finally, the up-regulated positive-correlated genes of CCNA2 in UCEC were obtained via intersecting the up-regulated DEGs with the positive-correlated genes of CCNA2 for further analysis.
Protein–protein interaction network and enrichment analysis
In order to explore the biological role and pathway associated with the up-regulated positive-correlated genes of CCNA2, a gene set enrichment analysis was conducted, encompassing the utilization of Gene Ontology (GO) and Kyoto Encyclopedia of Genes and Genomes (KEGG). We utilized the expression files of CCNA2 together with the up-regulated positive-correlated genes of CCNA2 in the TCGA and GTEx databases for gene set enrichment analysis (GSEA). We explored the potential Reactome pathways through comparing the high-CCNA2 groups to the low-CCNA2 groups, as well as comparing the UCEC tissue groups to the normal endometrial tissue groups. The Reactome pathways with a P < 0.05 were identified. The gene sets including CCNA2 and the up-regulated positive-correlated genes of CCNA2 were applied for GO enrichment analysis. Furthermore, KEGG enrichment analysis was used for pathway enrichment analysis implemented by the clusterProfiler R package. The GO enrichment analysis was performed according to three aspects including biological process (BP), cellular component (CC), and molecular function (MF). The terms with a P < 0.05 were statistically significant. Ultimately, the top five terms pertaining to each of BP, CC, and MF as well as the top 10 KEGG pathways were visualized.
Immunohistochemistry
We utilized the enrolled in-house clinical samples to perform immunohistochemistry (IHC). The specific experimental operation has been elaborated in a published article. 15 The monoclonal anti-CCNA2 antibody (abcam, ab181591, rabbit-anti-human) was used as a primary antibody to detect the expression of CCNA2 protein in UCEC tissues and the corresponding normal tissues. The immunoreactivity scores (IRS) were calculated using the percentage of positive cells and staining intensity. A larger IRS represented more CCNA2 protein. Two sophisticated pathologists were independently devoted to calculating all IHC results. Ultimately, a comparison of IRS between UCEC samples and control samples were visualized. Additionally, the protein expression of CCNA2 in UCEC and normal endometrial tissues was retrieved from the Human Protein Atlas (THPA) database.
Expression analysis of CCNA2 in UCEC
Comparison of the messenger (mRNA) expression of CCNA2 between the UCEC tissues and normal endometrial tissues was performed based on our enrolled microarray datasets from the above public database by Wilcoxon signed-rank test or t-test. If two groups of the independent samples observed the normality and homogeneity of variance, a t-test was adopted. Otherwise, the Wilcoxon signed-rank test was used. The respective receiver operating characteristic (ROC) curves were drawn, and the area under curve (AUC) of each ROC curve was calculated. Then, the standard mean difference (SMD) model and a 95% confidence interval (95% CI) were conducted using the R package meta and STATA 12.0 to integrate the mRNA expression of CCNA2 in all the included datasets and the protein expression of CCNA2 in our in-house clinical samples. A random-effects model or fixed-effects model was selected considering the chi-square test. The random-effects model was chosen when high heterogeneity was presented (I2 > 50% or P < 0.05). Otherwise, the fixed-effects model was adopted.
Clinical and prognostic significance of CCNA2 in UCEC
We discussed the distinction of mRNA expression in various groups of clinical characteristics, such as age, clinical stage, and grade group, via Kruskal–Wallis test on the basis of the collected clinical information. Regarding the prognostic significance of CCNA2, the optimum cut-off was determined for the classification of the CCNA2-high and CCNA2-low expression groups. The Kaplan–Meier curve was depicted by applying the “survival” and “survminer” package. The log-rank test and Cox proportional hazards regression model were respectively utilized to calculate the statistical significance and hazard ratio (HR). Some clinical characteristics (e.g., age, histological subtypes, clinical stage, histological grade, mRNA expression of CCNA2, race, and microsatellite instability (MSI) score) were enrolled for univariate and multivariate Cox regression analysis. The univariate Cox regression analysis was utilized to investigate the prognostic factors of UCEC. The multivariate Cox regression analysis was used to determine the independent prognostic factors of UCEC.
Transcription process of CCNA2
The potential transcription factors (TFs) of CCNA2 were obtained from the Cistrome database. To identify the predicted TFs of CCNA2 in UCEC, we intersected the up-regulated positive-correlated genes of CCNA2 with all the potential TFs of CCNA2 in the Cistrome database (DB), and the overlapping genes were considered to be the predicted TFs regulating the transcription process of CCNA2 in UCEC. The expression of the identified potential TFs was examined. The data of chromatin immunoprecipitation-sequencing (ChIP-seq) from the Cistrome DB were utilized to verify whether there were ChIP-seq peaks in the identified TFs around the upstream transcription start site of CCNA2. The motifs of the identified TFs were obtained from the JASPAR DB, and the seqLogos of the motifs were visualized. At the same time, the relationship between the expression of CCNA2 and the expression of the identified potential TFs in the “TCGA + GTEx” datasets were explored. The protein expression of the identified potential TFs in UCEC and normal endometrial tissues was investigated using the THPA DB.
Single-cell RNA sequencing (ScRNA-seq) and AUCell analysis
Single-cell technology has been an indispensable approach for probing cell types, investigating the heterogeneity of tumor immune microenvironments, supporting the exploration of highly variable genes, and shedding light on intercellular communication. 19 Single-cell RNA sequencing (ScRNA-seq) analysis was employed to explore the primary cell types of UCEC and investigate the expression of CCNA2 in cell types of UCEC. The datasets for the scRNA sequencing analysis were collected from the GEO database using the search term “Single-cell OR scRNA AND Uterine Corpus Endometrial Carcinoma”. The enrollment criteria of the datasets included UCEC samples that were not exposed to any physical and chemical factors, among others. The Seurat R package was used for scRNA sequencing analysis. First, cells with gene counts < 500, gene counts > 6000, and mitochondrial genes > 20% were removed. Second, the enrolled datasets were normalized and scaled using the “NormalizeData” and “ScaleData” functions in the Seurat R package, respectively. Third, principal component analysis was conducted, as well as uniform manifold approximation and projection analysis for dimension reduction with a resolution of 0.5. Finally, cell clusters were determined using the “FindClusters” function, and the annotation for the cell clusters was implemented using the SingleR R package. The expression of CCNA2 and its potential TFs was examined in every cell type. The relationship between the expression of CCNA2 and its potential TFs was investigated within the same cell types. As a statistical method, AUCell is capable of recognizing whether a given gene set was enriched with single cells based on the quantile of a ranked gene signature. 20 The utilization of AUCell analysis proves to be a highly efficient approach in identifying cells that exhibit active expression of CCNA2 and its up-regulated genes. The gene sets including CCNA2 and its up-regulated positive-correlated genes were used for AUCell analysis to assess the activity of these genes in the cell types that were identified in the scRNA data. A higher AUC value of the CCNA2 and up-regulated positive-correlated genes represented a higher gene expression level in each cell group. The function “AUCell_buildRankings” in the AUCell R package was applied to build gene expression rankings for each cell. The threshold was set to recognize the genes set active cells using the function “AUCell_exploreThresholds” in the AUCell R package.
Cellchat analysis
The CellChat R package was designed for analyzing intercellular communication, identifying the ligand-receptor pairs, and inferring the cell-state-specific signaling communications in a given scRNA sequencing data item based on the database CellChatDB. 21 To enlighten whether there is link or communication between similar or dissimilar cell types which actively expressed CCNA2 and its up-regulated genes. The enrolled scRNA datasets were utilized for CellChat analysis. First, overexpressed signaling genes associated with each cell group and overexpressed ligand-receptor interactions (pairs) within the used CellChatDB were identified in the enrolled scRNA data. Next, the probability/strength between any interacting cell groups was calculated using the function “computeCommunProb” in the CellChat R package. Finally, the communication network was aggregated by counting the number of links or summarizing the communication probability.
Immune infiltration analysis
The tumor immune microenvironment is of great importance to UCEC development and metastasis. 22 Considering the close relationship between tumor immune microenvironment and UCEC, we implemented the ESTIMATE algorithm to explore the relationship between the mRNA expression of CCNA2 and the stromal score, immune score, and tumor purity in UCEC tissues and normal tissue groups. The correlation was calculated by Spearman's correlation analysis. Additionally, the CIBERSORT algorithm was used to evaluate the 22 kinds of immune cell infiltration between the CCNA2-high and CCNA2-low expression groups, which were divided by the median of CCNA2 mRNA expression. Then, the correlations between the mRNA expression of CCNA2 and the fractions of the 22 kinds of immune cells were performed.
Immunophenoscore analysis
Immunophenoscores (IPS) ranging from 0 to 10 were calculated based on gene expression without bias using machine learning methods in representative cell types. This process allowed for the prediction of the response of the patients to immunotherapy, comprised of four main parts (effector cells, immunosuppressive cells, major histocompatibility complex molecules, and immunomodulators) to determine immunogenicity. 22 The higher the IPS was, the stronger the immunogenicity. To shed light on the relationship between CCNA2 and immunogenicity of UCEC, the IPS analysis was conducted. We downloaded the IPSs of UCEC patients from The Cancer Immunome Atlas. Then, the IPS were compared between the CCNA2-high and the CCNA2-low expression groups. The correlation between the IPS and mRNA expression of CCNA2 was calculated using Spearman's correlation analysis.
Mutation analysis
TMB has an intimate correlation with occurrence and progression of UCEC while the relationship between CCNA2 and TMB in UCEC remains unknown. To explore the correlation between CCNA2 and TMB in UCEC, we downloaded the single nucleotide polymorphism (SNP) mutation datasets and related donor information from the ICGC database. Then, the TMB was calculated via Rstudio software (version 4.1.2). The correlation between the TMB and mRNA expression of CCNA2 was calculated by Spearman's correlation analysis.
Results
In-house clinical samples and microarray dataset inclusion
A total of 32 UCEC tissues and 30 normal endometrial tissues were eligible and collected for IHC staining. Additionally, five datasets (GSE17025, GSE56087, GSE63678, GSE115810, and GSE146889) from the GEO database were downloaded. Meanwhile, two datasets from the TCGA and GTEx database were attained. The datasets from the TCGA database and the datasets from the GTEx database were merged into one series matrix and normalized to compensate for the normal endometrial tissue shortage in the datasets from the TCGA database. The merged series matrix was annotated as “TCGA + GTEx”. In aggregate, 720 UCEC and 165 normal endometrial tissues were included from the microarray datasets of the public database. The information of the enrolled microarray datasets from the public database is listed in Table 1.
Detailed information of the enrolled public datasets.
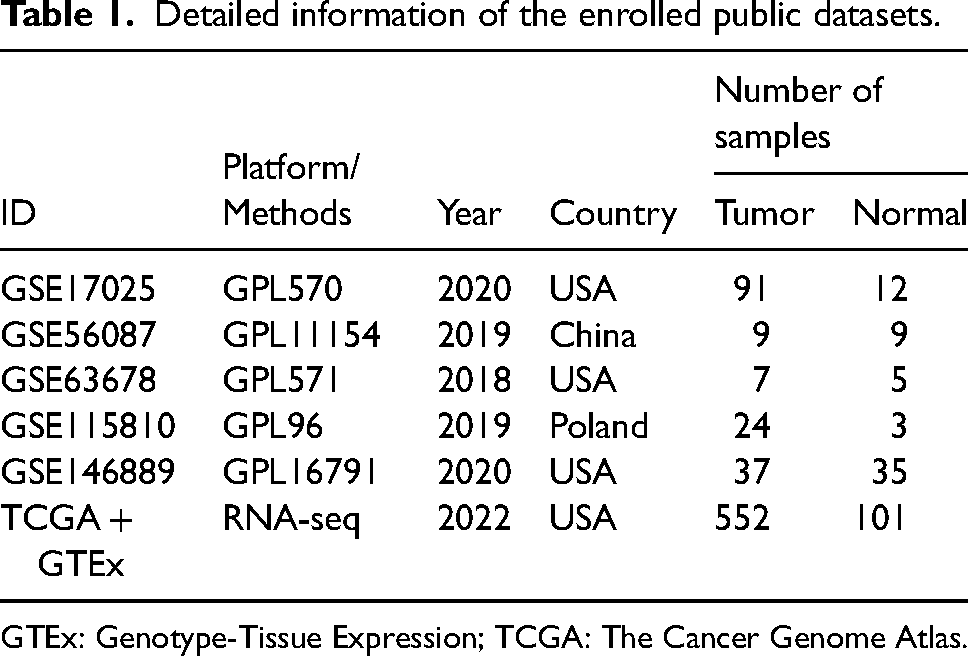
GTEx: Genotype-Tissue Expression; TCGA: The Cancer Genome Atlas.
Identification of up-regulated positive-correlated genes of CCNA2 in UCEC
After performing differential expression analysis and integrating the DEGs from the entire enrolled datasets, we obtained 3099 up-regulated DEGs and 2723 down-regulated DEGs. Furthermore, 863 positive-correlated genes of CCNA2 were screened. Eventually, 354 up-regulated positive-correlated genes of CCNA2 were identified for subsequent analysis via intersecting the up-regulated DEGs and positive-correlated genes of CCNA2 (Supplemental Figure 3(a)).
Potential mechanisms of CCNA2 and its up-regulated positive-correlated in UCEC
In the high-CCNA2 group and UCEC group, the reactome pathways in which CCNA2 and its up-regulated positive-correlated genes were involved were respectively performed (Supplemental Figure 3(b) and (c)). The results of the GO enrichment analysis demonstrated that CCNA2 together with its up-regulated positive-correlated genes were associated with cell division, mitotic spindle organization, cell cycle, DNA replication, and DNA repair in terms of BP as well as majorly functioning in the nucleus, nucleoplasm, cytoplasm, and membrane. CCNA2 and its positive-correlated genes may primarily exert their influence on MFs such as protein binding, ATP binding, identical protein binding, RNA binding, and DNA binding (Supplemental Figure 4(a)). Regarding KEGG pathways, CCNA2 and its up-regulated positive-correlated genes principally participated in one carbon pool by folate, DNA replication, cell cycle, Fanconi anemia pathway, homologous recombination, progesterone-mediated oocyte maturation, p53 signaling pathway, cellular senescence, carbon metabolism, human T-cell leukemia virus 1 infection, purine metabolism, diabetic cardiomyopathy, microRNAs in cancer, and metabolic pathways (Supplemental Figure 4(b)).
Expression and diagnostic significance of CCNA2 in UCEC
According to the IHC results, we found that the protein of CCNA2 was more highly expressed in the in-house UCEC tissues than in the control tissues; also, the protein expression of CCNA2 had significant diagnostic capacity in UCEC (Figure 1(a) to (d)). By browsing the THPA database, the protein expression of CCNA2 was confirmed to be up-regulated in UCEC (Figure 1(e) and (f)). Regarding the comparison of the mRNA expression of CCNA2 between UCEC and the control tissues, the mRNA expression of CCNA2 was more highly expressed in UCEC tissues in the datasets including GSE17025, GSE63678, GSE3678, GSE115810, and TCGA + GTEx. However, there was no statistical significance in GSE56087 and GSE115810 (Figure 2). Therefore, we integrated the expression of CCNA2 from the full microarray datasets and in-house samples using an SMD model. Due to the high heterogeneity (I2 = 94.4%, P < 0.05), the random-effects model was adopted. The SMD was 2.43, and the 95% CI was 2.23–2.64, revealing that CCNA2 were more highly expressed in UCEC tissues than in normal endometrial tissues (Figure 3(a)). The summary receiver operating (sROC) curve suggested that CCNA2 had significant prediction power in diagnosing UCEC (Figure 3(b)).
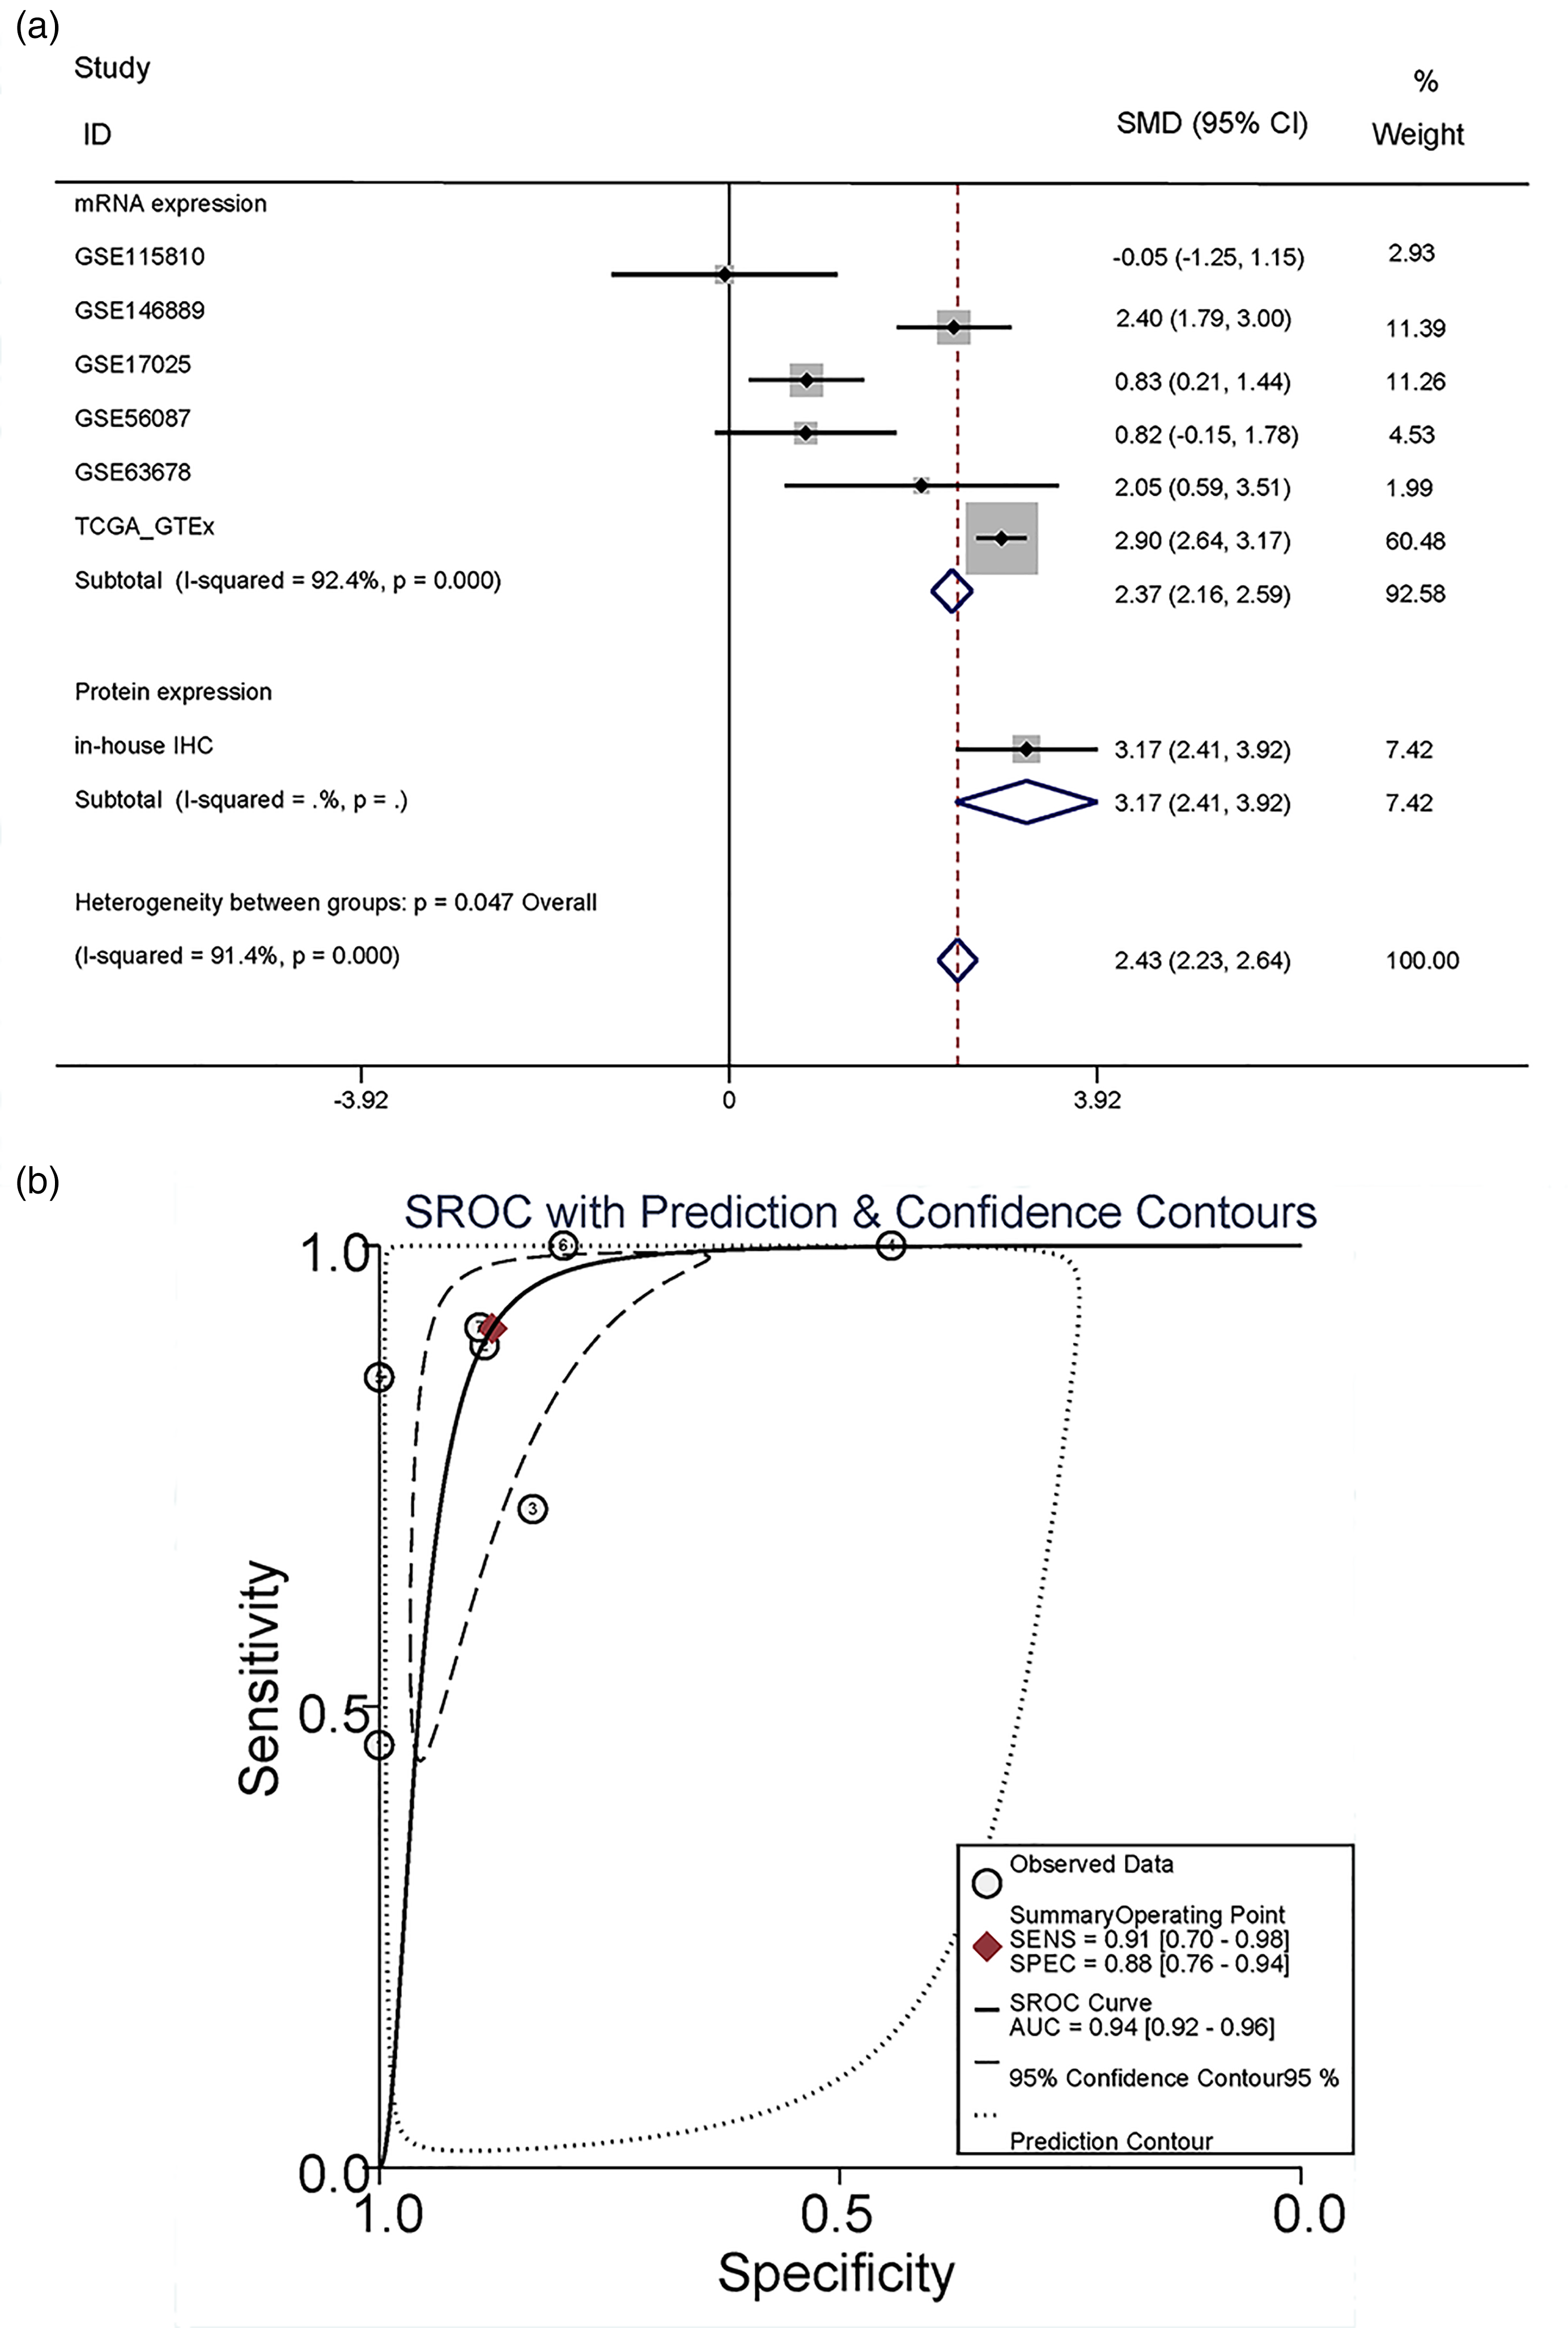
The expression level of CCNA2 comprehensively and sROC curve. (a) and (b) CCNA2 mRNA was more highly expressed in UCEC tissues than in normal tissues, shown via integrating all the data we collected; CCNA2 had diagnostic significance in UCEC.
Clinical significance and prognosis prediction of CCNA2 in UCEC
The enrolled patients were divided into two groups according to the boundary value of age 60 years, and we found that there was no prominent difference in the mRNA expression of CCNA2 between the two groups (Supplemental Figure 5(a)). In terms of the clinical stage groups, the mRNA expression of CCNA2 was more highly expressed in the patients at stage III than the patients at stage I (Supplemental Figure 5(b)). In the grade groups, the higher the grade, the higher the mRNA expression of CCNA2 (Supplemental Figure 5(c)). To explore the prognostic significance of CCNA2, the relationship between the mRNA expression of CCNA2 and the survival probability in UCEC was discussed. The results revealed that the CCNA2-high expression group had poorer survival probability than the CCNA2-low expression group (log-rank P = 0.0016, HR = 2.571) (Supplemental Figure 5(d)). The results of univariate Cox regression analysis shown that age, histological subtypes, clinical stage, histological grade and mRNA expression of CCNA2 were associated with a poor prognosis of UCEC. In the multivariate Cox regression analysis, the independent prognostic factors of UCEC were age, clinical stage and histological grade (Table 2).
The univariate and multivariate Cox regression analysis.
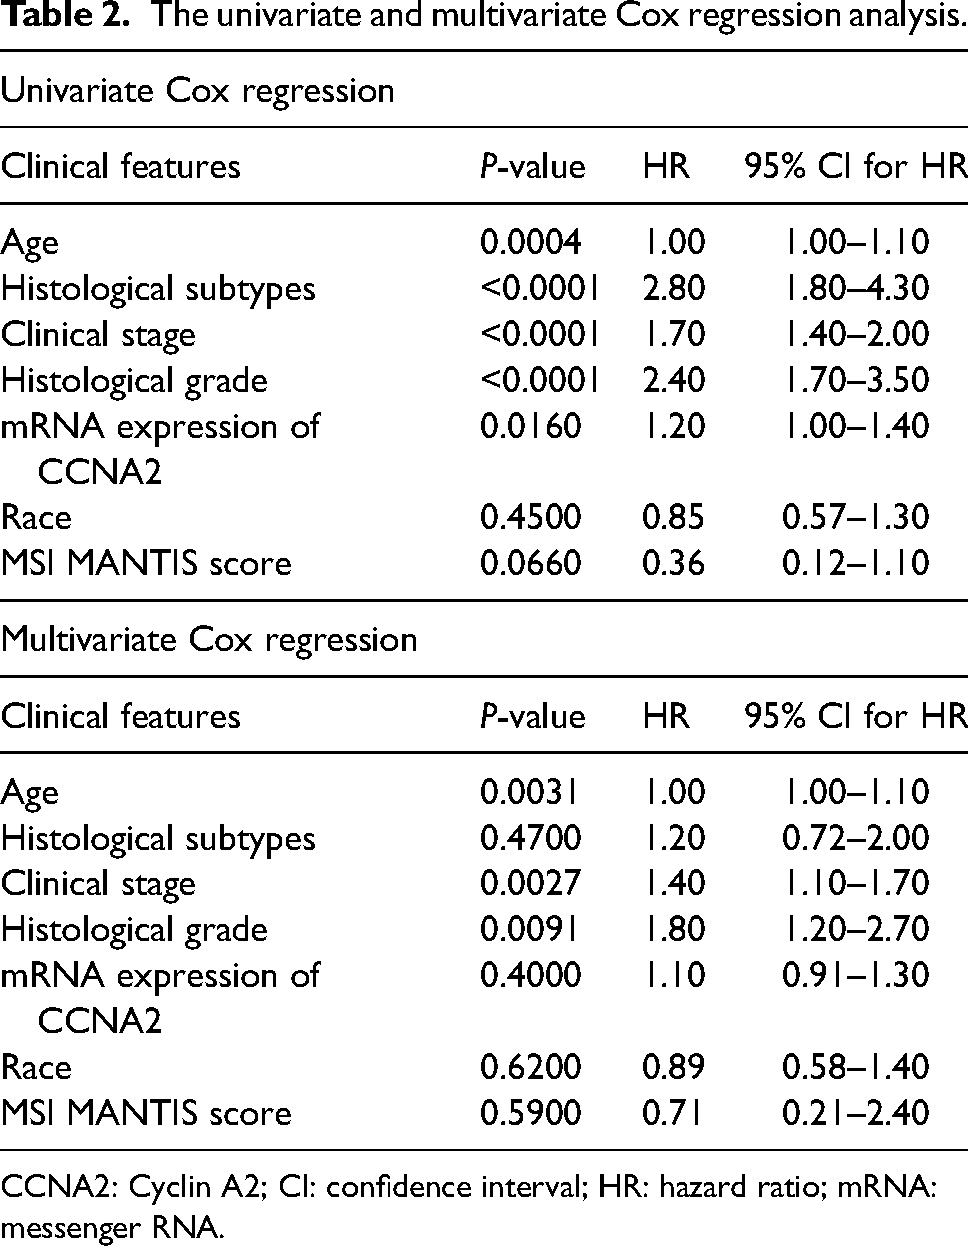
CCNA2: Cyclin A2; CI: confidence interval; HR: hazard ratio; mRNA: messenger RNA.
Transcription process of CCNA2 exploration
We intended to search for the potential TFs of CCNA2 in UCEC from up-regulated positive-correlated genes of CCNA2. Then we attained 84 possible TFs of CCNA2 from the Cistrome DB. Subsequently, we intersected 354 up-regulated positive-correlated genes of CCNA2 with 84 possible TFs from the Cistrome database; two TFs—the Forkhead box M1 (FOXM1) and E2F transcription factor 1 (E2F1)—were the potential TFs of CCNA2 in UCEC (Supplemental Figure 6(a)). E2F1 and FOXM1 were both up-regulated in UCEC through integrating the full public datasets we had collected (Supplemental Figure 6(b) and (c)). Additionally, the combined peaks of FOXM1 and E2F1 were presented in the transcription start sites of CCNA2 (Supplemental Figure 6(d) and (e)). Moreover, the potential binding motif of E2F1 in the sequence of CCNA2 was determined to be “GGGCGGGAG” via retrieving data from the JASPAR database (Supplemental Figure 6(f)). Unfortunately, the potential motif of FOXM1 in the sequence of CCCNA2 has not been identified. The mRNA expression of CCNA2 was positively correlated with the mRNA expression of FOXM1(r = 0.76, P < 0.0001) and E2F1(r = 0.62, P < 0.0001) (Supplemental Figure 7(a)). The protein expression of E2F1 was found to be up-regulated in UCEC tissue, while the expression of FOXM1 protein was highly expressed both in normal endometrial tissue and UCEC tissue (Supplemental Figure 7(b)).
Relationship between CCNA2 and cell types in UCEC
The scRNA dataset GSE193430 from the GEO database was obtained for scRNA sequencing analysis; 3363 cells in one UCEC sample were screened for further analysis. Five cell types: B cells, epithelial cells, monocytes, natural killer cells, and T cells were identified in UCEC (Figure 4(a)). The expression of CCNA2 was mainly examined in B cells and T cells (Figure 4(b) and (c)). In Figure 4(d), the axis of abscissas shows the AUC values and the axis of ordinates shows the number of cells (frequency) under every corresponding AUC value. The AUC histogram shows that the activity threshold was set at 0.14 (Figure 4(d)). The AUC values of more than 526 cells were over the activity thresholds of 0.14, which represented these cells, were on the status of our genes’ set including CCNA2 and its up-regulated genes. And these cells were mainly B cells and T cells. Therefore, the CCNA2 and its up-regulated positive-correlated genes were primarily active in B cells and T cells (Figure 4(e)). For the potential TFs of CCNA2, E2F1, and FOXM1 were also mainly expressed in B cells and T cells (Figure 5(a) and (b)). Therefore, the relationship between expression of E2F1, FOXM1, and CCNA2 was investigated in B cells and T cells. However, there was no correlation between expression of E2F1, FOXM1, and CCNA2 in B cells and T cells (Figure 5(c) to (f)).
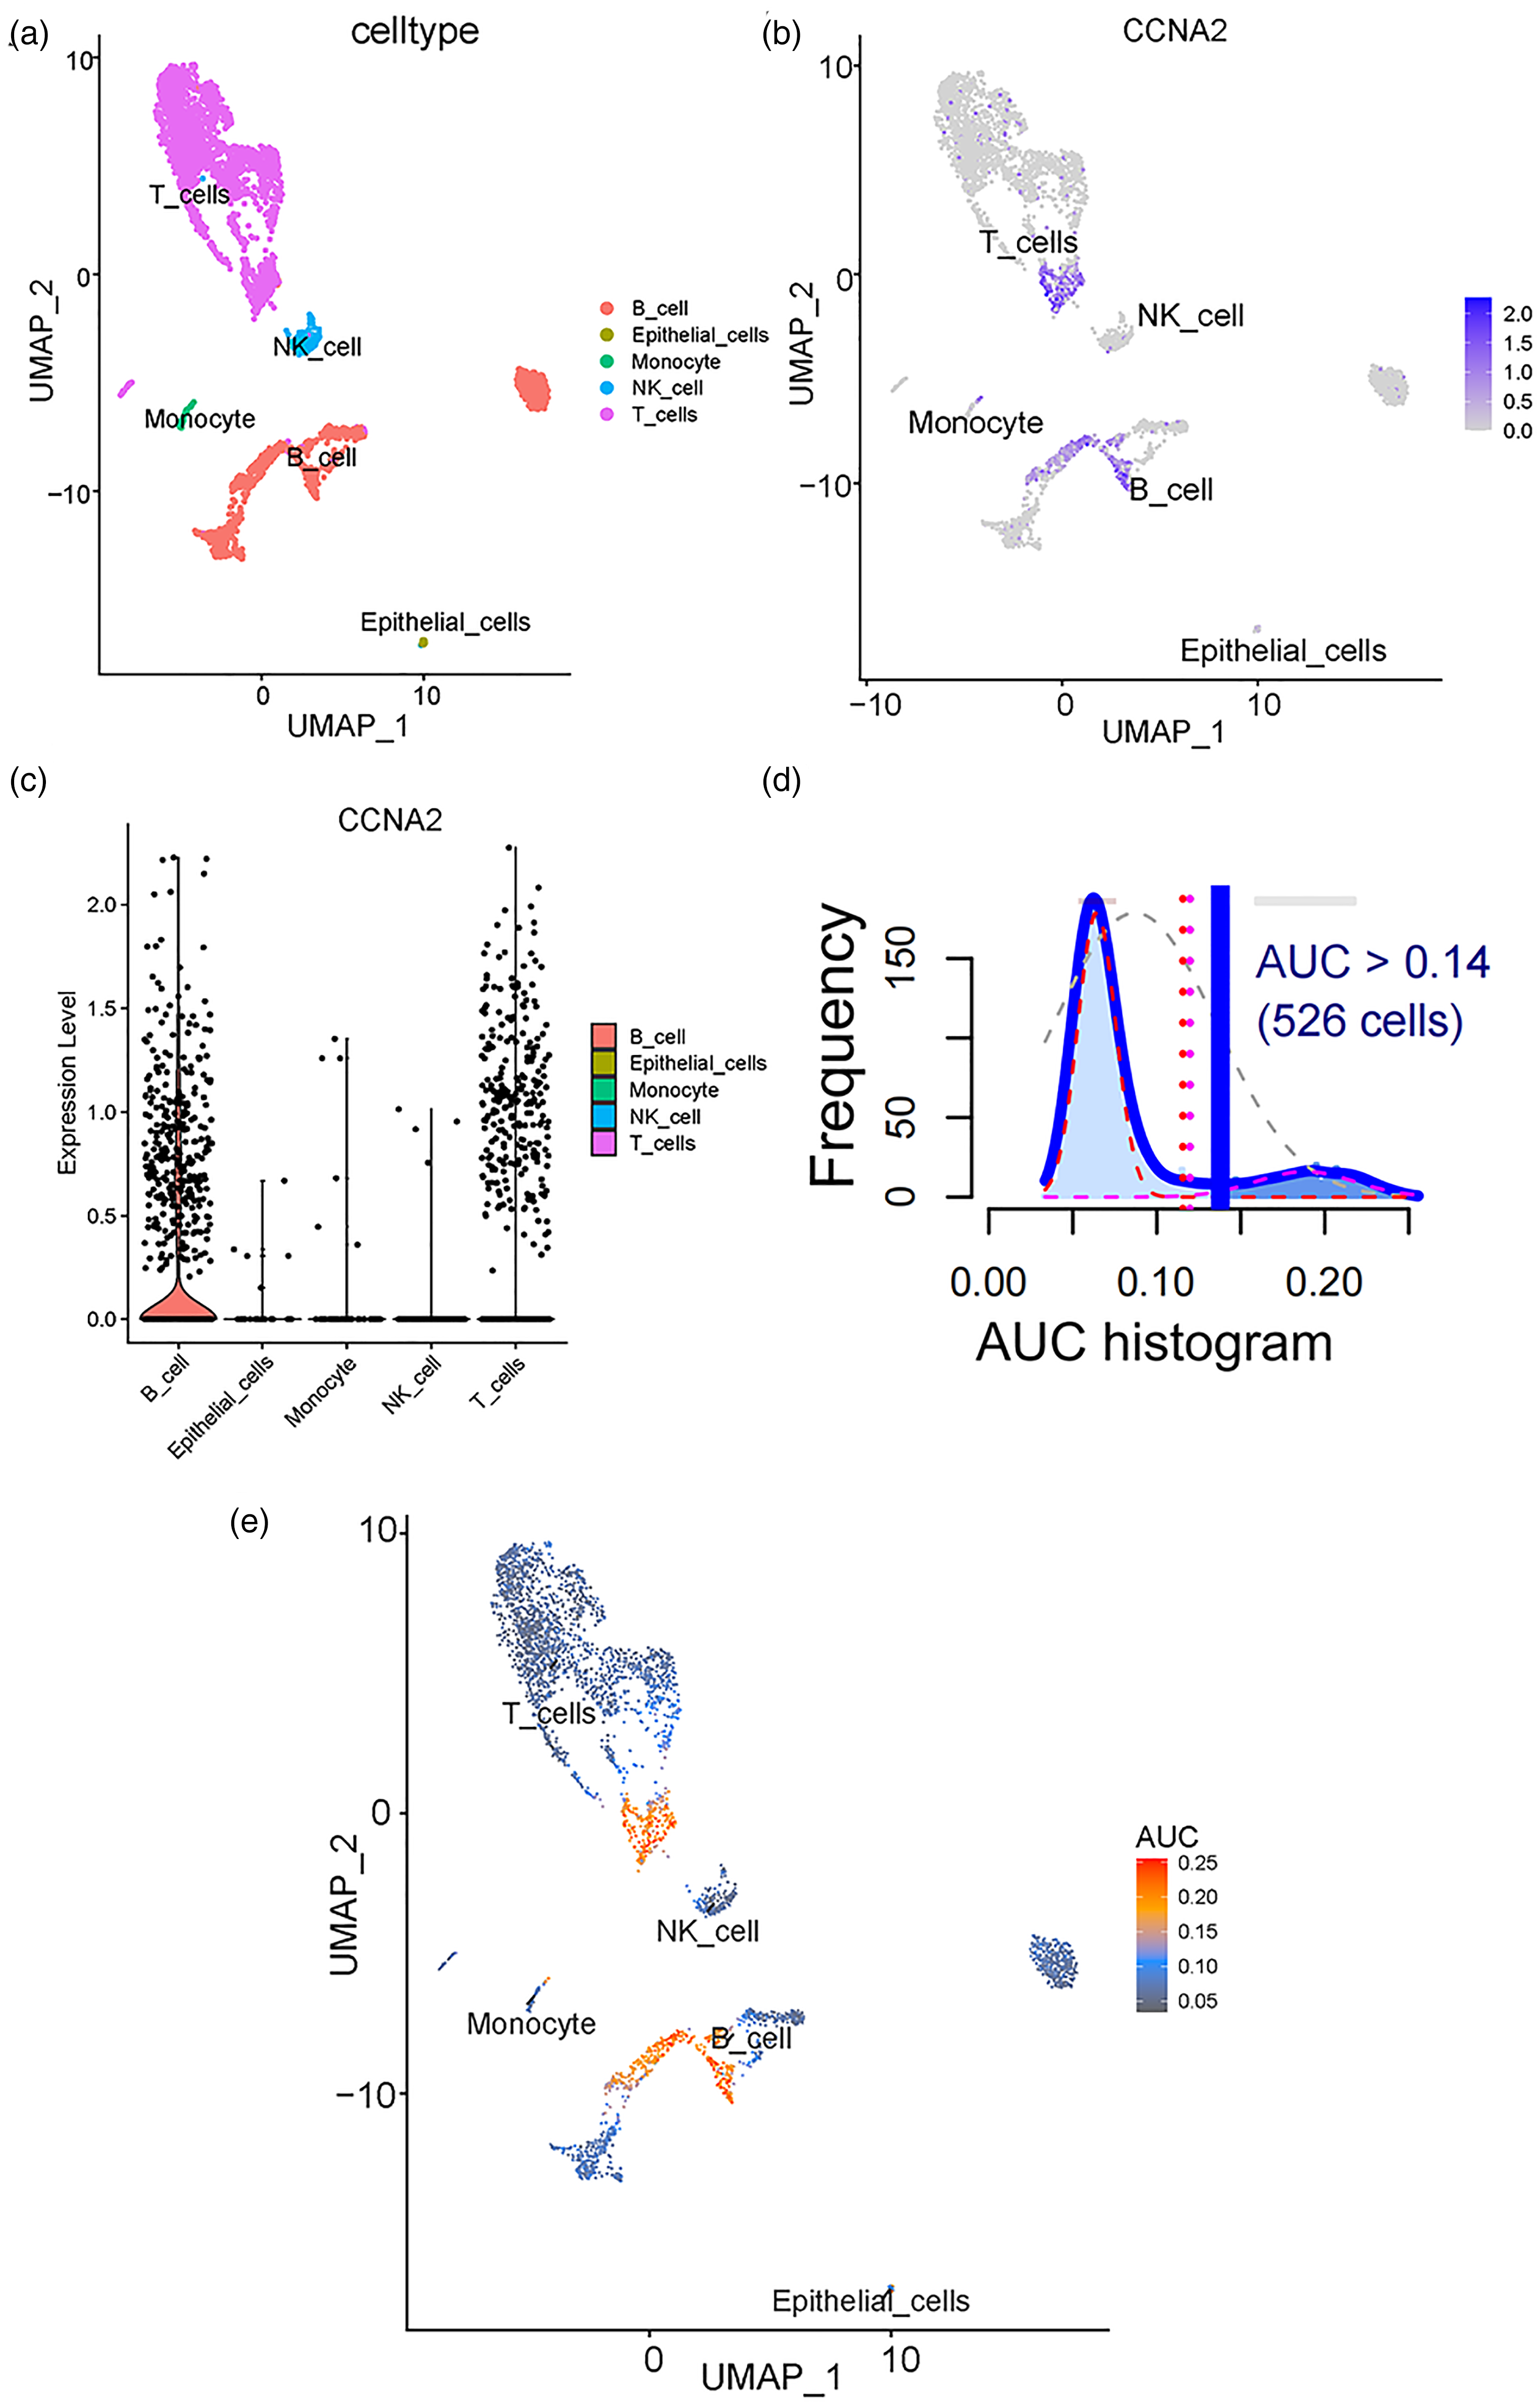
Cell type identification and AUCell analysis. (a) UMAP plot of all cell types in UCEC. Different cell types are uniquely colored. (b) and (c) Expression of CCNA2 in the identified cell types. CCNA2 was mainly expressed in B cells and T cells. (d) The axis of abscissas of the AUC histogram shows the AUC values, and the axis of ordinates shows the amount of cells (frequency) under every corresponding AUC value. The AUC values of more than 526 cells were over the activity thresholds of 0.14. (e) The AUC score of each cell was mapped to the UMAP plot. CCNA2 and its up-regulated genes were mainly expressed in T cells and B cells.
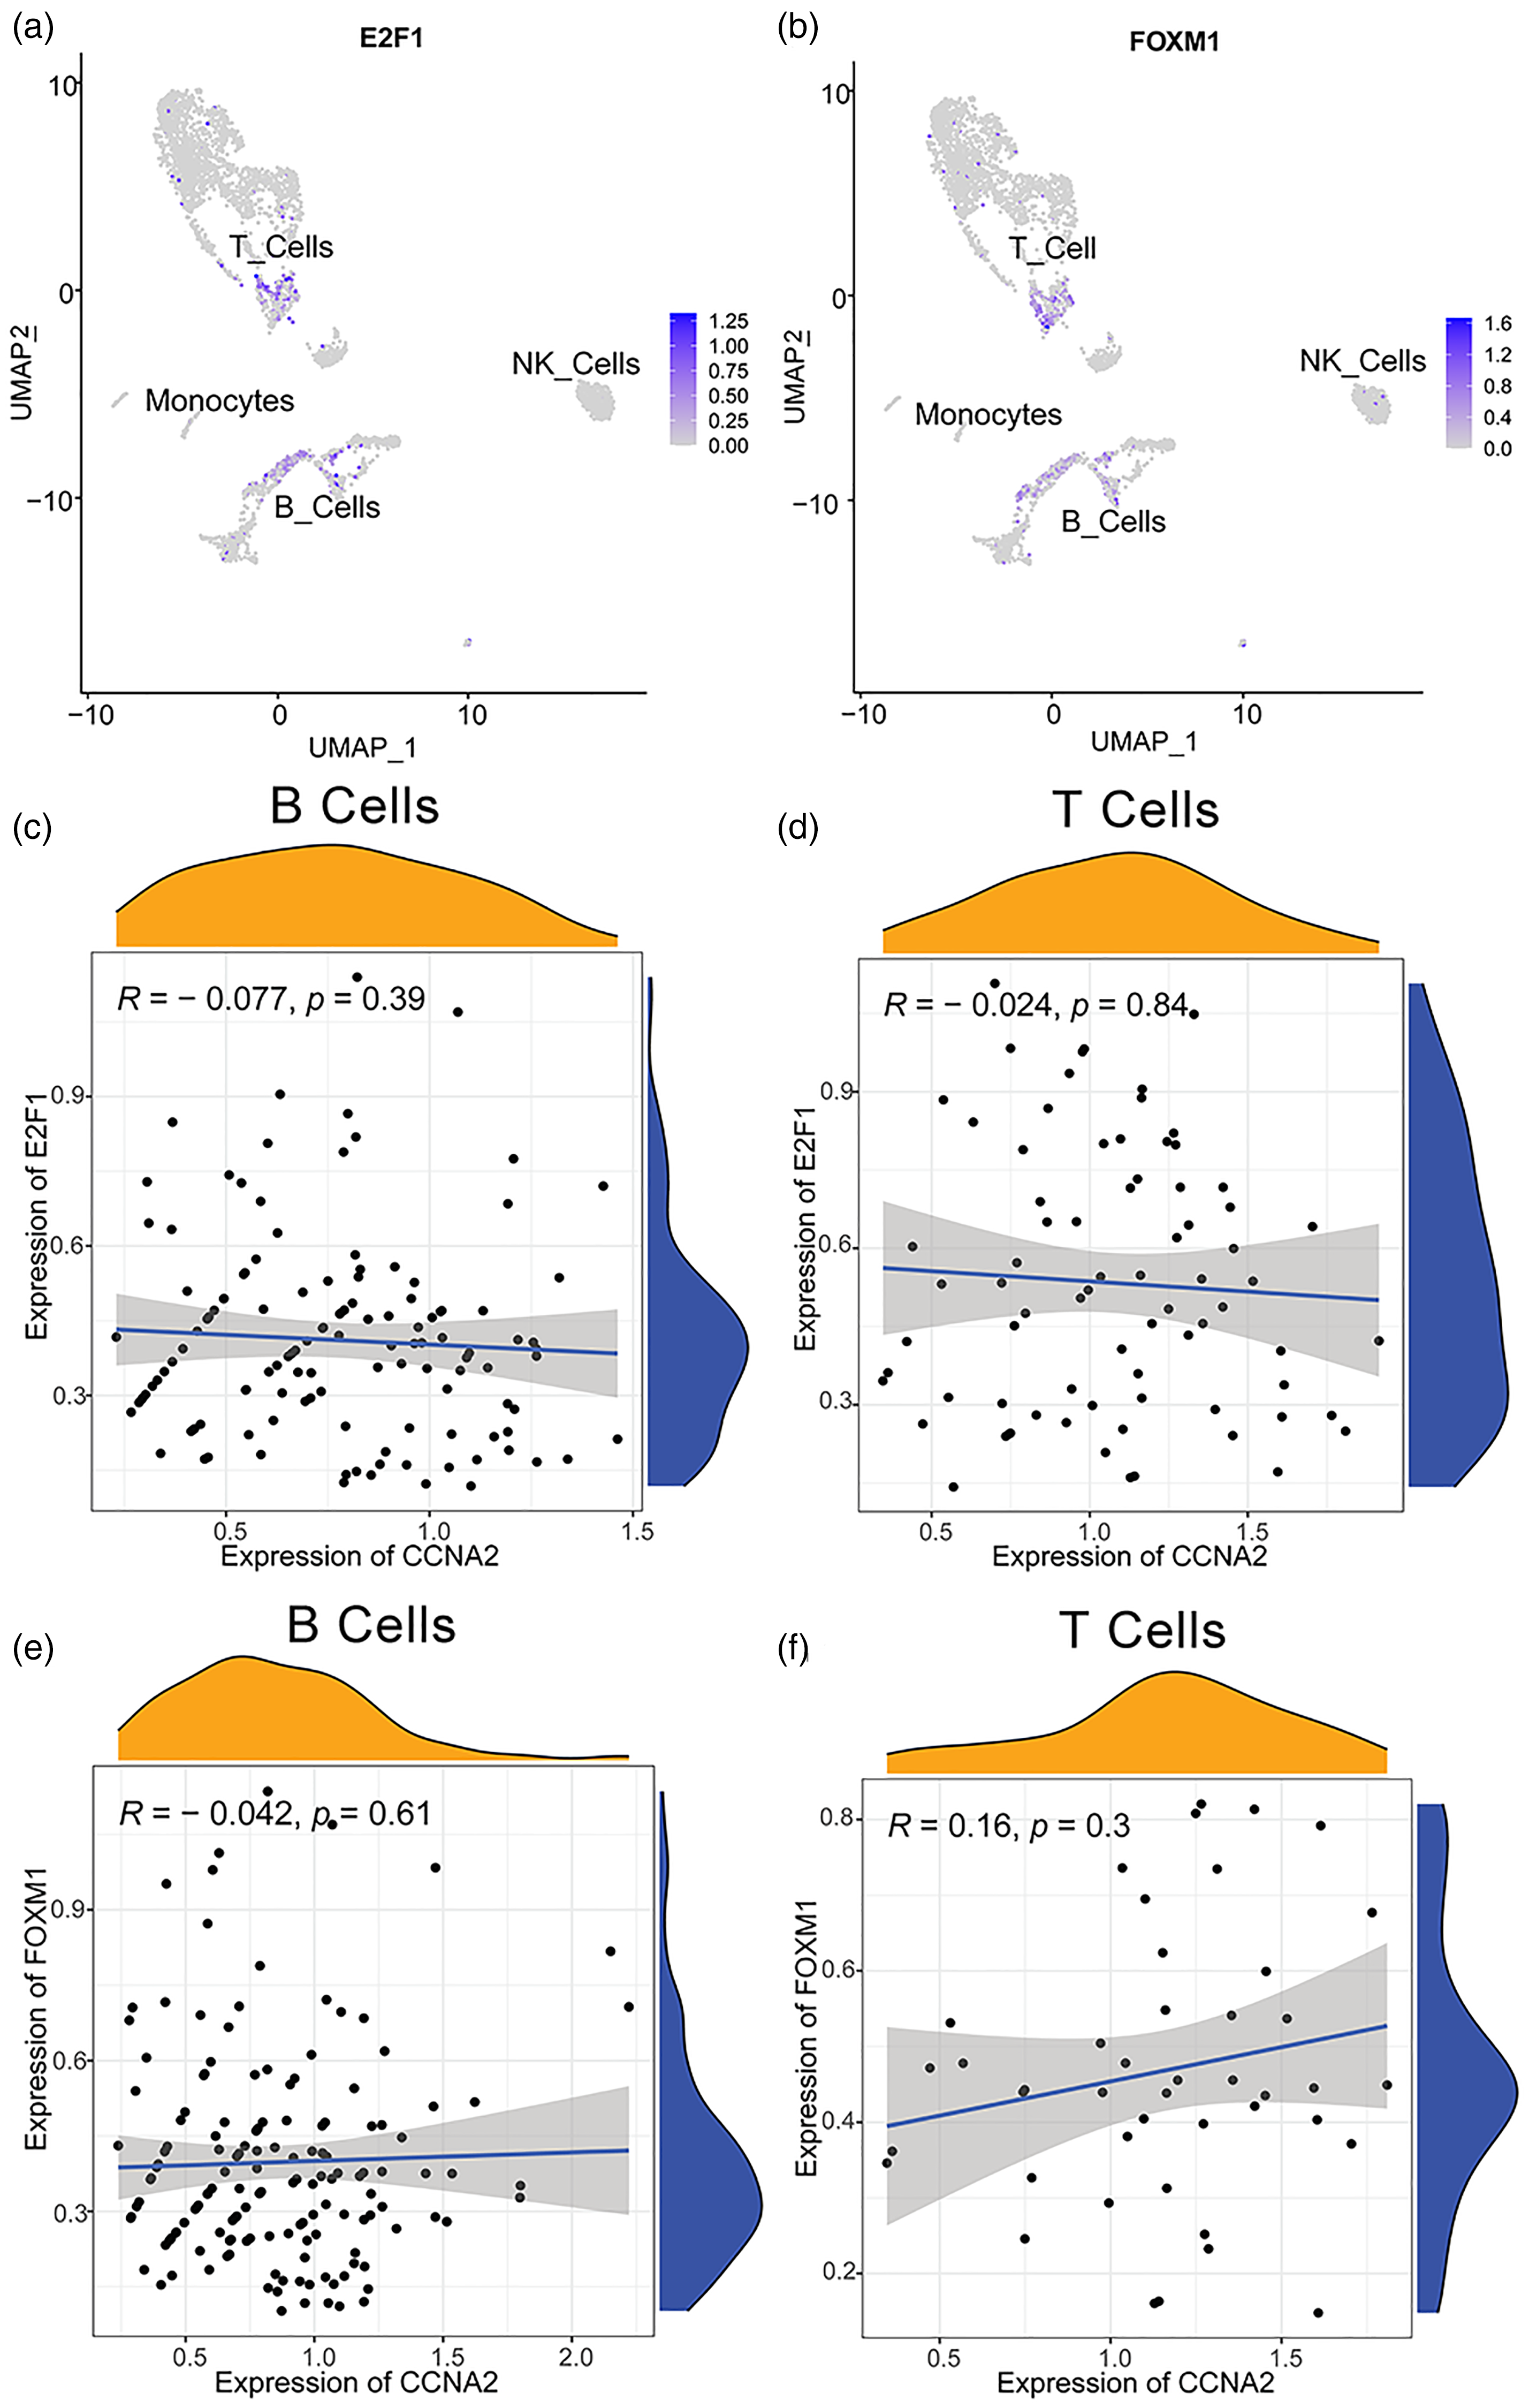
The relationship between CCNA2 and its potential TFs. (a) and (b) E2F1 and FOXM1 as the potential TF of CCNA2 were mainly expressed in B cells and T cells. (c) to (f) No correlation can be found between the expression of E2F1, FOXM1, and CCNA2 in B cells and T cells.
Intercellular communication
According to the results of CellChat analysis, B cells and T cells were found to have the greatest interaction strength (Figure 6(a) to (c)). MIF-(CD74 + CD44) was shown to be the potential ligand-receptor pair when B cells were the senders of messages and T cells were acted as the receivers. MIF-(CD74 + CXCR4) was likely to be the ligand-receptor pair, as T cells provided ligands and B cells offered receptors (Figure 6(d)).
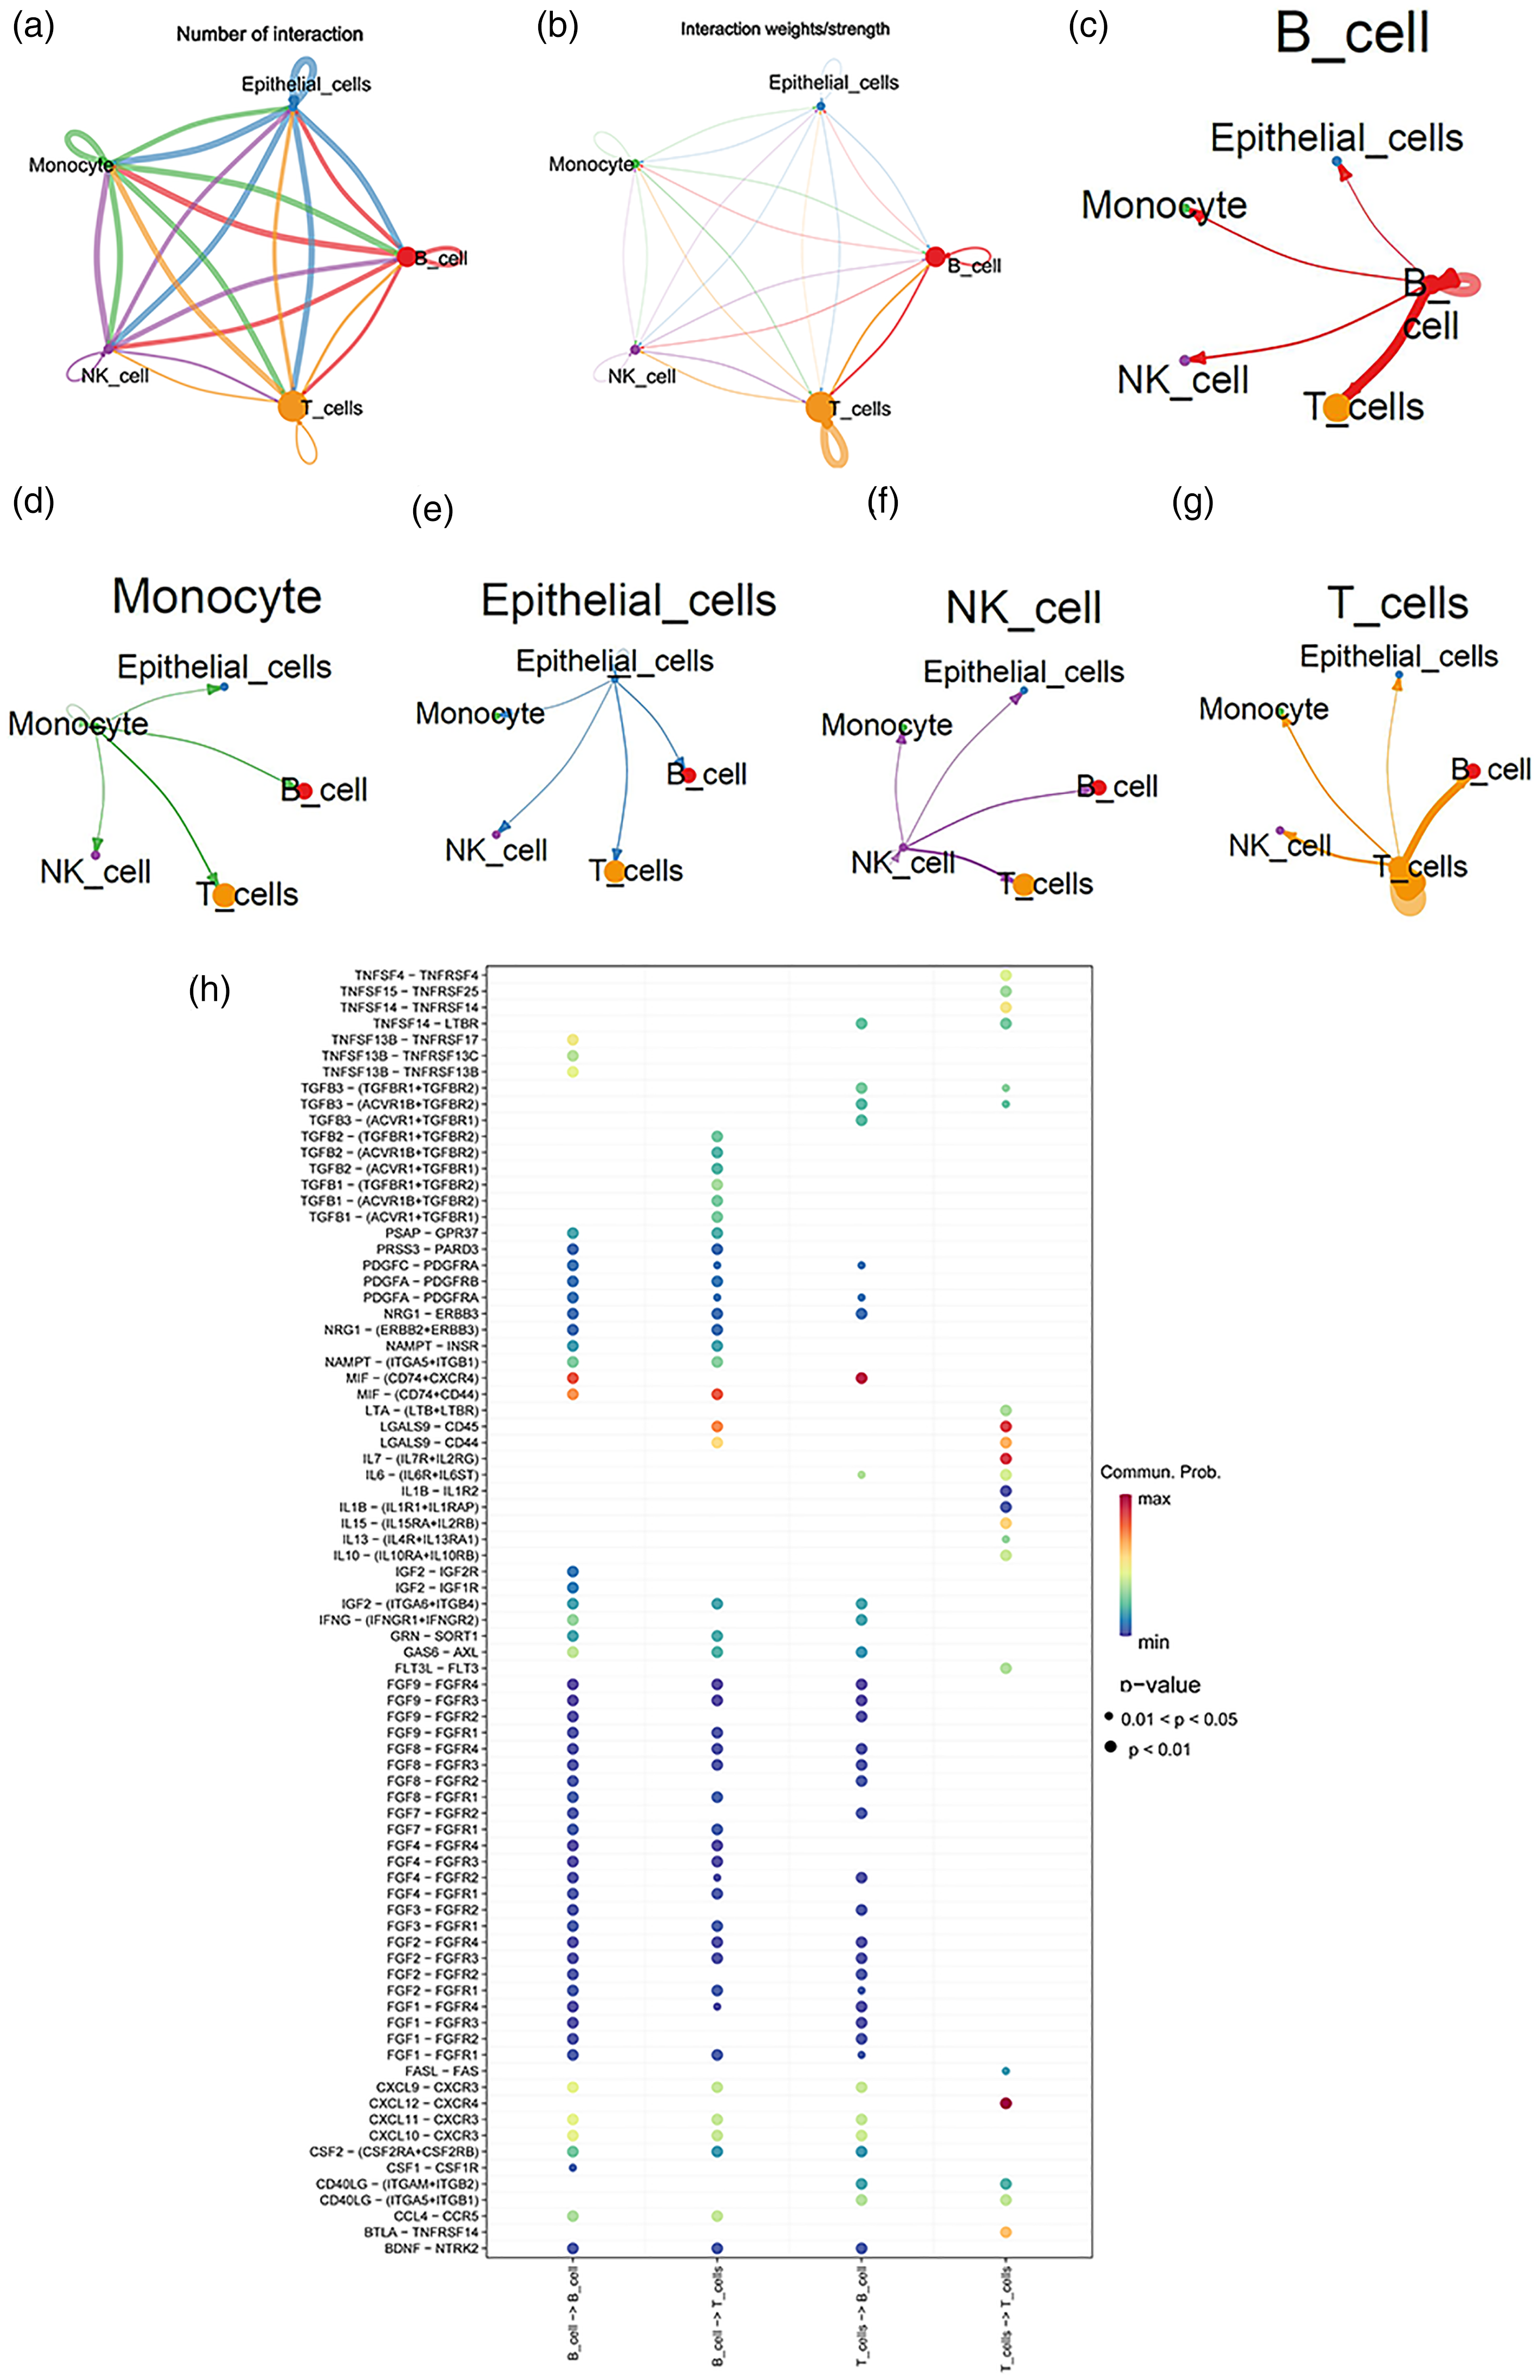
Cell–cell communication. (a) and (b) Circos plot of interaction quantity and interaction strength. The unique colors of the solid circles represent different cell types, and the size of solid circles represent the number of each cell group. The thickness of the edge shows the interaction strength between two cell groups. The cells at the starting site of the edge expresses the ligand, and the cells pointed to by the arrow comprise the expressed receptor. (c) to (g) Intercellular communication of each cell group. B cells and T cells had the strongest intercellular interaction. (h) Expression of some ligand–receptor pairs in B cells and T cells. (Ligand provider)→(receptor provider).
Correlation between CCNA2 and immune landscapes in UCEC
In UCEC, the mRNA expression of CCNA2 was negatively associated with stromal and immune scores, while the higher mRNA expression of CCNA2 represented more UCEC components. In normal endometrial tissues, there was no markable relationship between the mRNA expression of CCNA2 and stromal score, immune score, or tumor purity. The UCEC patients with higher CCNA2 mRNA expression was accompanied by lower stromal and immune scores, as well as higher tumor purity (Supplemental Figure 8(a) and (b)). After analyzing the immune cell infiltration in UCEC, we discovered that the CCNA2-high expression group possessed more activated CD4+ memory T cells, follicular helper T cells, M1 macrophages, resting dendritic cells, and activated dendritic cells, while they were also accompanied by less regulatory T cells (Tregs) and neutrophils (Supplemental Figure 8(c)). The mRNA expression of CCNA2 was positively correlated with M1 macrophages and follicular helper T cells, as well as was negatively correlated with regulatory T cells (Tregs) (Supplemental Figure 8(d)). In the present study, the IPS of CTLA4-PD-1-, CTLA4+PD-1-, CTLA4-PD-1+, and CTLA4+PD-1+ was reasonably higher in the CCNA2-low expression group than in the CCNA2-high expression group, which revealed that the patients with low CCNA2 expression were expected to be the candidates of the immune checkpoint inhibitors for UCEC patients (Supplemental Figure 9(a) to (d)).
Tumor mutation burden
We calculated the TMB of 551 donors in SNP mutation datasets from the ICGC database. Then, we matched the TMB with the mRNA expression of CCNA2 according to the corresponding donors in the TCGA database. The results revealed that TMB was positively associated with the mRNA expression of CCNA2. Additionally, the patients were classified into high-TMB and low-TMB groups based on the median TMB value. The high-TMB group had higher mRNA expression of CCNA2 compared with the low-TMB group (Supplemental Figure 9(e) and (f)).
Discussion
In this study, we found the overexpression of CCNA2 at the protein level in UCEC. The high expression level of CCNA2 was further confirmed via integrating its protein expression in tissue microarrays with the mRNA expression in our enrolled RNA-seq and gene chip data with a large sample size (number of UCEC = 720, number of non-UCEC = 165) through calculation approaches such as the t-test and SMD. There was a significant positive correlation between CCNA2 and the histological grade of UCEC. With the help of ScRNA-seq and the AUCell algorithm, we located the cell types where CCNA2 was overexpressed in UCEC. Moreover, the expression of CCNA2 was found to be correlated to the TME of UCEC, and the overexpression of CCNA2 was significantly related to a high TMB of UCE.
Regarding the expression of CCNA2 in UCEC, a previous study revealed that CCNA2 was more highly expressed in 62 TP53 mutation specimens of UCEC compared with 149 TP53 wild-type specimens. 23 Some studies have investigated the mRNA expression of the hub gene CCNA2 using UCEC and its corresponding control samples in TCGA cohorts, eventually determining it to be consistently highly expressed in UCEC.24,25 However, the above reports only focused on the mRNA expression of CCNA2 and lacked exploration of expression at the protein level. Moreover, the expression of CCNA2 has not been comprehensively investigated with a larger sample size in recent studies.
The ECPPF (E2F1, CCNA2, POLE, PPP2R1A, FBXW7) stratification system was validated as having potential application in profiling EC patients at a low-risk stage I, G1, or G2 with enormous risk of recurrence and identifying who would benefit from adjuvant therapy. 26 The expression of CCNA2 and E2F1 were usable for stratifying high- and low-risk groups of UCEC. 26 The unfavorable prognosis of CCNA2 in UCEC in the present study was sustained by previous studies.23,25 Consistent with our study, the relationship between CCNA2 and clinicopathological parameters, like the histological grade of UCEC, was intimate, and higher CCNA2 expression predicted worse prognostic value of UCEC.
CCNA2-E2F1-CIP2A axis dysregulation was found to accelerate insensitivity to adjuvant therapy and a poor prognosis. 23 Researchers found that E2F1 bound to the +677 position within the CCNA2 promoter and transcriptionally regulated the expression of CCNA2 to accelerate triple-negative breast cancer and hepatocellular carcinoma proliferation.15,27 Another study found that CCNA2 was one of the hub genes of colon cancer (CC), while E2F1 was one of the TFs in CC. 28 CCNA2 has been shown to play a role in determining outcomes of both TP53-mutation and TP53-wild-type groups of UCEC combined with the overexpression of E2F1 and the mutation of FBXW7 and PPP2R1A. 23 TP53 mutant endometrial carcinoma (EC) has failed to induce p21, resulting in multiple oncogenes harboring promoter p21–repressive sites including CCNA2 and FOXM1; CCNA2 has been shown to enhance the function of E2F1 and up-regulate FOXM1 in EC. 29 However, there is a shortage of studies reporting evidence that FOXM1 is the TF of CCNA2.
The cell cycle pathway is one of the fundamental mechanisms underlying tumorigenesis and could be integrated into other hallmarks of cancer, including metabolism remodeling and immune escape. 30 Cell cycle progression is an important mechanism for sensitivity to therapy in UCEC.31,32 CCNA2 has been regarded as a regulator of the cell cycle to promote tumor proliferation in some types of tumors, like lung adenocarcinoma, hepatocellular carcinoma, and breast cancer.33–35 Metabolic disorder has been considered a pivotal pathogenic mechanism for UCEC. 36 Glucose metabolic reprogramming has been considered to have therapeutic potential for obesity-associated UCEC. 37 Furthermore, amino acid and nucleotide metabolism has been shown to be a critical pathway in the diagnosis of UCEC. 38 Using bioinformatic analysis, some studies have revealed that the progression of UCEC might be related to the cell cycle pathway and metabolic pathway.24,25,39 Our study identified that the cell cycle and metabolic pathways participated in the progression of UCEC through functional enrichment analysis.
The memory T cells were primarily the resting cells, which become animated in response to antigen stimulation. 40 Regarding the correlation between memory T cells and UCEC, recent studies have pointed out that the high expression of deleted in liver cancer 1 was the inhibitor of the metastatic events of UCEC and positively related to the resting memory CD4+ T cells and resting mast cells. 41 Liu et al. 41 also identified that the resting memory CD4+ T cells, gamma delta T cells, M2 macrophages, and resting mast cells were notably increased in the low-risk group of UCEC. The above statements were consistent with our results that the resting memory CD4+ T cells were more highly expressed in the CCNA2-low expression group of UCEC. Jiang et al. discovered that the expression of CCNA2 is correlated with memory CD4+ T cells and M0 macrophage infiltration across various cancer types. 12 The T follicular helper cells were first identified for their role in assisting the memory and antibody-producing B cell differentiation in the germinal centers. 42 Liu et al. identified that the higher expression of T follicular helper cells is associated with better overall survival in UCEC by analyzing cohorts from the TCGA database using the CIBERSORT algorithm. 43 The C2 phenotype of UCEC with lower survival had fewer T follicular helper cells compared with the C1 phenotype. 44 Contrary to the opinion that the T follicular helper cells were considered to be the tumor suppressor, our results revealed that the CCNA2-high expression group was accompanied by more T follicular helper cells. The Tregs were the unique subpopulations of T cells and played a crucial part in maintaining self-tolerance and homeostasis, which were specifically expressed in the transcription factor FOXP3 in the nucleus and CD25 and CTLA4 in the cell surface. 45 As shown in our results, the low expression of Tregs portended a more advanced clinical stage and more serious pathological morphology in UCEC; at the same time, the advanced UCEC patients had fewer Tregs. 3 Proinflammatory M1 macrophages were identified as swallowing the tumor cells, while anti-inflammatory M2 macrophages, like tumor-associated macrophages, promoted tumor growth and proliferation. 46 In terms of UCEC, Geng et al. have suggested that RNF183 is considered to be a good prognostic factor, with its expression negatively associated with the markers of the M1 macrophages. 47 Moreover, the expression of CCNA2 was verified to be positively correlated with the M1 macrophage infiltration. 12 Regarding the neutrophils, their function in UCEC has rarely been studied, and the effects on tumors remain a controversial issue. With respect to the relationship between neutrophils and UCEC, one study discovered that PIK3CA expression influenced some immune-related pathways such as the TGFβ pathways; thus, there were more chemokines of neutrophils, and the neutrophils with the anti-tumor phenotype were recruited and activated. 48 This relationship between neutrophils and UCEC was consistent with our result that neutrophils were more infiltrated in the CCNA2-low expression group in UCEC.
Some shortcomings of the study are undeniable. First, the clinicopathological parameters in our collected clinical information are limited, which means that further research is needed to investigate the relationships among additional clinicopathological parameters. Second, the sample size for scRNA analysis is small, making it difficult to determine the cell types of UCEC tissues and the location of CCNA2 in UCEC. Third, the lack of clinical follow-up information for patients in the scRNA analysis prevents us from determining which CCNA2 expressing cell types can be used to assess CCNA2 prognostic value. Additionally, the exploration of CCNA2 TFs was based on the intersection between prognostic-associated genes in UCEC and potential TFs of CCNA2 in public databases. Lastly, molecular processes and signaling pathways relying solely on the TCGA database may not be sufficient. Therefore, this finding still requires more in-vivo and in-vitro analysis for verification.
Conclusion
The expression level of CCNA2 in UCEC was notably higher than in normal endometrial tissues. And the high expression of CCNA2 predicted worse prognosis in UCEC. CCNA2 might promote the tumor progression with the help of T cells and B cells in UCEC.
Supplemental Material
sj-docx-1-jbm-10.1177_03936155241238759 - Supplemental material for Clinicopathological role of Cyclin A2 in uterine corpus endometrial carcinoma: Integration of tissue microarrays and ScRNA-Seq
Supplemental material, sj-docx-1-jbm-10.1177_03936155241238759 for Clinicopathological role of Cyclin A2 in uterine corpus endometrial carcinoma: Integration of tissue microarrays and ScRNA-Seq by Wei-Jia Mo, Zi-Qian Liang, Jie-Zhuang Huang and Zhi-Guang Huang, Zhi-Fu Zhi, Jun-Hong Chen, Gang Chen, Jing-Jing Zeng, Zhen-Bo Feng in The International Journal of Biological Markers
Footnotes
Acknowledgments
The authors thank Guangxi Key Laboratory of Medical Pathology for the technical support.
Declaration of conflicting interests
The authors declared no potential conflicts of interest with respect to the research, authorship, and/or publication of this article.
Funding
The study was funded by Guangxi Zhuang Autonomous Region Health Commission Self-financed Scientific Research Project (Z20180979, Z20190594), Guangxi Medical High-level Key Talents Training “139” Program (2020), Guangxi Higher Education Undergraduate Teaching Reform Project (2022JGA146), Guangxi Educational Science Planning Key Project (2022ZJY2791) and Innovation Project of Guang Xi Graduate Education (YCBZ2023108).
Research ethics and patient consent
The study was approved by the ethics committee of the First Affiliated Hospital of Guangxi Medical University (No. 2020-KY-E-095), and all patients signed informed consent forms.
Supplemental material
Supplemental material for this article is available online.
References
Supplementary Material
Please find the following supplemental material available below.
For Open Access articles published under a Creative Commons License, all supplemental material carries the same license as the article it is associated with.
For non-Open Access articles published, all supplemental material carries a non-exclusive license, and permission requests for re-use of supplemental material or any part of supplemental material shall be sent directly to the copyright owner as specified in the copyright notice associated with the article.