
Abstract
Purpose
Ultraviolet radiation causes skin cancer, but the exact mechanism by which it occurs and the most effective methods of intervention to prevent it are yet unknown. For this purpose, our study will use bioinformatics and systems biology approaches to discover potential biomarkers of skin cancer for early diagnosis and prevention of disease with applicable clinical treatments.
Methods
This study compared gene expression and protein levels in ultraviolet-mediated cultured keratinocytes and adjacent normal skin tissue using RNA sequencing data from the National Center for Biotechnology Information-Gene Expression Omnibus (NCBI-GEO) database. Then, pathway analysis was employed with a selection of hub genes from the protein-protein interaction (PPI) network and the survival and expression profiles. Finally, potential clinical biomarkers were validated by receiver operating characteristic (ROC) curve analysis.
Results
We identified 32 shared differentially expressed genes (DEGs) by analyzing three different subsets of the GSE85443 dataset. Skin cancer development is related to the control of several DEGs through cyclin-dependent protein serine/threonine kinase activity, cell cycle regulation, and activation of the NIMA kinase pathways. The cytoHubba plugin in Cytoscape identified 12 hub genes from PPI; among these 3 DEGs, namely, AURKA, CDK4, and PLK1 were significantly associated with survival (P < 0.05) and highly expressed in skin cancer tissues. For validation purposes, ROC curve analysis indicated two biomarkers: AURKA (area under the curve (AUC) value = 0.8) and PLK1 (AUC value = 0.7), which were in an acceptable range.
Conclusions
Further translational research, including clinical experiments, teratogenicity tests, and in-vitro or in-vivo studies, will be performed to evaluate the expression of these identified biomarkers regarding the prognosis of skin cancer patients.
Introduction
The impacts of climate change on human health are ubiquitous and there is significant concern that the earth's atmosphere will continue to warm adversely. Since the middle of the 21st century, the global incidence of skin cancer (SC) has increased at an alarming rate. SC, also known as cutaneous carcinoma, is a prominent global health issue, especially due to the higher risk in the population with fair skin than darker skin. 1 Globally, in 2019, 2.4 million squamous cell carcinoma (SCC) and 4.0 million basal cell carcinoma patients were identified.2,3 Invasive melanoma is the most malignant and serious type of SC, accounting for 80% of all SC-related fatalities. 4 There is an annual increase in melanoma incidence of 4%–6% percent among fair-skinned people in Northern Europe, North America, Australia, and New Zealand. 5 However, several variables contribute to the disease, including genetic factors, ultraviolet (UV) light exposure, and environmental factors. Among those, ultraviolet radiation (UVR) (a potent carcinogen) exposure is the root cause of SC, which is responsible for the mutation of a number of cancer-suppressor genes like p53, p21, gelatinases, and galectin-3, has the potential to be utilized as a marker to assess both sun exposure and the risk of cancer. 6 In patients deficient in DNA repair enzymes, such as those with xeroderma pigmentosa (XP), there is a significantly increased incidence of SCC. 7 The overexpression of oncogenes and proteases that promote tumor invasiveness and the overactivation of several signaling transduction pathways are the main mediators of melanoma's high aggressiveness, high capacity for metastatic spread, and resistance mechanisms to therapeutics. 8
The epidermal growth factor receptor (EGFR) is activated by UV light and upregulates several mitogen-activated protein kinases (MAPKs). 9 The phosphatidylinositol 3-kinase (PI3K)/Akt signaling pathways, whose dysregulation is critical during tumor genesis, reduce programmed cell death, increase cancer cell proliferation, and enhance the process of epidermal hyperplasia in several types of melanoma. Taso et al. 10 demonstrated that hyperactivation of the MAPK and PI3K/Akt pathways is caused by mutations that melanocytes acquire in malignancy to develop melanoma. However, following therapy with BRAF and MEK inhibitors, MAPK signaling was seen to reactivate in about 70% of melanoma patients. 11 Furthermore, 4% of BRAF inhibitor-resistant melanomas had mutations in Akt and phosphoinositol-3-kinase (PI3K), as well as other regulatory genes in the PI3K-Akt pathway associated with drug resistance development. 12 The direct contribution of PI3K-Akt pathway activation to the development of anti-BRAF treatment resistance has been contested in earlier investigations. The primary mechanism of resistance to BRAF inhibitors, as demonstrated by melanomas with PI3K-Akt activating mutations, is the reactivation of the MAPK pathway. 13 Also, the nilotinib drug may be useful for extending life for individuals with BRAF-mutant melanomas, according to research by Tripathi et al. 14 As a result, targeting the MAPK and PI3K-Akt pathways might be a useful tactic for enhancing the clinical response of melanoma patients.
Also, COX-2 is overexpressed in human skin actinic keratoses (premalignant UV-induced skin lesions), SCCs, and basal cell carcinomas (BCCs), as well as in human epidermal cancer cell lines. 15 Prognosis improves when lesions are found early, including SC, melanoma, and non-melanoma; early detection and treatment are required to reduce the number of deaths due to SC. 16 However, given the difficulties of early detection and diagnosis, the overall survival rate of SC patients drops significantly. The above studies indicate that several biomarkers can explain the pathophysiology of SC and predict the consequences, but they still lack clinical studies. 17 Therefore, more efficient biological markers should be investigated to understand SC's etiology and to guide treatment and prognosis fully. The advancement of bioinformatics techniques, next-generation sequencing, proteomics, transcriptomic, and epigenetic research has enhanced our understanding of cancer growth and molecular processes, and the design of appropriate drugs for diseases. Recently, a promising technology called integrated systems biology has been used to identify new molecular oncogenes and gene signatures utilizing Gene Expression Omnibus (GEO) and gene expression profiles, which already exist. 18 For assessing UV damage and stratifying SC risk, there is currently no comprehensive group of UV biomarkers available. Previous research has sought to identify UV-responsive genes as potential UV biomarkers. Also, most existing bioinformatics studies focus on oncogene changes and neglect differences at the protein level. In our study, we used RNA-Seq to create a transcriptomic cohort encompassing UV-responsive genes in human skin cells exposed to various UVR settings to identify a consensus UV biomarker with a therapeutic panel for broad application and accuracy. The bioinformatics and systems biology approaches were employed to explore the potential biomarkers that are shared by cells from several donors to better understand the molecular processes of SC progression, early detection, and drug target identification through related pathways. In this study, the protein-protein interactions network is unique to the retrieval of putative hub genes, survival and expression level analysis of 12 hub genes, gene regulatory network, and protein-chemical interaction analysis of UV-mediated SC. Finally, the receiver operating characteristic (ROC) curve was used to validate our potential hub genes. Our findings may serve as a clinical biomarker that helps us better understand the genesis of SC and the prevention of disease with applicable clinical treatments.
Materials and methods
Data retrieval and preparation of SC datasets
The RNA-sequence gene expression data sample used in this study was reclaimed from the National Center for Biotechnology Information-Gene Expression Omnibus (NCBI-GEO) database. The data associated with this study can be accessed through the link (https://www.ncbi.nlm.nih.gov/geo/query/acc.cgi?acc=GSE85443). We used gene expression data from human SCs with accession number GSE85443. Total RNA was isolated from UV-irradiated human keratinocyte cells in different UVR conditions and non-irradiated control keratinocyte cells through the Illumina HiSeq 2000 platform. For analysis purposes, we made three datasets as groups G-1, G-2, and G-3 to identify UV-responsive dysregulated genes in human SCC. Following the three groups, a total of 21 cases and three control group samples from cultured primary keratinocyte cells were used in this study for analytical purposes.
For clarification, our study did not focus on the UV exposure time and dose-dependent manners; we simply compared the UV-responsive differentially expressed genes (DEGs) among three groups to identify potential biomarkers. As a result, the UV exposure time and doses were different for samples in the same group. To determine the UVR-responsive dysregulation genes in SC, we have only included UVR-treated samples for the case and non-UVR-treated samples for control groups. In addition, we have excluded several GEO datasets that do not match our selection criteria, including only UVR-treated samples for cases and without UVR-treated samples for control groups, as well as time and dose-independent datasets. Also, we excluded microarray data and did not find significant dysregulated genes from several RNAseq data analyses. Details of information on GEO SC patients’ data and identified DEGs are tabulated in Table 1. After downloading from the NCBI database, the RNA-Seq raw data were imported into the BioJupies (https://maayanlab.cloud/biojupies/) generator online server for analysis. 19 BioJupies is a web-based server application that creates personalized Jupyter notebooks for RNAseq data analysis. It also allows users to quickly build customized, reproducible outputs from their raw or processed sequencing data and to get RNA-seq data from over 8000 research studies containing over 300,000 RNA-seq samples that have been published in the GEO. 20 Via the Biojupies, the DESeq software package confined in the R Bioconductor package that identifies DEGs based on sequence read counts data was used to find DEGs between each UVR-treated group and the control group. To approximate the distribution of read counts and to estimate the mean and variance of the dispersion, DESeq employs a negative binomial model.
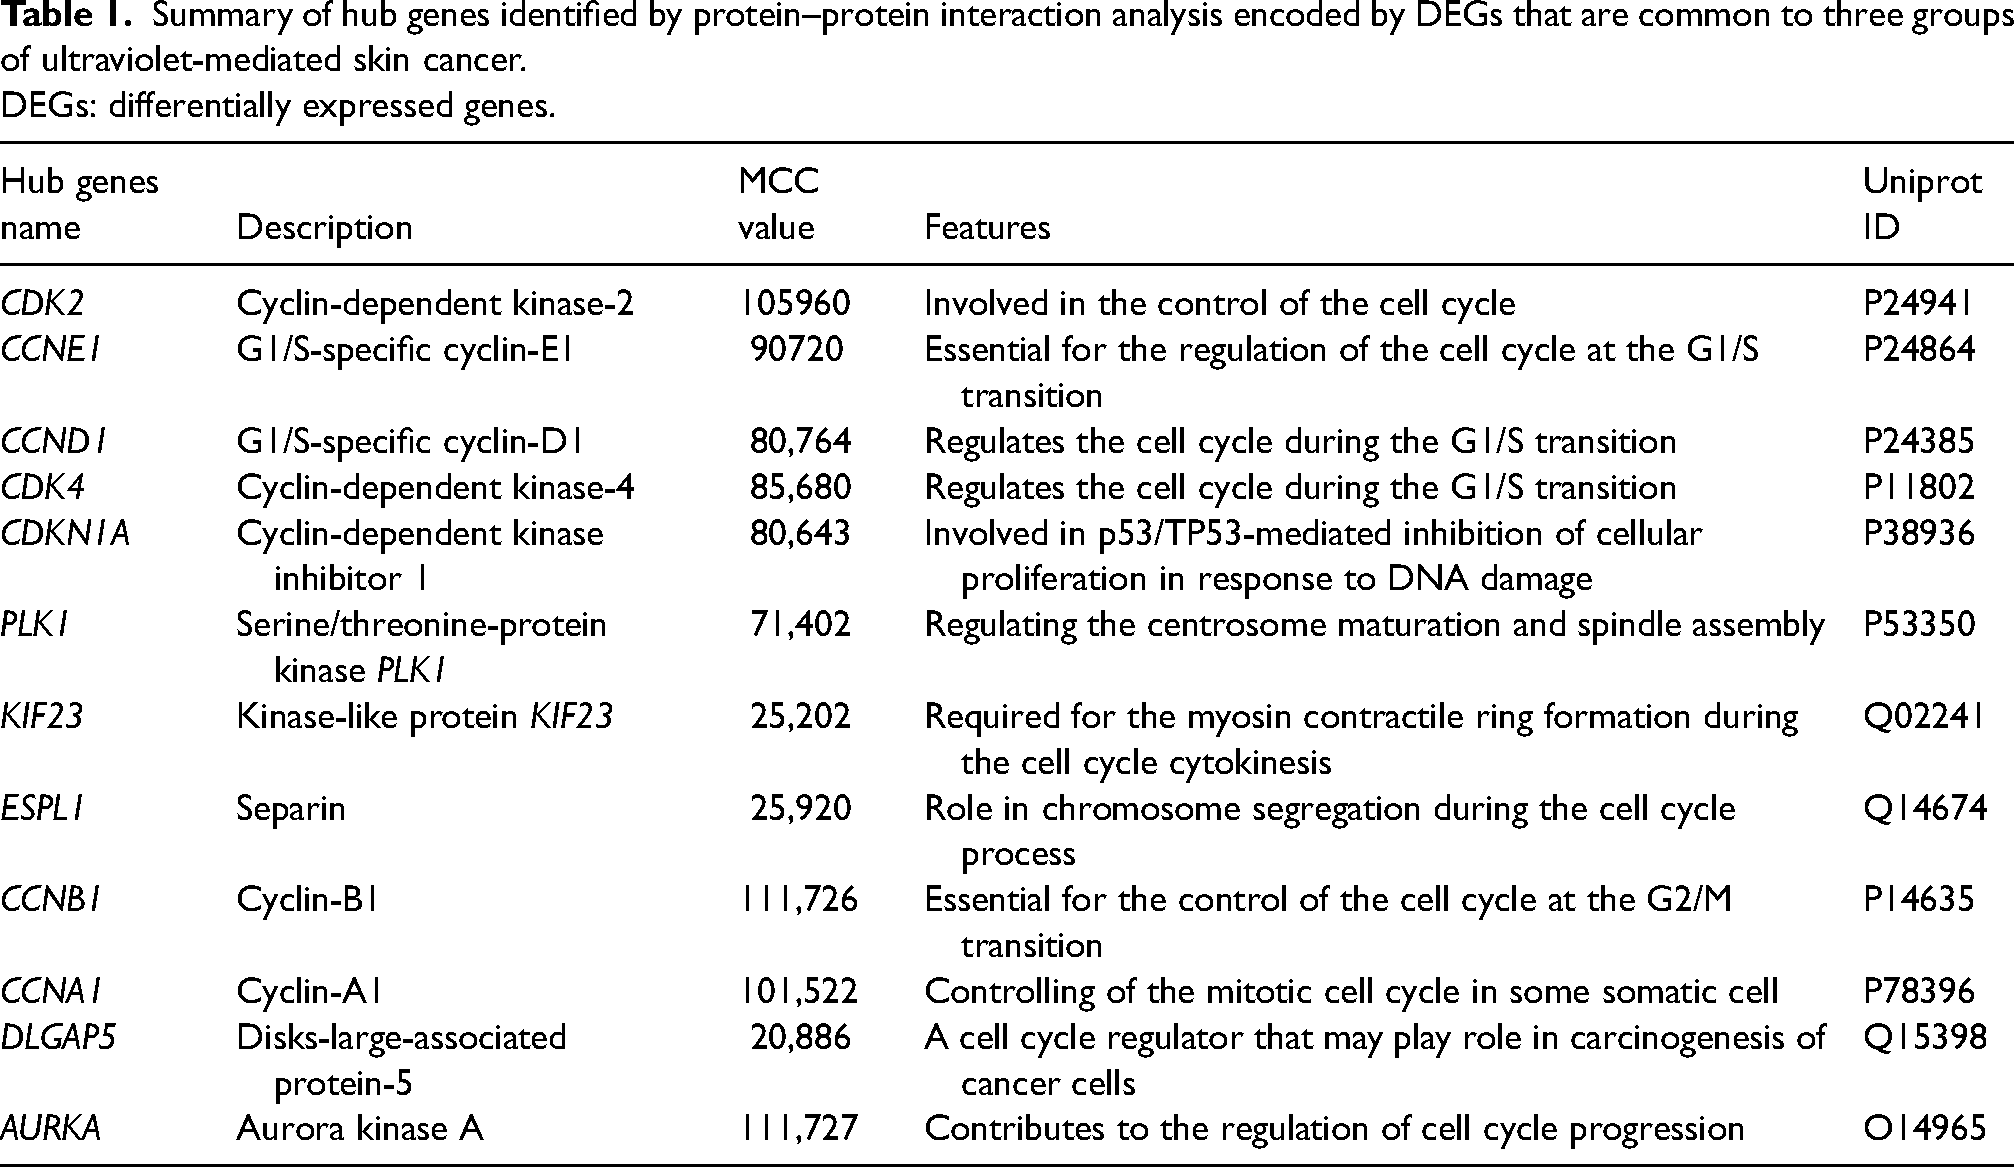
Summary of hub genes identified by protein–protein interaction analysis encoded by DEGs that are common to three groups of ultraviolet-mediated skin cancer.
DEGs: differentially expressed genes.
Summary of hub genes identified by protein–protein interaction analysis encoded by DEGs that are common to three groups of ultraviolet-mediated skin cancer.
DEGs: differentially expressed genes.
Then, statistical operations, including moderated t-statistics, B-statistics, and F-statistics for all the pair-wise comparisons, were performed on the datasets to determine the DEGs. Additionally, the Benjamini-Hochberg false discovery rate (FDR) of < 0.05 was employed to balance the discovery of statistically significant genes and the limitation of false positives. In this study, genes with a P-value < 0.05 and an absolute log2 fold change > 1 were considered for DEGs. We also considered log2 fold-change ≥ 1 and log2 fold-change ≤ -1 criteria to explore up- and down-regulated genes, respectively. Then, we analyzed three SC sub-datasets using the Venny v2.1 web tool (https://bioinfogp. cnb.csic.es/tools/venny/) to identify shared DEGs. 21 The flow diagram (Figure S1) shows systems biology and bioinformatics approaches to UV-mediated SC.
Functional enrichment analysis
Pathway-based analysis is a recently established technique for understanding how complicated illnesses may be connected through their underlying biological processes. Also, gene ontology (GO) is a schema for describing gene activities and their connections to epigenetics. Pathways and GO were discovered by doing a gene set enrichment analysis on the overlapping DEGs to better understand SC development. We applied the EnrichR (https://maayanlab.cloud/Enrichr/) and DAVID (https://david.ncifcrf.gov/) databases to run the functional enrichment analysis with the combined DEGs. 22 Using a variety of databases, we evaluated the signaling pathways and gene ontologies associated with frequent DEGs. This over-representation analysis identified a collection of enriched cell signaling pathways and functional GO keywords that show the biological importance of the identified DEGs. Molecular pathways were obtained from databases such as Biocarta, Reactome, and KEGG, while gene ontologies were collected from biological process, cellular components, and molecular function databases. Only the significant pathways with a P-value < 0.05 were examined after the duplicate pathways were removed. The pathway and ontologies were shown in bubble plots that were created using R Studio software.
Establishment of protein– protein interactions network and selection of hub genes
The analysis of protein-protein interactions (PPI) provides information about the proteins and their connections. Considering the combined DEGs common among SC datasets, we created PPI networks to test our findings. Using the STRING (https://string-db.org/) protein interactome database (which provided 24,584,628 proteins from 5090 organisms), we were able to identify protein sub-networks. 23 Then import “.txt” to the “.csv” file in Cytoscape for generating a PPI network. As part of the organism's “interactomics,” abnormal PPIs can lead to various health problems. If two diseases have one or more commonly linked protein subnetworks, they have been connected. In the PPI network, the number of nodes represents proteins, while edges indicate interactions between proteins. To create the hub gene network, we used the cytoHubba plugin in Cytoscape. 24 High-interaction proteins were discovered using topological metrics, such as the maximum clique centrality (MCC) algorithm, which is a topological metric whose higher value indicates highly interconnected proteins between PPI networks.
Survival and expression profile analysis of potential hub genes
Gene Expression Profiling Interactive Analysis (GEPIA2) enables quick and customized delivery of capabilities based on The Cancer Genome Atlas (TCGA) and genotype-tissue expression (GTEx) data to further study the influence of hub gene expression on patient clinical outcomes. 25 GEPIA2 (http://gepia2.cancer-pku.cn/#index) analyzes DEGs in SC samples to determine the survival effect and to generate an expression profile. Using a median transcript per million (TPM), SC samples were classified into high- and low-expression hub gene groups. Then, we calculated the log-rank P-value. The overall survival effect of hub genes in SC was estimated by calculating the log-rank P-value < 0.05 and the hazard ratio (HR 95 percent confidence interval) for the hypothesis test using GEPIA2 single-gene analysis. On the other hand, the relative expression levels of the hub genes were selected based on the Log2FC cutoff value of < 1, and the q-value cutoff was < 0.01. For the statistical significance of each hub gene, a P-value < 0.05 was considered in our analysis.
Identification of regulatory biomolecules
Transcriptional and post-transcriptional regulatory biomolecules like transcription factors (TFs) and microRNAs (miRNAs) may significantly alter how transcription and expression are processed. In addition, these proteins are essential for all aspects of cellular life. Also, small RNA molecules (miRNAs) control gene expression at the post-transcriptional level after transcription has taken place. A new class of molecular regulators (miRNAs) has been discovered that controls several genes and pathways essential in the pathogenesis of SC. Using the NetworkAnalyst (https://www.networkanalyst.ca/) platform, 26 we can find DEGs-miRNAs and TFs-DEGs networks based on dysregulated genes that are shared among them. In order to explore DEGs-miRNAs interaction networks (the TarBase database), the TFs-DEGs interaction network (the JASPAR database) is used. The DEGs-TFs network was screened for TFs, and the miRNAs were selected from the DEGs-miRNAs network with a degree of 10 and a betweenness centrality value of 100.
Protein-chemical compound analysis
Analyses of protein-chemical compounds can be used to identify the chemical molecules responsible for the interaction of proteins in SC. For the purpose of discovering new drugs, knowing how proteins underlie cellular and molecular processes is critical in the field of protein-chemical interaction research. Using enriched genes (common DEGs) among three groups of SC, the Comparative Toxicogenomics Database was able to find protein-chemical interactions with the help of NetworkAnalyst. 26
Validation of hub genes
In clinical epidemiology, ROC analysis is used to measure how well medical diagnostic tests (or systems) can distinguish between two patient states: “diseased” and “non-diseased.” The area under the curve (AUC)-ROC curve is a performance indicator for classification problems at various thresholds. AUC stands for degree or measure of separability, while ROC is a probability curve. It reveals how well the model can discriminate between classes. The greater the AUC, the better the model distinguishes between individuals with and without disease. The total separation of the two underlying distributions suggests a test that is perfectly discriminating, whereas complete overlap means no discrimination. As the threshold for positivity is changed, the ROC curve depicts the trade-off between true positive fraction (TPF) and false positive fraction (FPF). Data were collected from GSE2503 with respect to Aurora kinase A (AURKA), polo-like kinase 1 (PLK1), and cyclin-dependent kinases 4 (CDK4) proteins. 27 The interactive web server easyROC (http://www.biosoft.hacettepe.edu.tr/easyROC/) was employed to analyze the ROC curve using the R environment. In general, an AUC of 0.5 indicates no discrimination, 0.7–0.8 is regarded as good, 0.8–0.9 is great, and more than 0.9 is considered outstanding.
Result
Identification of DEGs in SC datasets
As a whole, the DEGs were found to meet the cutoff criteria (log2FC > 1 and P-value < 0.05). We found 289, 620, and 649 DEGs in total through the GSE85443 (G-1), GSE85443 (G-2), and GSE85443 (G-3) subsets of the GSE85443 dataset analysis, respectively (Table S1). The volcano plot in Figure S2 was generated to compare the up- and down-regulated genes. Then, the 32 common DEGs were identified by comparing three subsets of a dataset (i.e.,CDKN1A, CDK4, CLDN4, CLU, RNR1, and SEMA3B, AURKA, ADAMTS3, CCNB1, CLMP, DOCK10, LMNB1, and PLK1, etc.). The heat maps display the 32 DEGs that were common throughout three groups of the GSE85443 dataset and their connections based on an adjusted P-value and a log2fold change in Figure 1(a–b) and Table S2. Besides, the number of 32 shared DEGs between two groups of SC datasets is presented in the venn diagram (Figure 1(c)).
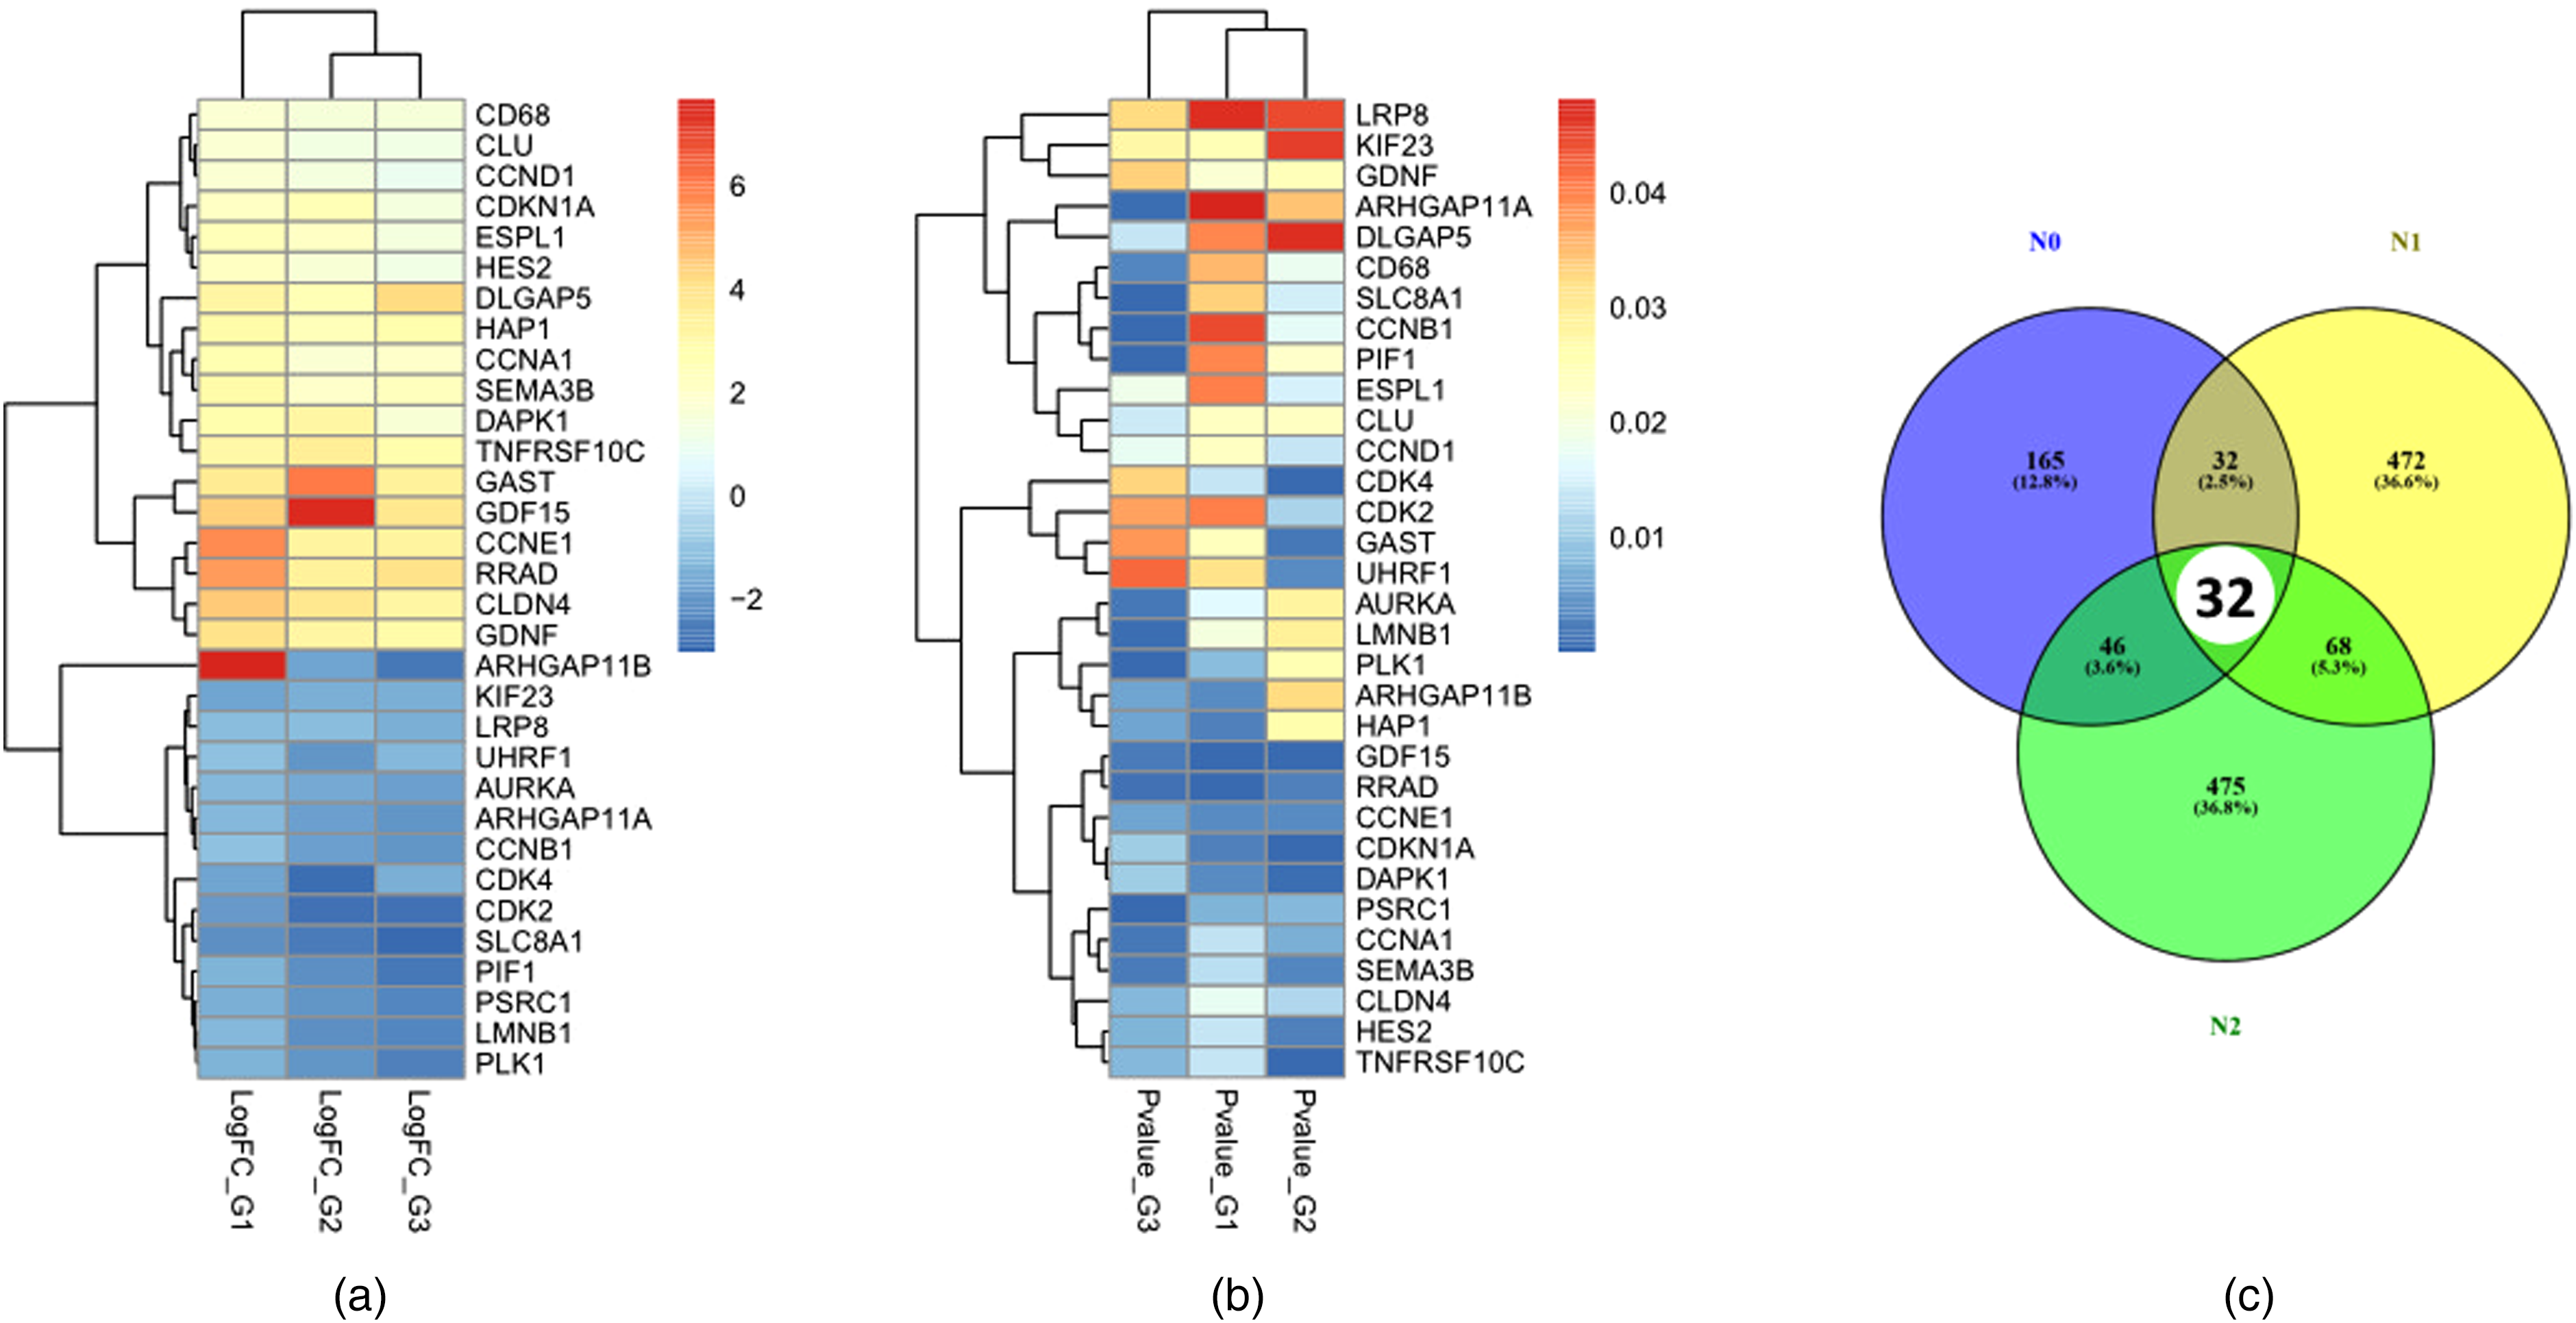
Heat map showing 32 DEGs between normal and skin cancer tissue in three groups of the GSE85443 datasets based on (a) log2 fold-change and (b) adjusted P-value. Identification of 32 common DEGs and co-expressed genes by comparing three subsets of datasets (GSE85443 G-1, GSE85443 G-2, and GSE85443 G-3) through (c) Venn diagram software representing the common DEGs between three groups of skin cancer datasets. Different colors meant different dataset groups.
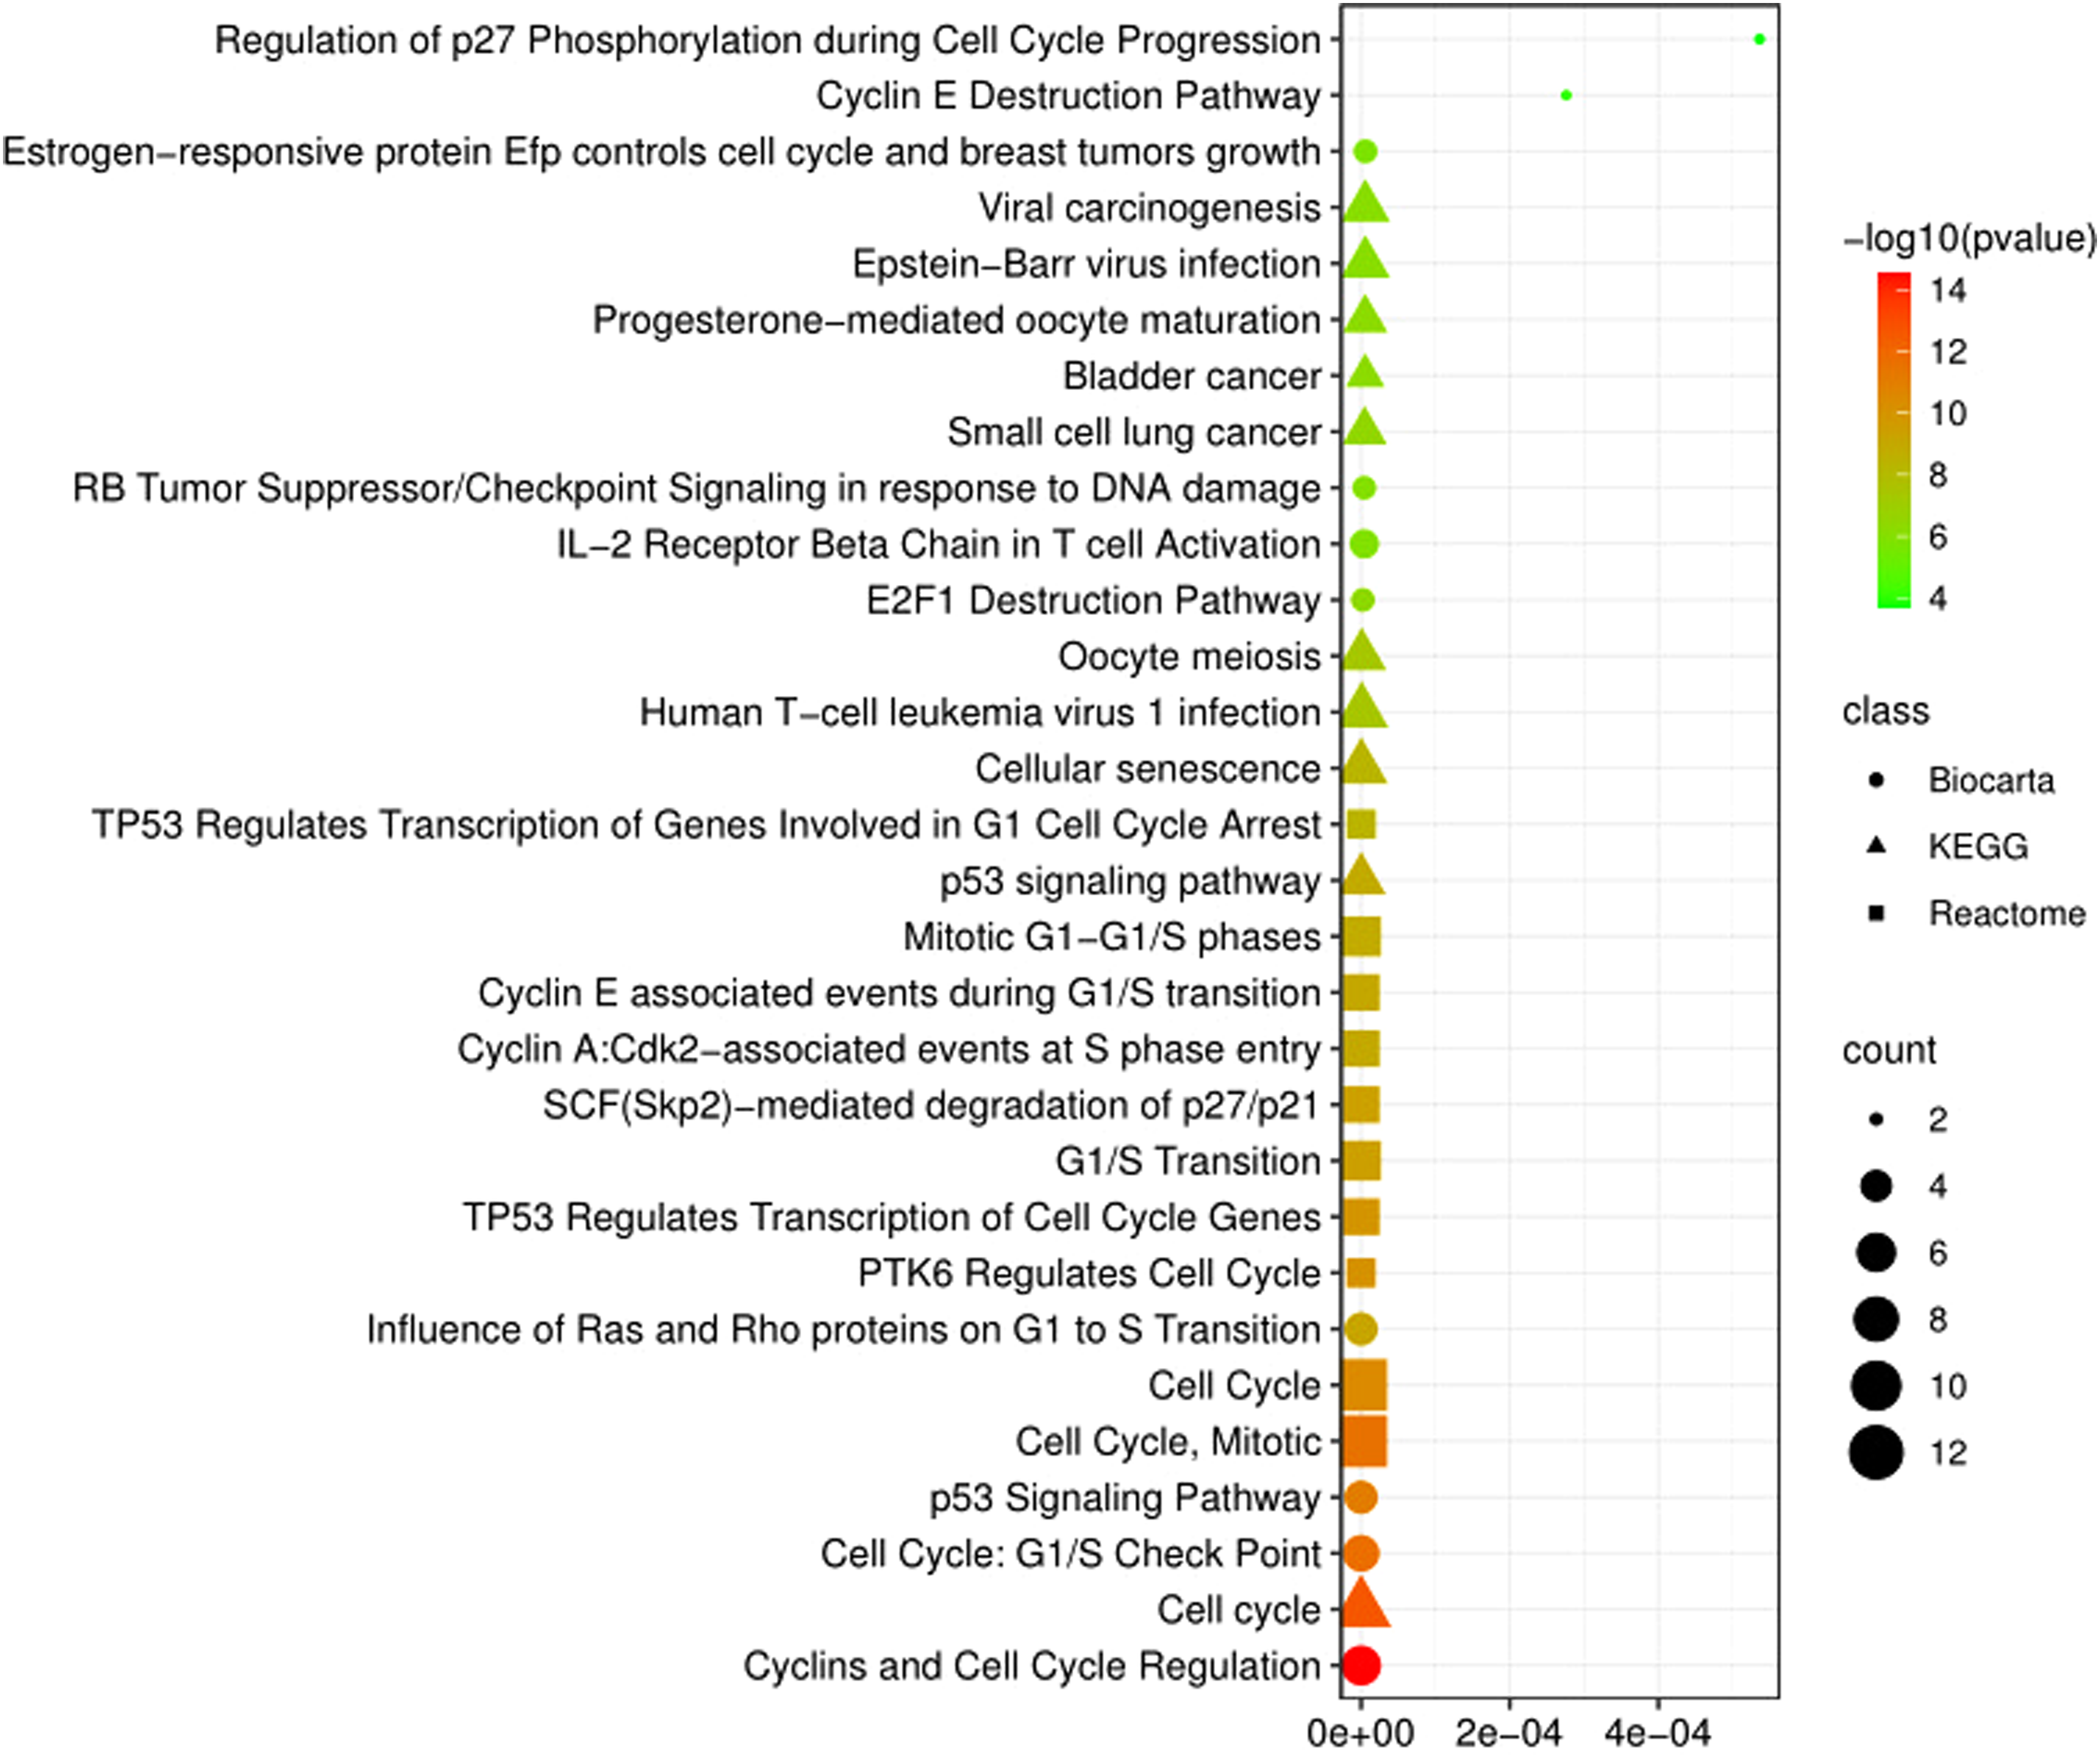
Signaling pathway analyses of the differentially expressed genes (DEGs) in skin cancer. The circular, triangle and square shapes indicate the Biocarta, KEGG, and Reactome pathways, respectively.
For classifying functional categories, we looked for DEGs that were excessively represented in three different SC sub-datasets. Figures 2 and 3 showed the top 10 pathways for each pathway term with a P-value less than 0.05 as a reference (Tables S3 and S4). To narrow GO terms, we used a statistical method with a P-value below 0.05. Among 30 GO terms, regulation of cyclin-dependent protein serine/threonine kinase activity, G2/M transition of the mitotic cell cycle, receptor-ligand activity, purine ribonucleoside triphosphate binding, and cytoskeleton were significant according to our analysis (Figure 2). The most significant signaling pathways in our study were found to be progesterone-mediated oocyte maturation, cell cycle, phosphorylation of Emi1, activation of NIMA kinases NEK9, NEK6, NEK7, cyclin and cell cycle regulation, and cell cycle: G2/M checkpoint based on a log10 P-value (Figure 3).
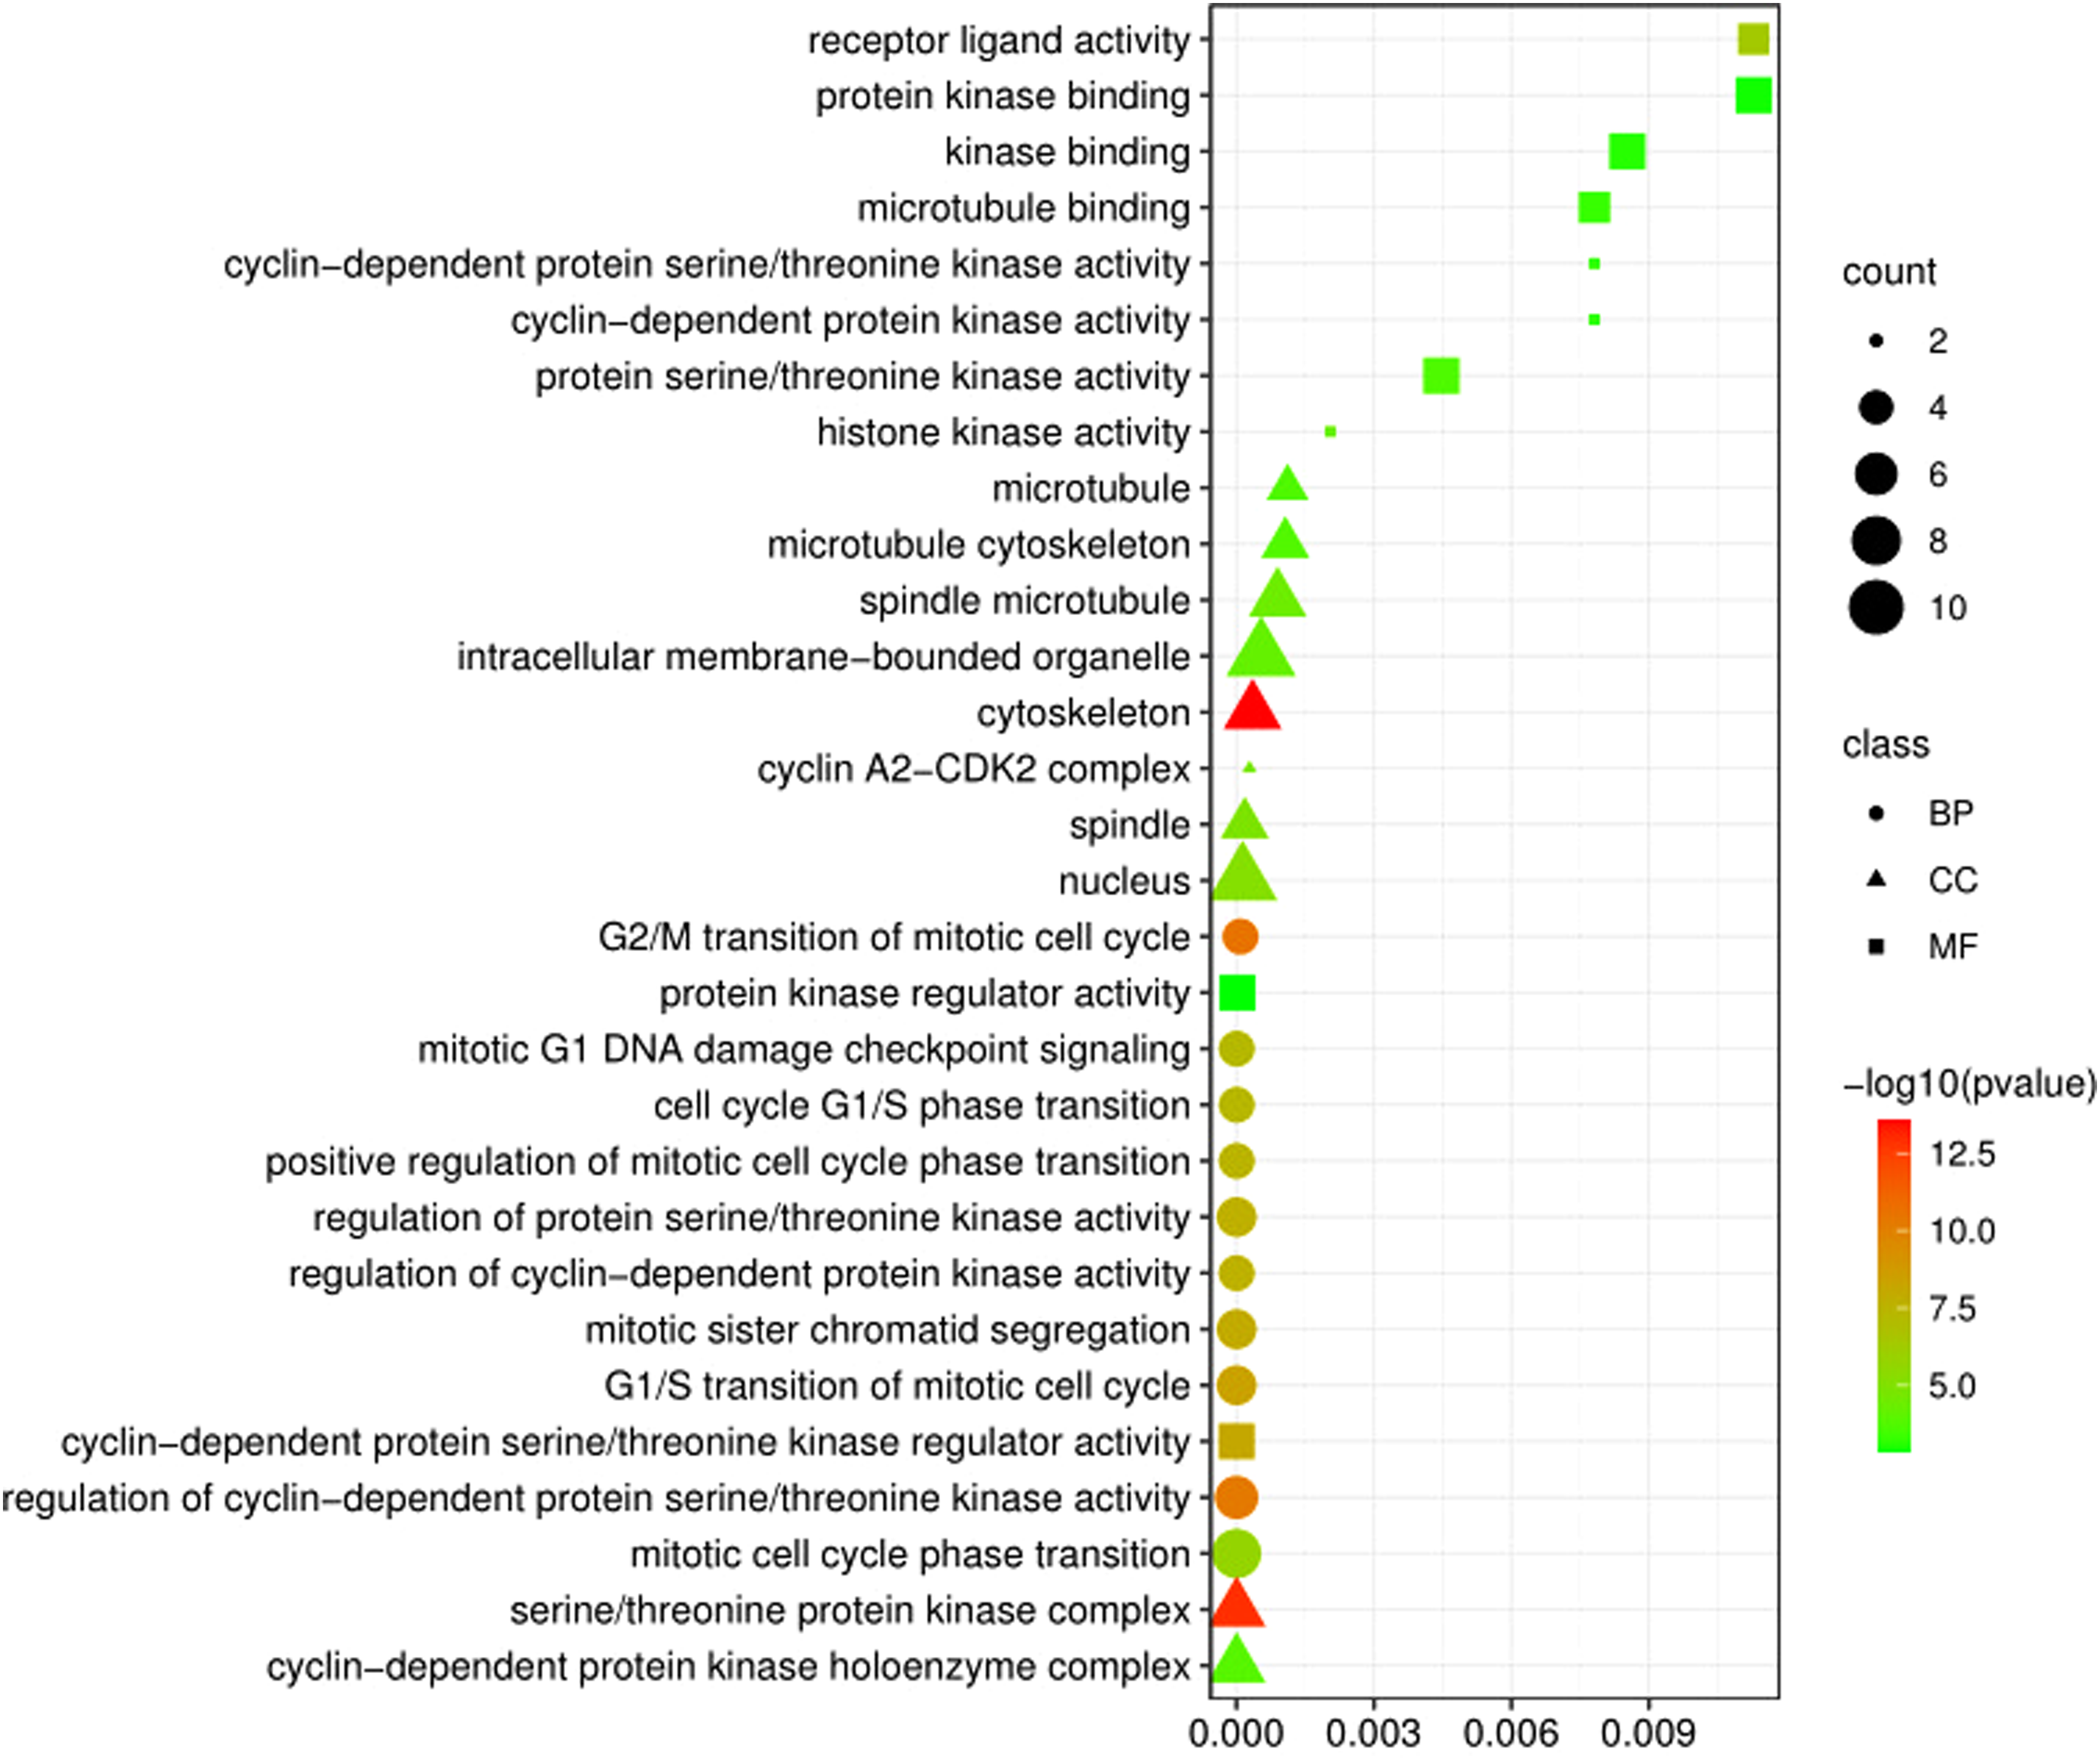
Functional enrichment analyses of the differentially expressed genes (DEGs) in skin cancer. The circular, triangle and square shapes indicate the biological process (BP), cellular component (CC), and molecular function (MF) pathway, respectively.
Identification of PPI network and selection of hub genes
A PPI network with 31 nodes and 58 edges was built using the interactions of common DEGs (Figure S3(a)). For the purpose of identifying the 12 central proteins, including CDK4, CDKN1A, PLK1, CCND1, CDK2, AURKA, CCNA1, ESPL1, CCNB1, CCNE1, KIF23, and DLGAP5, from the PPI, we used the degree algorithm of the CytoHubba plugin as shown in the Figure S3(b). Table 1 provided functional properties of the top 12 hub genes in the PPI network, and Table S5 provided all cytoHubba values of the 12 hub genes.
Survival and expression profile analysis of selective hub genes
Twelve hub genes from both the up- and down-regulated DEGs were examined for their overall relationship with survival using the GEPIA survival assessment (Figure S4). Among the 12 hub genes, AURKA, CDK2, CDK4, CCNB1, ESPL1, and PLK1 showed significantly lower overall survival in the higher group when considering P-value < 0.05 and HR. CDK4 and PLK1 showed a higher HR of about 1.6, which indicated the most survival proteins. However, based on the hub gene expression levels, we have identified that only 1 hub gene (CDKN1A) was up-regulated in normal cells, and the other 11 hub genes were up-regulated in tumor cells. Among 11 up-regulated genes, only four, including AURKA, PLK1, CDK2, and DLGAP5, were most significant and provided higher expression levels in tumor tissue than 7 hub genes (Figure S5).
Gene regulatory network study identified DEG– miRNA and TF– DEG interaction networks
The DEGs-TFs linkage networks were examined using a network-based approach to uncover transcriptional and post-transcriptional regulatory networks for common DEGs. The network of DEGs-miRNAs, TFs-miRNAs, and DEGs-TFs interactions is depicted in Figures S6(a) to (c)). In these figures, circles represent DEGs, whereas squares represent miRNAs and TFs. The biomolecules, including TFAP2A, FOXC1, GATA2, MAX, MYC, FOXL1, and PPARG were the most significant TF regulators of the identified common DEGs. Several miRNAs, including mir-1-3p, mir-7-5p, mir-147a, mir-34a-5p, and mir-124-3p, were significant and provided deep knowledge of the DEGs at the post-transcriptional regulators. AURKA and PLK1 are significant genes in a network that connects multiple edges. Biomolecules involved in regulating gene transcription and post-transcriptional processes are included in Table 2.
Summary of transcriptional and post-transcriptional regulatory biomolecules of DEGs overlapped among three groups of UV-mediated skin cancer that include (a) regulatory transcription factors and (b) regulatory microRNAs.
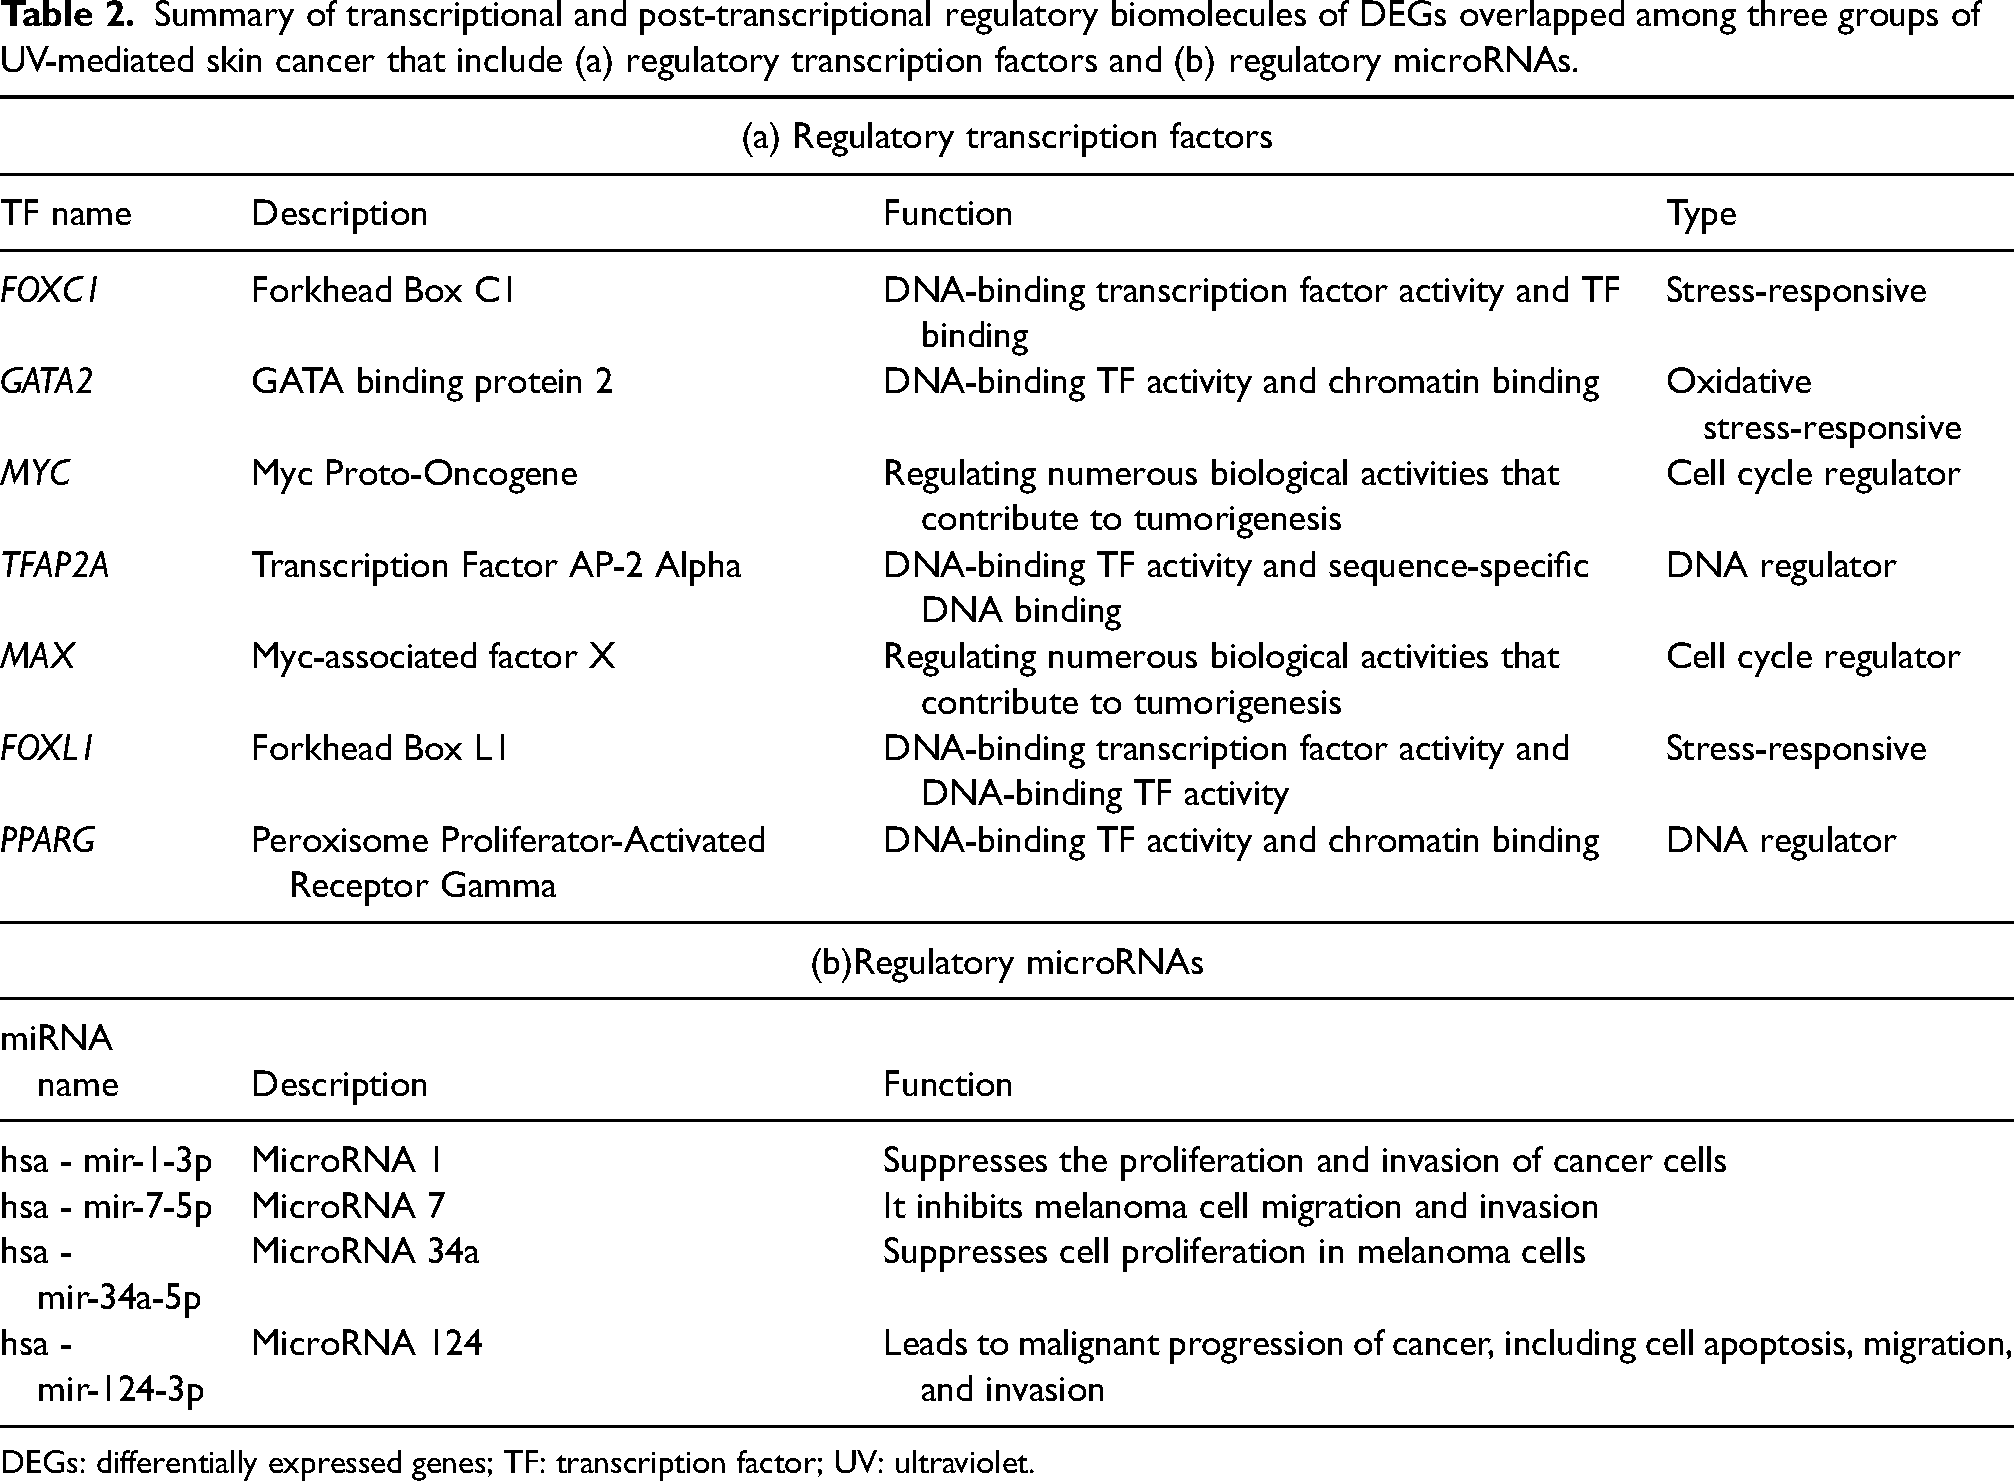
DEGs: differentially expressed genes; TF: transcription factor; UV: ultraviolet.
Analyzing protein– chemical compounds reveals protein– chemical interactions
Several proteins are interconnected to the chemical interaction networks of SC, which have been found in our study. We discovered several potentially interrelated chemical compounds, including valproic acid, coumestrol, estradiol, copper sulfate, calcitriol, cyclosporine, and benzo (a) pyrene, among highly enriched chemical agents (Figure S6(c)). This network can also identify significant proteins such as AURKA, PLK1, CCNB1, CDKN1A, UHRF1, CLU, LMNB1, CLDN4, PSRC1, LRP8, and GDF15.
Validation of potential hub genes
For ROC curve analysis, we have used three proteins, including AURKA, PLK1, and CDK4, as represented in Figure S7. Among them, AURKA (AUC = 0.8) and PLK1 (AUC = 0.7) showed acceptable values of AUC. Also, CDK4 (AUC = 0.5) demonstrated no discrimination, indicating the capacity to diagnose patients with and without the disease or condition based on the test in our study.
Discussion
The prognosis for early-stage SC is much better than for advanced-stage. Early SC detection is essential and can prevent some cancers, such as focal cell carcinoma and melanoma. We employed several systems biology and bioinformatics approaches to evaluate RNA-Seq datasets based on the NCBI-GEO database, comprising 21 UV-irradiated human keratinocyte tissues and three non-irradiated human keratinocyte tissues, to find potential predictive biomarkers in SC. Using the GEO2R online tool via Biojupies and Venn software, a set of 32 DEGs was found to be shared among three groups. Then, GO (Gene Ontology) and signaling pathway analysis were performed through the EnrichR and DAVID tools, and the findings showed that they were highly enriched in a variety of cell systems. According to the pathway assessment, metabolic responses and cell cycle regulation account for most pathways responsible for the pathogenesis and progression of UV-mediated SC. After further enrichment was performed on the DEGs, we discovered some noteworthy GOs:
Regulation of cyclin-dependent protein serine/threonine kinase activity (GO: 0000079) and G2/M transition of the mitotic cell cycle (GO: 0000086) for biological process; Spindle microtubule (GO: 0005876) and cytoskeleton (GO: 0005856) for the cellular component; Receptor ligand activity (GO: 0048018) and cyclin-dependent protein serine/threonine kinase regulator activity (GO: 0016538), respectively, for molecular function; Regulation of cyclin-dependent protein serine/threonine kinase activity (GO: 0000079): Liu et al.
28
suggested that inhibition of CDK4 and CDK2 in cell cycle regulator can be targeted as a molecular marker in SC; Cytoskeleton (GO: 0005856): Actin cytoskeleton was modulated by downregulating the AC-cAMP pathway; both collectively lead to skin carcinoma progression
29
; Receptor ligand activity (GO: 0048018): The result indicated that receptors (Eph) and ligands (ephrin) represent a new potential prognostic marker and therapeutic target in non-melanoma SC.
30
From the molecular pathway analysis, we have found progesterone-mediated oocyte maturation and cell cycle for KEGG.
Cell Cycle: G2/M checkpoint pathway and cell cycle regulation for Biocarta analysis; Phosphorylation of Emi1 and activation of NIMA kinases NEK9, NEK6, and NEK7 for Reactome; Progesterone-mediated oocyte maturation: Li et al.
31
concluded that the progesterone-mediated oocyte maturation pathway is involved in melanoma metastasis through bioinformatics analysis; Cell cycle: Rünger et al.
32
demonstrated that regulation of cell cycle checkpoints and DNA repair is responsible for UV-mediated SC; Activation of NIMA kinases like NEK9, NEK6, and NEK7 is responsible for CDK and PLK1-mediated phosphorylation.
33
Further, the STRING database was used to build the PPI network. The combined PPI analysis using Cytoscape revealed 12 hub genes based on MCC, degree, clustering coefficient, betweenness centrality, and closeness centrality. These 12 hub genes, CDK4, CDKN1A, PLK1, CCND1, CDK2, AURKA, CCNA1, ESPL1, CCNB1, CCNE1, KIF23, and DLGAP5 had diagnostic value, which distinguishes SC patients apart from the rest of the population by having the ability to discriminate between people with SC and healthy individuals as a diagnostic marker.
CDK4 triggers a G1 arrest by playing important roles in the control of the cell cycle and is overexpressed in human SCs. During the first gap phase (G1 to S) of the cell cycle, CDK4 inhibitors keep everything under control; in addition, over 90% of people with melanoma had genetic abnormalities in the CDK4 pathway. 34 CDKN1A was downregulated in melanomas, suggesting a possible involvement in carcinogenesis. 35 Raising the PLK1 expression in human melanoma like BCC and SCC is considerably overexpressed. There was also a considerable G2/M cell cycle arrest, mitotic catastrophe, and induced apoptosis in melanoma cells when PLK1 was found to be anti-proliferative. 36 G1/S and S/G2 transitions are controlled by CDK2, which helps melanoma cells aggressively by regulating CDK2 expression. 37 AURKA is a key protein in controlling the G2 to M transition in mitosis and may serve as an oncogene. 38
AURKA, CDK2, CDK4, CCNB1, ESPL1, and PLK1 showed a significant survival rate in the group with greater levels of expression, while AURKA, PLK1, CDK2, and DLGAP5 were found to have higher expression levels in tumor tissue. Additionally, CDK4 has immune-modulatory properties, and inhibiting CDK4 via the reduction of NFAT family members can significantly increase T cell activation. 39 Anti-melanoma immune checkpoint drugs can slow tumor development by decreasing CDK4/6 activity, slowing the resistance pathway, and inducing senescence. 40 Melanoma patients who have resisted anti-PD-1 treatment had evident CDK4 pathway abnormalities, including CDKN2A loss, CDK4, and CCND1 gain, which were confirmed through whole genome and RNA sequencing profiling studies. 41 As a therapeutic target for cutaneous SCC (cSCC) and PLK1, it has the advantage of already having numerous small-molecule inhibitors in clinical trials. 42 These findings add together to show that cSCC treatment focusing on PLK1 holds a lot of potential. AURKA and FOXM1 proteins play a crucial role in melanoma formation, implying that AURKA expression affects disease prognosis. As AURKA is highly expressed in melanomas, inhibiting it may have the effect of slowing tumor growth, which indicates the development of new therapies for SC treatment. 43
Table S3 shows the detailed information of seven identified significant TFs that regulate transcriptional activity during tumor cell proliferation. Only GATA2 was shown to be unrelated to the development of SC in our investigation, as verified by literature analysis. We also found several miRNA molecules; among these, mir-7-5p has antitumor effects via preventing melanoma cell invasion and migration 44 ; and mir-34a-5p suppresses cell proliferation in melanoma cells. 45 Park et al. 46 demonstrated that a new dietary component, coumestrol, may help prevent and treat UVB-induced SC. Cyclosporine A lessens SC cell death in transplant patients by inhibiting MPTP in a model of the disease's occurrence in keratinocytes. 47
Due to the near-complete coverage of the transcriptome provided by RNA-Seq compared to the limitations of prior microarray-based investigations, we have found several additional UVR-responsive target genes. In a similar study, Shen et al. 48 found that IL6, PTGS2, IL1B, CDKN1A, HMOX1, and BCL2L1 proteins that can play central roles in mediating UV responses to SC compared to our study found AURKA, PLK1, and CDK4 as the most potential biomarkers in SC therapy, which was validated by ROC curve analysis.
AURKA and PLK1 showed an acceptable value of AUC, while CDK4 showed no discrimination between disease and control states. Chang et al. 49 conducted a study using real-time qRT-PCR (Real-Time Quantitative Reverse Transcription PCR) in 10 normal skin tissues and 30 melanoma tissues and found that AURKA expression is upregulated in human melanoma carcinoma as opposed to healthy skin tissues. Su et al. 50 conducted an in-vitro investigation that revealed a possible innovative treatment strategy for thorough preclinical/clinical assessment by demonstrating a synergistic anti-proliferative response of concurrent targeting of PLK1 and NOTCH in melanoma pathways.
However, we have only done three groups of one RNA-Seq dataset. Furthermore, we clarified that our study did not focus on the UV exposure time and dose-dependent manner; we compared the UV-responsive DEGs among three groups to identify potential biomarkers. As a result, the UV exposure time and doses were different for samples in the same group. Also, our findings are based on cultured cells, which lack the complicated interactions between keratinocytes and other cell types that occur in vivo. By using ROC curve analysis, we are able to validate our hub genes. Therefore, future investigations, including in vitro studies will need to validate the discovered biomarkers.
In summary, our findings expand our understanding of UV-induced skin tumorigenesis and tumor progression. The development of drugs that target particular biological molecules has been made possible by recent research on the differences between normal and malignant cell biology. The ultimate goal of translational research is to increase antitumor efficacy while reducing the toxicity that is associated with conventional therapeutics for patients. Regardless of the similarities in gene and protein expression amongst cancer types, each patient's reaction to treatment will be unique, highlighting the necessity for personalized therapy. Conducting drug studies to translate laboratory observations into applicable medical treatments requires cooperation among researchers, physicians, and pharmaceutical industry. We recommended that targeting the AURKA and PLK1 genes can help identify potential treatment approaches that prevent or manage UV-associated SC; the clinical ramifications of these findings for future research are being bolstered.
Conclusion
The emergence of omics methods has given bioinformatics a substantial boost in recent decades. Several gene-expression changes are linked with human cancer, and the RNA sequence is one of the most utilized omics techniques for their detection. When it comes to diagnosing cancer, the most frequently utilized omics technique is using RNA sequences to uncover the myriad of gene expression alterations linked with various types of human malignancies. RNA sequence data were used in this work to examine the transcriptome of a collection of UV-irradiated human keratinocyte lesions using a constrained pipeline method. We were able to separate 21 different case states from the merging of three sub-datasets of SC by using 32 common DEGs. Three differential genes (AURKA, CDK4, and PLK1) were identified through gene ontology and molecular pathway, protein-protein interaction, survival and expression analysis, gene-regulatory network, and protein-chemical interactions. Based on findings and validation through ROC curve analysis in this study, the AURKA and PLK1 genes showed an acceptable value of AUC, which indicates viable biomarkers for SC in mostly metabolic and cell cycle regulatory pathways. According to our findings, these two genes should serve as possible biomarkers for the early identification of UV-mediated SC and turn into computational and laboratory observations for applicable clinical treatments. The AURKA and PLK1 protein expressions need to be validated as clinical biomarkers through further investigational and experimental approaches, including translational research and in vivo studies, to better understand the pathological process and anticipate UV-irradiated SC diagnosis.
Supplemental Material
sj-docx-1-jbm-10.1177_03936155241230968 - Supplemental material for Screening out molecular pathways and prognostic biomarkers of ultraviolet-mediated melanoma through computational techniques
Supplemental material, sj-docx-1-jbm-10.1177_03936155241230968 for Screening out molecular pathways and prognostic biomarkers of ultraviolet-mediated melanoma through computational techniques by Arju Hossain, Asif Ahsan, Imran Hasan, Sohel, Arif Khan, Pratul Dipta Somadder, Sumaiya Monjur, Sipon Miah, K. M. Kaderi Kibria, Kawsar Ahmed and Habibur Rahman in The International Journal of Biological Markers
Supplemental Material
sj-docx-2-jbm-10.1177_03936155241230968 - Supplemental material for Screening out molecular pathways and prognostic biomarkers of ultraviolet-mediated melanoma through computational techniques
Supplemental material, sj-docx-2-jbm-10.1177_03936155241230968 for Screening out molecular pathways and prognostic biomarkers of ultraviolet-mediated melanoma through computational techniques by Arju Hossain, Asif Ahsan, Imran Hasan, Sohel, Arif Khan, Pratul Dipta Somadder, Sumaiya Monjur, Sipon Miah, K. M. Kaderi Kibria, Kawsar Ahmed and Habibur Rahman in The International Journal of Biological Markers
Footnotes
Acknowledgements
I want to express our deep gratitude to CEO and Founder Shashi Mudunuri of the Research Square company for uploading a preprint version of our manuscript titled “Identification of molecular pathways and prognostic biomarkers with survival analysis associated with UV-mediated skin cancer by bioinformatics approaches.”
Author’s note
Md. Arju Hossain is also affiliated with Department of Microbiology, Primeasia University, Dhaka, Bangladesh. Kawsar Ahmed is also affiliated with Health Informatics Research Lab, Department of Computer Science and Engineering, Daffodil International University, Dhaka, Bangladesh.
Author contributions
Md. Arju Hossain and Asif Ahsan: provided the concept, performed the experiments, and wrote the paper; Md. Imran Hasan, Md Sohel, and Md. Arif Khan: analyzed and interpreted the data; Pratul Dipta Somadder: interpreted the data; Sumaiya Monjur: generates figures of the manuscript; Md Sipon Miah and K. M. Kaderi Kibria: edited and reviewed the manuscript; Md Habibur Rahman and Kawsar Ahmed: designed the experiments and supervised the whole project.
Declaration of conflicting interests
The author(s) declared no potential conflicts of interest with respect to the research, authorship, and/or publication of this article.
Ethical statement
We declare that our manuscript submitted to The International Journal of Biological Markers has been done in accordance with SAGE guidelines for publication ethics in a responsible way. In addition, there was no research misconduct, data and image manipulation, plagiarism issues, unethical research, biased reporting, authorship abuse, duplicate publication, or undeclared conflicts of interest during the writing and preparation of the manuscript.
Funding
The author(s) received no financial support for the research, authorship, and/or publication of this article.
Supplemental material
Supplemental material for this article is available online.
References
Supplementary Material
Please find the following supplemental material available below.
For Open Access articles published under a Creative Commons License, all supplemental material carries the same license as the article it is associated with.
For non-Open Access articles published, all supplemental material carries a non-exclusive license, and permission requests for re-use of supplemental material or any part of supplemental material shall be sent directly to the copyright owner as specified in the copyright notice associated with the article.