
Abstract
Background
Poor diet quality may contribute to undernutrition, particularly affecting young children from low-income households. Therefore, affordable and healthy local food-based recommendations (FBRs) are needed.
Objectives
This study aimed to (1) identify problem nutrient(s), (2) identify locally available nutrient-dense food sources that can provide adequate nutrients to meet the recommended dietary intakes of undernourished urban poor children aged 2-5 years, and (3) use linear programming to recommend a daily diet based on the current food patterns that achieves dietary adequacy and meets average food costs for these children.
Methods
A cross-sectional study was conducted in Seremban, Malaysia. Three-day 24-hour dietary recalls were collected from the mothers (n = 168). Food costs were estimated using market surveys. The FBRs were formulated by linear programming analysis using Optifood software.
Results
Folate was an “absolute problem nutrient” (such a nutrient does not achieve the 100% recommended nutrient intake even upon diet optimization). Full-cream milk, chocolate malted milk, fortified cornflakes, and chicken egg were the common locally available nutrient-dense foods that would provide adequate nutrients to meet the recommended dietary intakes of undernourished urban poor children. The final FBR set would ensure dietary adequacy for 8 to 9 of 11 nutrients at a cost of ringgit Malaysia (RM) 4.80/day (US $1.05/day) and RM6.20/day (US $1.34/day), depending on the age group.
Conclusions
Interventions are required to ensure dietary adequacy for undernourished urban poor children under 5 years old. Dietary adequacy could be improved via realistic changes in habitual food consumption practices.
Plain language title
Developing Local Food-Based Recommendations for Undernourished Children in Urban Poor Area in Malaysia
Plain language summary
The rapid expansion of cities and poverty in urban areas are linked to undernutrition among children under 5 years, especially those from low-income families. Limited access to healthy foods is a common problem, as families may reduce the frequency of meals or compromise on food quality to cope with financial challenges in urban areas. This can lead to poor diet quality, which affects children's growth and overall health. In this study, 168 undernourished children were recruited, in which their mothers were interviewed about their dietary intake. Folate was identified as a critical nutrient of concern. Full-cream milk, chocolate malted milk, fortified cornflakes, and chicken eggs were common local foods rich in nutrients that could help to meet the recommended dietary intakes of these children. The findings of this study highlighted the potential for improving nutrition through careful selection of food combinations. By including locally available foods, the recommended combinations met the needs of 8 to 9 of 11 micronutrients for the 2-3 year olds and the 4-5 year olds, respectively, at a low cost. The estimated daily cost of implementing these recommendations was RM4.80 (US $1.05) for undernourished children aged 2-3 years and RM6.20 (US $1.34) for undernourished children aged 4-5 years.
Introduction
Global transitions in economic development and sociodemographic patterns have led to diet and lifestyle changes. 1 These changes have in turn affected children's nutritional and health status globally. 2 Many developing countries, including Malaysia, continue to contend with the issue of undernutrition among children aged under 5 years, which persists at medium to high levels of public health significance.3,4 Undernutrition is a significant contributor to child mortality, where it was suggested that 45% of all deaths among children under 5 years old were attributable to undernutrition. 5 Despite its status as an upper middle-income country, stunting and wasting persist in Malaysia at levels above the global average (global averages for upper middle-income country are 8.3% and 1.7% for stunting and wasting, respectively, 6 compared to 21.2% and 11% for Malaysia 4 ).
Rapid urbanization and urban poverty were linked to undernutrition among children under 5 years.7–9 A Malaysian study highlighted that children from low-income and poor socioeconomic status households were at increased risk of poor nutritional status, which leads to impaired growth and development. 10 While there are multiple causes of undernutrition, inadequate diets are one of the important determinants. Therefore, it is imperative to develop food-based recommendations for children in low-income households. Such recommendations would address the persistent challenge of impaired growth and development resulting from undernutrition.
The World Health Organization (WHO)/United Nations Children's Fund Global Strategy for Infant and Young Children Feeding emphasized the importance of using locally available foods as a critical strategy to promote optimal growth and development in young children. 11 A linear programming (LP) approach was developed to formulate nutritional recommendations for specific populations. LP was also used to identify nutrients for which dietary adequacy might be challenging to achieve through a practical food-based approach. 12 LP was an effective strategy for addressing the complexities involved in developing dietary recommendations. Furthermore, LP can identify feasible, affordable, and locally accessible food options to meet the recommended nutrient intakes (RNIs) for energy and nutrients. This identification is achieved while considering multiple food constraints, such as availability, patterns, portion sizes, and costs. 13
LP has been used to develop optimal local food combinations in several countries, which include Ghana, 14 Bangladesh, 14 and Latin America 14 and dietary recommendations in Indonesia15,16 and Cambodia. 17 Furthermore, LP has been instrumental in developing diet optimization models tailored to improve the diet quality of specific populations in Malaysia, such as young children, 18 low-income university students, 19 adults, 20 and low-socioeconomic status women. 21 Overall, dietary recommendations derived from current food patterns are more realistic and easier to implement. 22 Nevertheless, to the best of the authors’ knowledge, there have been no previous efforts to develop balanced dietary recommendations that incorporate local foods specifically tailored to undernourished urban poor children while minimizing costs.
This study aimed to (1) identify problem nutrient(s), (2) identify locally available nutrient-dense food sources that can provide adequate nutrients to meet the recommended dietary intakes of undernourished urban poor children aged 2-5 years, and (3) using LP to recommend a daily diet based on the current dietary intake that achieves dietary adequacy and meets average food costs for these children. The findings provide valuable insights to policymakers and health professionals. Furthermore, the findings highlight the potential role of diet optimization models as a child nutrition promotion tool for urban poor children.
Methods
Subjects and Sampling
A cross-sectional study was conducted among undernourished children aged 2-5 years old from September 2021 to May 2022 in Seremban, Negeri Sembilan, Malaysia. A complete list of 114 Seremban preschools was obtained from the Community Development Department. A total of 40 preschools were randomly selected from the list. Undernourished children were identified with a screening program. Undernourished children aged 2-5 years old from low-income families (< ringgit Malaysia [RM] 4210 per month, 23 approximately US $878 per month) were eligible for study enrollment. The study excluded children with a history of chronic illness and physical disabilities. The estimated sample size of 164 was calculated using the 2-population proportion formula 24 according to the nutrient inadequacy proportions in Malaysian children (27.8% of children aged 1-3 years and 55.3% of children aged 4 to 6 years had inadequate zinc intake). 10 A precision of 0.05, a power of 80%, and a confidence level of 95% were considered.
Ethical approval was obtained from the Universiti Putra Malaysia Ethics Committee for Research Involving Human Subjects (Reference: JKEUPM-2021-145) in accordance with the Declarations of Helsinki. Additionally, permission to conduct the study at the selected preschools was obtained from the Community Development Department and management offices of the selected preschools. Informed consent was obtained from the mothers before the study commenced.
Sociodemographic Profile
Child, parent, and household information were collected through interviews with the mothers. This information included the child's age, sex, and ethnicity; the mother's age and educational level; the father's age and educational level; and monthly household income.
Anthropometric Assessment
The children's weight and height were measured in duplicate following WHO guidelines. 25 Weight was measured to the nearest 0.1 kg with a TANITA Digital Weight Scale HD662 (TANITA, Japan). Height was measured to the nearest 0.1 cm using a SECA stadiometer model 213 (SECA, Hamburg, Germany). Anthropometric data were analyzed using WHO Anthro version 3.2.2 (Geneva, Switzerland) to generate the children's z scores for weight-for-age, height-for-age, and weight-for-height. The children were classified as underweight, stunted, or wasted if their weight-for-age, height-for-age, or weight-for-height were below 2 standard deviations, respectively.
Dietary Assessment
Dietary intakes (energy, macronutrients, and micronutrients) and dietary adequacy were assessed using 3-day 24-hour dietary recalls (2 weekdays and 1 weekend). During weekdays, the 2-3-year-old children had 4 meals (breakfast, morning tea, lunch, and afternoon tea) at their preschools and had dinner and supper at home. The 4-5-year-old children had 2 meals (breakfast and morning tea) at their preschools and had lunch, afternoon tea, dinner, and supper at home.
The preschool menus were obtained from the relevant authority to determine the children's dietary intakes during weekdays. The preschools involved followed a cyclical menu approach in providing food and beverages to the children. The preschool cooking recipes were also requested, which described the specific food ingredients, their quantities, and food preparation methods. The teachers and kitchen helpers were interviewed to recall the children's dietary intake at preschools during weekdays, while the mothers were asked to recall their child's dietary intake at home and during weekends by providing their best-estimated portion size based on standard household measurements. The dietary data were used to assess the children's food patterns to plan a diet that accommodated their preferences.
All dietary recalls were analyzed to compile a list of foods the children consumed (“the food list”), measure the portion size (“food portion size”), and characterize each child's food pattern (the number of servings per day for each food group). The food groups were categorized based on Optifood software. The dietary intake was analyzed with Nutritionist Pro Nutrition Analysis Software (version 3.1.0; First Data Bank, San Francisco, CA, USA) together with the Malaysian food composition databases.26,27 Subsequently, dietary adequacy (measured in percentages) was evaluated by comparing the mean energy and nutrient intake values with the RNI for Malaysians. 28 A child who did not meet 100% of the RNI for micronutrients (vitamins A, B6, B12, C, thiamine, riboflavin, niacin, and folate; calcium; iron; and zinc) was considered to have an inadequate micronutrient intake. 29 These specific micronutrients were selected based on Brouwer et al, 29 who aimed to develop dietary recommendations for undernourished children.
Market Survey
The food costs of basic foods (eg, rice, noodles, eggs, and cooking oil) were identified by obtaining food prices from the Malaysian Ministry of Domestic Trade and Cost of Living. A market survey was conducted in nearby markets, supermarkets, and convenience stores to determine the cost (RM) per 100 g edible portion for all other foods consumed by the children as identified in the dietary recalls. Three prices were recorded for each food item, and the dietary recommendations were developed based on the average price.29,30
The average cost per 100 g edible portion was used to calculate the monetary values of the foods reported in the dietary recalls to their respective weight equivalents. 29 Each child's daily dietary cost was calculated by multiplying the amount consumed (g) by the average price per 100 g (RM/100 g). 29 For example, the daily dietary cost for a single apple was calculated as follows.
100 g of apple = RM0.68 edible portion of apple = 88%
100 g edible portion of apple = RM0.68 ×
If apple consumed = 150 g
Dietary cost of apple = 150 g ×
The cost of each food item consumed by a child was aggregated to represent the daily dietary cost. 29 This method has been used in previous studies.31,32 The children's 75th percentile of the daily dietary cost distribution was assumed to represent the upper limit of the daily dietary cost of an affordable diet. 29
LP Analysis
A series of optimized 7-day diets was generated using Optifood version 4.0.14.0. All alternative food-based recommendations (FBRs) were tested to select the best FBR sets based on their ability to meet nutrient requirements and minimize food costs. The mathematical models and model constraints were detailed previously. 12 The constraints for generating 7-day diets generally include nutrient requirements, available food items, nutritional content of foods, and food consumption patterns (minimum, average, and maximum servings of specific food items, food subgroups, and food groups) to ensure the diets are realistic and culturally appropriate.
Optifood Model Parameters
The Optifood model parameters were established based on the dietary data. The model parameters were derived by multiplying the 3-day 24-h dietary recalls by 7 and subsequently dividing by 3 to simulate weekly food consumption. The portion sizes for all food items were determined as the recruited children's median portion size. The analysis included only food items consumed by >5% of all recruited children as reported in the dietary recalls, while foods consumed by <5% of all recruited children were excluded from the analysis.
All analyses were subjected to constraints to ensure that the modeled diets remained realistic. The aforementioned constraints were (1) mean energy requirements; (2) the weekly minimum (10th percentile), average (50th percentile), and maximum (90th percentile) serving numbers from food (sub)groups; and (3) specifying the weekly minimum and maximum portion sizes (g) for each food item.
The analysis involved running Optifood modules 1-3. Module 1 was primarily used to check whether the model parameters were realistic. Module 2 was used to identify the diet that could meet or meet as closely as possible the nutrient requirements within the parameters and the best possible diet regardless of the parameters. Furthermore, problem nutrients and food sources of problem nutrients were identified using module 2 and formed the basis of the food-based dietary recommendations. Alternative food-based dietary recommendations were evaluated and compared using module 3. The evaluation and comparison considered current food consumption patterns, nutrient requirements, and cost.
Problem Nutrients Identification
The Optifood analysis classifies problem nutrients as either “partial” or “absolute.” A partial problem nutrient has <100% requirement (% RNI) in the best diet generated in module 2, but >100% requirement in the maximized diets generated in module 3. Contrastingly, an absolute problem nutrient has <100% requirement (% RNI) in both the module 2 best diet and the module 3 maximized diets.
Food-Based Recommendations Selection and Testing
The individual FBRs in module 3 were selected for evaluation if (1) the food groups had a higher number of servings of foods in the module 2 nutritionally best diet (nonfood pattern) than the median observed for those food groups (food pattern) and (2) individual food items contributed >5% of the nutrient content for at least 2 micronutrients in the module 2 nutritionally best diet, which is usually presented at their respective food subgroup level. 29
Within the module 3 minimized diets, each FBR was screened to select an FBR subset for further systematic analysis. The FBR subset was selected by comparing the nutrient values in the minimized diets (from the worst-case scenario) of all FBRs to identify an FBR combination that would likely provide the highest levels of all 11 micronutrients modeled. Subsequently, all possible combinations of the selected FBRs were tested.
In this analysis series, achieving population-level dietary adequacy for a nutrient was defined as having a minimized 7-day diet value >65% of the RNI for that nutrient. Thus, a cutoff of 65% of the RNI was considered necessary for the modeled diets with the lowest nutrient content to ensure nutrient adequacy for nearly the entire population. The final FBR combination was selected based on 2 key criteria: (1) the FBR combination that covered >65% of the RNI for the highest number of nutrients and (2) the FBR combination with the lowest diet cost.
Results
Participant Characteristics
A total of 168 undernourished children were recruited (85 children aged 2-3 years old and 83 children aged 4-5 years old; Table 1). Among the 2-3-year-old undernourished children, 32.9% were underweight, 51.8% were stunted, and 27.1% were wasted. Among the 4-5-year-old undernourished children, 36.1% were underweight, 48.2% were stunted, and 41% were wasted. Almost all (99.4%) of the mothers had completed secondary education. The monthly household income of 31.5% of the families was <RM2399 (approximately US $530).
Background Characteristics of the Undernourished Urban Poor Children by age Group.
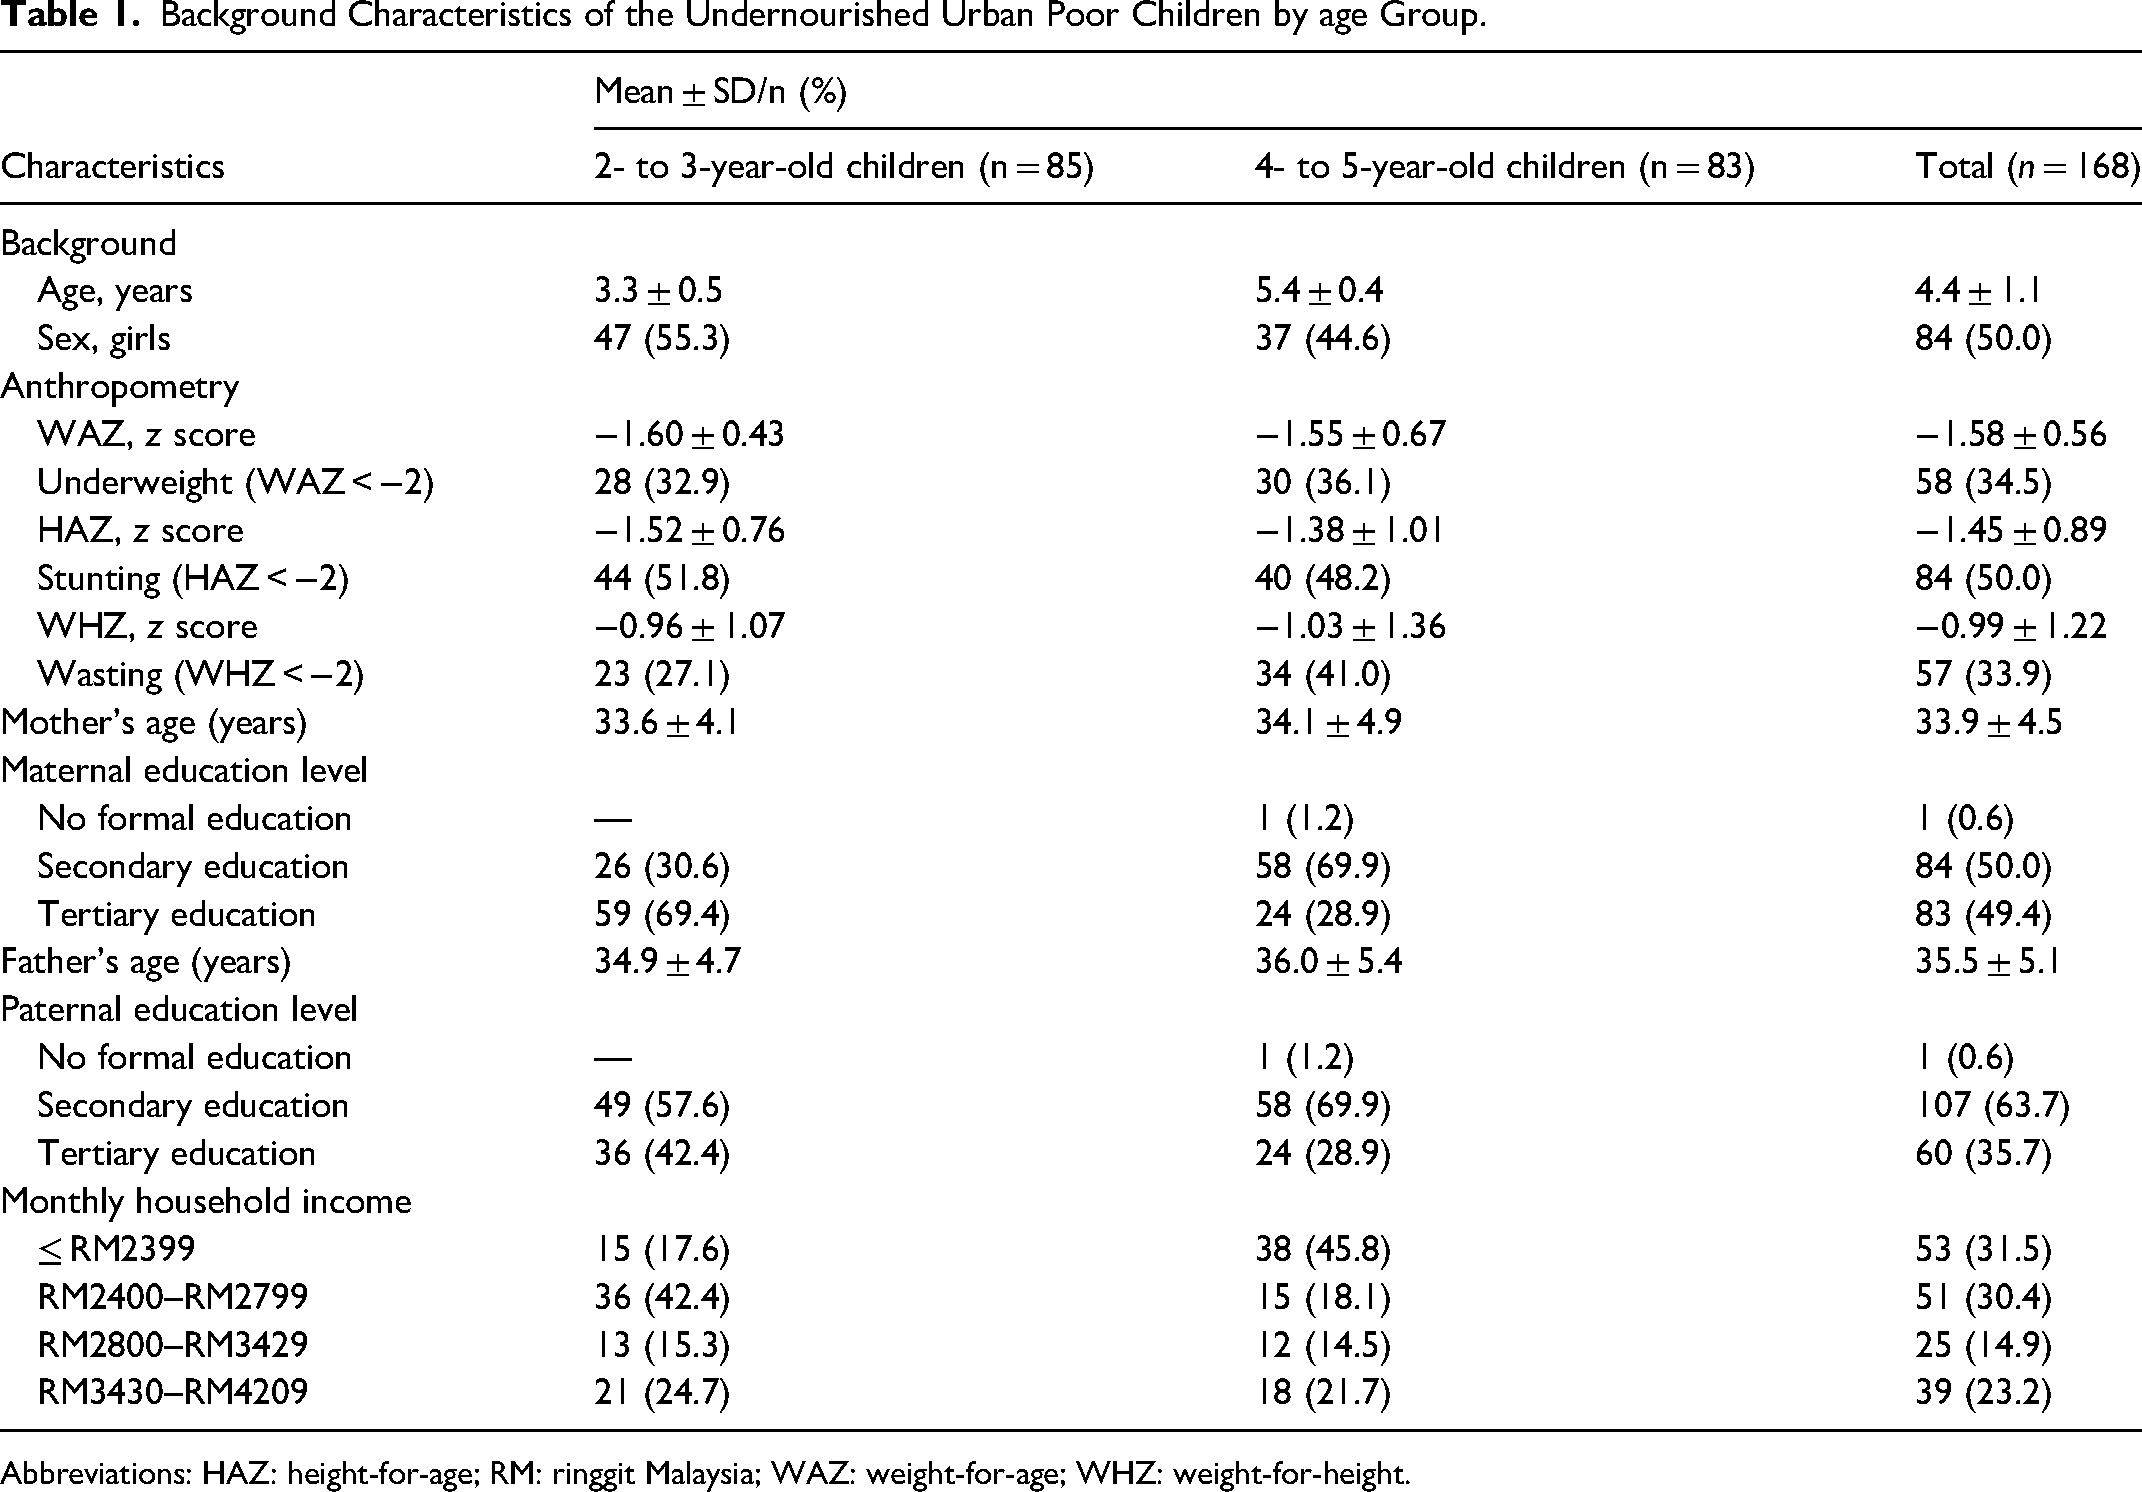
Abbreviations: HAZ: height-for-age; RM: ringgit Malaysia; WAZ: weight-for-age; WHZ: weight-for-height.
Food Patterns and Nutrient Intake
The Malaysian RNI states that 1-3-year-old and 4-6-year-old children have different nutrient requirements. 28 Therefore, the children in this study were categorized into 2 age groups (2-3 years old and 4-5 years old). In their dietary recalls, the 2-3 year olds and 4-5 year -olds reported a total of 90 and 92 food items, respectively (Supplementary Tables 1 and 2). The top 3 food groups with the highest median consumption for both age groups were meat, fish, and egg (MFE); vegetables; and cereals and cereal products. Of these aforementioned food groups, the 2-3 year olds consumed 35, 30, and 26 servings per week, while the 4-5 year olds consumed 42, 37, and 30 servings per week, respectively (Supplementary Table 3).
Among the 2-3 year olds and 4-5 year olds, 49% of the foods (44 of 90 foods) and 52% of the foods (48 of 92 foods), respectively, had serving sizes >10 g/day (Supplementary Tables 1 and 2). The estimated 75th percentile of daily diet costs ranged from RM11.08 (approximately US $2.42) among the 4-5 year olds to RM13.81 (approximately US $3.02) among the 2-3 year olds (data not shown). Overall, the children consumed 2 to 3 main meals and 1 to 3 snacks daily.
Table 2 presents the nutrient intake and RNI achievement results for both age groups. Energy (70%), carbohydrate (82%), fat (65%), niacin (93%), folate (29%), vitamin B12 (97%), calcium (37%), and zinc (52%) intakes did not achieve 100% of the recommended intakes.
Nutrient Intakes and RNI Achievement of the 168 Undernourished Children by age Group.
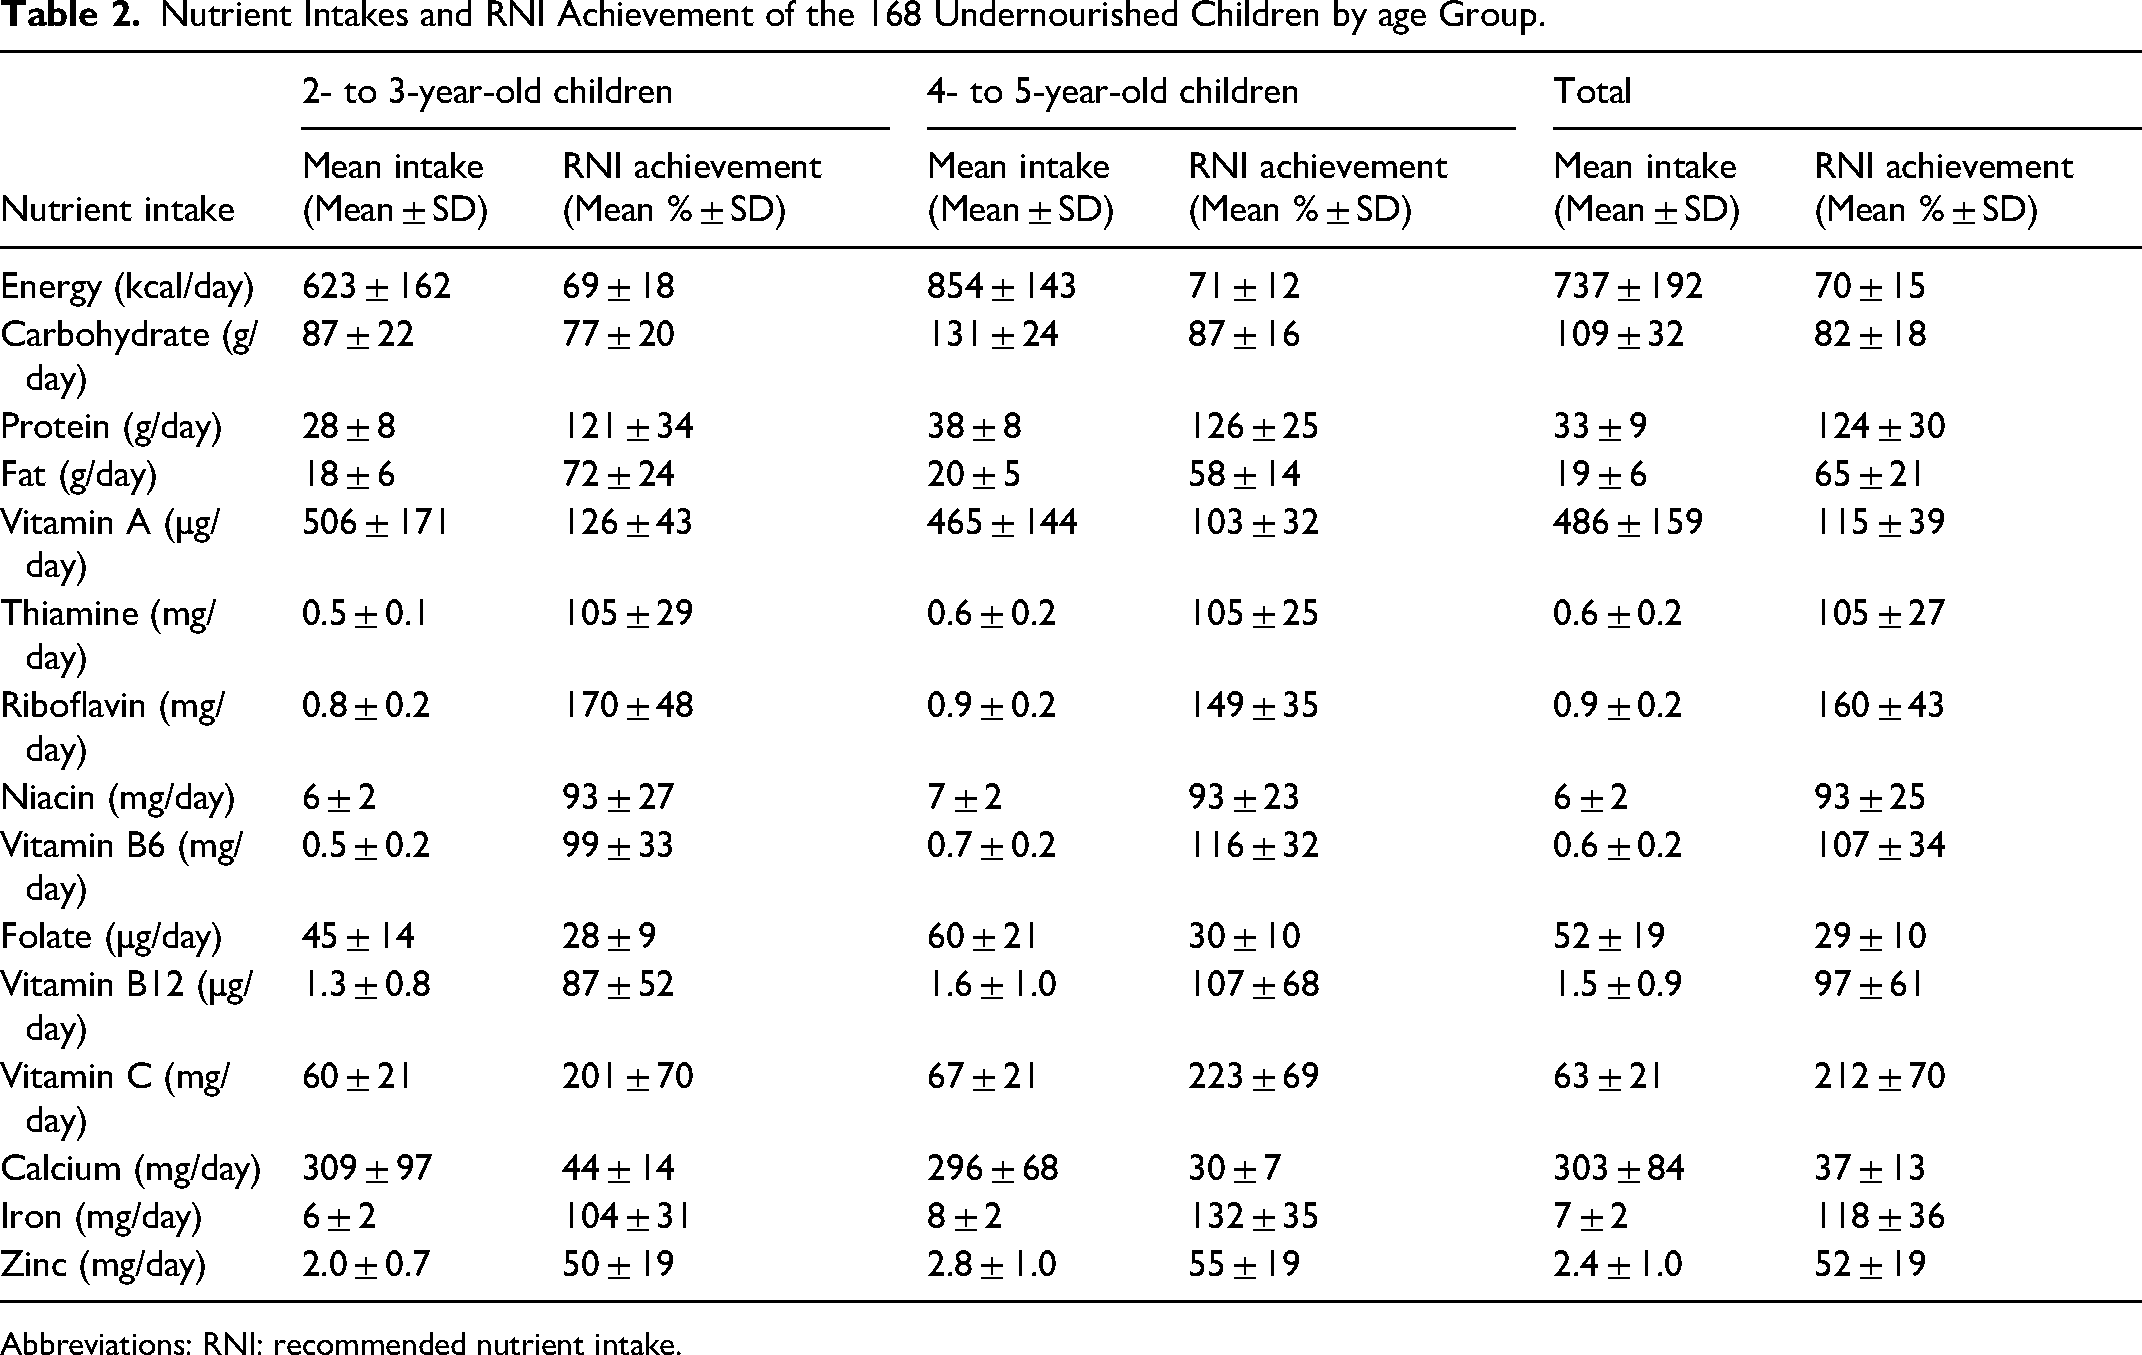
Abbreviations: RNI: recommended nutrient intake.
Optimized Food Patterns and Nutrient Achievement
Problem Nutrients
Both age groups had problem nutrients (Table 3). Only folate was considered an absolute problem nutrient in both age groups. In the 2-3-year age group, the 2 best diets formulated in module 2 slightly differed in cost. The “food pattern” diet cost RM6.00/day (approximately US $1.31/day), while the “nonfood pattern” diet cost RM6.20/day (approximately US $1.35/day). Similarly, the 2 best diets formulated in module 2 for the 4-5-year age group had different costs. The “food pattern” diet cost RM8.40/day (approximately US $1.83/day), while the “nonfood pattern” diet cost RM7.40/day (approximately US $1.61/day).
Comparison of Energy and Nutrient Intakes from the 2 “Nutritionally Best Diets” Based on Module 2 and the Type of Problem Nutrient Adequacy Based on Module 3 (Worst–Best Case Scenario) Based on Actual Portion Size of Undernourished Urban Poor Children.
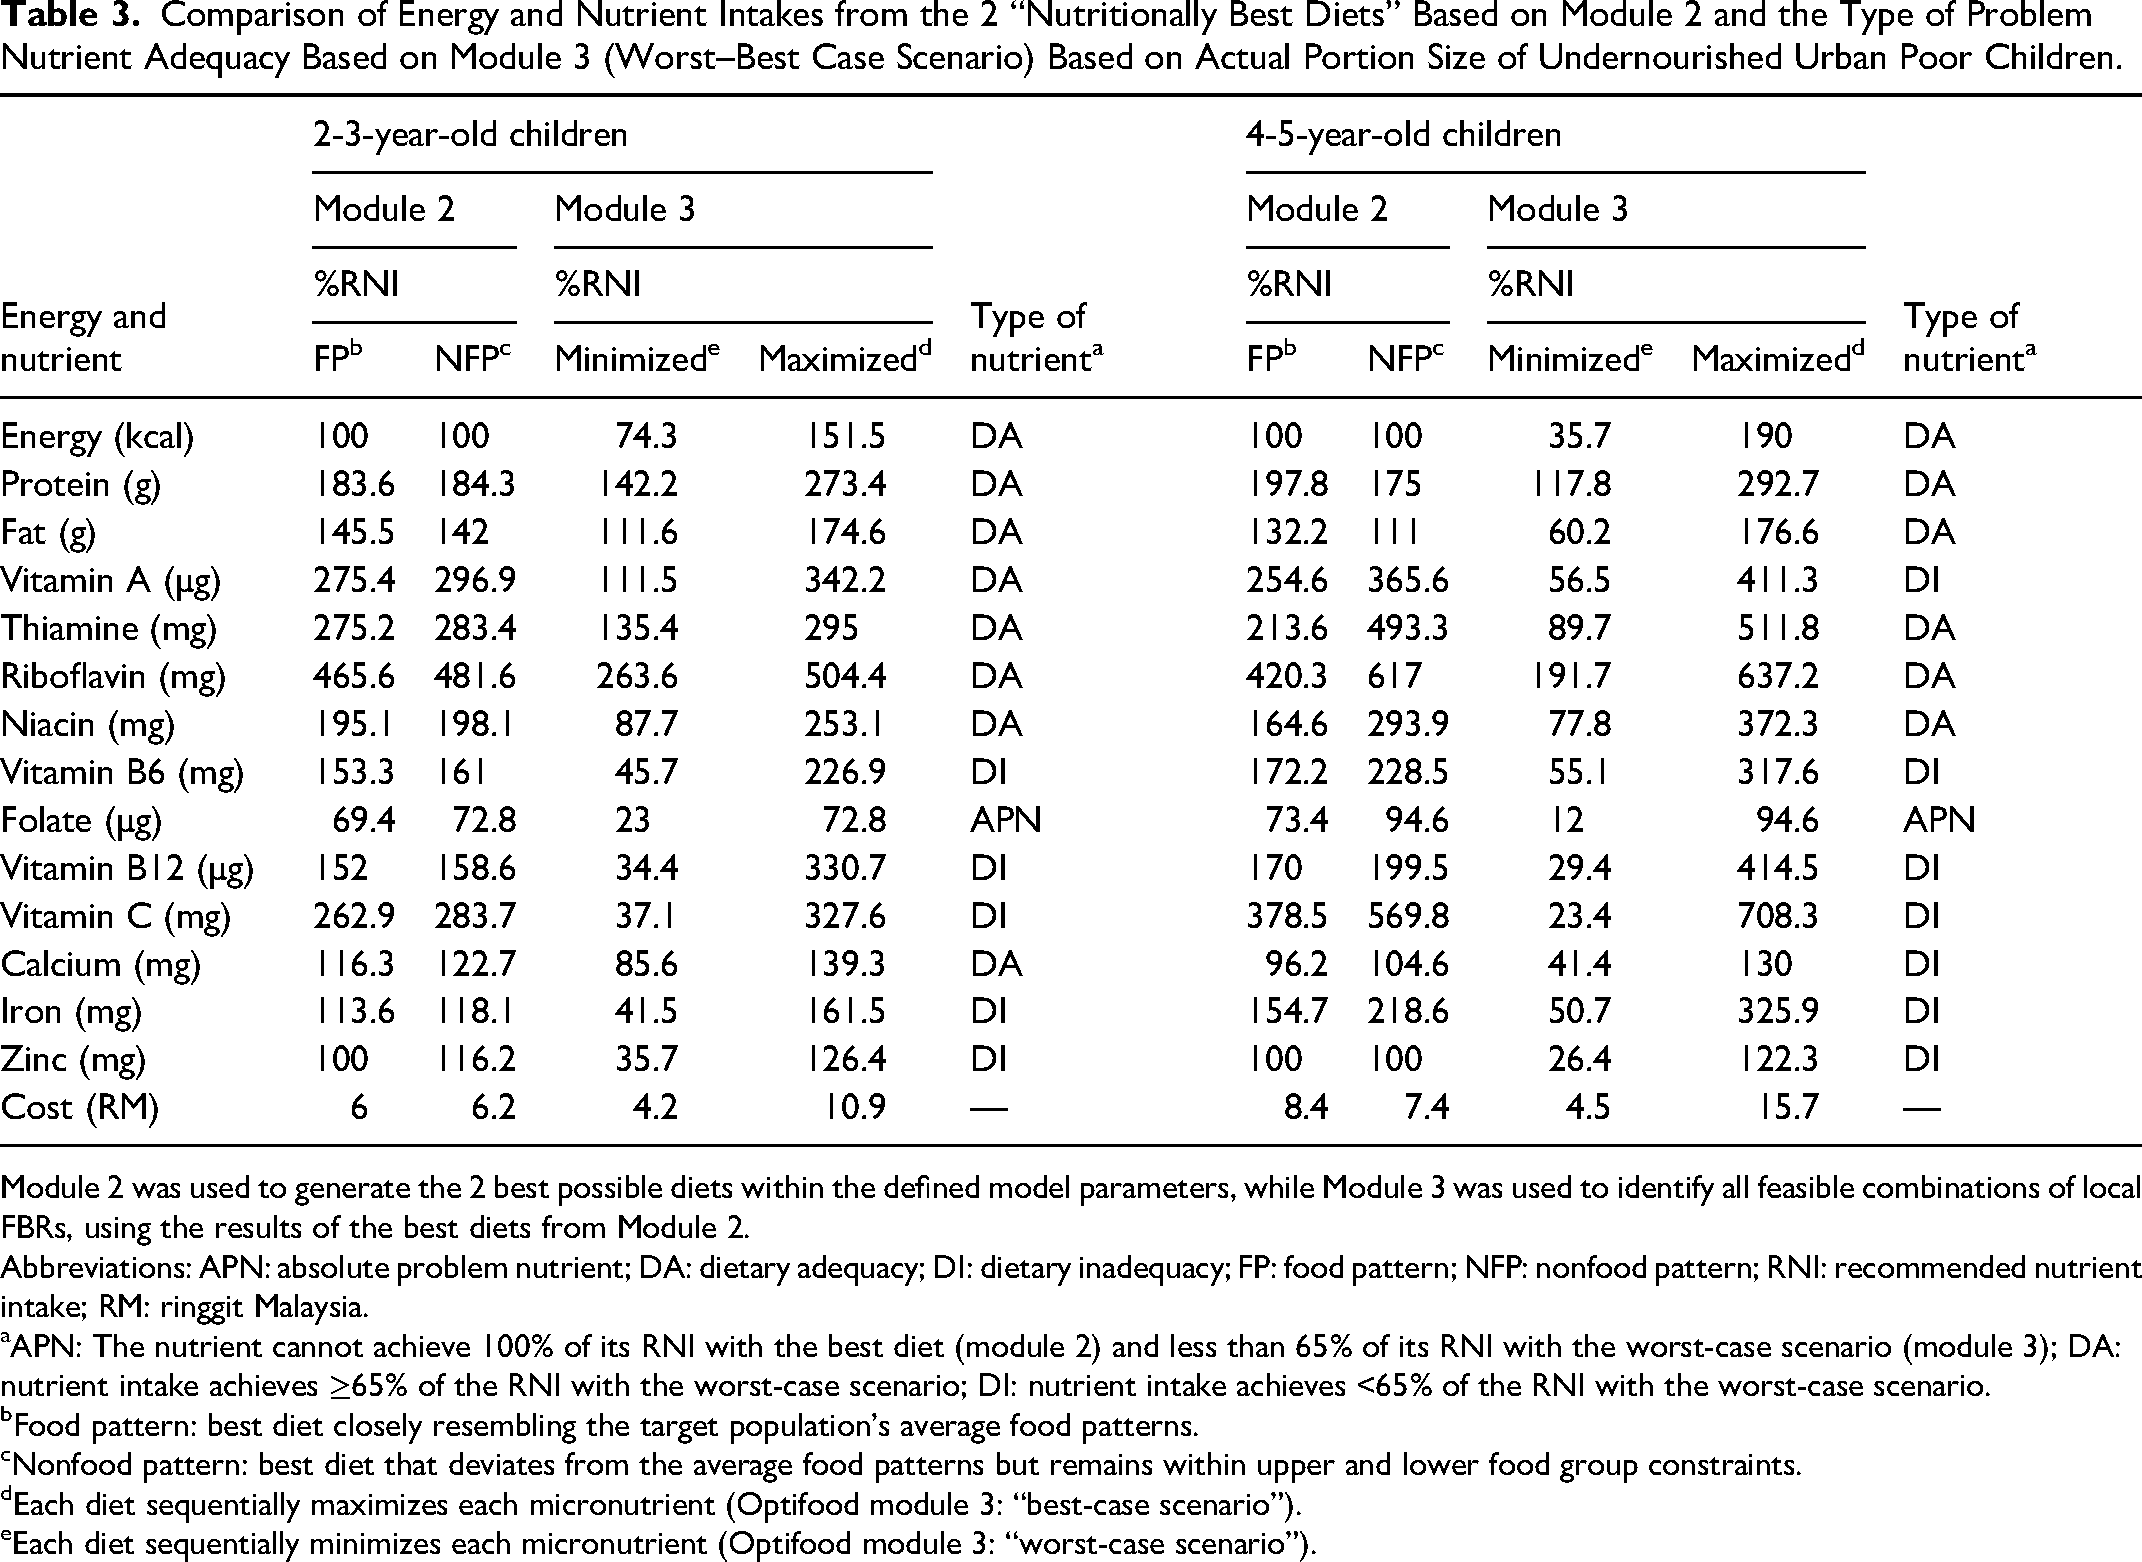
Module 2 was used to generate the 2 best possible diets within the defined model parameters, while Module 3 was used to identify all feasible combinations of local FBRs, using the results of the best diets from Module 2.
Abbreviations: APN: absolute problem nutrient; DA: dietary adequacy; DI: dietary inadequacy; FP: food pattern; NFP: nonfood pattern; RNI: recommended nutrient intake; RM: ringgit Malaysia.
APN: The nutrient cannot achieve 100% of its RNI with the best diet (module 2) and less than 65% of its RNI with the worst-case scenario (module 3); DA: nutrient intake achieves ≥65% of the RNI with the worst-case scenario; DI: nutrient intake achieves <65% of the RNI with the worst-case scenario.
Food pattern: best diet closely resembling the target population's average food patterns.
Nonfood pattern: best diet that deviates from the average food patterns but remains within upper and lower food group constraints.
Each diet sequentially maximizes each micronutrient (Optifood module 3: “best-case scenario”).
Each diet sequentially minimizes each micronutrient (Optifood module 3: “worst-case scenario”).
Potential Nutrient-Dense Foods
The nutrient-dense food sources with the potential to improve dietary adequacy in the 2-3 year olds were full-cream milk, chocolate malted milk, fortified cornflakes, chicken egg, and water spinach. Among the 4-5 year olds, the nutrient-dense food sources were chocolate malted milk, full-cream milk, chicken egg, fortified cornflakes, and fortified chocolate cereal. Whether used individually or in combination, these food items were incorporated into FBR draft 1 to produce alternative FBR sets for testing in module 3.
FBR Selection and Nutrient Achievement
Eleven alternative FBR sets were formulated and compared in module 3 for the 2-3 year olds, considering their nutrient levels in the worst-case scenario and diet cost (Table 4). None of the alternative FBRs achieved 65% of the RNI for all nutrients, except protein, fat, vitamin A, thiamine, riboflavin, niacin, and calcium. The FBRs S6, S8, S9, S10, and S11 were the most promising alternative FBRs. These FBRs achieved >90%, >80%, and >75% of the RNI for vitamin B6, vitamin B12, and vitamin C, respectively, depending on the specific FBR sets. Nonetheless, folate still did not achieve 65% of the RNI. FBR S11 was selected as the final FBR as it had the highest nutrient levels in the worst-case scenario for all nutrients (n = 8) and cost RM4.80/day (approximately US $1.05/day).
Comparisons of Nutrient Levels of the 2 Best Diets (from Module 2), Best-Case and Worst-Case Scenario Diets Without Food-Based Recommendations (FBR; From Module 3), and Alternative Sets of FBR Tested (From Module 3; Worst-Case Scenario Only) of the 2- to 3-Year-Old Undernourished Urban Poor Children.
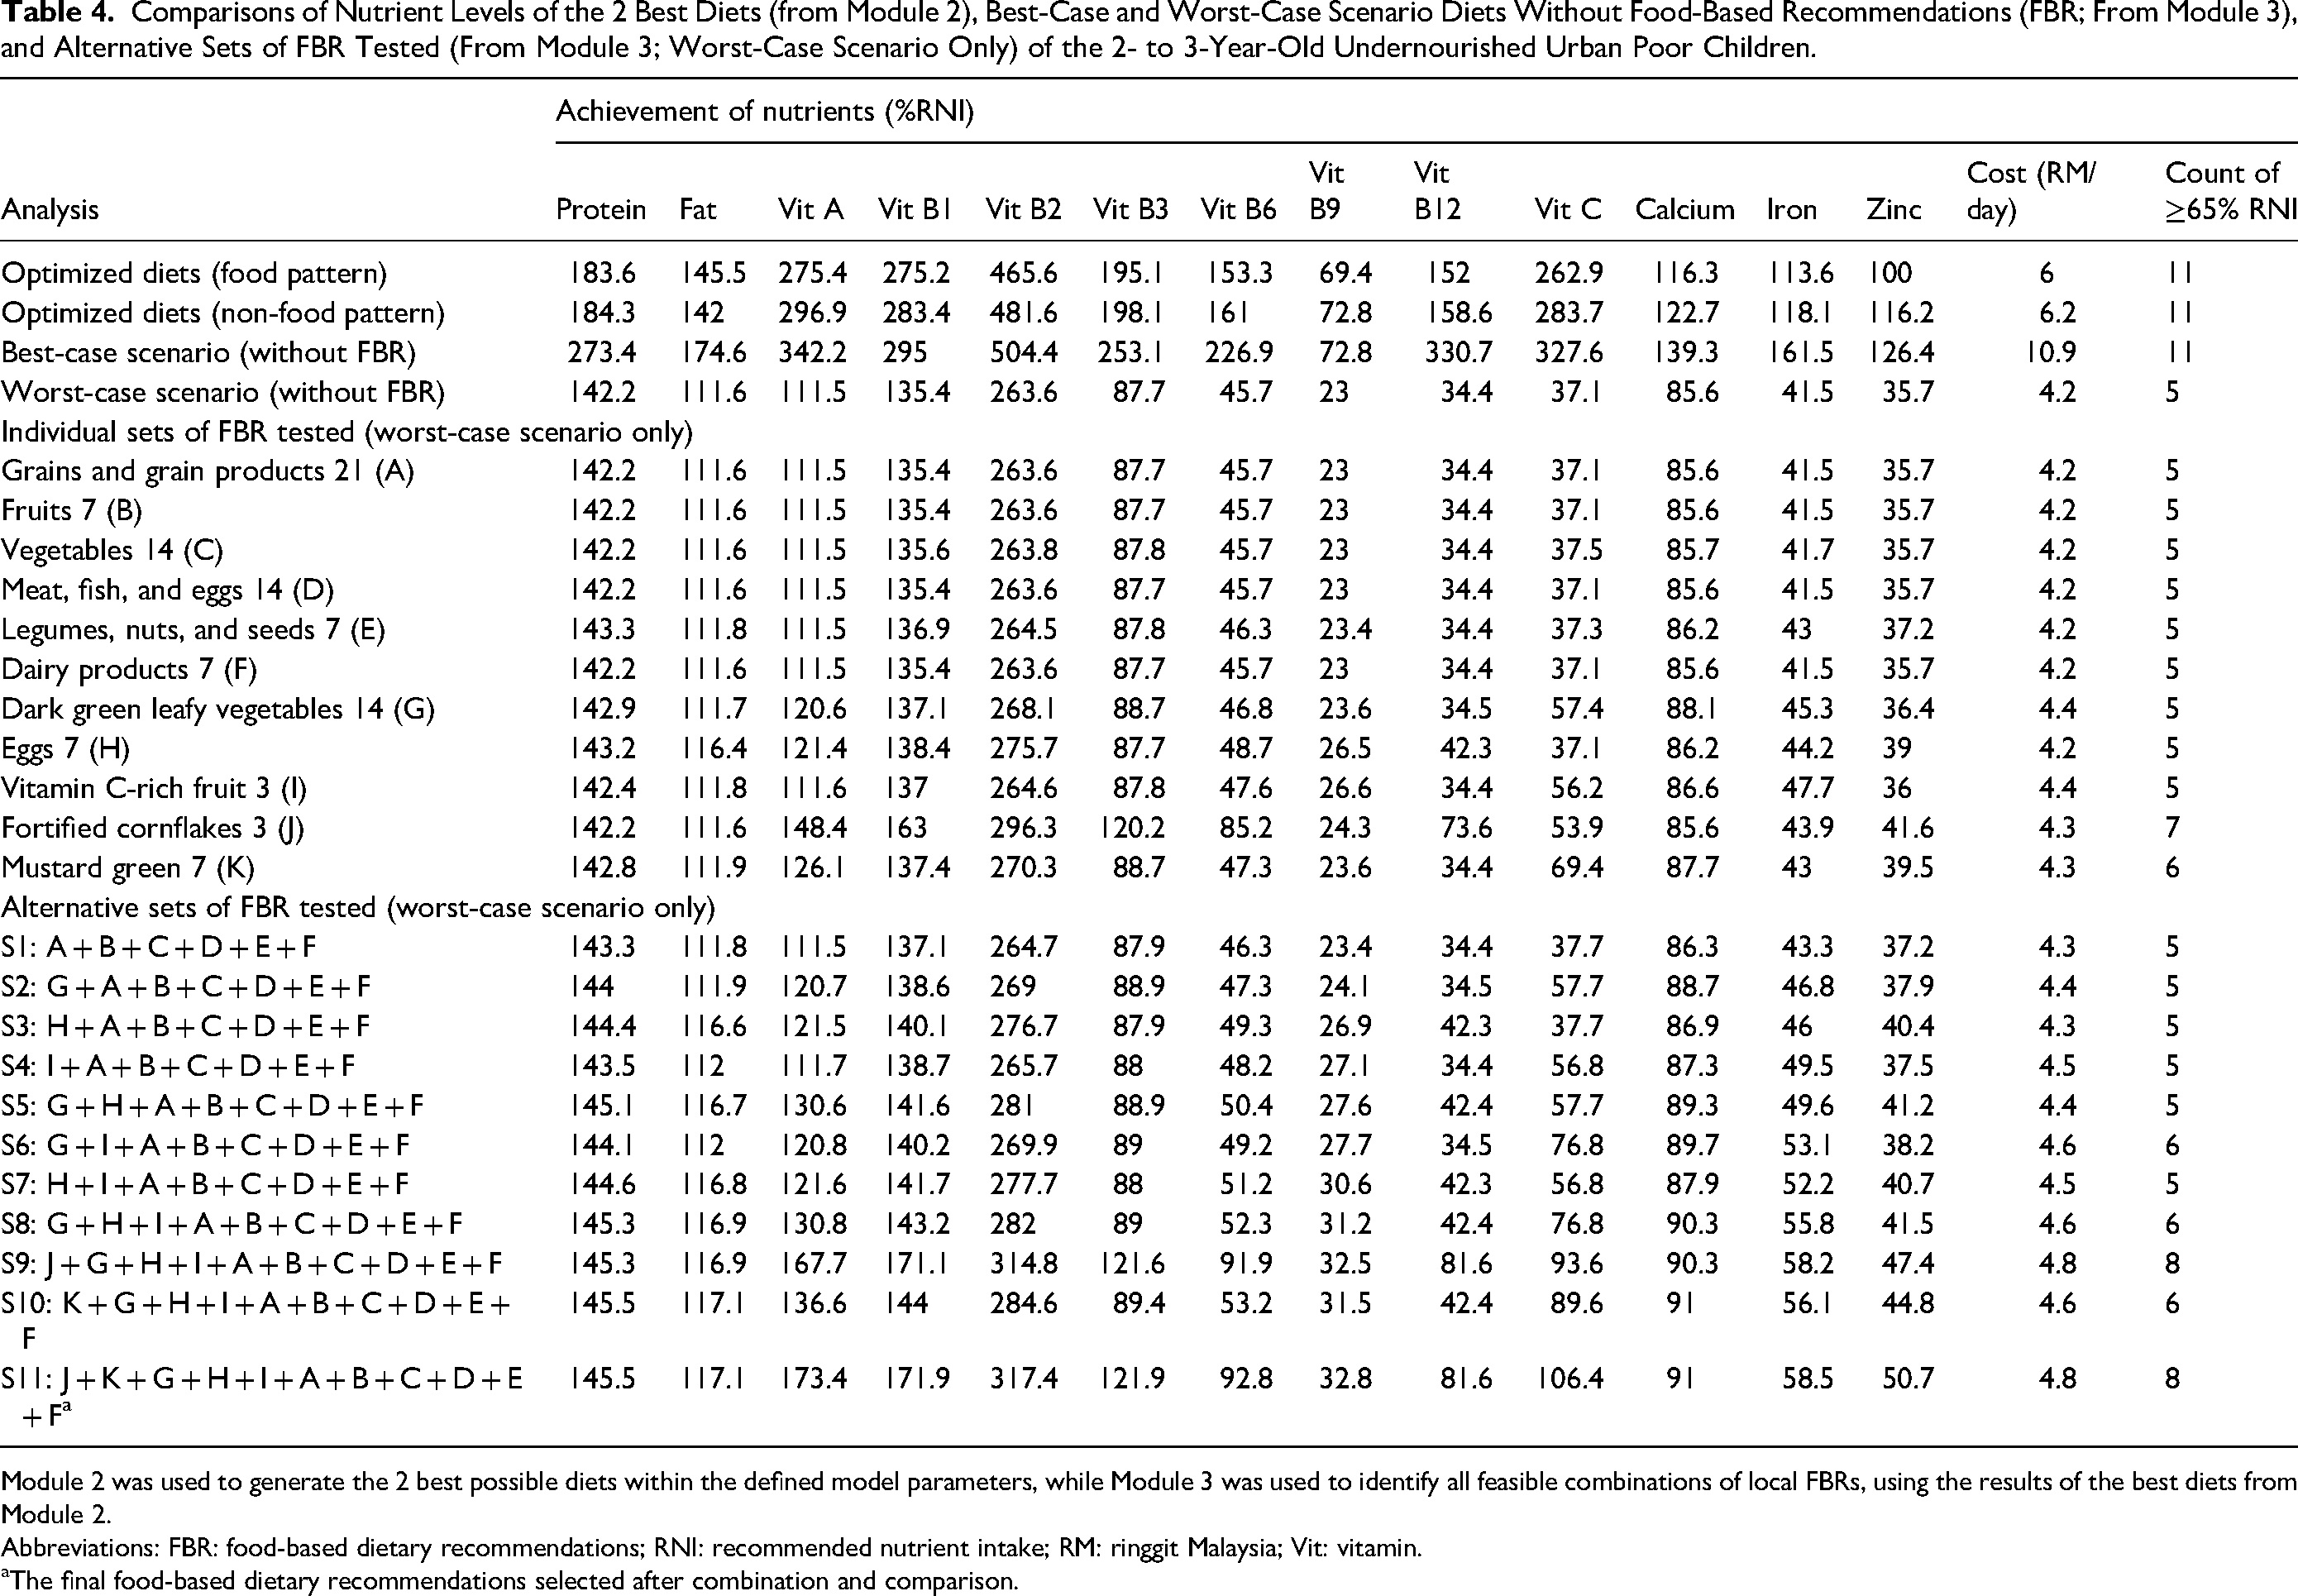
Module 2 was used to generate the 2 best possible diets within the defined model parameters, while Module 3 was used to identify all feasible combinations of local FBRs, using the results of the best diets from Module 2.
Abbreviations: FBR: food-based dietary recommendations; RNI: recommended nutrient intake; RM: ringgit Malaysia; Vit: vitamin.
The final food-based dietary recommendations selected after combination and comparison.
The final FBR set included 3 servings/day of cereals and cereal products (corn flakes: 3 servings/week); 1 serving/day of fruits (vitamin C-rich fruits: 3 servings/week); 2 servings/day of dark green leafy vegetables (mustard greens: 1 serving/day); 2 servings/day of MFE (eggs: 1 serving/day); 1 serving/day of legumes, nuts, and seeds (LNS); and 1 serving/day of dairy products. Nutrient adequacy improved to >100% for niacin (121.9%). Nevertheless, vitamin B6 (92.8%), vitamin B12 (81.6%), and calcium (91%) remained <100% of the RNI but >65% of the RNI in the final FBR. Folate (32.8%), iron (58.5%), and zinc (50.7%) still did not reach 65% of the RNI in the final FBR. Table 5 summarizes the recommended frequency and serving sizes of the final FBR for both age groups.
Recommended Frequency and Serving Sizes of the Final Food-Based Dietary Recommendations Formulated for Undernourished Urban Poor Children.
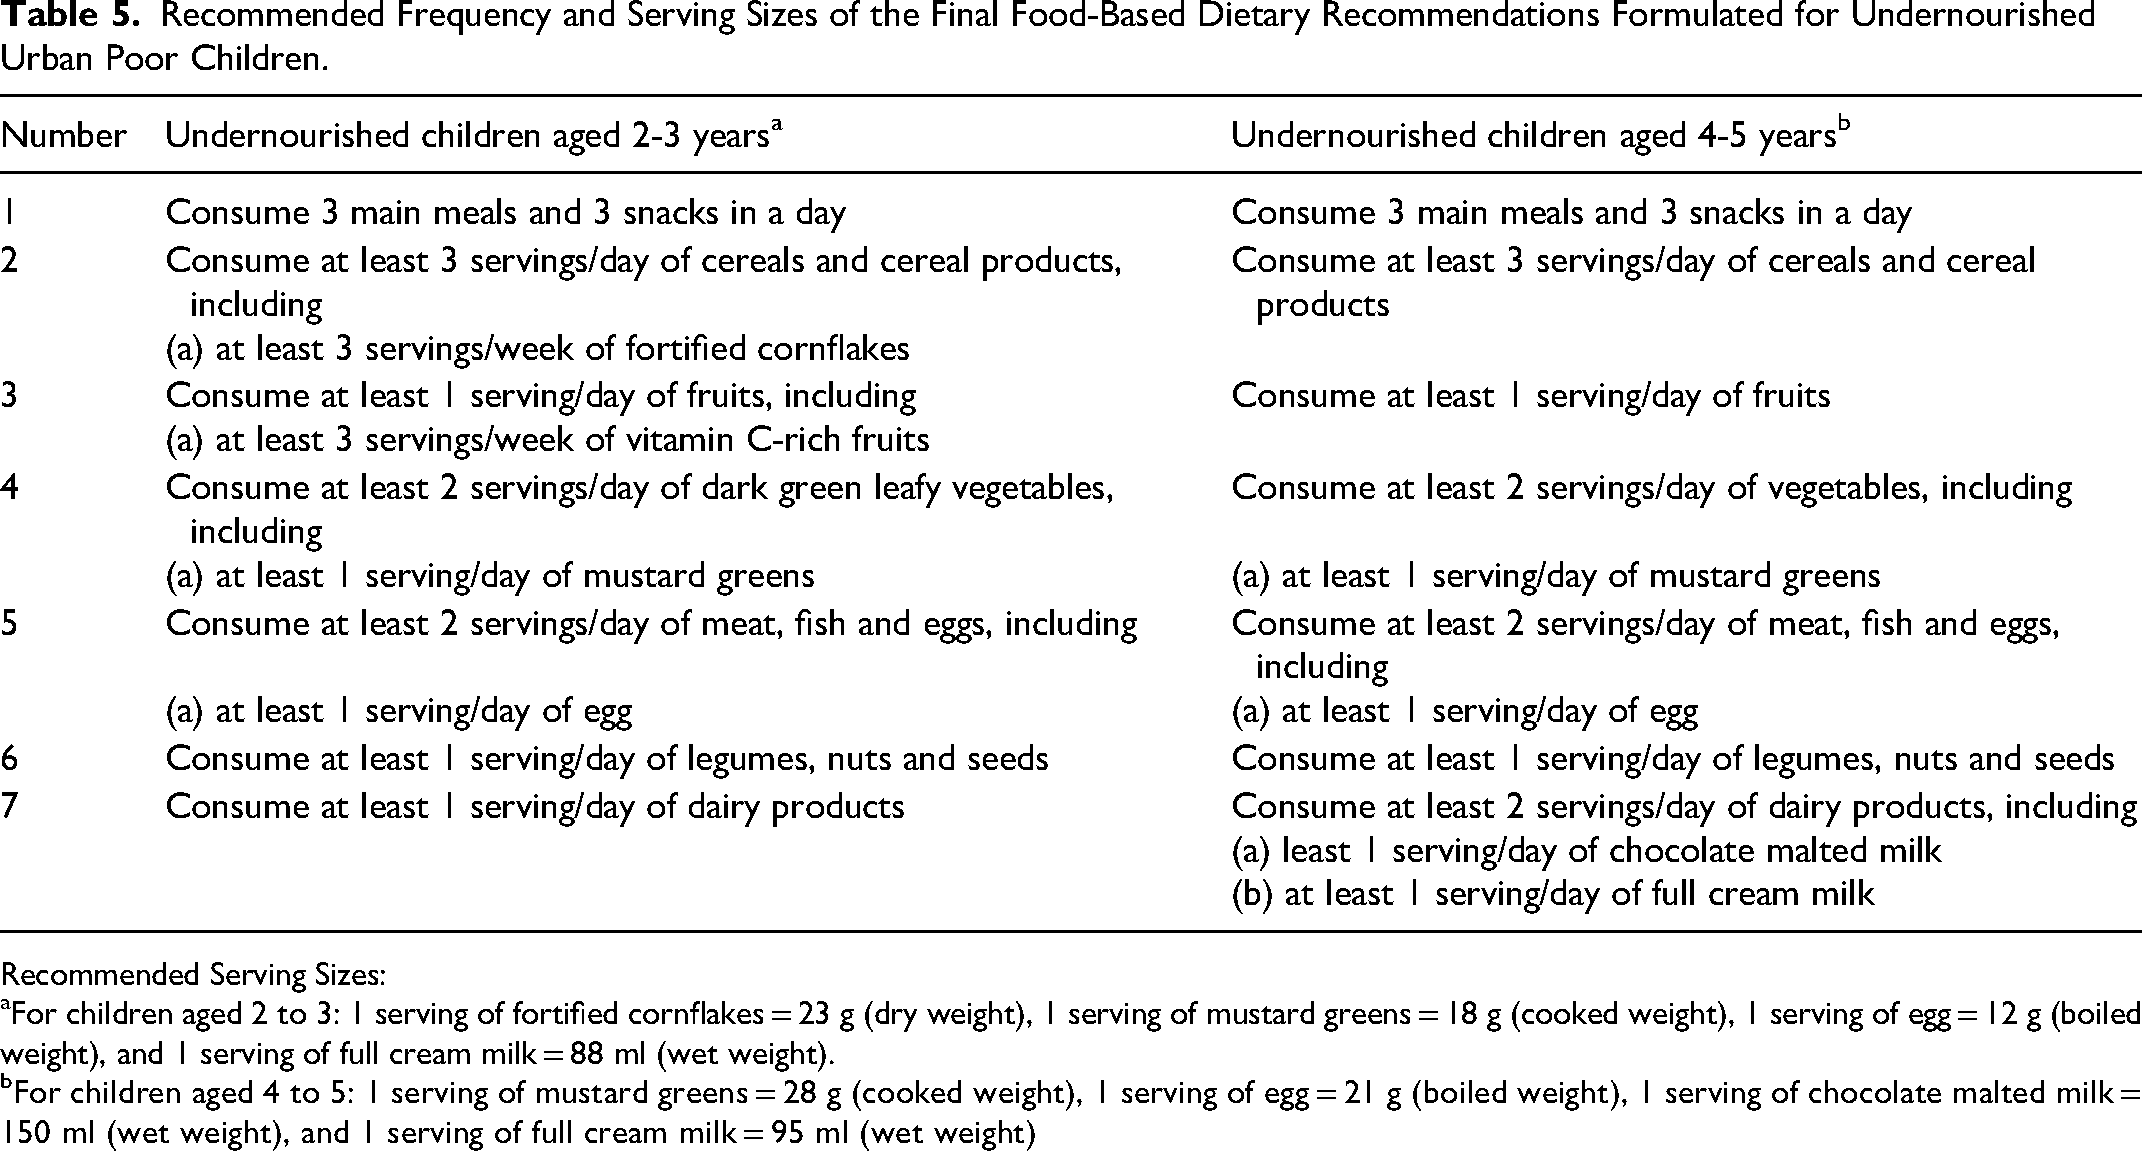
Recommended Serving Sizes:
For children aged 2 to 3: 1 serving of fortified cornflakes = 23 g (dry weight), 1 serving of mustard greens = 18 g (cooked weight), 1 serving of egg = 12 g (boiled weight), and 1 serving of full cream milk = 88 ml (wet weight).
For children aged 4 to 5: 1 serving of mustard greens = 28 g (cooked weight), 1 serving of egg = 21 g (boiled weight), 1 serving of chocolate malted milk = 150 ml (wet weight), and 1 serving of full cream milk = 95 ml (wet weight)
Eleven alternative FBR sets were formulated for the 4-5 year olds and compared based on their nutrient levels in the worst-case scenario and diet cost in module 3 (Table 6). No alternative FBR achieved 65% of the RNI for all nutrients, except protein, fat, vitamin A, thiamine, riboflavin, niacin, vitamin B6, and vitamin C. The FBRs S7, S8, and S11 were the most promising alternative FBRs, where they achieved >90% of the RNI for vitamin B12 and calcium. Nonetheless, folate still did not achieve 65% of the RNI. FBR S7 was selected as the final FBR as it had the highest nutrient levels in the worst-case scenario for all nutrients (n = 9) and cost RM6.20/day (approximately US $1.34/day).
Comparisons of Nutrient Levels of the 2 Best Diets (From Module 2), Best-Case and Worst-Case Scenario Diets Without FBR (from Module 3), and Alternative Sets of FBR Tested (From Module 3; Worst-Case Scenario Only) of the 4- to 5-Year-Old Undernourished Urban Poor Children.
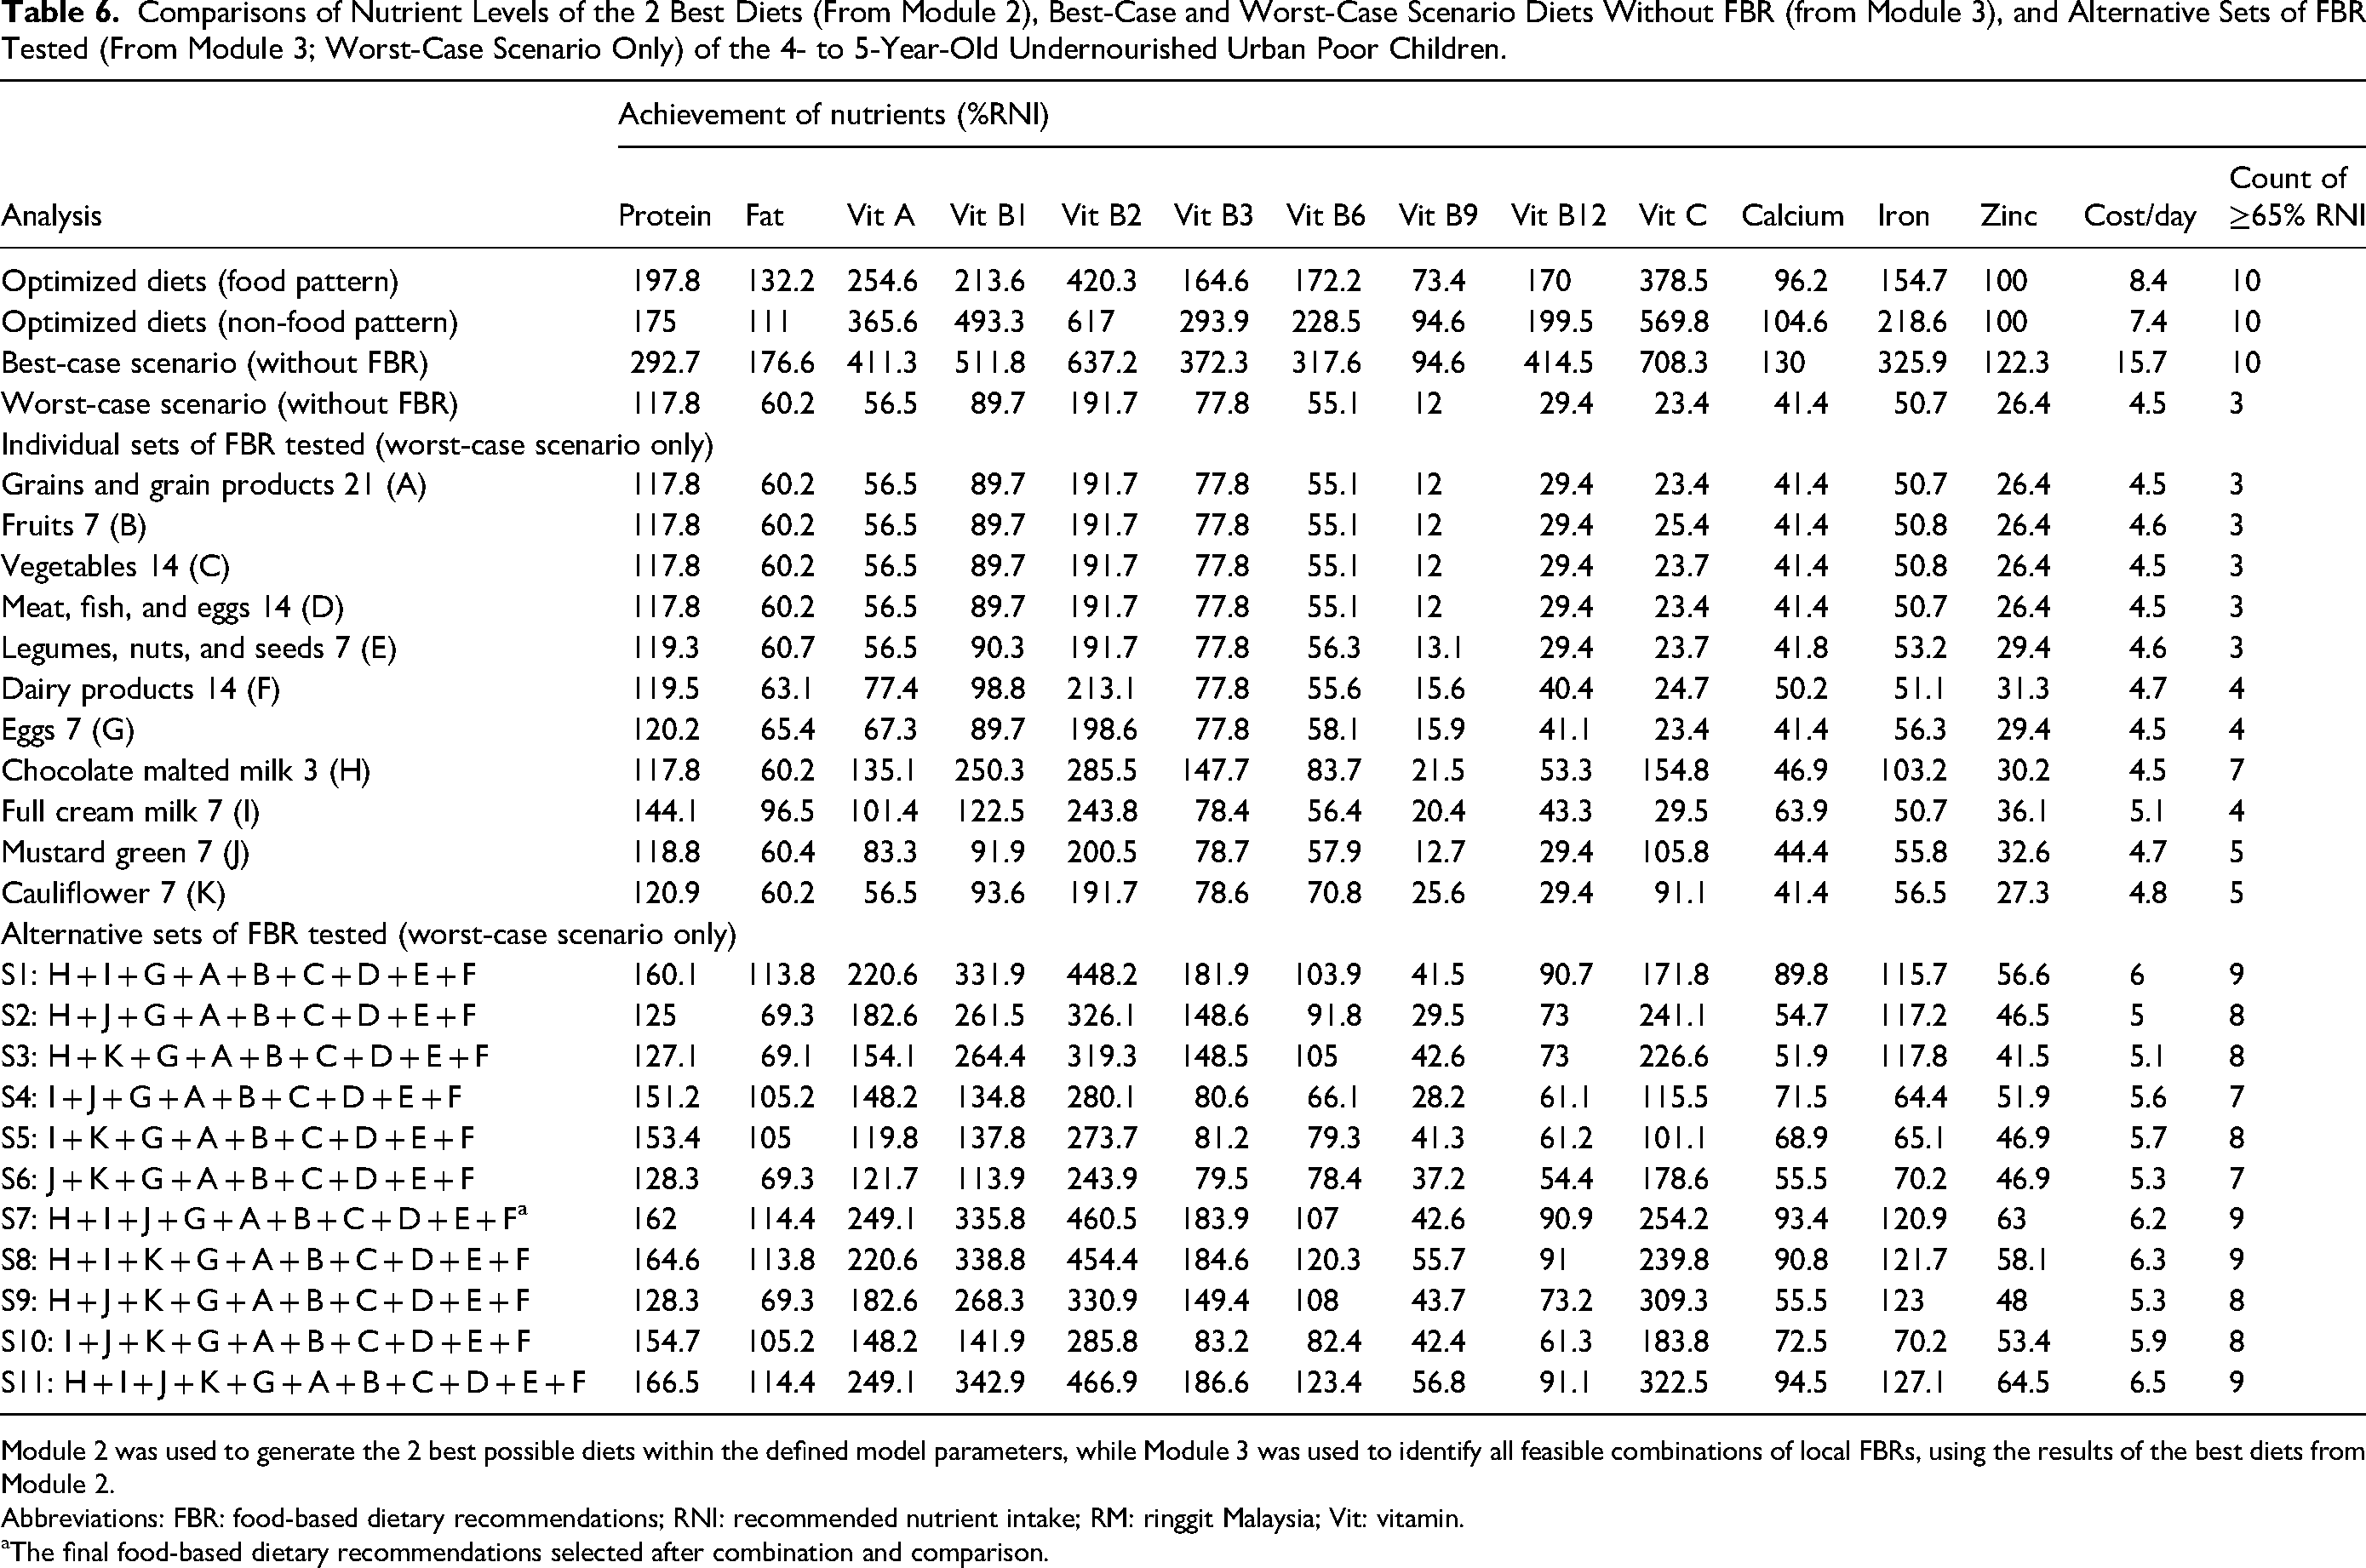
Module 2 was used to generate the 2 best possible diets within the defined model parameters, while Module 3 was used to identify all feasible combinations of local FBRs, using the results of the best diets from Module 2.
Abbreviations: FBR: food-based dietary recommendations; RNI: recommended nutrient intake; RM: ringgit Malaysia; Vit: vitamin.
The final food-based dietary recommendations selected after combination and comparison.
The final FBR set included 3 servings/day of cereals and cereal products, 1 serving/day of fruits, 2 servings/day of vegetables (mustard greens: 1 serving/day), 2 servings/day of MFE (eggs: 1 serving/day), 1 serving/day of LNS, and 2 servings/day of dairy products (chocolate malted milk: 3 servings/week and full-cream milk: 1 serving/day). Nutrient adequacy improved to >100% for niacin (183.9%). Nevertheless, vitamin B12 (90.9%) and calcium (93.4%) remained <100% of the RNI but >65% of the RNI in the final FBR. Folate (42.6%) and zinc (63.0%) still did not reach 65% of the RNI in the final FBR.
Discussion
Poor dietary intake has been identified as a major contributor to undernutrition.33,34 Providing young children with a nutritionally balanced diet is crucial to prevent undernutrition and avert long-term adverse health outcomes in adulthood. 35 This study is the first to examine food patterns to identify problem nutrients and develop FBRs using LP analysis for undernourished 2–5-year-old children in Malaysia. Addressing the nutrient gaps is essential to mitigate the irreversible consequences of undernutrition and the risk of growth faltering in these children. The dietary data demonstrated that the children's current dietary intake is insufficient to meet their nutrient requirements, specifically for energy, carbohydrate, fat, niacin, folate, vitamin B12, calcium, and zinc. These findings showed that changes in current dietary practices can improve the children's dietary adequacy for 8 to 9 of the 11 micronutrients assessed.
Even with the promotion of nutrient-dense foods, the folate, iron, and zinc levels in the minimized diet remained <65% of their respective RNIs according to age group. The final selected FBR improved folate, iron, and zinc intakes in the 2-3 year olds to 32.8%, 58.5%, and 50.7%, respectively. In the 4-5 year olds, the final selected FBR improved folate and zinc intakes to 42.6% and 63.0%, respectively. These changes indicated the need for further improvement of the undernourished children's food options. Although iron and zinc were not problem nutrients, they did not achieve 65% of the RNI for all alternative FBRs. This might be due to the high maximum frequency/week and low minimum frequency/week of the foods providing those nutrients. Similarly, a Zambian study suggested that dietary adequacy gaps would persist for several nutrients, which included folate, iron, and zinc. 36 This gap would persist even within the model constraints of the current food patterns with respect to the food types, frequency, and portion sizes. This finding highlighted the need for continued efforts to diversify and improve the food choices available to undernourished children.
This study identified fewer problem nutrients than studies in Zambia 36 and Kenya. 37 Notably, while LP analysis determined that calcium, iron, and zinc were common problem nutrients,36,38,39 they were not problem nutrients in the present study. This result might have been due to the children's sufficient intake of dairy products, such as full-cream milk and chocolate malted milk. Instead, this study determined that folate was a problem nutrient, which was reported less frequently. This finding might have been due to the children's low intake of folate-rich foods, such as red meat and lentils. In many Malaysian diets, 40 staple foods typically include rice, noodles, and a variety of vegetables. However, foods that are naturally high in folate, such as legumes (eg, lentils and beans) and red meat, may not be consumed as frequently as in countries where these are staples. While leafy greens are part of the Malaysian diet, they are often cooked at high temperatures in traditional dishes, which could reduce their folate content, as folate is sensitive to heat. 41 In addition, the availability and cost of folate-rich foods can affect access, particularly for low-income households, who may rely on more affordable but less nutritious foods. 42 These dietary habits, along with the lack of comprehensive folate fortification programs, may explain why folate emerged as a problem nutrient for Malaysian children in this study.
This study determined that MFE and cereals were consumed in larger quantities than dairy products. These findings were consistent with a Tanzanian study, which reported that grains were the most commonly consumed food by children. 43 Fortified cereals can serve as valuable nutrient-dense food sources, providing essential vitamins and minerals crucial for growth and development.44,45 These cereals are often fortified with micronutrients such as iron, zinc, vitamin A, vitamin D, and B vitamins and offer convenience and versatility, making them accessible options for busy families and settings such as schools and daycare centers. 45 Notably, while water spinach (Ipomoea aquatica) and mustard greens (Bracissa juncea) are readily available at the study site, other studies did not identify them as potential nutrient-dense foods. Despite their accessibility, water spinach and mustard greens were consumed in limited amounts. Interestingly, the median portion size of eggs consumed by the 4-5 year olds (21 g/day) in the current study was similar to the global mean intake reported in a recent review using the Global Dietary Database data. 46
Full-cream cow's milk is a nutrient-dense food that improves young children's dietary adequacy.47,48 Chocolate malted milk, identified in this study as a nutrient-dense food, provides a blend of essential nutrients in an appealing and convenient package. 49 Previous local research has shown that it is more likely to be consumed and preferred by Malaysian children, 49 making it a more manageable addition to children's diets. In a study conducted in primary schools in Canada, researchers reported a drop of 12.3% in total milk consumption among children and adolescents when chocolate milk was removed from schools. 50 Evidence suggests that children who drink flavored milk are more likely to consume more dairy products and have healthier eating habits. 51 The small amount of added sugars in flavored milk, when consumed as part of a balanced diet, does not significantly increase the risk of obesity. 51 Therefore, flavored milk can be offered and be considered as a component of overall dairy intake of children to meet dietary recommendations. 51
The optimized diet in this study featured larger servings of cereal (3 servings/day), MFE (2 servings/day), and LNS (1 serving/day) for both age groups than the values recommended by the Malaysian Dietary Guidelines 2023. 52 Nevertheless, the milk consumption by the 2-3-year olds (1 serving/day) and fruit consumption by the 4-5 year olds (1 serving/day) were lower than the recommended values. This finding was mainly due to the children's lower consumption of these foods. Previous studies showed that low consumption of fruit 53 and milk 54 was associated with undernutrition, especially among children from vulnerable households. Nevertheless, to represent the natural dietary intake pattern among undernourished children, age-specific frequencies and food serving sizes were maintained based on the children's food consumption. The final FBR was selected after considering food patterns and emphasizing locally available nutrient-dense foods. This approach facilitated the adoption and promotion of a single set of recommendations.
The strength of this study includes LP analysis. LP analysis is an effective method for identifying problem nutrients and developing population-specific FBRs to improve the overall nutrient adequacy of the specific target population. Furthermore, the mathematical optimization enabled the identification of the best diets nutritionally and the development of multiple alternative FBR sets. Additionally, LP analysis enabled the identification of specific food groups, food subgroups, and food items that can bridge the problem nutrient gap. Bridging this gap would improve the dietary patterns of the vulnerable groups, with focus on undernourished children. Furthermore, the use of a 3-day 24-hour dietary recalls method, which is more rigorous than the 1-day recall commonly used in other studies, is another strength of this study. The inclusion of cost data further strengthens this study and enhances its practical application for dietary recommendations.
This study was subject to limitations. First, the weekly dietary data were estimated based on 3-day dietary recalls. Estimating the frequencies of food and food (sub)groups increased the modeled frequencies in the draft FBRs. Consequently, these estimated frequencies increased the minimum and maximum frequencies for the foods and food (sub)groups used as input data in LP model. The use of estimated frequencies might have led to overestimation of the maximum food and food (sub)group frequencies as food consumption on the data collection day might not accurately represent daily consumption in the week prior to data collection. Thus, the modeled frequencies might be unrealistically high for acceptance by the target population. Second, dietary recall might be subject to recall bias. Infrequently consumed nutrient-dense foods are often forgotten. Given that the FBR development using LP relied exclusively on foods reported in dietary recalls, it limited the inclusion of healthy options, such as vegetables and fruits. Moreover, this study recruited undernourished urban poor children aged 2-5 years in Seremban district, where the findings of this study cannot be generalized to all urban poor children in Malaysia.
Through this study, LP is expected to translate nutritional requirements to achieve healthy and well-balanced dietary recommendations using only local foods to prevent undernutrition at minimal cost. By identifying locally available, affordable and culturally acceptable foods, this study provides dietary recommendations that could help shape the food choices of undernourished urban poor children, potentially reducing or preventing undernutrition. This is particularly important given the difficulties faced by undernourished children in low-income households in accessing affordable nutritious food.
Conclusion
This study demonstrated that the nutrient adequacy of the optimized diets was restricted for both age groups. Nonetheless, the finding also demonstrated the potential for improvement through strategic selection of food combinations. The optimal food combination, which included locally available foods, successfully met the requirements for 8 to 9 of the 11 micronutrients for the 2-3 year olds and the 4-5 year olds, respectively, at a lower cost. The findings highlighted the feasibility of developing FBRs to improve the nutrient intake of undernourished urban poor children within the constraints of available food choices. Nevertheless, the results also highlighted the persistent challenges in addressing all micronutrient gaps, specifically for folate, iron, and zinc, among undernourished urban poor children. Thus, the findings suggested the need for intervention strategies to comprehensively address these deficiencies.
Supplemental Material
sj-docx-1-fnb-10.1177_03795721241302864 - Supplemental material for Linear Programming Optimization of Local Food-Based Recommendations for Undernourished Urban Poor Malaysian Children Aged 2 to 5 Years
Supplemental material, sj-docx-1-fnb-10.1177_03795721241302864 for Linear Programming Optimization of Local Food-Based Recommendations for Undernourished Urban Poor Malaysian Children Aged 2 to 5 Years by Yee Xuen Miow, Wan Ying Gan, Umi Fahmida, Poh Ying Lim and Geeta Appannah in Food and Nutrition Bulletin
Supplemental Material
sj-docx-2-fnb-10.1177_03795721241302864 - Supplemental material for Linear Programming Optimization of Local Food-Based Recommendations for Undernourished Urban Poor Malaysian Children Aged 2 to 5 Years
Supplemental material, sj-docx-2-fnb-10.1177_03795721241302864 for Linear Programming Optimization of Local Food-Based Recommendations for Undernourished Urban Poor Malaysian Children Aged 2 to 5 Years by Yee Xuen Miow, Wan Ying Gan, Umi Fahmida, Poh Ying Lim and Geeta Appannah in Food and Nutrition Bulletin
Footnotes
Author Contributions
YXM and WYG designed research. YXM conducted research and collected data. YXM, WYG, and UF analyzed data. YXM wrote the first draft with contributions from WYG and UF. All authors reviewed and commented on the subsequent draft of the article.
Declaration of Conflicting Interests
The authors declared no potential conflicts of interest with respect to the research, authorship, and/or publication of this article.
Funding
The authors received no financial support for the research, authorship, and/or publication of this article.
Supplemental Material
Supplemental material for this article is available online.
Correction (February 2025):
Article updated online to update the affiliation number 2 from “Nutrition Science Clinic, Southeast Asian Ministers of Education Regional Centre for Food and Nutrition (SEAMEO-RECFON), Jakarta, Indonesia” to “Southeast Asian Ministers of Education Regional Centre for Food and Nutrition (SEAMEO-RECFON), Jakarta, Indonesia”.
References
Supplementary Material
Please find the following supplemental material available below.
For Open Access articles published under a Creative Commons License, all supplemental material carries the same license as the article it is associated with.
For non-Open Access articles published, all supplemental material carries a non-exclusive license, and permission requests for re-use of supplemental material or any part of supplemental material shall be sent directly to the copyright owner as specified in the copyright notice associated with the article.