
Abstract
Background:
Lack of dietary diversity in complementary feeding contributes to nutrient gaps leading to undernutrition. Food-based strategies have been successfully used to enrich the complementary diets of infants and young children. However, context-specific recommendations based on an objective diet optimization are needed to formulate sound and practical nutritional guidelines.
Objectives:
The present study aimed to identify problem nutrients in complementary diets and formulate complementary feeding recommendations (CFRs) using linear programming analysis for children aged 6 to 23 months in the rural Philippines.
Methods:
A cross-sectional survey was conducted in the municipality of Mercedes, Philippines. Dietary intakes of breastfed children 6 to 8, 9 to 11, and 12 to 23 months of age (n = 297) were assessed using a multipass 24-hour recall method with 7-day food consumption frequency. A linear programming tool was used to identify the recommended nutrient intakes that could not be met within the existing local food patterns and develop CFRs that would best fulfill nutrient adequacy for 11 modeled micronutrients.
Results:
Problem nutrients in the current diets were iron and calcium in any age-group, zinc for 6 to 8 and 9 to 11 months old, and thiamine and folate for 12 to 23 months old children. Adoption of CFRs with 4 to 5 food groups in the diet would ensure the adequacy of 7 to 8 nutrients, depending on the age-group.
Conclusion:
Within the boundaries of local dietary patterns, adequacy for most nutrients could be achieved by promoting realistic servings of nutrient-dense foods and food groups. The linear programming results provide an evidence-based strategy in designing interventions to improve the quality of Filipino complementary diets.
Keywords
Introduction
Young children are particularly vulnerable to inadequate nutrition between 6 and 23 months and require complementary feeding with a higher quality of diet to support their rapid growth and development. However, in many low- and middle-income countries including the Philippines, reliance on monotonous diets from cereals and starchy staples often lead to deficits in micronutrient intakes. 1 -3 This issue led a World Health Organization (WHO) Steering Committee to develop and standardize the minimum dietary diversity as an indicator to measure diet quality during the first 2 years of life. 4 The cutoff score for a minimally diverse diet is defined as receiving foods from at least 4 of the 7 unique food groups, based on the assumption that a child is “more likely to consume at least one animal-source food and one fruit or vegetable along with the staple that day.” 4 Previous studies have shown that diversity of complementary diets was found to be a predictor of nutrient intakes, 5 mean micronutrient density adequacy, 6 and nutrition status 7 in Filipino children. Recent studies in rural settings in the Philippines also found that micronutrient adequacy of complementary diet was strongly associated with micronutrient status. 8
Food-based interventions involving diet diversification have been recommended as a long-term sustainable approach for controlling multiple micronutrient deficiencies. 9 The WHO also recommends the promotion of home-made, locally available ingredients, and fortified foods where possible, to meet the nutritional needs of older infants and young children. 10 Different household food processing methods and enrichment with animal source foods, legumes, and vitamin-C-rich fruits or vegetables have been identified to improve the nutrient content and bioavailability of the Filipino complementary diets. 11,12 The above strategies were designed to fill in the gaps for what was identified by WHO as limiting nutrients, namely iron, zinc, and calcium, in terms of meeting their estimated desirable nutrient densities from complementary foods. 13 This traditional approach, however, did not take into account multiple nutritional constraints within existing dietary patterns. The question then arises whether a food-based approach from local food supplies can ensure nutrient adequacy of complementary diets for Filipino children. While international guidelines on exclusive and continuous breastfeeding and adequate complementary feeding 13 are being adapted in the Philippines, this is the first study to develop localized and age-specific complementary feeding recommendations (CFRs) for Filipino infants and young children based on an objective diet optimization.
A technology based on linear programming analysis was developed and tested to determine the extent to which locally available foods and dietary patterns can achieve nutritional requirements at the lowest cost, and identify the most limiting nutrients in the complementary diets. 14,15 This approach using linear programming has been recently used in Southeast Asian countries 16 -20 to develop food-based recommendations for children; however, this has not been tested in the Philippines. As linear programming was designed to select the most nutritionally adequate diets at the lowest possible cost, the best combination of diets may lack diet diversity, especially when modeled diets with fortified products are optimized. 21 This study, therefore, extended the methods by using food group diversification as an added criterion to the selection process of the final CFRs so that a minimally diverse diet would be ensured in the final recommendation.
The aim of this study was to determine the problem nutrients and develop CFRs based on locally available diets that best achieve the nutrient adequacy and diversity of 6 to 23 months old Filipino breastfed children. This study presents the analyses and recommendations generated for 3 age subgroups (6-8, 9-11, and 12-23 months old), given their different energy and nutritional requirements.
Methods
Study Design
Using a cross-sectional study design, a dietary survey using a 24-hour recall was conducted from April to June 2018. At the end of the dietary assessment, a market survey was conducted to obtain the cost of food per 100 g edible portion based on foods consumed by the children.
Study Area and Subjects
This study was conducted in Mercedes, Camarines Norte Province of Bicol Region in the southern part of Luzon in the Philippines. The municipality of Mercedes was chosen as it recorded the highest prevalence of stunting and underweight of children under 5 among the municipalities/cities in Camarines Norte Province in previous years. 22 The most recent national nutrition survey also showed that Camarines Norte Province had a higher prevalence of stunting (31%), underweight (24%), and wasting (8%) among children under 5, relative to the national rates at 30%, 19.1%, and 6%, respectively. 23
Subjects and Sampling
The study population were children from 22 villages in Mercedes Municipality. To be eligible, the child needed to be 6 to 23 months of age, healthy, not suffering from any chronic disease and receiving both breastmilk and complementary food at the time of data collection. A random sample was chosen from a list of municipal census data of all eligible children. The minimum sample size required was 282 based on the estimated regional prevalence of children meeting minimum dietary diversity (14%) with 6% precision, 95% confidence interval, and 15% nonresponse rate. There were 297 children in the study, with 58 (for 6-8 months), 100 (for 9-11 months), and 139 (for 12-23 months) in the 3 age groups.
Survey Measures
Using an interviewer-administered caregiver survey tool, information on sociodemographic characteristics, breastfeeding, and complementary feeding practices was collected by trained survey staff through face-to-face interviews with the mothers. The age of the child in months was obtained using the day preceding the data collection as the reference date. For anthropometry, the recumbent length and weight of the children were measured in duplicate and subsequently calculated as the mean. Using a Salter spring digital scale (Model 235-6 S, precision ± 1 g), the weight of children was measured with the child minimally clothed. Recumbent length of children was measured using a wooden length board (UNICEF supply, precision ± 0.1 cm). For dietary assessment, a single 24-hour recall using a standard multipass procedure adapted from ProPAN manual 24 was used to assess the usual intakes and dietary patterns of children. All foods and beverages consumed by the child between the first and last meal of the day before data collection and the frequency of consumption during the past week for each food were recorded. Composite foods were disaggregated into single ingredients before estimating the amount consumed for each ingredient. Standardized conversion guides were developed by obtaining the average weights of reported foods using common household measures (eg, cups and spoons). Conversion factors (ie, cooked-to-raw, volume-to-grams) were applied to calculations, if necessary, as described in ProPAN. 24 A market survey was conducted in 2 main wet markets in the area to obtain the lowest cost, nutritionally best food-based recommendations. The cost per 100 g edible portion was directly calculated for bread, snacks, tinned foods, and other ready-to-eat foods, while fruits were peeled and pitted to obtain the actual price per 100 g edible portion. For cooked foods, each raw ingredient was weighed and cooked based on the commonly reported cooking method (eg, boiled). The weight of the final cooked food (deboned for meat and fish products) was recorded, and the cost per 100 g of the edible portion was calculated.
Data Analysis
Anthropometric data were analyzed using ENA for SMART software (version 2015) to generate the children’s Z-scores for length-for-age (LAZ), weight-for-length (WLZ), and weight-for-age (WAZ). 25 The children were classified as stunted, wasted, or underweight if their LAZ, WLZ, and WAZ were less than −2 standard deviations (SD) according to the WHO multicenter growth reference standards. 26 The percentage of children who satisfied the WHO’s recommended infant and young child feeding practice measures 4 were calculated, which included minimum meal frequency, minimum dietary diversity, and minimum acceptable diet. All means and SDs, and median and percentages for anthropometric and sociodemographic data were analyzed by SPSS Statistics (version 23.0).
Linear Programming Analysis
Preparation of model parameters
The dietary survey data was used to develop the linear programming model parameters. The linear programming software Optifood (version 4.0.14) was used to generate the CFRs for each age subgroup (6-8, 9-11, and 12-23 months old). Microsoft Excel 2016 was used to prepare data for entry into Optifood to generate (1) a list of noncondiment foods consumed by ≥5% of the sample population, (2) the number and percentage of consumers of each food, (3) the average amount (g) consumed defined by the median portion, (4) the range in weekly food pattern consumption frequencies (low, average, and high) defined as the 5th, 50th, and 95th percentile of the frequency distribution for each food item, food group and subgroup, and (5) the cost (Philippine pesos [PHP]) per 100 g edible portion of food. Where the food was consumed by < 5% of the children but is assumed to be a nutrient-dense food that could be included to increase the food group diversity of diet, the food was also included. Breast milk was added to the food lists using volume and energy estimation by Dewey and Brown. 27 Average breast milk intakes of 590 g/d (413 kcal/d) for 6 to 8 months, 541 g/day (379 kcal/day) for 9 to11 months, and 494 (346 kcal/day) for 12 to 23 months old children in developing countries were assumed.
Food composition database and dietary reference values
The Philippine Food Composition Table 28 was the primary reference for translating the median portion of food into nutrient intakes. The values for zinc and some missing nutrient composition was imputed from the ASEAN Food Composition Database. 29 The average energy and protein requirements of the children were calculated from the WHO/FAO/UNU energy requirement algorithm using the mean body weights of 7.36 kg for 6 to 11 months, 7.90 for 9 to 11 months, and 8.92 for 12 to 23 months, respectively. The nutrient adequacy for 13 nutrients namely protein, fat, vitamin A (RA), vitamin C, thiamine, riboflavin, niacin, vitamin B6, folate, vitamin B12, calcium, iron, and zinc was assessed using the Philippine Dietary Reference Intakes and Recommended Nutrient Intakes (RNI). 30
Development of CFRs
The linear programming analysis was carried out using WHO Optifood linear programming software (version 4.0.14). Food-based CFRs were developed and evaluated in 3 modules. Module 1 indicated that model parameters ensure realistic diets with energy ranges of 79% to 185% for 6 to 9 months, 68% to 153% for 9 to 11 months, and 54% to 182% for 12 to 23 months. Module 2 generated 2 sets of optimized diets, where one adhered to the average food patterns of the children (Optimized-Food Pattern), and the other deviated from their average food patterns but remained within their lower (5th percentile) and upper tails (95th percentile) of food group patterns (Optimized-No Food Pattern). Module 3 involved testing and comparing draft CFRs and was run in 3 phases (Phase 1, 2, and 3). Module 3-Phase 1 generated the worst-case scenario and best-case scenario of nutrient levels in a diet by running an analysis without adding any recommendation. In this step, the problem nutrients (defined as nutrients that remained <100% of RNI even when the levels of each nutrient is maximized) were identified. The worst-case scenario of nutrient levels served as a benchmark to define whether a nutrient is at risk of inadequacy and whether individual recommendations can be added to improve nutrient levels compared to the usual diet patterns. In this study, the nutritional criterion to define a low risk of dietary inadequacy was when the worst-case scenario nutrient levels were ≥65% of RNI, following the previous studies in Southeast Asia. 17,31,32 Module 3-Phase 1 analysis showed that protein and fat exceeded 100% of their RNIs (except fat for 12-23 months old where it exceeded 80% of RNI), which means that for this population, only a small percentage would be at risk of inadequacy. Thus when evaluating the CFRs, only the micronutrients were compared for worst-case scenario levels using the criterion. Module 3-Phase 2 generated the single sets of CFRs to be evaluated further in Phase 3.
Single recommendations at the food group level were developed and evaluated, including meat, fish, poultry and eggs, dairy, starchy tubers. However, a recommendation for dairy was not included in the final CFRs to avoid any inadvertent promotion or cross-promotion of breastmilk substitutes marketed for children. In Module 3-Phase 3, the best possible permutations of combined sets of CFRs were evaluated. The combined CFRs with the highest count of worst-case scenario nutrient levels achieving ≥65% of RNI, followed by the highest count of food groups identified (associated with providing these nutrients) were selected.
Dietary diversity scores
To measure the diversity of the diet (derived from a tally of the food groups consumed on the previous day), foods listed in Optifood were grouped based on the WHO 7 food group classification. 4 Food groups considered were grains, roots and tubers, legumes and nuts, dairy, flesh foods, eggs, vitamin A-rich fruits and vegetables, and other fruits and vegetable. A food group score of “1” was awarded for the consumption of egg as it is a unique food group by itself in the WHO classification. The underlying concept for separating the categories for “vitamin-A rich” and “other” fruits and vegetables is to capture the micronutrient density in a complementary diet. 4 At the food group level of fruits or vegetable recommendation, however, it was not possible to determine whether the consumption of both WHO food groups that were “vitamin A-rich” or “other” fruits and vegetables are satisfied. For this reason, a score of one (“1”) was awarded for a general recommendation of fruits and/or vegetable servings, and an additional score of “1” was awarded when a specific subgroup or food (eg, Vitamin A source dark green leafy vegetables) was identified for promotion. Added fats, added sugars, nondairy beverages, and composites from broth did not classify into any of the WHO’s food group counting.
Ethics
Ethical clearance was obtained from the University of New South Wales Human Research Ethics Committee (HREC 171036) and Far Eastern University Nicanor Reyes Medical Foundation Institutional Ethics Review Committee (FEU IERC 2008-0005). Participant information statement was provided, and parent/guardian written consent was obtained from all respondents who participated in the study.
Results
Background Characteristics
The mean and SD of ages of children in the 3 age groups were 7.79 ± 0.96 for 6 to 8 months, 10.44 ± 0.88 for 9 to 11 months, and 16.70 ± 2.66 for 12 to 23 months old. The anthropometric results show that the prevalence of stunting and underweight were high especially among 12 to 23 months old children. While minimum meal frequency was met by more than 3-fourths of the children, minimum dietary diversity was low, with only 12% of 6 to 8 and 9 to 11 months old, and 38% of 12 to 23 months old children consumed food from at least 4 food groups in the last 24 hours preceding the dietary survey. Only 12% of 6 to 8 months old, 7% of 9 to 11 months old, and 35% of 12 to 23 months old children met the WHO recommended minimum acceptable diet (Table 1).
Background Characteristics, Nutritional Status, and Complementary Feeding Practices of Breastfed Children Aged 6 to 23 Months in Mercedes, Camarines Norte Province.
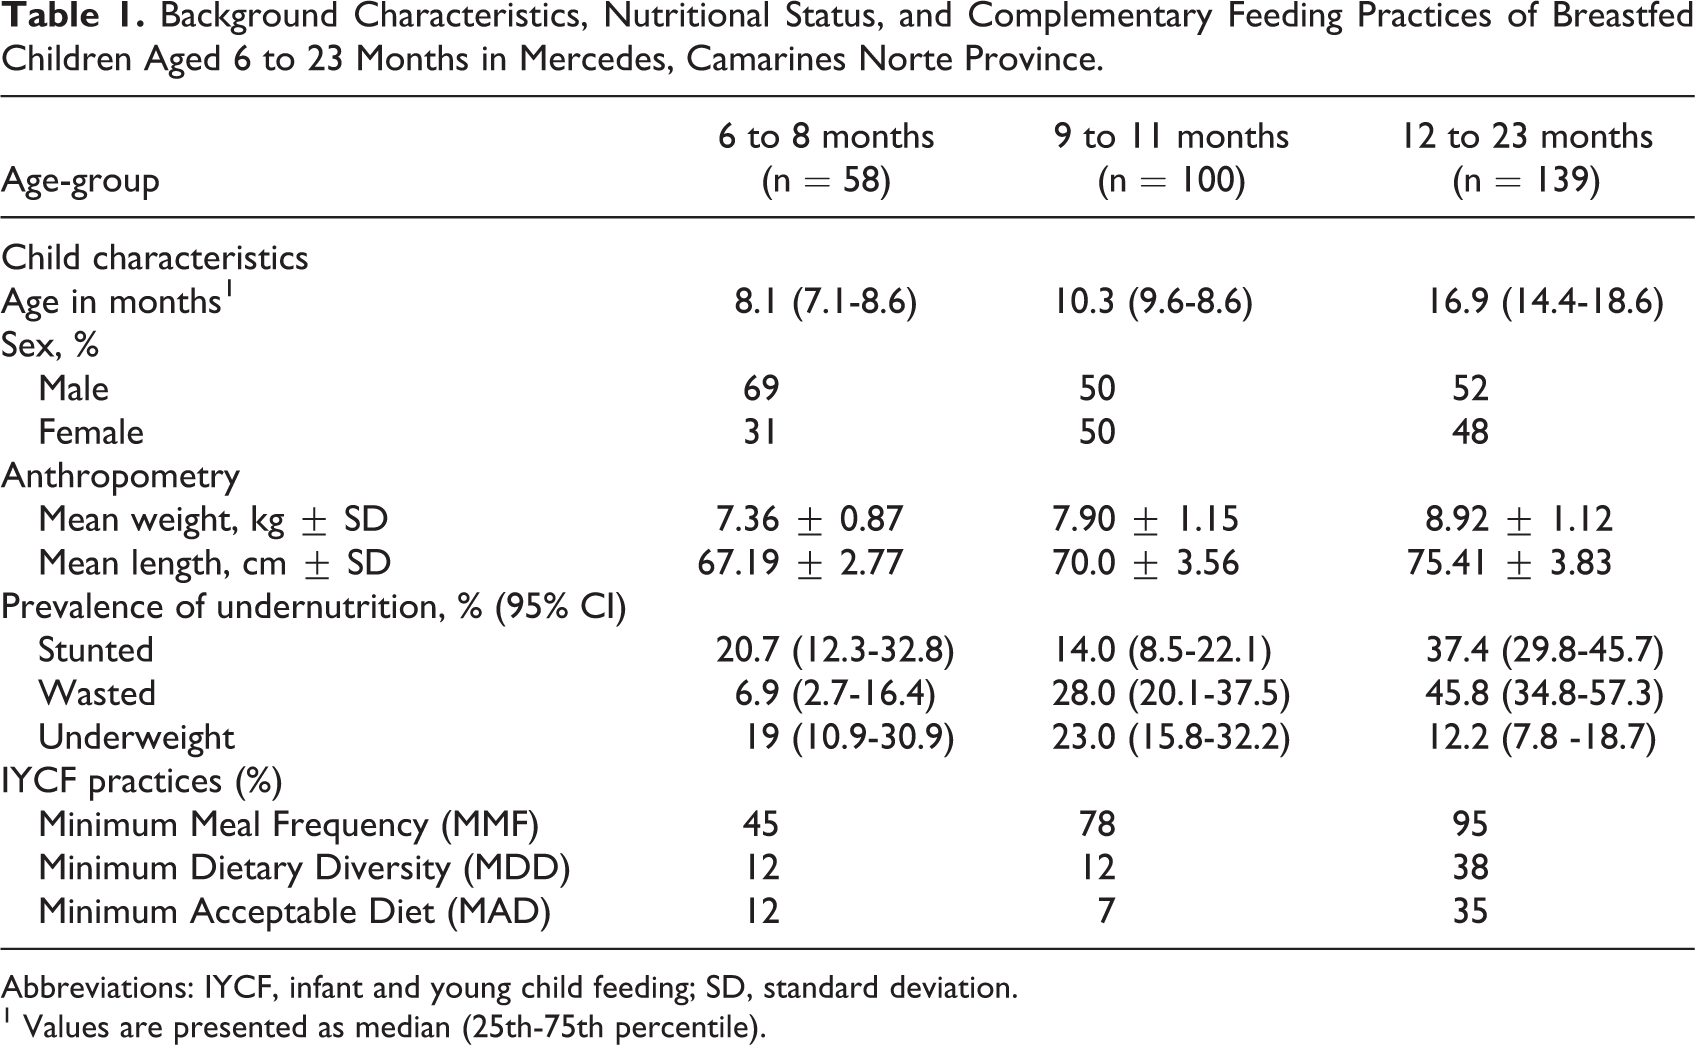
Abbreviations: IYCF, infant and young child feeding; SD, standard deviation.
1 Values are presented as median (25th-75th percentile).
Diet Optimization Analysis Using Optifood
Food patterns of the observed diets and optimized diets
A total of 32, 41, and 52 food items were consumed by 6 to 8, 9 to 11, and 12 to 23 months old, respectively. The maximum serve counts per week ranged from 1 to 24 in 6 to 11 months old, 1 to 30 in 9 to 11 months old, and 1 to 29 in 12 to 23 months. The food counts per food group and median portion sizes are shown in the Supplementary Material. Food consumption patterns, defined as low (5th percentile), average (50th percentile), and high (95th percentile) serve counts distribution per week, is presented in Table 2. In any age-group, the observed average servings were lower than the optimized diet servings in all food groups (<1 serve counts per week) except for composite foods (generally meat broths), grain products, and bakery and breakfast cereals. The optimized results show that in order to improve the nutritional content of the local diets, increasing the frequency of the servings of fruits, vegetables, dairy, animal-source, and plant-sourced protein would be necessary.
The Food Group Constraints in the Observed and Optimized Diets.
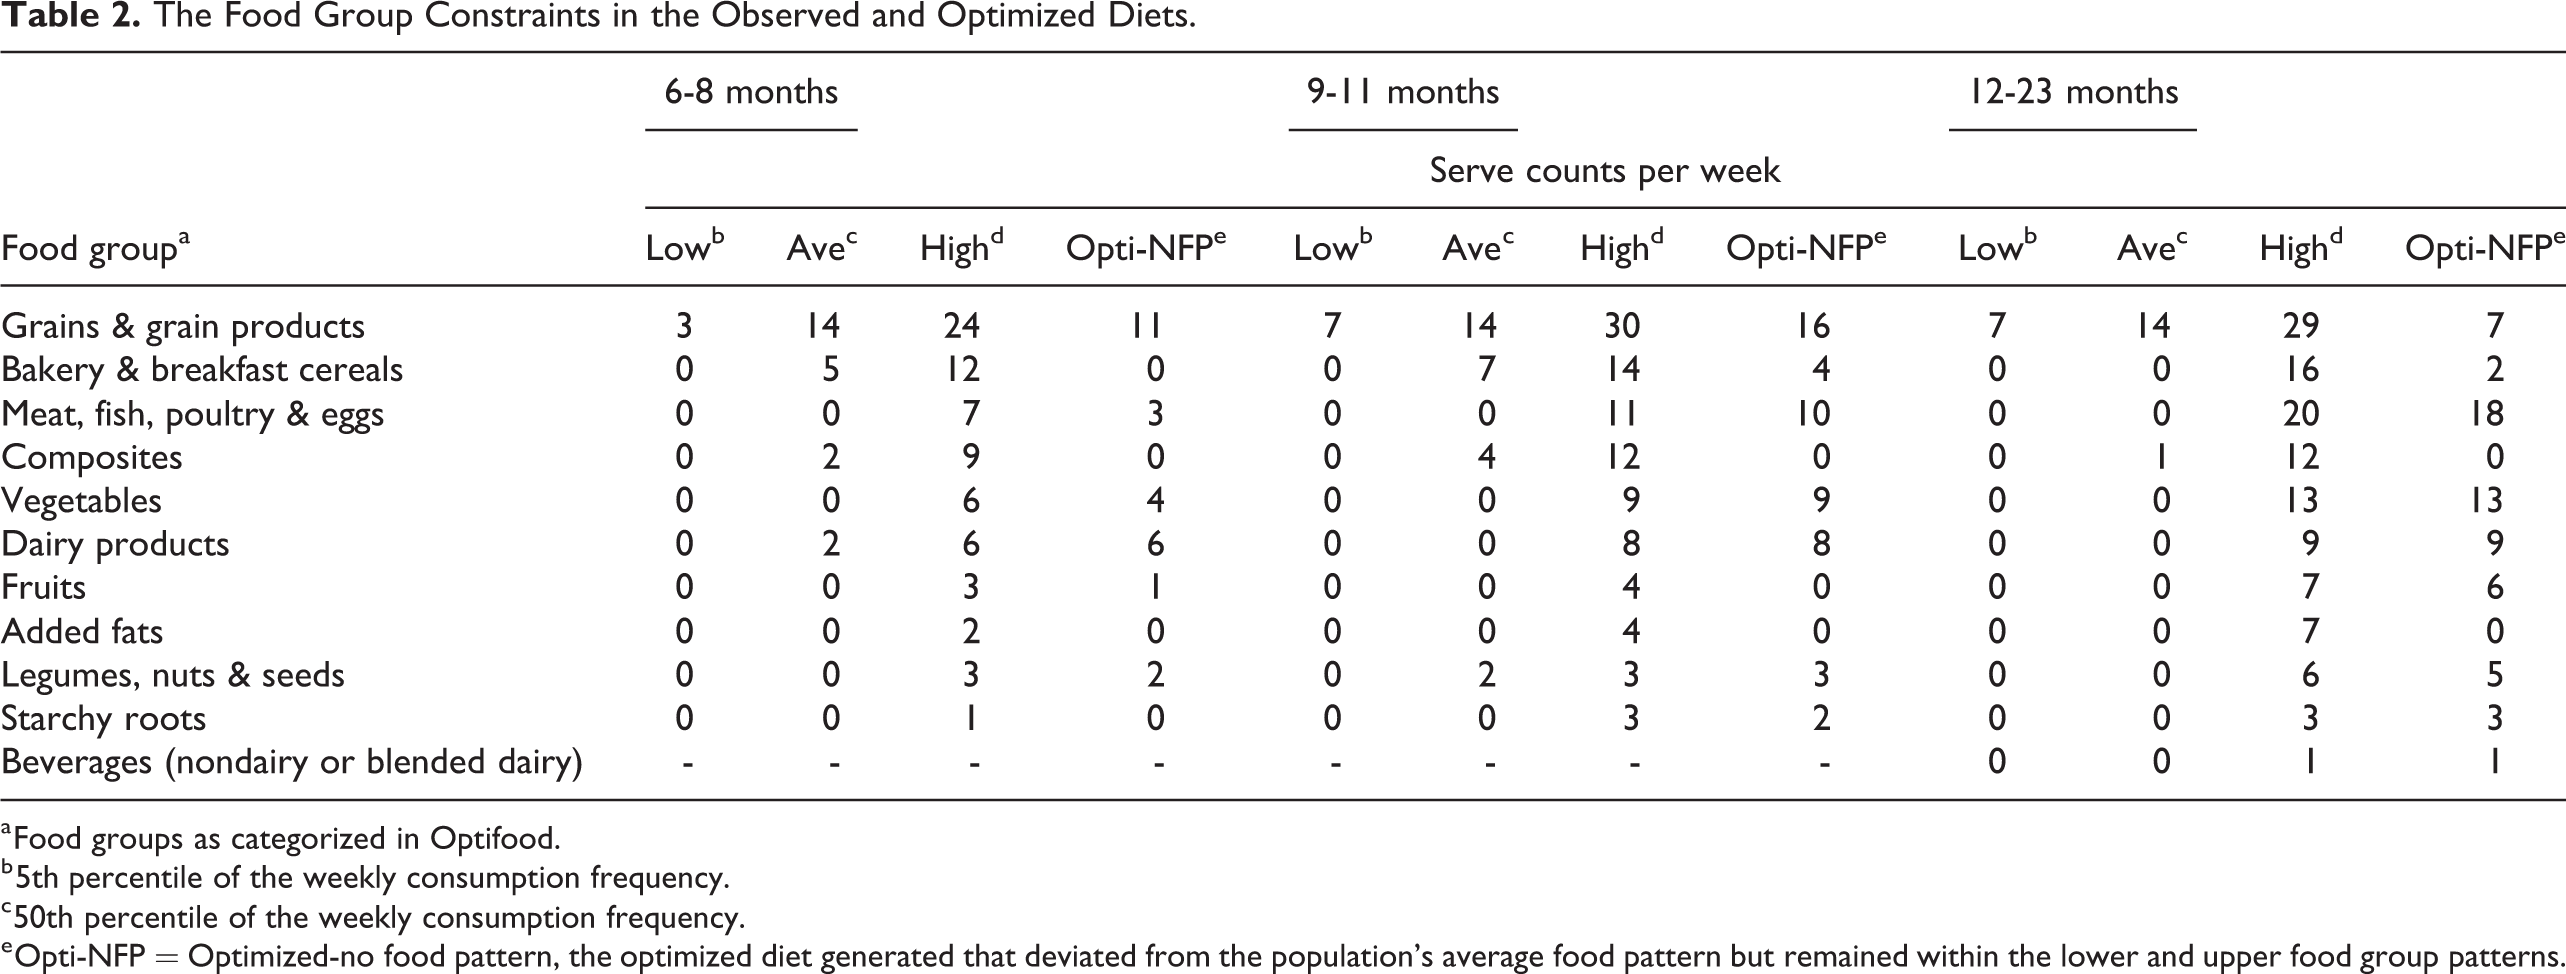
a Food groups as categorized in Optifood.
b 5th percentile of the weekly consumption frequency.
c 50th percentile of the weekly consumption frequency.
e Opti-NFP = Optimized-no food pattern, the optimized diet generated that deviated from the population’s average food pattern but remained within the lower and upper food group patterns.
Problem nutrients
Module 3-Phase 1 analysis generated the best-case scenario levels and identified the problem nutrients for each age-group (Figure 1). Iron and calcium were found to be consistent problem nutrients in the diets of all age groups, while zinc was a problem nutrient among 6 to 8 and 9 to 11 months old infants. Thiamine and folate, on the other hand, were found to be problem nutrients in the diets of 12 to 23 months old children. As shown in Figure 2, when nutrient levels were minimized to the lowest constraint possible, majority of the micronutrients were at risk for inadequacy, defined as <65% of RNI from the worst-case scenario nutrient levels. Except for vitamin B12 and vitamin A for 6 to 11 months old, and folate for 6 to 8 months old children, all the nutrients failed to reach 65% of their RNI when individual nutrients were minimized at the lowest possible level.
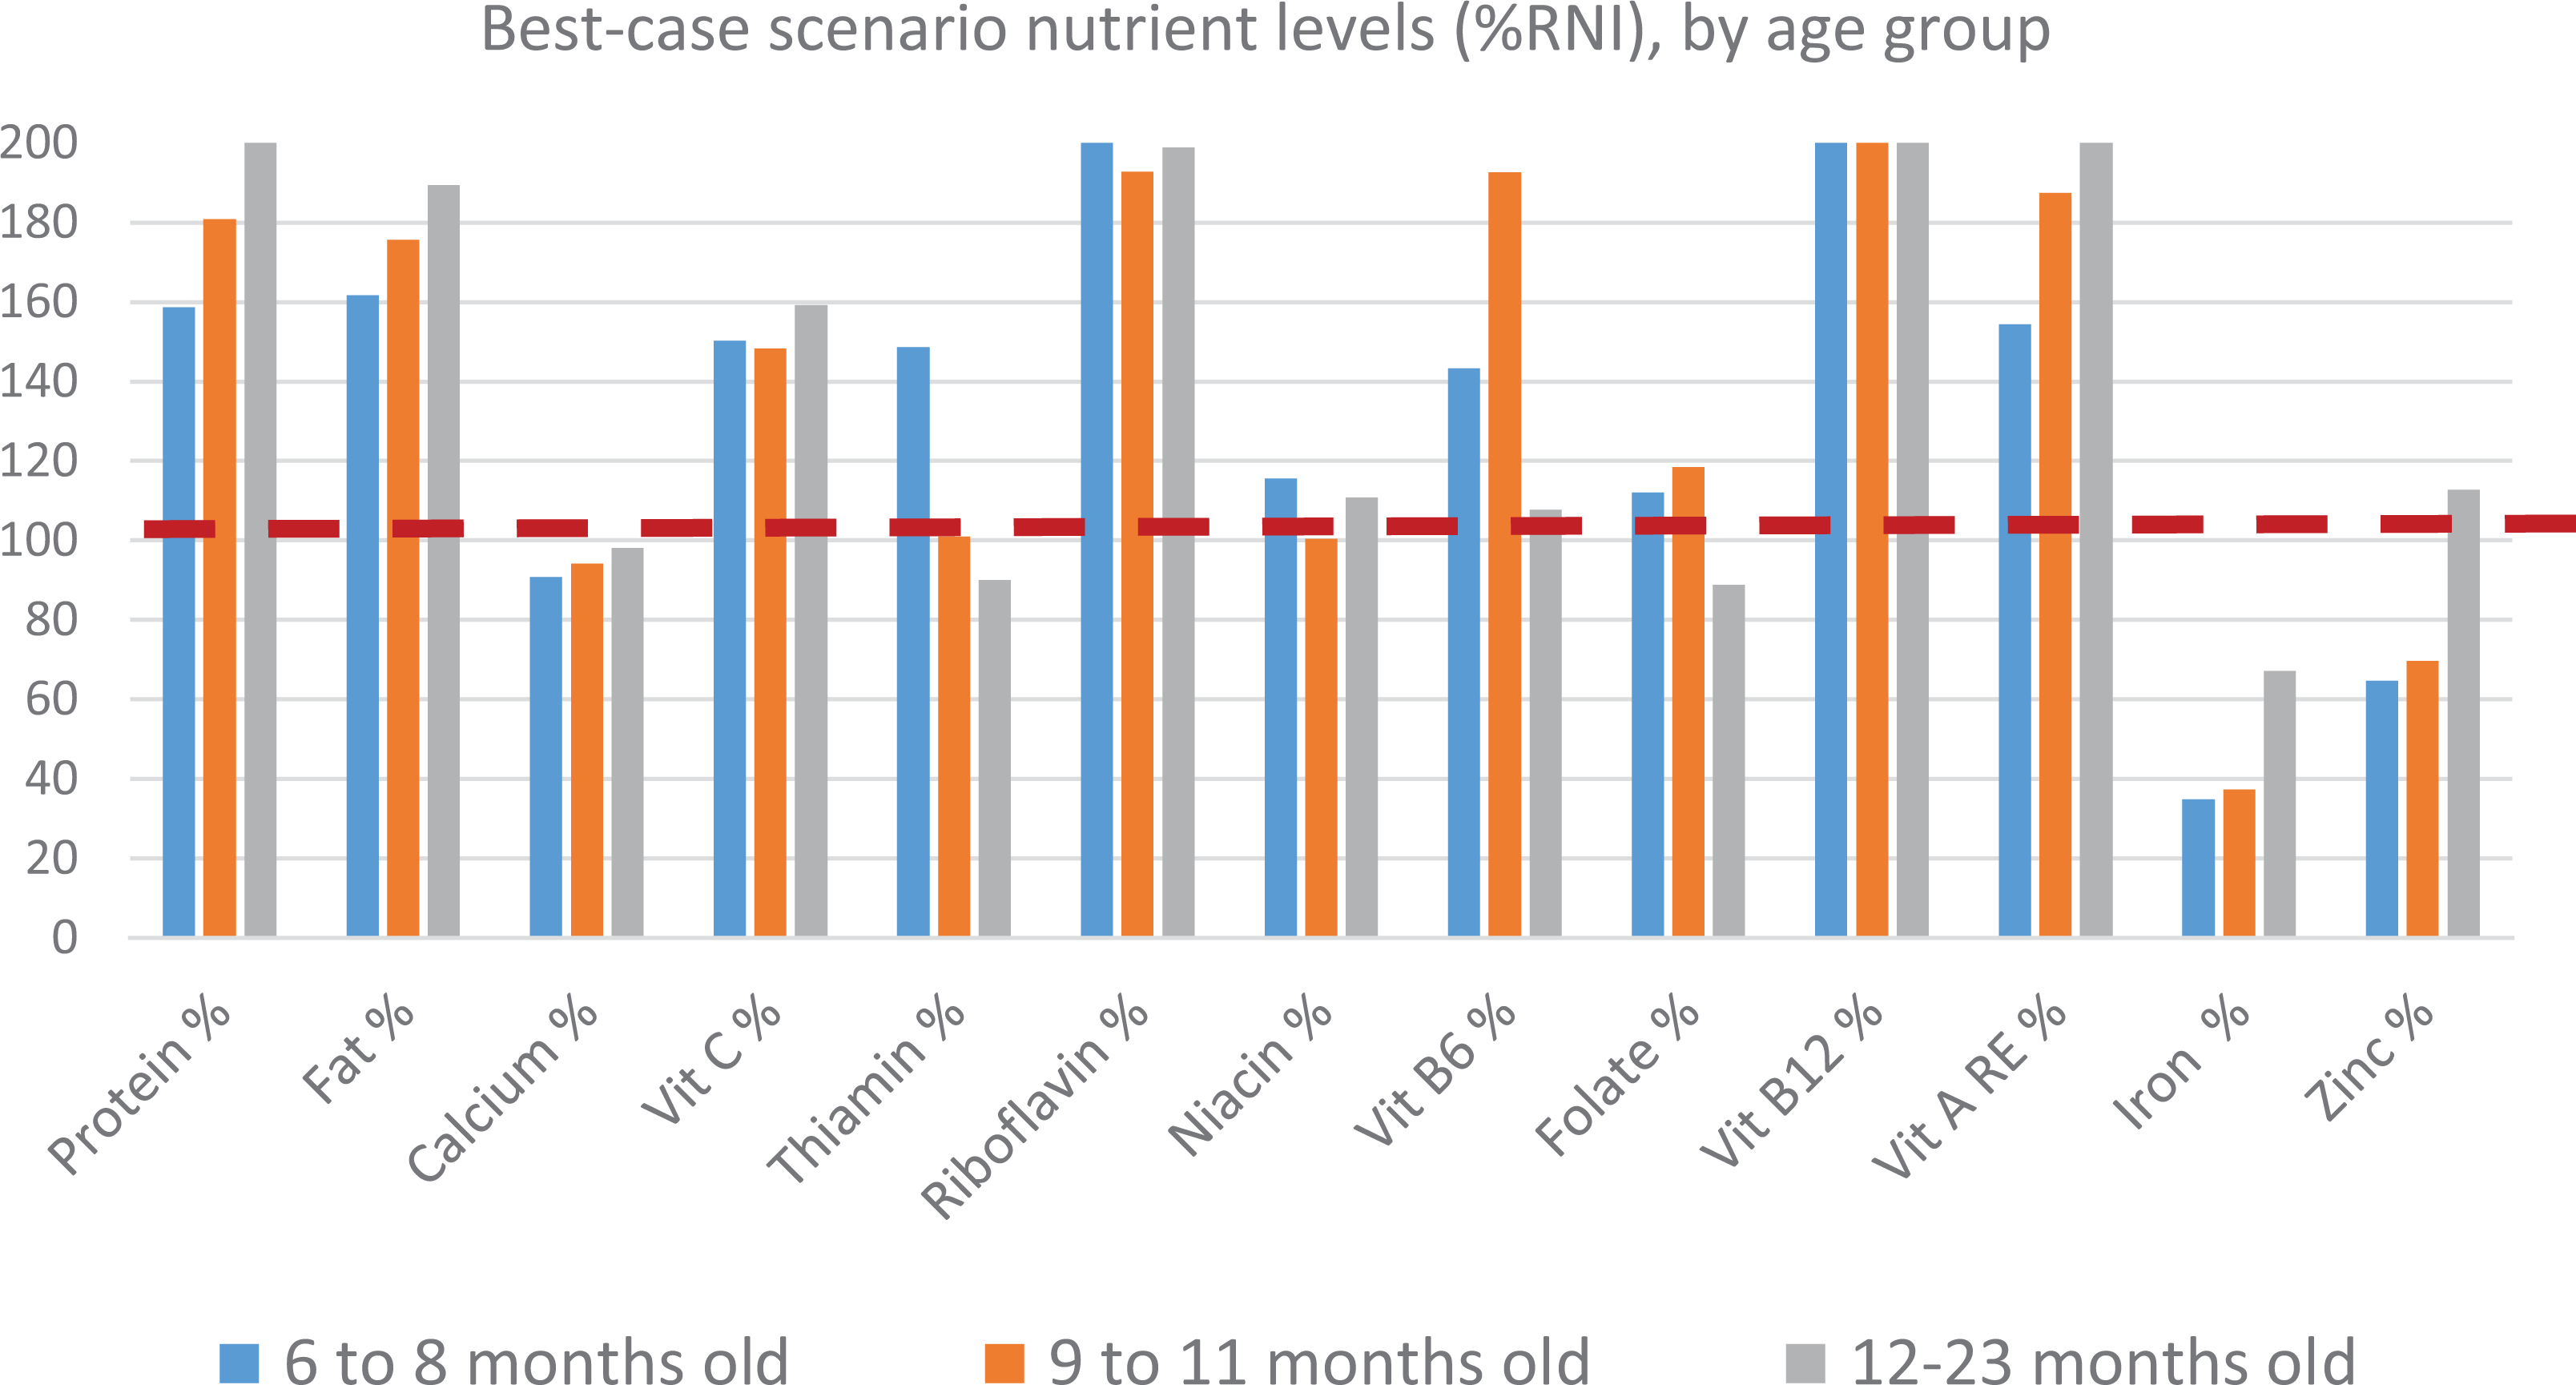
Module 3-Phase 1 analysis, best-case scenario nutrient levels (%RNI). RNI indicates recommended nutrient intakes.
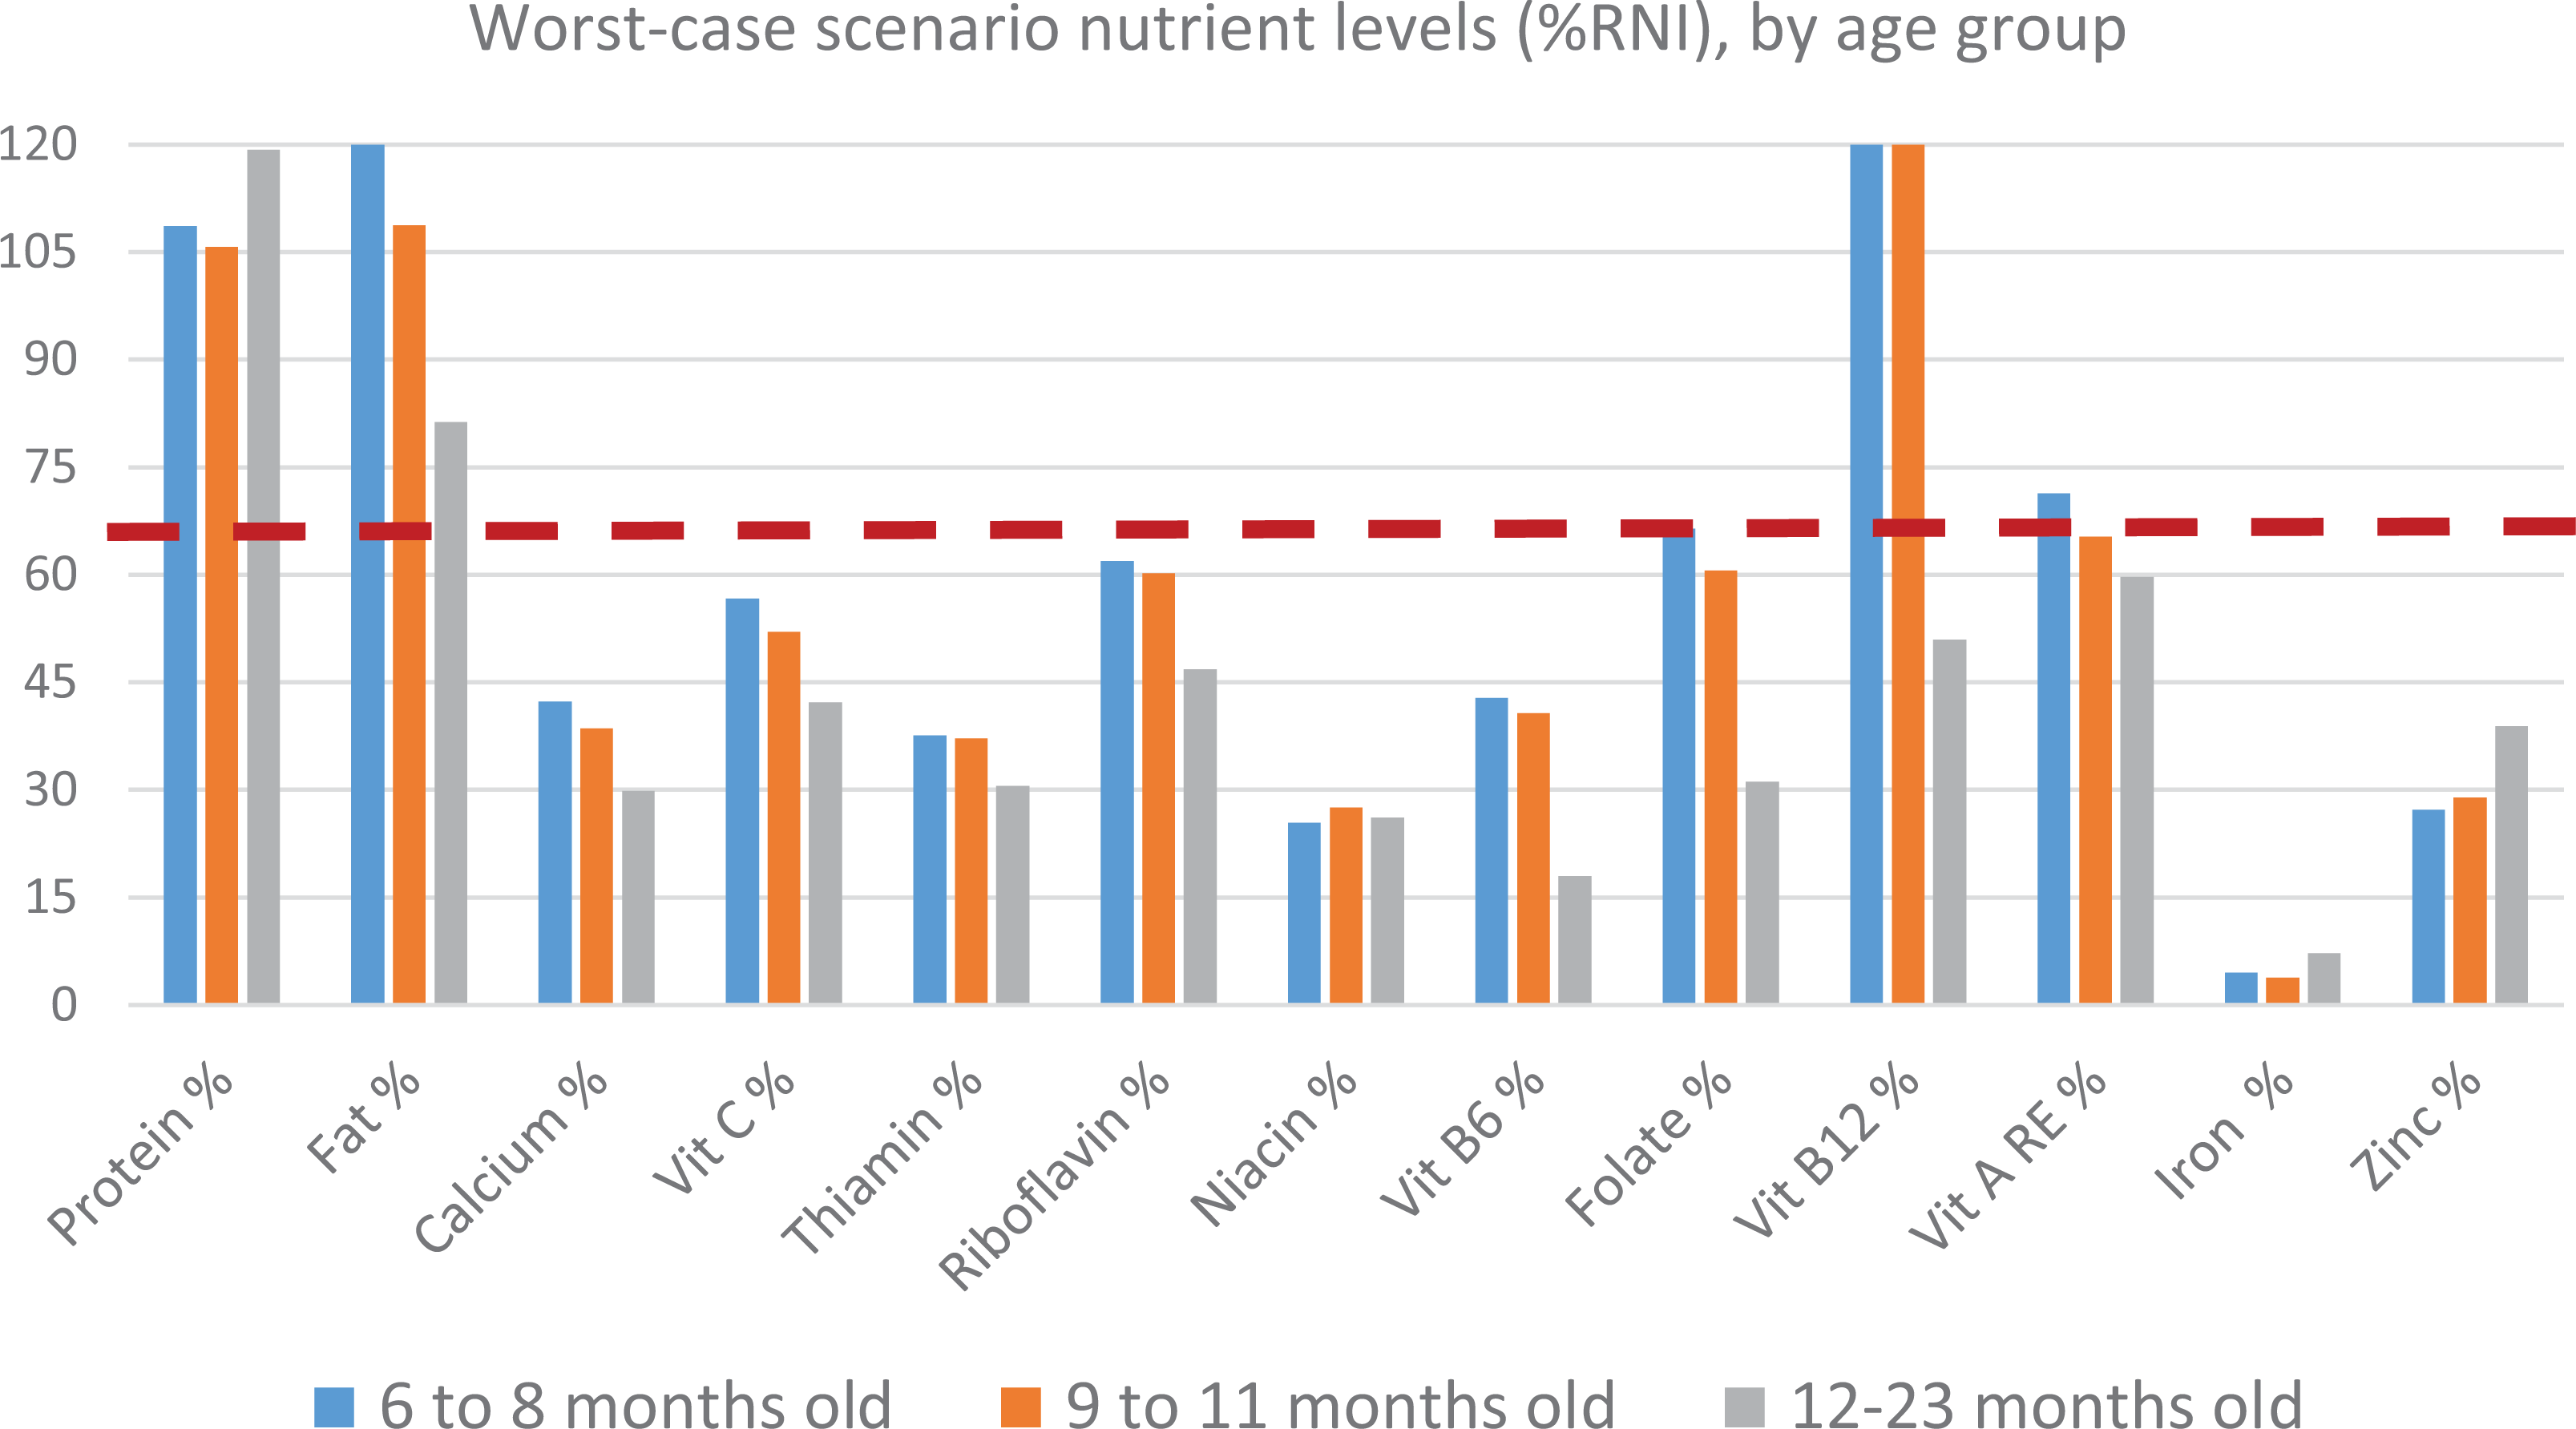
Module 3-Phase 1 analysis, worst-case scenario nutrient levels (%RNI). RNI indicates recommended nutrient intakes.
Evaluation of complementary feeding recommendations
Module 2 provided the nutrient profile (% RNI) achieved in the 2 draft optimized diets. The evaluation of the worst-case scenario nutrient levels for 6 to 8, 9 to 11, and 12 to 23 months old children are presented in the Supplementary Material. The best possible permutations were modeled in Module 3-Phase 3 until the highest achievable food group count per WHO classification out of single recommendations was met (Table 3).
Nutrient Content of Modeled Diets for Different CFR Scenarios for Children Aged 6 to 23 Months, Optifood Module 3.
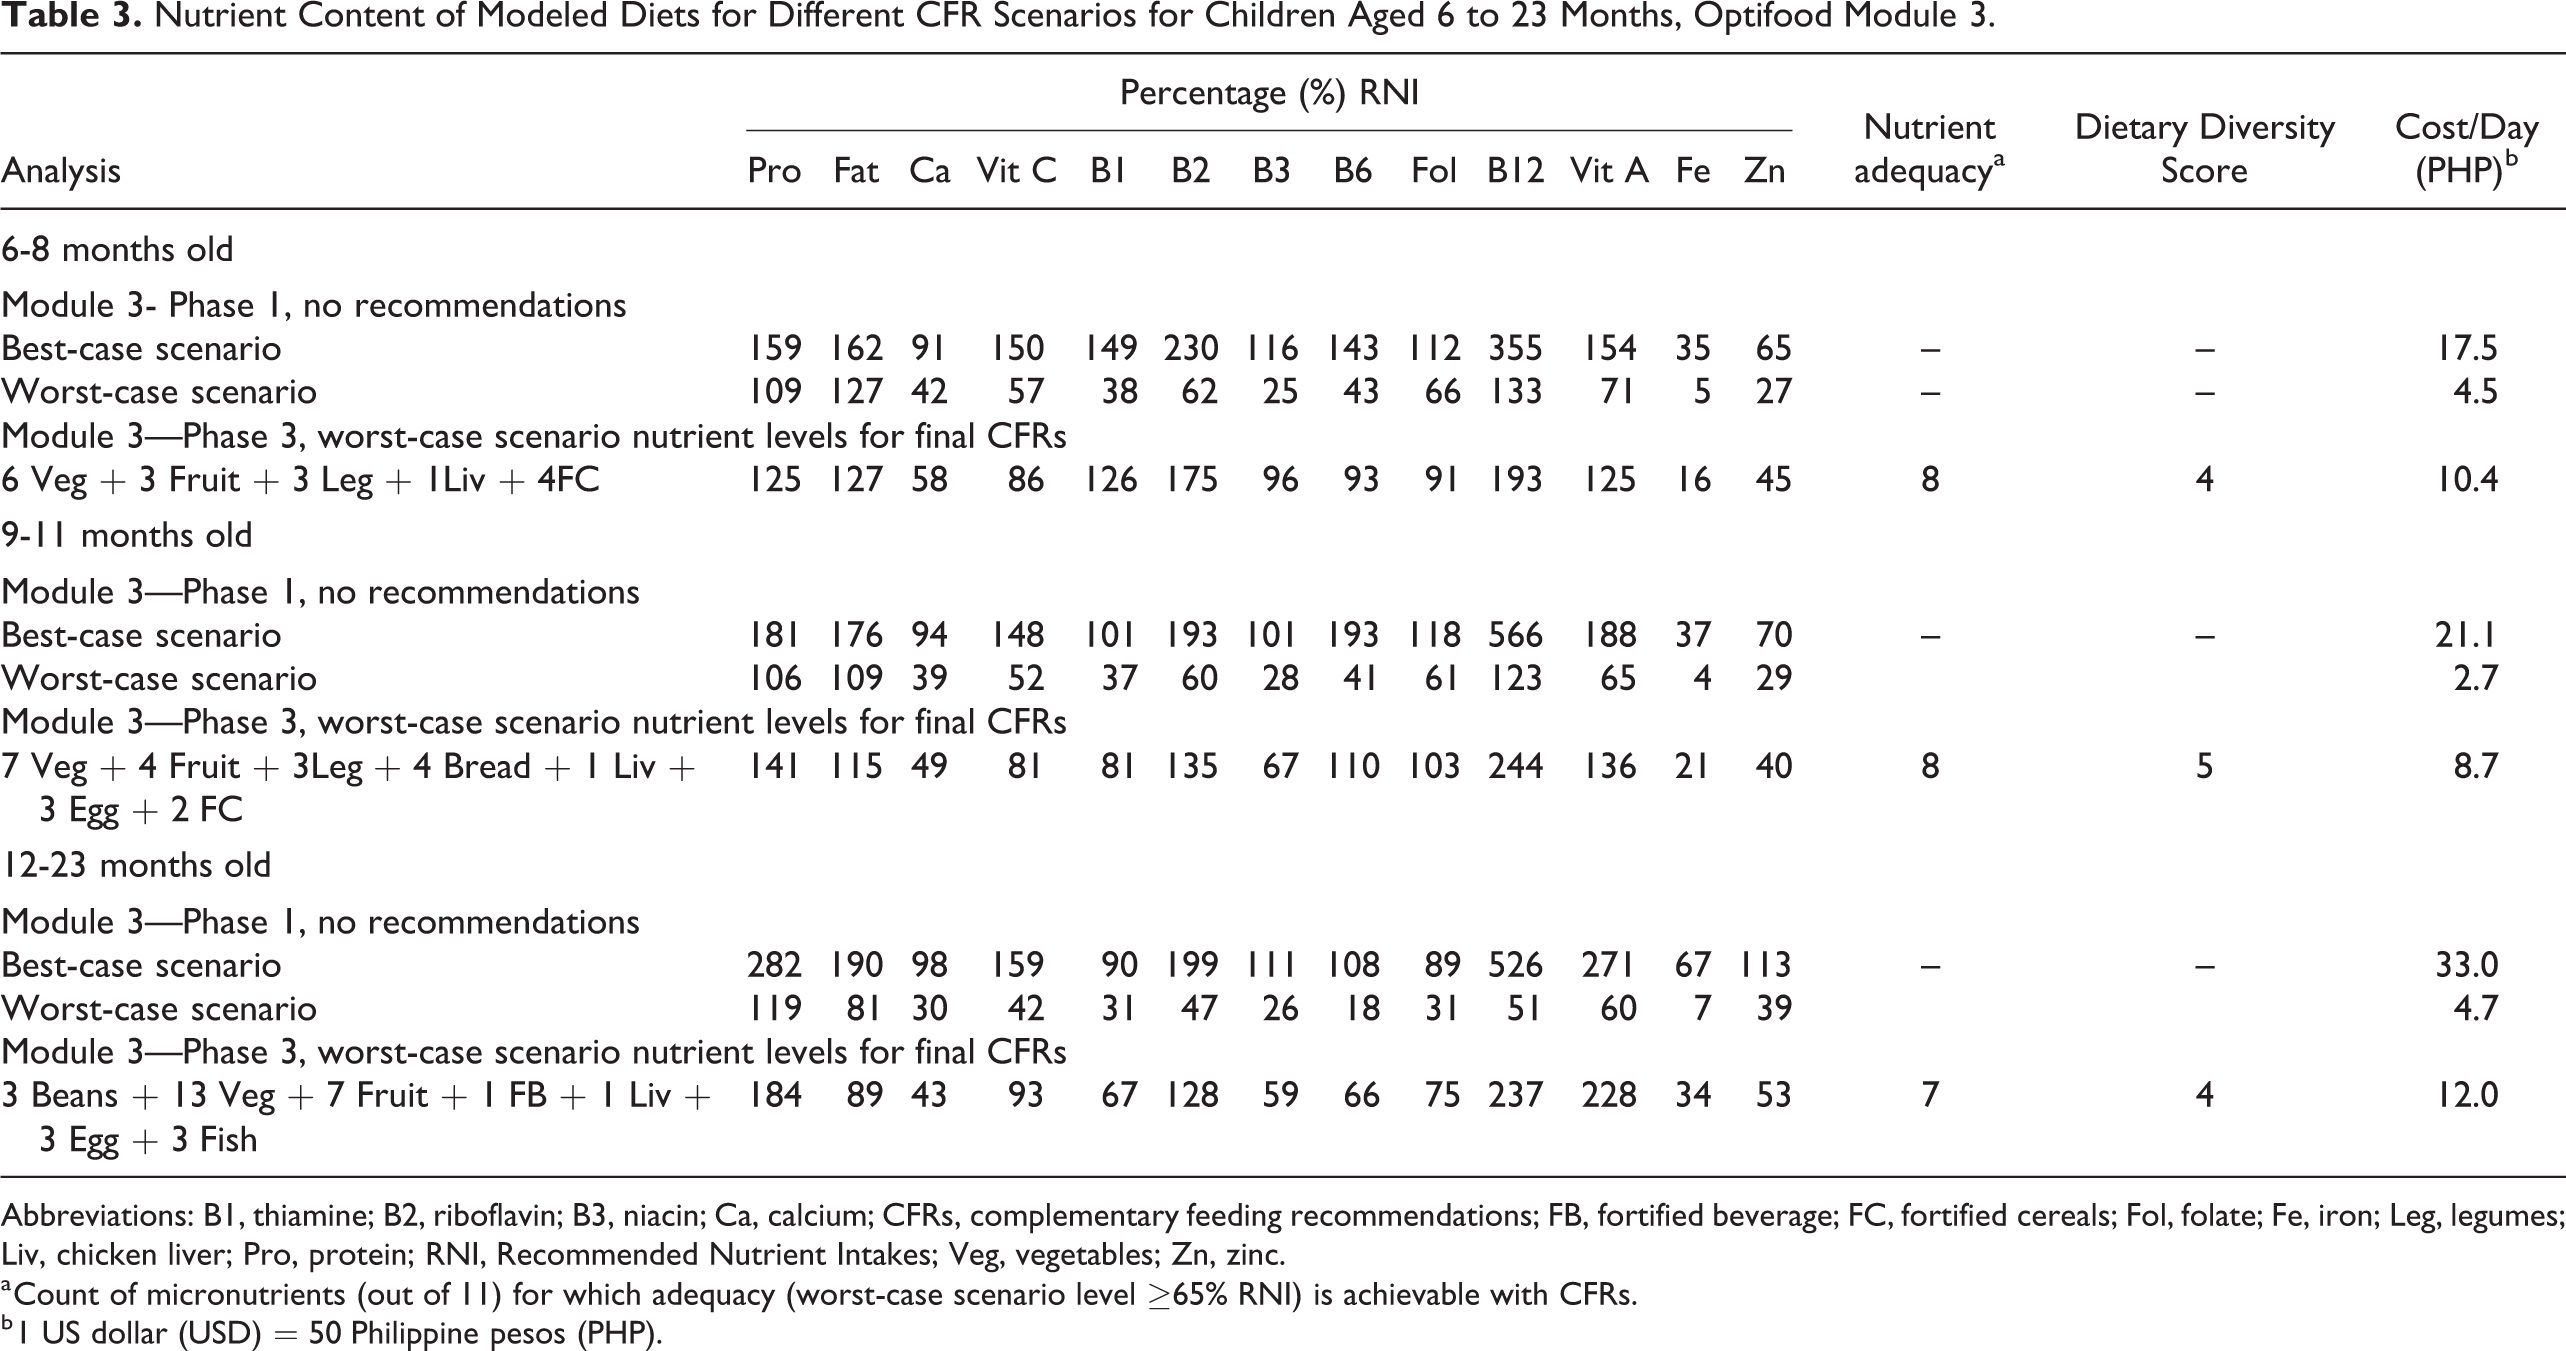
Abbreviations: B1, thiamine; B2, riboflavin; B3, niacin; Ca, calcium; CFRs, complementary feeding recommendations; FB, fortified beverage; FC, fortified cereals; Fol, folate; Fe, iron; Leg, legumes; Liv, chicken liver; Pro, protein; RNI, Recommended Nutrient Intakes; Veg, vegetables; Zn, zinc.
a Count of micronutrients (out of 11) for which adequacy (worst-case scenario level ≥65% RNI) is achievable with CFRs.
b 1 US dollar (USD) = 50 Philippine pesos (PHP).
A CFR where fruits and vegetables are both promoted was preferred (although one WHO food group score is awarded) because promoting both increases the likelihood of the consumption of fruits and vegetables from the 2 WHO food groups (vitamin A-rich and other fruits and vegetables). For 12 to 23 months old children, the final set of combinations with cooked beans 3 times per week were favored over the same set with legumes 6 times per week as it achieved the same nutrient levels with fewer servings. While the subgroup fish without bones was selected for the optimized diet of 12 to 23 months old children, a general recommendation to feed the child fish was identified for promotion in the final CFR. This is because a separate Optifood analysis without dairy was conducted (data not shown) and showed that in the absence of fortified milk, Optifood selects the subgroup fish with bones (ie, food including anchovy and sardines) to improve the levels of calcium in the diet. Hence, without promoting dairy, a general recommendation of fish would provide for the calcium requirements of 12 to 23 months old children.
Based on the local market survey, the cost of the final set of CFRs ranged from PHP 8.7 to 12.0 or roughly US Dollar (USD) 0.18 to 0.24 per day. With varying frequencies per week, the common recommendations from the analysis across all age groups were to consume, in addition to breastmilk, fortified products such as cereals and cereal-based beverage, animal-source foods including chicken liver, fish and egg, plant protein from legumes, and plant-based sources from vegetables and fruits (Table 4).
Final CFRs Developed for 6 to 23 Months Old Children in Mercedes, Camarines Norte Province.
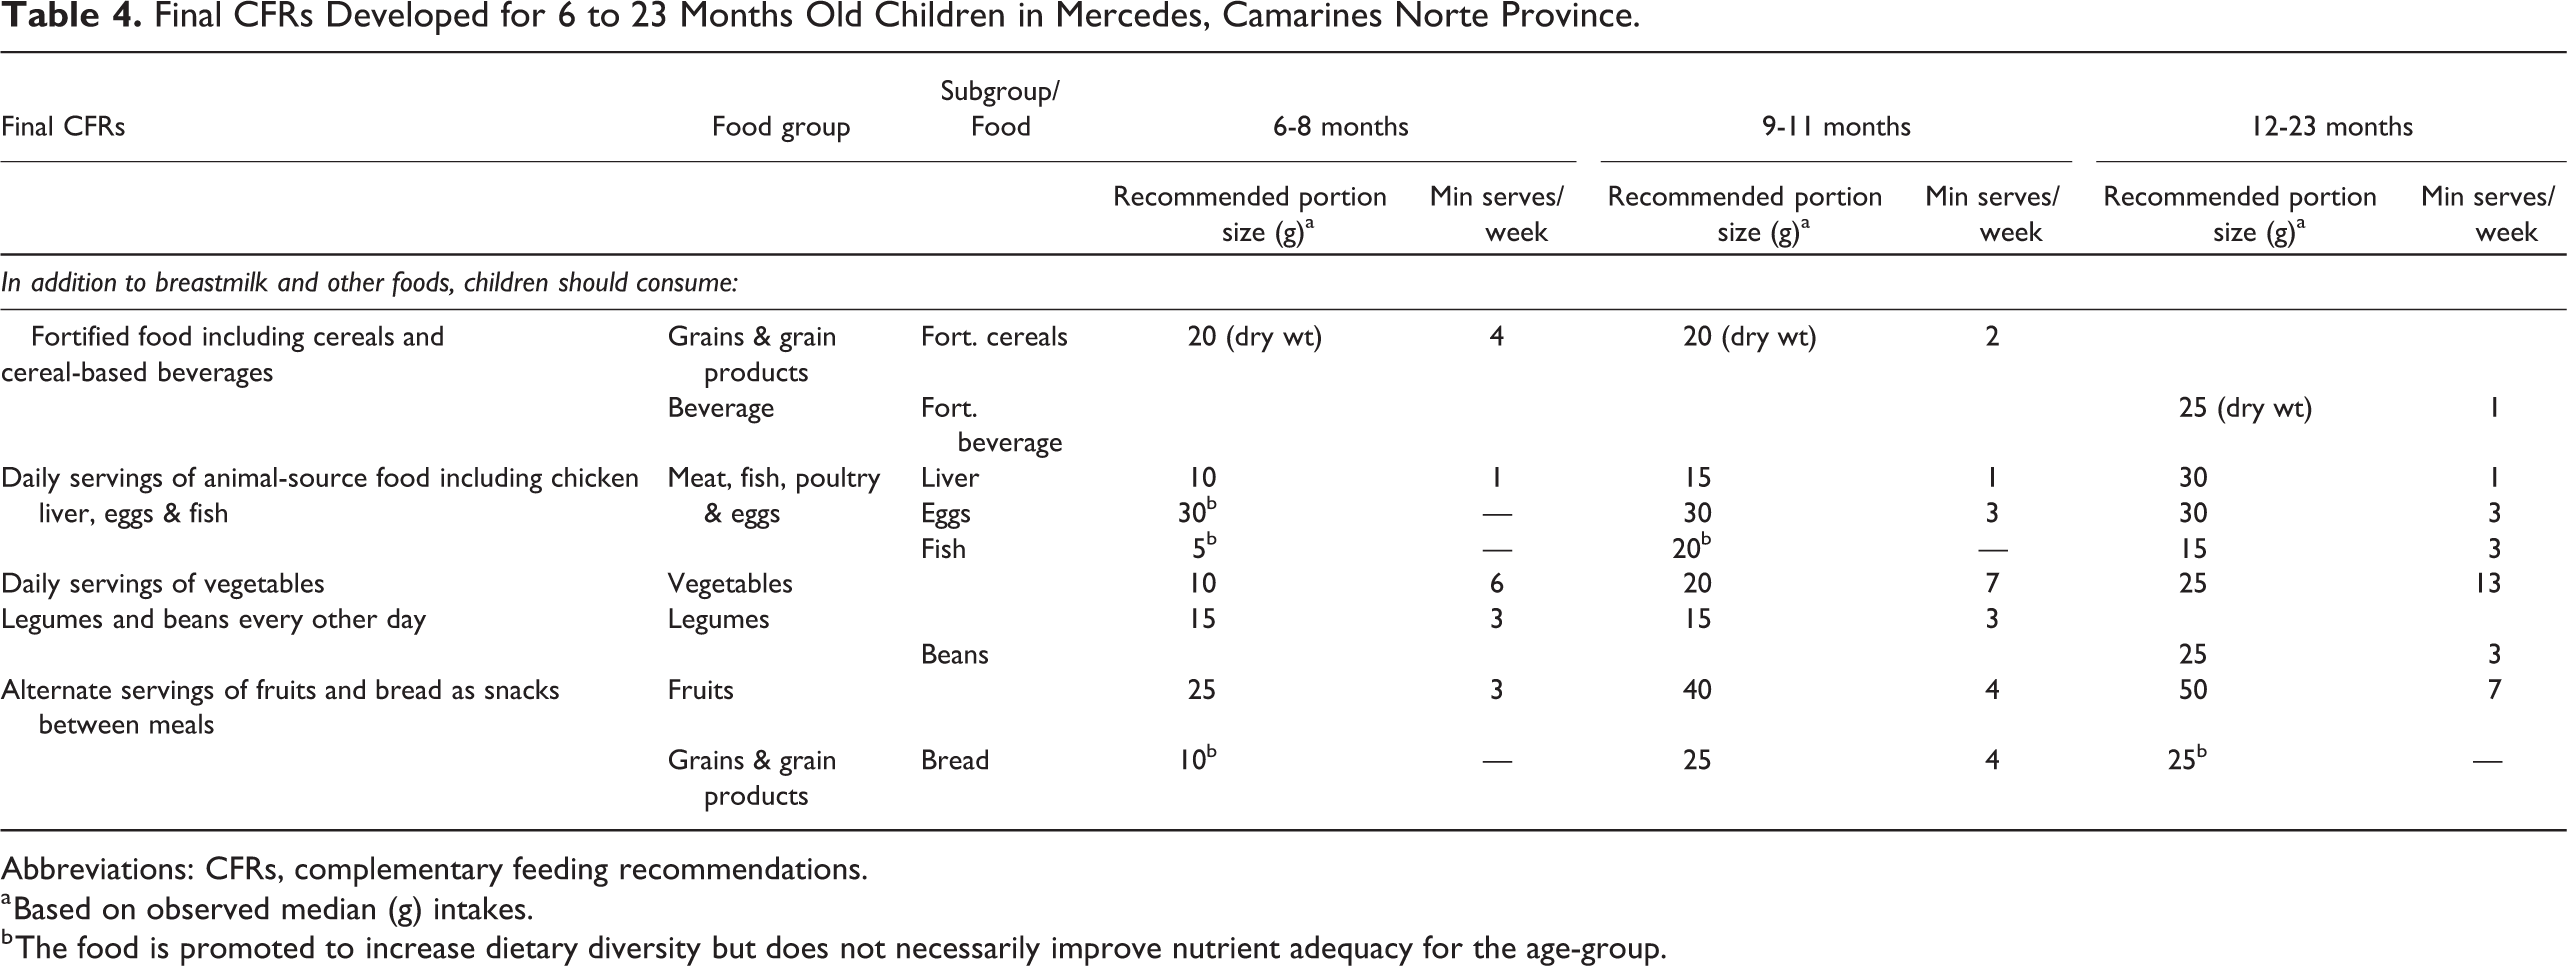
Abbreviations: CFRs, complementary feeding recommendations.
a Based on observed median (g) intakes.
b The food is promoted to increase dietary diversity but does not necessarily improve nutrient adequacy for the age-group.
Discussion
We set out to determine the lowest cost, nutritionally best CFRs to improve nutrient intakes and dietary diversity to fill a gap in evidence for food-based interventions for 6 to 23 months old rural Filipino children. Using linear programming analyses, we identified that iron, calcium, zinc, thiamine, and folate were the problem nutrients in the complementary diets of Filipino children. Given the restrictions of dietary patterns, the complementary diets cannot achieve the nutrient requirements for iron and calcium in any age-group, and zinc for infants, even when the best possible diet combinations of CFRs are fully adopted. The poor quality of complementary diets in the setting is reflected in the low (20%) proportion of children that satisfied the minimum dietary diversity. Our findings concur with a recent study on linear programming analyses by Ferguson et al. 16 in Southeast Asian women and young children (Cambodia, Indonesia, Lao PDR, Thailand, and Vietnam) where they found that iron, zinc, and calcium were often below 65% of their RNI, suggesting that these nutrients are difficult to source from a typical Southeast Asian diet. 16 A shortcoming of the previous study 16 was that the analysis of dietary data excluded fortified foods. In our study, when fortified foods were removed from diet models, the number of problem nutrients increased substantially, with the largest difference seen among 6 to 8 months old (data not included). Interestingly, more problem nutrients were identified for rural Filipino children 12 to 23 months old compared to children of similar age-group from previous studies in the region. 15,19 In this setting, the nutrient gaps observed in the older age-group (12-23 months) may be attributed to the decreased intake of breastmilk and absence of fortified infant cereals and formula milk in the diet, both of which contributed largely to the overall nutrient intakes of the children. All of these issues may have contributed to the high prevalence of undernutrition in the setting.
The most important food sources of nutrients were fortified products from cereal (6-8 and 9-11 months old) and fortified beverage (12-23 months old), and whole food sources from egg (in 9-11 and 12-23 months old), fish (12-23 months old), and chicken liver (for all age groups). Of the 11 micronutrients modeled, the final CFRs in addition to breastmilk would guarantee the adequacy of 8 nutrients for children 6 to 11 and 9 to 11 months old, and 7 nutrients for children 12 to 23 months old. However, the CFRs could not ensure the adequacy of calcium, iron, and zinc in the modeled diets in any age-group, and niacin in 12 to 23 months old children. Iron was a key limiting nutrient that remained below half of the RNI levels even when the best possible set of food was maximized. On the other hand, the final CFRs were able to close the requirement gaps for other problem nutrients, namely thiamine and folate in the diets of 12 to 23 months old children. Good sources of these nutrients were found in cooked beans, fortified beverage, chicken liver, and eggs, which were all selected for promotion in the final CFR. On the basis of positive deviance toward behavior change, chicken liver has been identified as a nutrient-dense food selected for promotion, albeit not reported in the intakes of children aged 12 to 23 months and consumed only by 1% of 6 to 11 months old infants. Modifying the current food patterns can be aided by suggesting recipes or ways to improve palatability, and improving caregivers’ perceived health benefits of chicken liver.
Food-based approaches to enrich the complementary diets of infants and young children in the Philippines have been studied in the past. 11 Similar findings were presented in the literature demonstrating that the addition of chicken liver, egg, fish, and mung bean improves the nutrient content of Filipino complementary diets. 11,33 However, it can be inferred from our study that external solutions such as special formulated or targeted fortified foods may be required to fill in the requirements for iron, calcium, and zinc to achieve adequacy of these nutrients.
In the optimized model in the diets of infants aged 6 to 8 months, consumption of fortified cereal alone provided the highest achievable count of nutrients that met ≥65% of RNI, a criterion set to define the level of adequacy. However, dependency on a single food may reduce dietary diversity and reduce intakes of other essential food groups. 21 Taking into account another step in selecting the final set of recommendations, the CFR for 6 to 8 months old included 3 more food groups, including fruits and vegetables, chicken liver, and legumes. In the optimized models across all age groups, none of the fruits and vegetable subgroups (ie, vitamin A-source, vitamin C-source, and other fruits and vegetables) contributed largely to the nutrient adequacy of most nutrients compared to fruits and vegetables together in their respective food group levels. Promotion of the subgroups above would have added to the final WHO food group score; however, this did not necessarily contribute to increasing the number of nutrients for which nutrient adequacy is ensured.
The final CFRs, in addition to breastmilk, are to feed the child with fortified foods including cereals and cereal-based beverages, daily servings of animal-source food, daily servings of vegetables, legumes, and beans every other day, and alternate servings of fruits and bread as snacks between meals. In contrast to the existing national dietary guidelines namely the Nutritional Guidelines for Filipinos (The 10 Kumainments), 33 Healthy Food Plate for Filipinos (Pinggang Pinoy) 34 , and the Daily Nutritional Guide Pyramid,35 the CFRs developed for this study is specific for the complementary feeding age-group which emphasized the role of fortified foods to nutrient adequacy and established a minimum recommended frequency of serves per week of food groups and subgroups. Before promoting the CFRs, it is recommended to test the feasibility and acceptability of specific recommendations under typical conditions using tools such as ProPAN 24 or Trial of Improved Practices. 34 This is particularly important to identify potential barriers and facilitators to behavior change and develop feasible solutions for effective promotion of interventions.
There are some limitations in the linear programming method and the study that need to be acknowledged when interpreting the results. First, the linear programming method is sensitive to the food composition values, assumptions for nutrient bioavailability and breastmilk volume, and proposed cutoff to establish an adequacy level for an RNI. The seasonality of food may not reflect the overall food consumption patterns of the target population. The data collection took place during the harvest/ nonlean season (summer), and the present results may not be applicable during the lean season. For this reason, a seasonal calendar was developed prior to developing the CFRs to foresee any implications on the availability of foods in changing seasons, and where a promoted CFR may not be applicable during the lean (rainy) season of the year. Further, the recommendation to promote fruits and vegetables at the food group level allows for flexibility on the variety based on the current cost and availability. Another limitation was the smaller sample size of breastfed infants 6 to 8 months of age (n = 59), relative to the other age groups, which meant that the model parameter data points that defined the development of CFRs might not have sufficiently captured the influence of daily variation in the food consumption patterns of the children. Except for iron, breastmilk contributed to more than 10% of micronutrients (data not shown) in all the optimized diets of all age groups. Any discrepancy between the modeled and actual breastmilk intakes may affect the energy requirement and identification of the problem nutrients. Finally, the data from which the model parameters were derived originated from a class 2 municipality in the coastal rural province in the Philippines and cannot be generalized nationally.
In summary, based on the linear programming analysis used in this study, a local food-based approach could improve nutrient adequacy and dietary diversity in complementary diets for rural Filipino children aged 6 to 23 months. Modification of current dietary patterns to include nutrient-dense foods and increase the weekly consumption of at least 4 to 5 food groups would be necessary to achieve adequacy for most micronutrients. However, as within the boundaries of current dietary patterns, zinc (6-8 and 9-11 months), thiamine and folate (12-23 months), iron and calcium (all subgroups) requirements could not be met, and additional intervention such as special fortified foods may be needed to improve the intakes for these nutrients.
Supplemental Material
Supplemental Material, sj-pdf-1-fnb-10.1177_0379572121998125 - Use of Linear Programming to Develop Complementary Feeding Recommendations to Improve Nutrient Adequacy and Dietary Diversity Among Breastfed Children in the Rural Philippines
Supplemental Material, sj-pdf-1-fnb-10.1177_0379572121998125 for Use of Linear Programming to Develop Complementary Feeding Recommendations to Improve Nutrient Adequacy and Dietary Diversity Among Breastfed Children in the Rural Philippines by Karen Kay Mejos, Maria Socorro Ignacio, Rohan Jayasuriya and Jayashree Arcot in Food and Nutrition Bulletin
Footnotes
Authors’ Note
Karen Kay Mejos, Rohan Jayasuriya, and Jayashree Arcot designed the study. Karen Kay Mejos conducted the fieldwork under the local supervision of Maria Socorro Ignacio. Karen Kay Mejos analyzed the data and wrote the manuscript with the support of Rohan Jayasuriya and Jayashree Arcot. All authors reviewed the paper, provided inputs and approved the final draft of the manuscript.
Acknowledgments
The authors wish to thank the University of New South Wales and Local Government Unit of Mercedes for their support. The authors acknowledge the assistance of Ms Lorna Pamor (LGU Mercedes Municipal Nutrition Action Officer) and all the community health workers during the field work. Lastly, the authors thank Dr Umi Fahmida of South East Asian Ministers of Education Organization Regional Centre for Food and Nutrition (SEAMEO-RECFON) for the training provided for Optifood linear programming analysis.
Declaration of Conflicting Interests
The author(s) declared no potential conflicts of interest with respect to the research, authorship, and/or publication of this article.
Funding
The author(s) received no financial support for the research, authorship, and/or publication of this article.
Supplemental Material
Supplemental material for this article is available online.
References
Supplementary Material
Please find the following supplemental material available below.
For Open Access articles published under a Creative Commons License, all supplemental material carries the same license as the article it is associated with.
For non-Open Access articles published, all supplemental material carries a non-exclusive license, and permission requests for re-use of supplemental material or any part of supplemental material shall be sent directly to the copyright owner as specified in the copyright notice associated with the article.