
Abstract
Background:
Inadequate intake of micronutrients in adolescence leads to high risk of nutritional anemia contributing to the intergenerational cycle of malnutrition.
Objective:
To compare problem nutrients in diet of girls with anemia and nonanemic girls and develop food-based recommendation (FBR) to prevent anemia (hemoglobin <12.0 g/dL) and micronutrient deficiencies among adolescent schoolgirls.
Methods:
Screening for anemia was conducted among 355 adolescent schoolgirls aged 15 to 18 years in East Java, Indonesia. Food consumption patterns were assessed from 69 girls with anemia and 78 nonanemic girls aged 15 to 18 years using two 24-hour dietary recalls and 5-day food records. Weighing is used to obtain food portion sizes. Linear Programming (LP) approach using Optifood was used to identify problem nutrient(s) and formulate FBRs.
Results:
Iron and calcium were problem nutrients among nonanemic girls, while iron, calcium, folate, and vitamin A were problem nutrients among anemic girls. Milk and liver were potential nutrient-dense foods identified to fill the nutrient gaps. Six FBRs would ensure the dietary adequacy for 9 of 12 nutrients except for iron, folate, and calcium.
Conclusions:
Anemic girls had more problem nutrients compared to their nonanemic counterparts. The FBRs developed using LP can meet adequacy of most nutrients except iron, folate, and calcium. Nutrient gap identified from LP analysis suggests that it is advisable to add a mixture of weekly iron and folate supplement for adolescent girls in order to meet adequacy of iron and folate to prevent anemia.
Highlights
We developed food-based recommendations (FBRs) through linear programming (LP) that can meet adequacy of most nutrients. The remaining gap in iron, folate, and calcium suggested that weekly iron and folate supplement for adolescent girls is advisable in order to meet adequacy of iron and folate in their diets so as to prevent anemia.
Introduction
Anemia has been characterized as the third most at-risk factor contributing to total disability-adjusted life-years globally 1 and remains a public health concern among nonpregnant and pregnant women aged 15 and older. 2 It negatively affects cognitive development, work, school performance, physical growth, and immunity resulting in high health and economic costs. 3 Globally, prevalence of anemia was 33% in 1995 and decreased to 29% in 2011 among nonpregnant women aged 15 to 49 years. 4 In Indonesia, anemia was a severe public health issue affecting 33% of nonpregnant women and 45% of under-5 children. 5
Adolescent girls comprise one of the important groups undergoing the biological, physical, emotional, and cognitive transition. 6 Most of them enter the reproductive stage which leads to a new nutritional challenge in relation to increasing nutrient needs, changing food preferences, and pregnancy, placing them at most risk of micronutrient deficiency and anemia. 6 Nutrition education is an important strategy to build healthy dietary habits of these adolescent girls to ensure optimal maternal health as well as to improve productivity and lower health-care costs. 6 School has played an important role to influence dietary intake among adolescent girls, since they spend most of their day time at school. With the increased rate of school enrollment globally, schools are preferable places to implement nutrition programs. 7
Anemia is most likely attributable to nutritional deficiency of iron, folate, vitamin B12, vitamin A, or other nutrients. 8 A food-based approach that which is based on locally available, culturally acceptable, and affordable foods, is important to overcome micronutrient deficiencies and anemia, given its sustainability. 9
A Linear Programming (LP) approach can be used to develop optimized food-based recommendations (FBRs) using locally available foods commonly consumed by the target population to meet adequacy of nutrients within affordable cost. 10 Furthermore, LP allows researchers to identify nutrients that are likely to remain low in the best diets based on locally available foods. 10 This study was carried out using an LP approach to identify problem nutrients in adolescent schoolgirls with anemia and nonanemic adolescent schoolgirls and to develop FBRs to meet adequacy of nutrients which are important for prevention of anemia among adolescent schoolgirls.
Methods
Study Design and Participants
This cross-sectional study was conducted from February to March 2016. To be eligible for this study, female student respondents had to be between 15 and 18 years of age and should not have any diseases that could affect their dietary intake. Respondents were excluded if they were on a diet.
Setting
The study was conducted in Malang district, which is a rural area in East Java province, Indonesia. Malang district was selected given its rural setting, with an expectation of high prevalence of anemia among adolescent schoolgirls.
Ethical Clearance
This study was approved by the Faculty of Medicine, Universitas Indonesia (01/UN2.F1/ETIK/2016). Written informed consent was obtained from the parents and assent from the adolescent girls who agreed to participate after receiving explanation about the study.
Sample Size and Sampling Procedure
Probability proportionate to size (PPS) sampling was used as the accurate population data in each high school were available. In this survey, only high schools were considered because adolescent schoolgirls aged 15 to 18 years mostly came from this educational level. The lists of all the 18 high schools in Malang district with the name of all students were obtained from the Provincial Department of Education. Three schools (SMAN 1 Kepanjen, SMAN Islam Kepanjen, and Gondanglegi) were randomly selected through this approach.
In order to differentiate the mean intake of iron among girls with anemia and nonanemic girls, sample size calculation based on hypothesis tests for 2 population means (7.05 vs 5.21 mg/d, standard deviation [SD] = 3.63 mg/d) was used to compare adolescent schoolgirls with anemia and nonanemic adolescent schoolgirls. 11 In total, 69 girls with anemia and 69 nonanemic girls were required.
According to the Basic Health Survey 2010 in Indonesia, prevalence of anemia was 22.7%. 12 In order to get 69 adolescent schoolgirls with anemia, 355 adolescent schoolgirls (which were randomly selected from the three schools using PPS sampling) were screened for anemia. During screening, hemoglobin level, weight, and height were measured. After screening, 72 adolescent schoolgirls were found to be anemic. Three girls with anemia were sick few days after the screening; therefore, they were not able to join the study. In total, 69 girls with anemia were included. List of all the adolescent schoolgirls aged 15 to 18 years from the selected high schools were obtained from each school principal. Among the nonanemic girls, 78 were randomly selected using random number table in the Nutri-Survey for Smart Emergency Nutrition Assessment (www.nutrisurvey.net/ena/ena.html).
Anthropometric and Biochemical Assessment
Two measurements of adolescent girls’ weight and height were recorded to ±0.2 kg and to ±0.2 cm, respectively, and the average value was used in the analysis. The body weight was measured using SECA weighing scale following the standard method, and ShorrBoard was used to measure their height. Hemoglobin levels were measured using portable HemoCue (Hb 301-HemoCue; AB, Angelholm, Sweden). Anemia was defined as hemoglobin (Hb) <12.0 g/dL. 1 Stunting and thinness were defined as height for age Z-score <−2 and body mass index (BMI)-for-age Z-score <−2 of World Health Organization (WHO) growth standard, respectively. 13
Food Consumption Pattern
The fieldwork was conducted from Monday through Sunday to ensure the representation of normal dietary pattern throughout the week days and weekend days. Weekly food consumption patterns were assessed using 2-day nonconsecutive 24-hour recalls (24HRs) and 5-day food records. Food portions were weighed during 1 lunch time of the week using Tanita digital scale for kitchen use model KD-160 with the precision ± 1 g (Tanita Corporation, Japan) and were recorded by the trained enumerators.
For 2-day 24HRs, respondents were given food picture to help them estimate the portion size of the foods consumed. 14 For the quality control, standardized interview protocol employing the multiple-pass 24HR method was applied. 11 In brief, first enumerators asked the respondents all the foods and beverages consumed sequentially during the last 24 hours starting from the time of waking up until going to bed. Second, enumerators asked the respondents in detail about the food and drink consumed. Third, enumerators asked the amount of each item consumed. Respondents were also asked to recall all the ingredients of designated composite dishes on recipe forms. Finally, the enumerators checked whether all the information is correct or whether there was any other food or recipe that they forgot or recorded incorrectly.
A 5-day food record was obtained using a qualitative food record questionnaire to estimate the weekly frequency for each food item and weekly food group consumption patterns. The respondents were given the food record forms and were asked to record the types of foods or drinks they consumed over 4 days. Trained enumerators checked the food records daily in order to ensure the completeness of the food records and to avoid underreporting.
Food groups and food subgroups were defined prior to the importation into WHO Optifood Software. Foods were categorized into food groups that include added fats, added sugars, bakery and breakfast cereals, beverages (nondairy or blended dairy), composites (mixed food groups), dairy products, fruits, grains and grain products, legumes nuts and seeds, meat fish and eggs, miscellaneous, savory snacks, starchy roots and other starchy plant foods, sweetened snacks and desserts, and vegetables. Within these food groups, foods were also defined into subgroups. For example, in the bakery and breakfast cereal food group, it was further defined into subgroups such as pancakes, waffles, scones, crackers; fortified sweetened bakery products; and unfortified sweetened bakery products. Food was included in LP if it is consumed by at least 5% of the respondents or was nutrient-dense. Food groups, subgroups, and food items were classified as low and high consumption (5th and 95th percentile of weekly frequency, respectively) and in addition, the median (50th percentile) of food groups was identified to use as reference food pattern in Best Diet Food Pattern (FP).
Food costs were estimated by market surveys in 2 markets. Two markets were chosen because of its representativeness in the study areas and adolescents commonly used. A research coordinator and an enumerator purchased samples of all foods consumed by the adolescent girls as identified from the dietary data. The cost per 100 g of edible or cooked foods and composite dishes was calculated. For snack, the cost per 100 g of edible portion was calculated.
Formulation of FBR
We purposely chose energy requirement from the Indonesian Recommended Nutrient Intakes (RNI - Angka Kecukupan Gizi) which is 2125 kcal for girls aged 15 to 18 years old. 15 For the rest of macronutrients and micronutrients, the Food and Agriculture Organization of the United Nations (FAO)/WHO RNI in Optifood software was used. 16 Indonesian food composition table was used.
There are 4 analytical modules in the Optifood. 17 Module I (Check diet) was run in order to find out whether the solution was feasible, given the actual dietary intake and pattern. Module I tested the constraints set in the foods, food groups, and food subgroups in order to ensure that there is sufficient flexibility in food choice for modeling the diets (ie, so that at least some individuals from the target population could consume the diets generated by the Optifood). Module II (Draft recommendations) was used to identify the 2 best diets, the problem nutrient(s) and best food groups, food subgroup, and food sources of micronutrients in the existing diets which could be promoted to increase intakes of the “problem nutrient” in Module III. “Problem nutrient” was defined as nutrients that did not meet 100%RNI in Best-diet no FP (best diet which may deviate from median food pattern of food group).
Module III (Test recommendations) was first run without specifying any foods, food subgroup, or food group to identify minimized (worst case) and maximized (best case) scenarios for each nutrient to provide a baseline diet in order to be compared to different alternative FBRs. This baseline diet was then used to compare nutrient levels when testing each FBRs to assess whether the percentage of RNI of each nutrient in the worst-case scenario significantly improved. From Modules II and III, the types of problem nutrient was identified: “absolute problem nutrient,” that is, nutrient that was less than 100%RNI in best-case scenario and “partial problem nutrient,” that is, nutrient that met or exceeded 100%RNI in the best-case scenario, but its level in the Module 2 best diets was below 100%RNI. While intake of partial problem nutrient can be optimized using the nutrient-dense foods, subgroups, or groups, intake of the absolute problem nutrient will likely remain inadequate using the local foods and local food patterns. 16 Nutrients that were not identified as problem nutrients can be either meeting “dietary adequacy” (if its worst-case scenario ≥65% RNI) or else as “dietary inadequacy.”
The alternative combination of nutrient-dense foods were used to produce the alternative sets of FBRs. Each FBR was expressed as the minimum weekly frequency for individual food group, food subgroup, and food item or the combination of these. All sets of FBRs were compared based on their worst-case scenario nutrient levels and the cost of each diet. A set of FBRs that had the highest %RNI worst-case scenario with the lowest cost was selected as the final set of FBRs.
Data Management
The following was used in data management and analysis: WHO AnthroPlus to convert anthropometry measurements into Z-scores; SPSS version 20 to explore the sociodemographic characteristic, dietary intake, and nutritional status; and Microsoft Excel Windows version 2010 for analyzing the food patterns, food list, and cost.
Under- or overreporting of energy in dietary data was assessed using method developed by McCrory et al 18 ; dietary data that were under- or overreported were not included in the analysis. NutriSurvey Windows 2007 (http://www.nutrisurvey.de/) was used to convert from food to nutrient intakes and, WHO FANTA Optifood version 0.4 was used for LP analysis and optimized diet and IMAPP to assess proportion at risk of inadequate nutrient intakes.
Results
Sociodemographic Characteristics and Anthropometric Status
The mean age of respondents was 16 years. The mean body weight was 49 kg and height was 154 cm. Ninety eight percent were Javanese. All schoolgirls already had their menstruation with the average age at menarche of 12 years old.
The mean ± SD of BMI-for-age were −0.41 ± 1.06 and −0.14 ± 1.01 in girls with anemia and nonanemic girls, respectively (P = .754). Prevalence of stunting was 9% and 14%, and thinness was 5% and 2% among girls with anemia and nonanemic girls, respectively. The selected demographic variables did not statistically differ between girls with anemic and nonanemic girls, except that girls with anemia tended to have extended days of menstruation (6.2 ± 1.4 and 5.8 ± 1.2 days in girls with anemia and nonanemic girls, respectively; P = .054). Details of sociodemographic information is described in Table 1.
Sociodemographic and Nutritional Status Among Anemic and Nonanemic Group Adolescent Girls in East Java, Indonesia.a
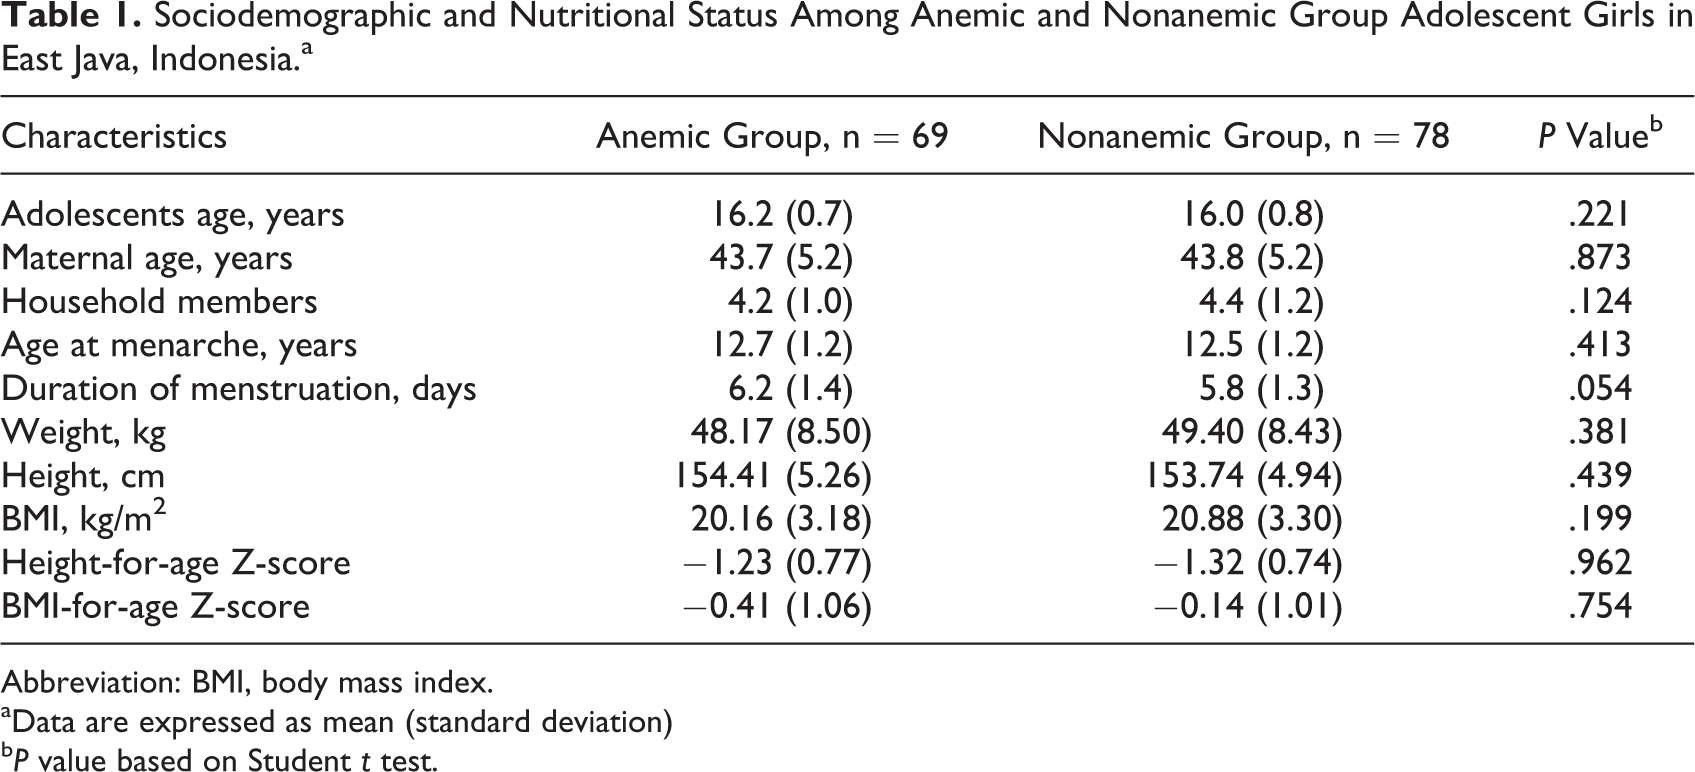
Abbreviation: BMI, body mass index.
aData are expressed as mean (standard deviation)
bP value based on Student t test.
Food Consumption Patterns and Usual Nutrient Intake Among Groups with Anemia and Nonanemic Groups
Including foods that were consumed by at least 5% of the girls plus the nutrient-dense foods in each anemic and nonanemic group, there were 116 and 124 food items identified among anemic and nonanemic groups, respectively, which consist of 15 food groups and 43 food subgroups.
Food groups were classified as lower, average, and high consumption (5th, 50th, 95th percentile of weekly frequency, respectively). There was no difference in weekly frequency of consumption in food groups between anemic and nonanemic groups (Table 2). In average, added fat, grains and grain products, animal protein source foods, and vegetables were the most consumed food groups in both the groups (18, 17, 11, and 10 times per week). The least consumed food groups were starchy roots and plant foods and sweetened snacks and desserts (once per week). There was no significant difference in food frequency of these food groups between anemic and nonanemic groups. There was no significant difference in usual nutrient intake of all nutrients between anemic and nonanemic groups (Table 3).
Weekly Frequency of Food Group Consumption (Servings/Week) of Adolescent Girls, by Anemia Status.a
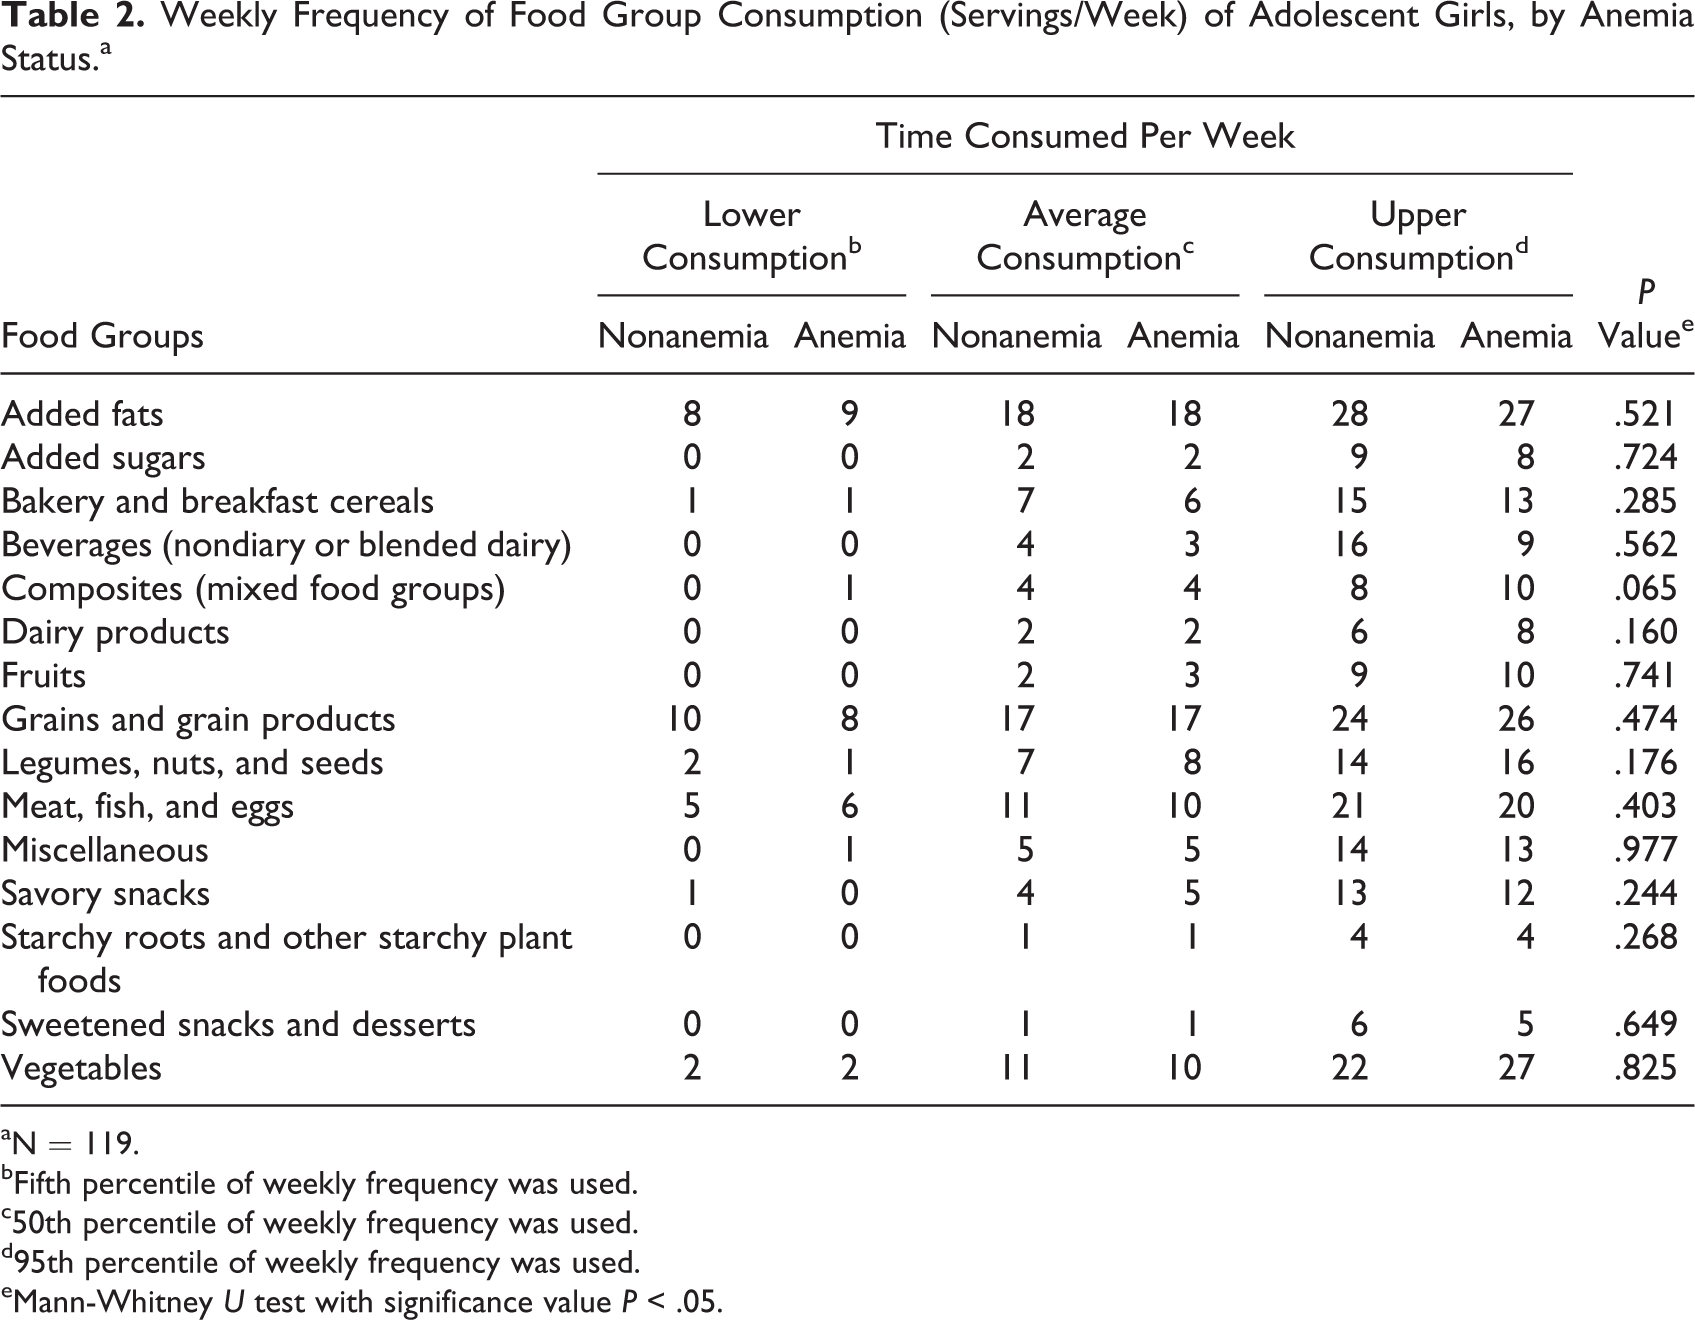
aN = 119.
bFifth percentile of weekly frequency was used.
c50th percentile of weekly frequency was used.
d95th percentile of weekly frequency was used.
eMann-Whitney U test with significance value P < .05.
Usual Energy and Nutrient Intake Between Adolescent Girls With Anemia and Nonanemic Adolescent Girls.
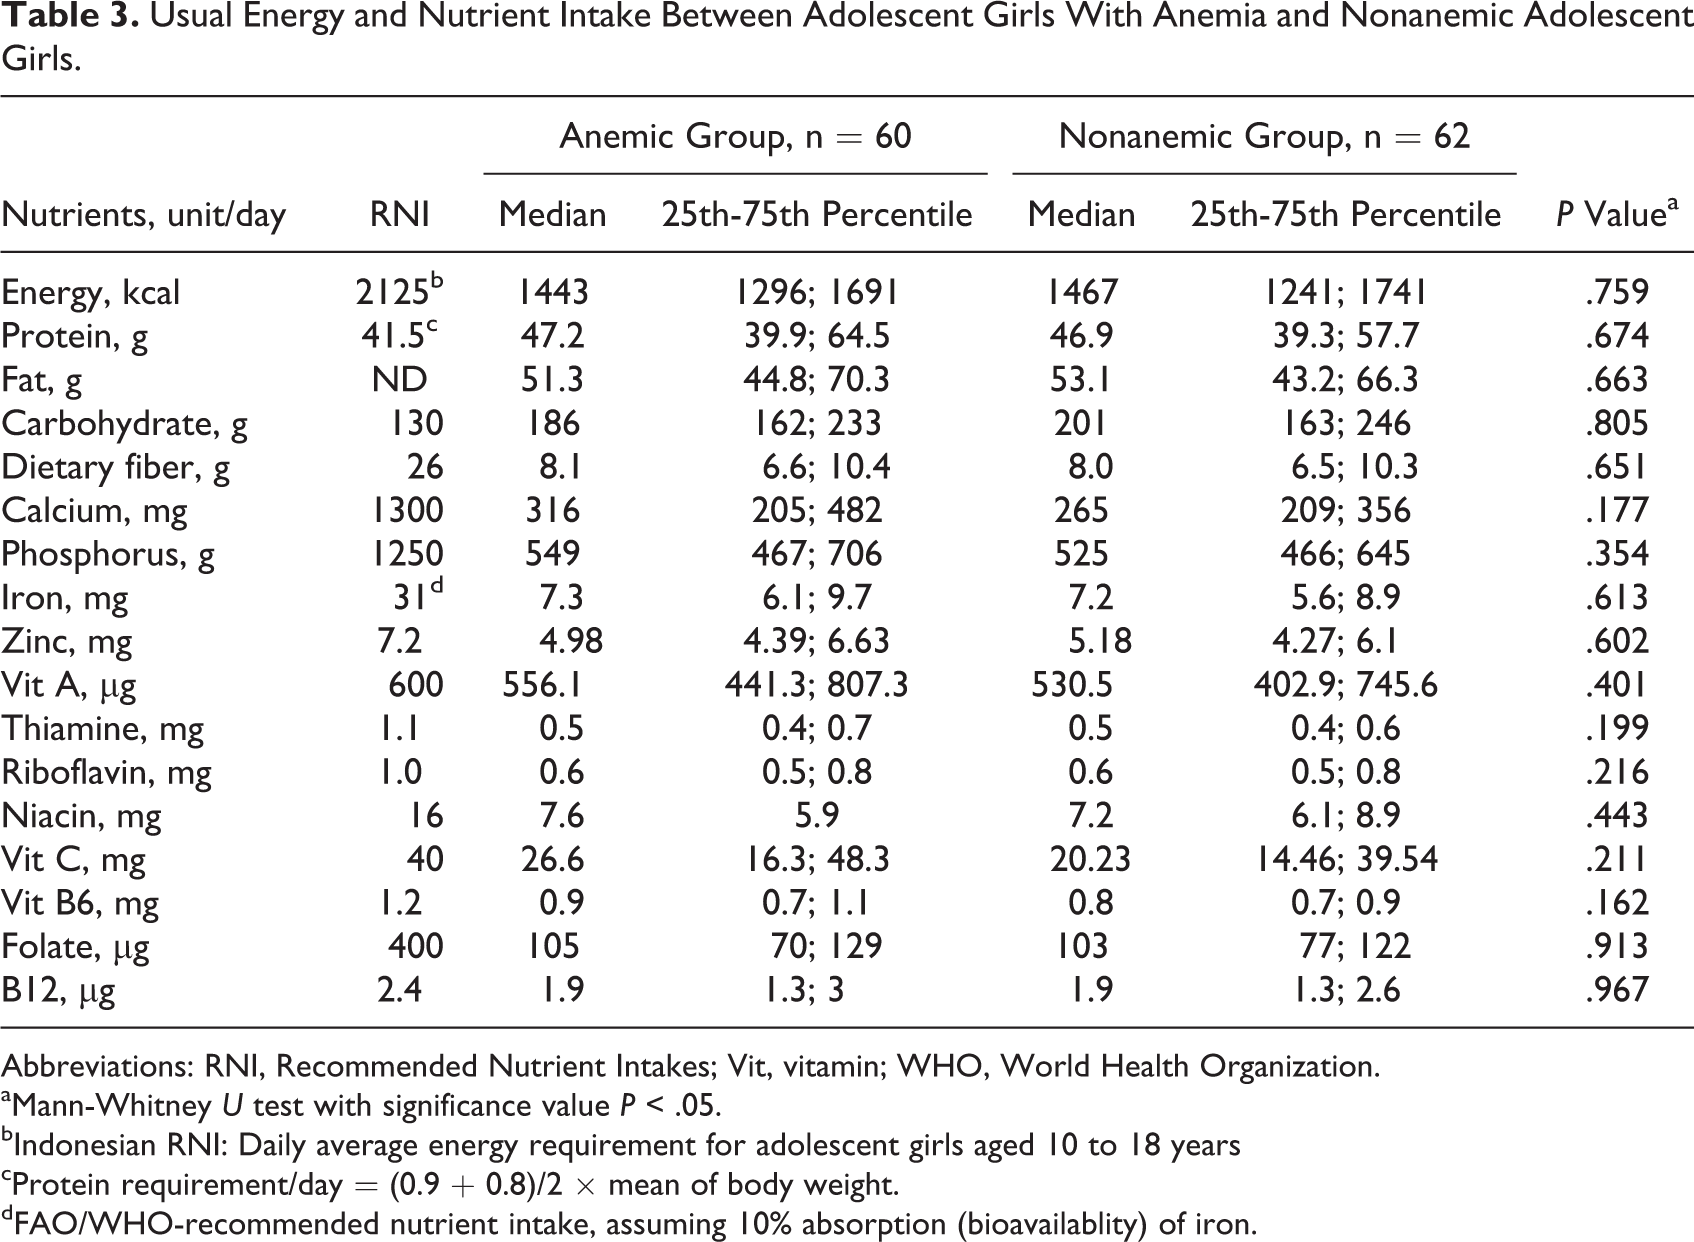
Abbreviations: RNI, Recommended Nutrient Intakes; Vit, vitamin; WHO, World Health Organization.
aMann-Whitney U test with significance value P < .05.
bIndonesian RNI: Daily average energy requirement for adolescent girls aged 10 to 18 years
cProtein requirement/day = (0.9 + 0.8)/2 × mean of body weight.
dFAO/WHO-recommended nutrient intake, assuming 10% absorption (bioavailablity) of iron.
Problem Nutrients Among Anemic and Nonanemic Groups and Draft FBRs
Despite no difference in food pattern and usual nutrient intake between anemic and nonanemic groups, LP analysis identified more problem nutrients among girls with anemia than nonanemic girls. In the nonanemic group, iron and calcium were absolute problem nutrients, whereas in the anemic group iron, calcium, folate, and vitamin A were absolute problem nutrients (Table 4).
Comparison of Nutrient Levels and Minimized Costs of the 2 Best Diets (Module II) and Worst-Case and Best-Case Scenario Diets Without FBRs (Module III) Among Adolescent Schoolgirls With Anemic and Nonanemic Adolescent Schoolgirls.
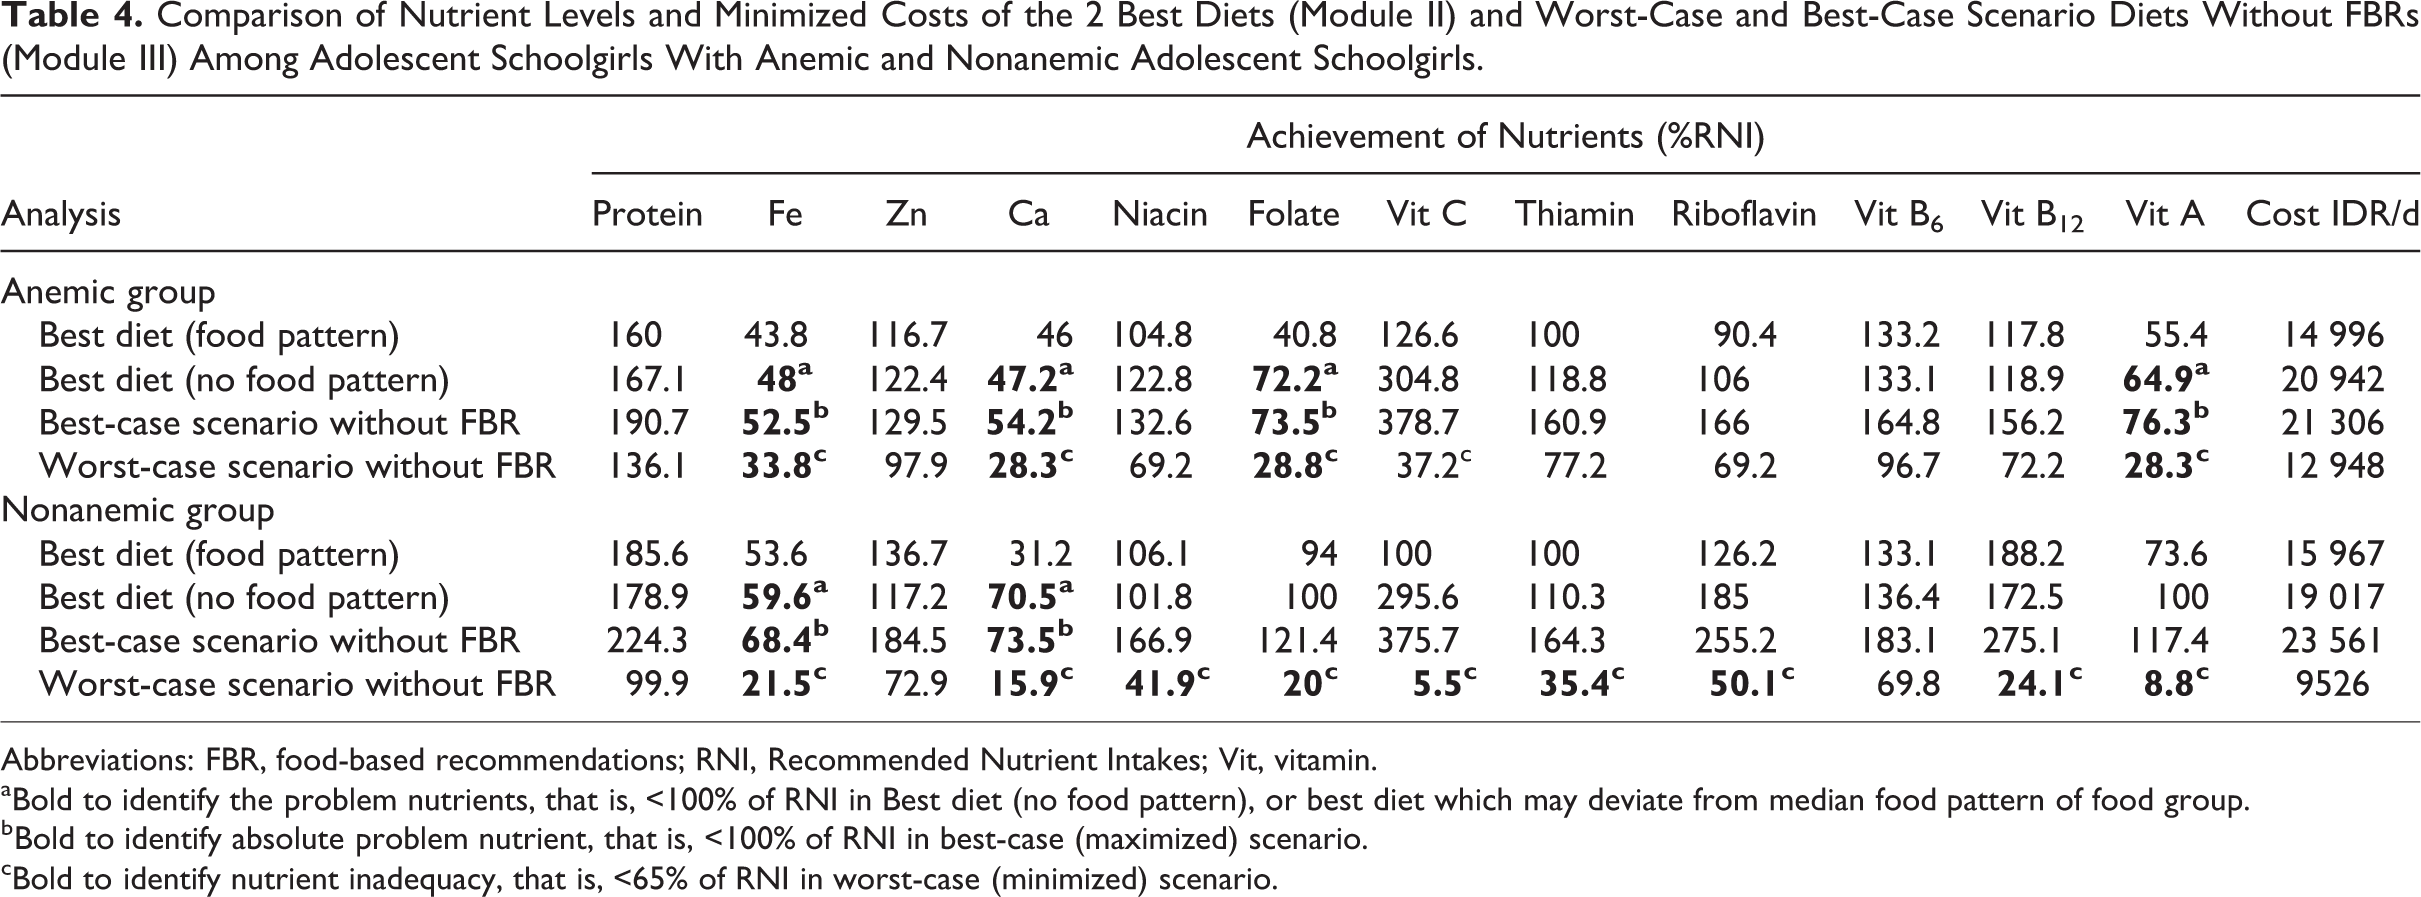
Abbreviations: FBR, food-based recommendations; RNI, Recommended Nutrient Intakes; Vit, vitamin.
aBold to identify the problem nutrients, that is, <100% of RNI in Best diet (no food pattern), or best diet which may deviate from median food pattern of food group.
bBold to identify absolute problem nutrient, that is, <100% of RNI in best-case (maximized) scenario.
cBold to identify nutrient inadequacy, that is, <65% of RNI in worst-case (minimized) scenario.
Given no difference in dietary pattern between girls with anemia and nonanemic girls, dietary data from anemic and nonanemic groups were combined in order to develop more feasible FBR. The 2 best diets formulated in module II demonstrated that the “best diet FP” cost 14 287 IDR/d, while the “best diet no-FP” costs 16 778 IDR/d. Using LP input from both anemic and nonanemic groups, calcium, folate, and iron were identified as “problem nutrients,” and all “problem nutrients” were “absolute problem nutrients” (Table 5). In addition, vitamin C, thiamin, vitamin B12, and vitamin A were characterized as dietary inadequacy.
Comparison of Percentage of RNI Achieved and Minimized Costs of the 2 Best Diets (Module II), Worst-Case and Best-Case Scenario Diets Without FBRs (Module III), and Alternative sets of FBRs Tested (Module III; Worst-case Scenario Only).
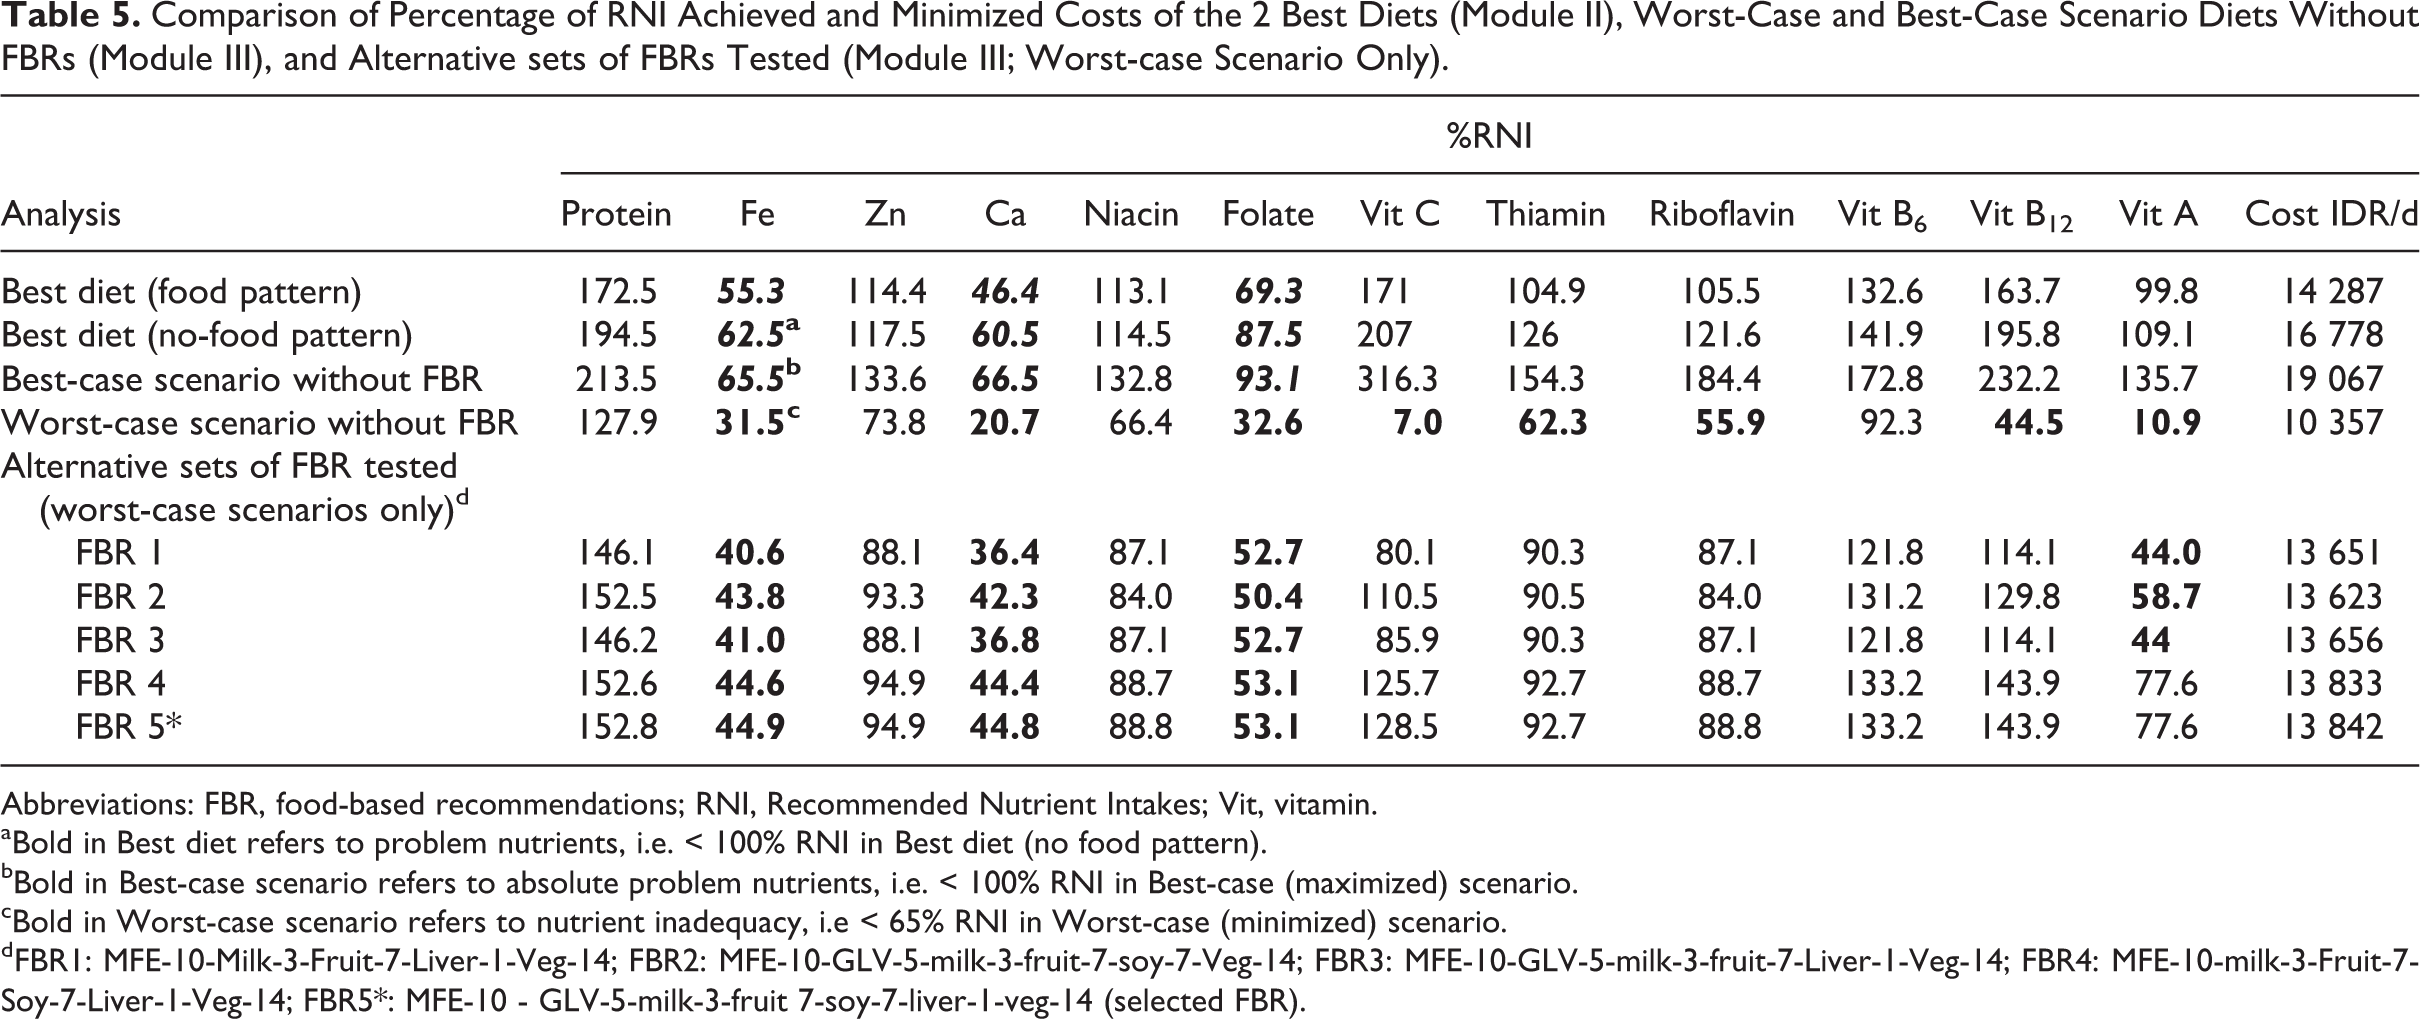
Abbreviations: FBR, food-based recommendations; RNI, Recommended Nutrient Intakes; Vit, vitamin.
aBold in Best diet refers to problem nutrients, i.e. < 100% RNI in Best diet (no food pattern).
bBold in Best-case scenario refers to absolute problem nutrients, i.e. < 100% RNI in Best-case (maximized) scenario.
cBold in Worst-case scenario refers to nutrient inadequacy, i.e < 65% RNI in Worst-case (minimized) scenario.
dFBR1: MFE-10-Milk-3-Fruit-7-Liver-1-Veg-14; FBR2: MFE-10-GLV-5-milk-3-fruit-7-soy-7-Veg-14; FBR3: MFE-10-GLV-5-milk-3-fruit-7-Liver-1-Veg-14; FBR4: MFE-10-milk-3-Fruit-7-Soy-7-Liver-1-Veg-14; FBR5*: MFE-10 - GLV-5-milk-3-fruit 7-soy-7-liver-1-veg-14 (selected FBR).
The potential nutrient-dense food sources that were identified in Module II and could be promoted to help achieving dietary adequacy were small fish with bone, chicken liver, commercial milk, fortified biscuits, tempeh, noodle with meatball, and red spinach. Nutrient-dense food subgroups were also identified which were other vegetables, soybeans and products, vitamin A source dark green leafy vegetables, and vitamin C-rich fruit. These food subgroups and food items were then combined to run the alternative sets of FBRs to be tested in Module III.
From 120 sets of FBRs produced in Module III, 5 FBRs are presented in Table 5. They were considered the most promising FBRs because they achieved more than 40% RNI for calcium, iron, and folate in worst-case scenarios. Among these set of FBRs, FBR 5 was selected as final FBR because it contains food items that come from diverse food groups, and its worst-case scenario %RNI had the highest levels compared to other potential FBRs. The costs of these 5 FBRs were relatively similar. Box 1 presents the final chosen FBR messages including the recommended minimum portion sizes. With the exception of calcium, iron, and folate, the best diet developed by LP significantly increased %RNI from the baseline nonoptimized diet (Figure 1).
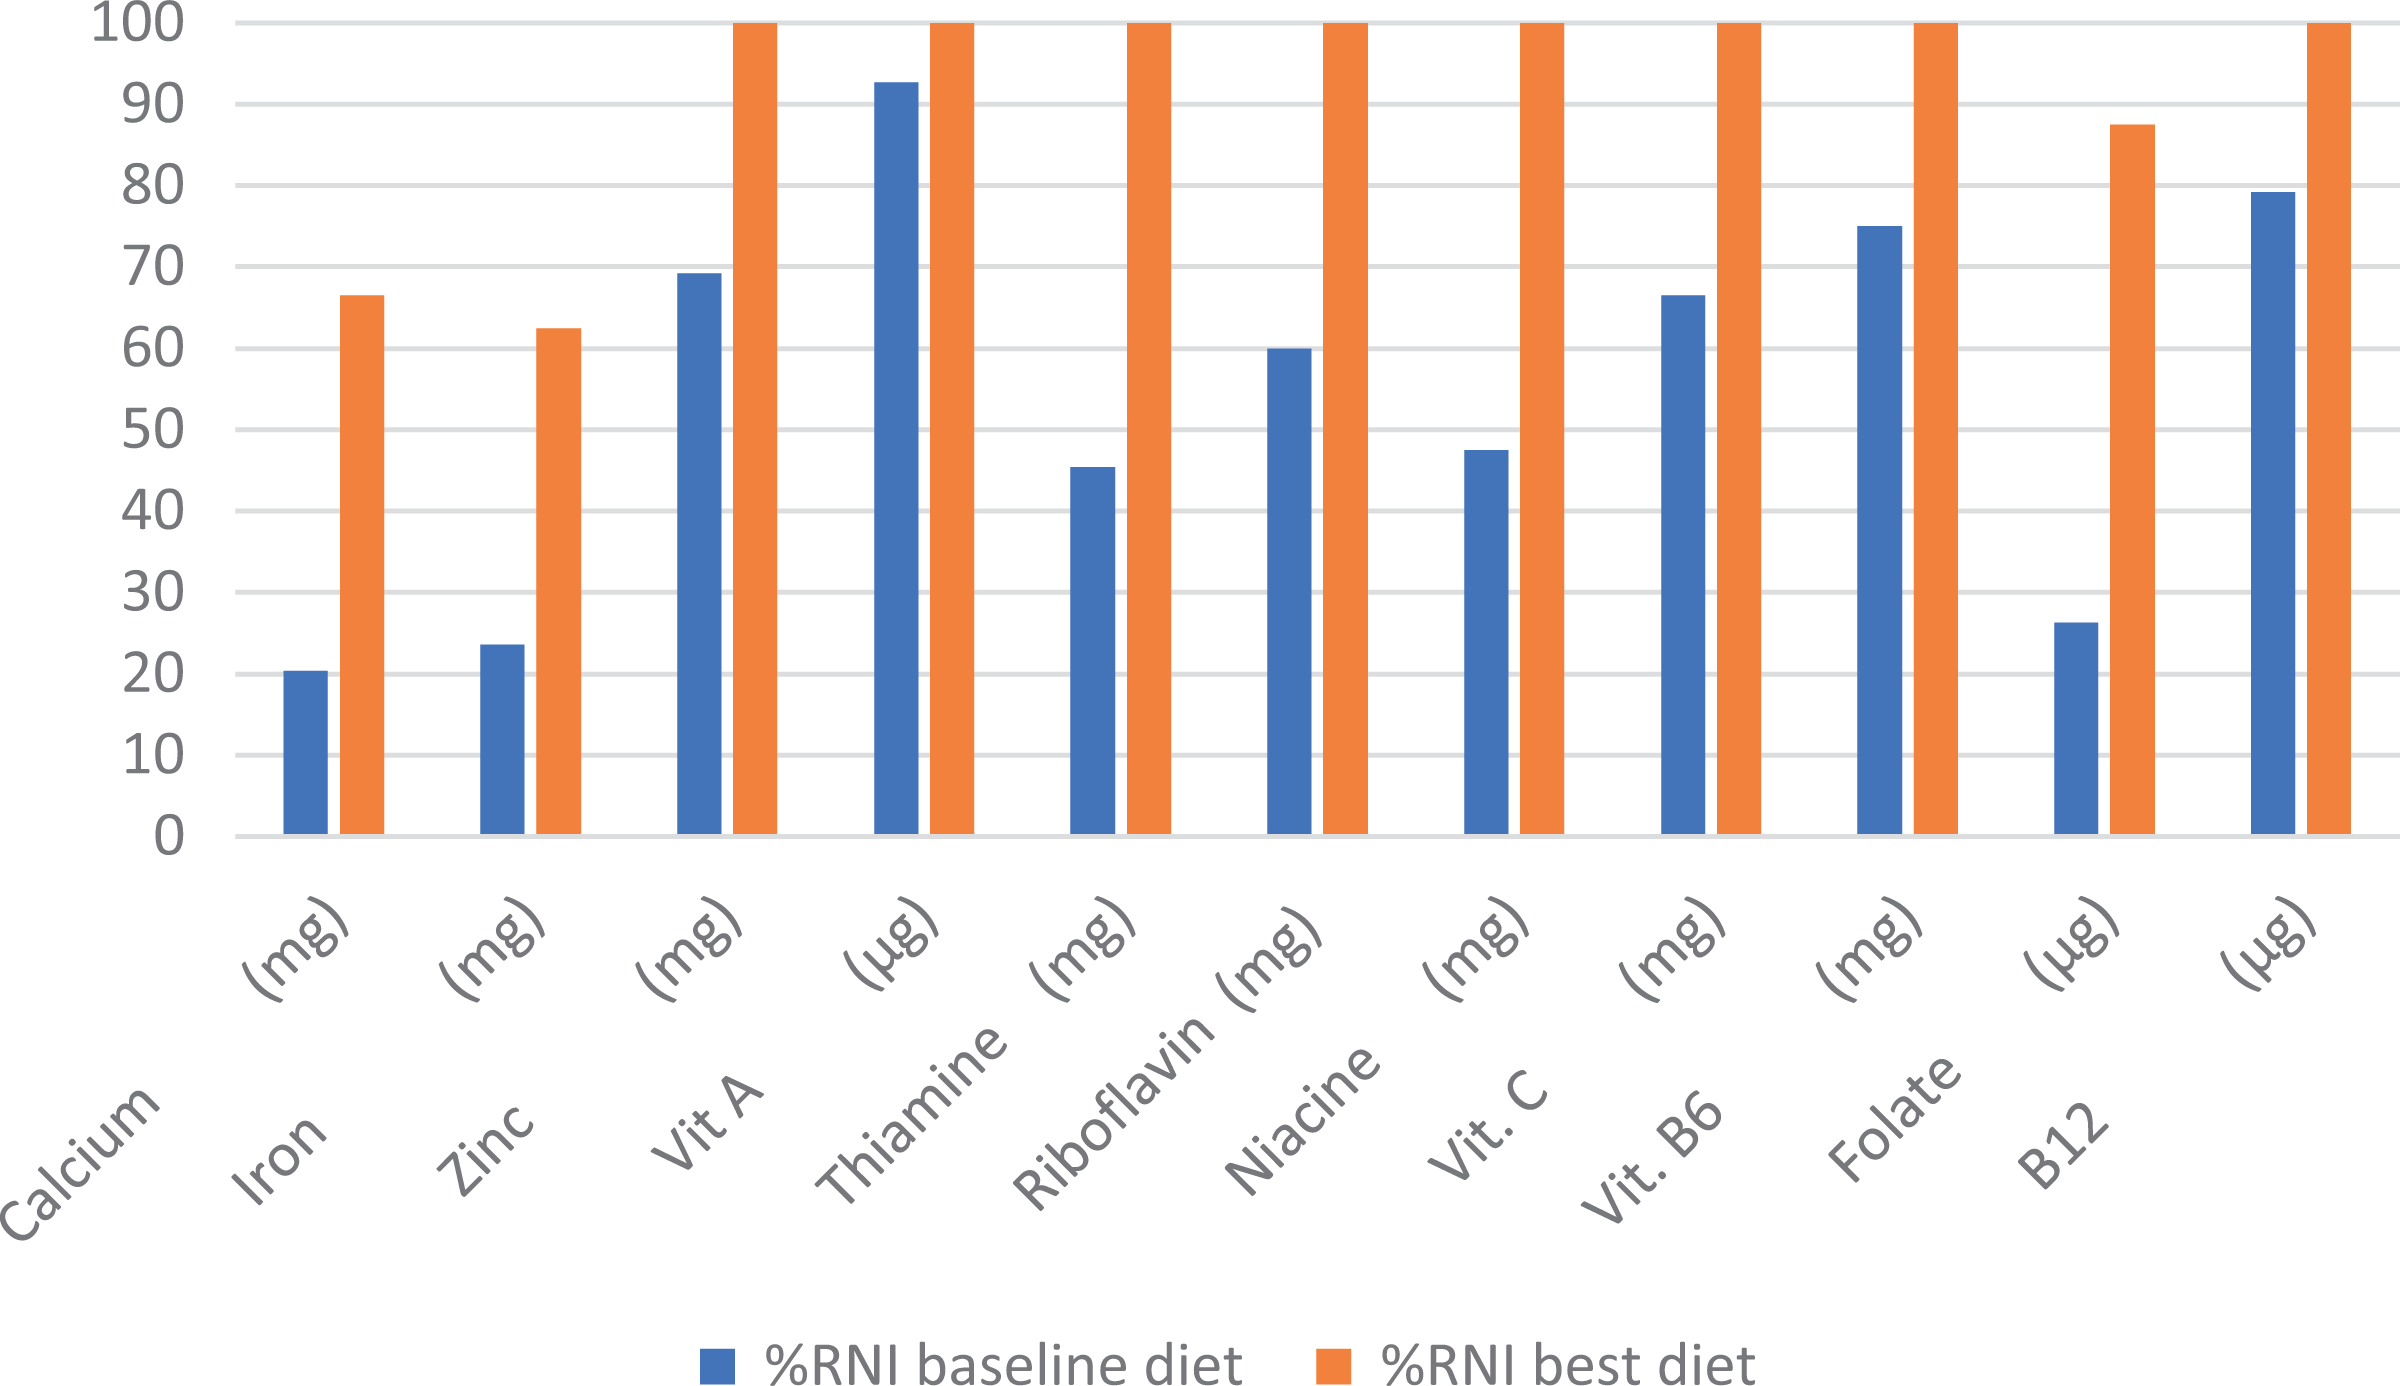
Percentage of recommended nutrient intakes (RNI) from diet of girls with anemia versus best diet from linear programming (LP) analysis.
Recommended Frequency and Portion Sizes of the Final Food-Based Recommendations Formulated for Indonesian Adolescent Schoolgirls Aged 15- to 18 Years Old From Rural Malang District.
Recommended messages of food-based recommendations
Consume 3 meals a day Consume 2 serving of vegetable a day including at least 5 servings/week of green leaf vegetable Consume at least 10 servings/week of meat, fish, eggs including at least 1 serving/week of liver Consume at least 7 servings/week of tempe, tofu or soybean products Consume at least 1 serving/day of fruit Consume at least 3 servings/week of milk
Recommended minimum portion size/serving (cooked weight)
1 serving of meat, fish, eggs = 45 g
1 serving of liver = 10 g
1 serving of vegetable = 80 g
1 serving of green leafy vegetable = 80 g
1 serving of soybean product = 40 g
1 serving of milk = 80 g
1 serving of fruit = 80 g
Discussion
We found in our study that despite similar food patterns, girls with anemia had more problem nutrients (iron, calcium, folate, and vitamin A) compared to their nonanemic counterparts (iron and calcium). Our results highlighted the advantage of using LP approach to identify problem nutrients in the diet that potentially account for anemia in these adolescent girls. The optimized FBR which included the nutrient-dense foods and food subgroups can improve intake of these problem nutrients in these girls (both anemic and nonanemic) although could not fully solve all problem nutrients in the diet.
Our study showed that the diets among girls with anemia were limited and could not meet the requirements in the optimal diet with the locally available foods compatible with their habitual consumption. Despite more problem nutrients in the anemic group, the costs of the 2 best diets were comparable to those of the nonanemic group. In fact, the cost of the best-diet no-FP in the anemic group was higher than best-diet no-FP in nonanemic respondents. Diets among nonanemic girls were found to be more flexible and in the optimal diets came closer to the requirement (RNI). Therefore, the dietary data from the anemic and nonanemic groups were combined in order to optimize the diet from anemic group, since anemic group’s diet alone would not be sufficient to reach or come closer to the RNI. The final set of FBRs will be relevant for all the adolescent schoolgirls in the study settings. The FBRs would be sufficient to prevent nonanemic girls from getting anemia and improve the nutritional status among girls having anemia, with the exception of the absolute problem nutrients (iron and calcium) that remained below EAR (65% RNI) in their worst scenario of the final FBR, suggesting the need for either expanding the market basket of these adolescent girls (eg, introducing other iron-rich foods) or implementing a complementary approach (eg, iron and calcium supplementation or fortification).
Using both groups combined, LP analysis found that in the recommended FBR, iron, calcium, and folate were problem nutrients. A study conducted in Cambodia found that calcium, vitamin B2, folate, vitamin A, and iron were problem nutrients among adolescent girls aged 15 to 18 years. 19 Our result was also consistent with a study in Myanmar which found that adolescent schoolgirls with anemia had inadequate intake of folate. 20 In our study, 3 times per week of milk was recommended, which is compatible with their usual weekly milk intake. Physiologically, calcium requirements increase significantly during adolescence because of bone mineralization during this period. 21 Commercial milk was found to be one of food the sources rich in calcium in adolescent schoolgirls’ diet. Therefore, it is important to fill the nutrient gap of calcium with milk in the set of FBRs.
Soy source protein foods in the diet such as tempeh and tofu were also recommended, as they were good sources of protein with low cost. 22,23 However, considering that iron bioavailability is better when consumed with animal source foods, the proportion of animal to plant protein which is still comparable in the optimized FBR (each 10 servings/week) ideally can still be improved to improve iron bioavailability. Trials of Improved Practices (TIPs) were done to test feasibility of this FBR, and all messages were confirmed to be acceptable by the adolescent girls. During TIPs, it was discovered that it is also feasible to increase animal source foods up to 14 servings/week.
Using an LP approach the FBR could optimize intake of the 3 problem nutrients (iron, folate, and calcium) from about 24% to 26% RNI in the nonoptimized diet to 60% to 88% RNI in the optimized diet or about 3-fold increase. However, intake of some nutrients was still inadequate, namely, calcium, iron, and folate (their worst-case scenarios were 44.8%, 44.9%, and 53.1%, respectively). In order to get adequate intake, these nutrients need to meet at least 65% of RNI in the worst-case scenario. Therefore, for iron, 65% to 45% is equivalent to a gap of 20% RNI daily, which is equivalent to an extra 6.2 mg iron per day or 43.4 mg per week. Similarly, the gap for folate is 65%–53% = 12% RNI, which equals to 48 mg/d or 336 mg per week. This shows that it is generally justified to add a mixture of weekly iron and folate supplement for adolescents in order to get enough iron and folate in order to prevent girls from developing anemia. The suggested weekly dosage of 60 mg iron and 400 µg folate currently promoted in some areas in Indonesia is close to the gaps in iron and folate identified in our study (43 mg iron and 336 µg folate weekly) and therefore can be used to fill this gap. But a more tailored dosage according to this nutrient gap is more recommended. This also highlights the benefit of using LP in order to accurately identify the limiting nutrients in the diet in terms of types of nutrients and the gap to adequacy. 24
All the recommended FBRs in our study were close to their average food group constraint levels (median servings/week) except fruit and milk consumption. We recommended consuming fruit at least 7 servings per week, while based on their habitual diet, the average constraint of fruit consumption is only 2 servings per week and their highest constraint were 9. The high limit constraint for milk was 4 servings per week and recommended 3 servings per week. Nevertheless, all the FBRs fall within the observed range of their dietary practices (min–max servings/week), and therefore adoption of this set of FBRs would not require the adolescent schoolgirls to shift away from their usual food consumption patterns. TIPs were done to test feasibility of this FBR, and all messages were confirmed to be acceptable by the adolescent girls.
Another strength of this study lies in its use of mathematical optimization to objectively formulate the set of FBRs that take the population’s dietary patterns and the actual amount consumed into account. The adequate sample size was another major strength in this study. We managed to have an adequate sample size to capture the different amount of iron intake. Also, the collected food items were representative of the population of anemic and nonanemic groups.
The strength of this study is that LP was used in groups with different anemia status, so the findings on problem nutrients can be associated with anemia status. To our knowledge, no previous study has been done using LP to assess difference in problem nutrients between individuals with anemia and nonanemic individuals. Our findings also highlight the sensitivity of the LP approach in identifying potential problems in the diet that cannot be easily identified using comparison of usual nutrient intakes.
The findings, however, require consideration of the study’s limitations. Primarily, a challenge for the FBR is the effect of seasonality of food availability, production, and affordability. We only assessed 1-week dietary intake which did not take seasonality into consideration. Therefore, it might be argued that this recommended set of FBRs would be applicable only during the time which is similar to the data collection period. However, the nutrient-dense foods that were promoted in the FBR such as liver, soy bean products, milk, and vegetables were found to be readily available all year round in the local market. We considered 10% assumption for iron bioavailability as most suitable, given the food pattern of the adolescent girls in this study, which gives RNI of 31 mg/d (compared to 25.8 mg/d and 20.7 mg/d when assuming 12% and 15% bioavailability, respectively). It is possible that this assumption may have underestimated the RNI fulfillment from the best diets.
In conclusion, the LP approach used in this study identified more problem nutrients in girls with anemia than nonanemic girls. Optimized FBR can increase intake of the problem nutrients, particularly iron and folate, but some gap remained, which suggests that promotion of the optimized FBR is best accompanied by provision of iron–folate supplement, ideally in dosage that is compatible with the identified gap. Further intervention study is needed to assess the effectiveness of nutrition education of this optimized FBR through existing delivery channels in a school setting.
Footnotes
Authors’ Note
The authors’ responsibilities were as follows: UF, FW, and SO planned the study. SO, UF, AM, and SI conducted the study. SO and UF performed LP analyses. AM, SI, and FW provided inputs to results of LP analysis. SO and UF drafted the manuscript. All authors contributed in writing up the manuscript. None of the authors had any conflicts of interest.
Acknowledgments
The authors thank the local authority in Malang district (District Education Office, District Health Office) for their support. The authors are grateful for headmasters, teachers, parents, and study participants for their support.
Declaration of Conflicting Interests
The author(s) declare there is no conflict of interest with respect to the research, authorship, and publication of this article.
Funding
The author(s) disclosed receipt of the following financial support for the research, authorship, and/or publication of this article: The authors disclosed receipt for DAAD for financially supporting the study. This publication was funded by Directorate of Research and Community Engagement of Universitas Indonesia (Number: 5282/UN2.R3.1/HKP05.00/2018)