
Abstract
Background:
Women’s Dietary Diversity Score (WDDS) is an indicator of dietary diversity, a key component of diet quality in women of reproductive age (WRA). Limited information is available regarding its applicability in other population groups.
Objective:
To examine the ability of the Minimum Dietary Diversity for Women (MDD-W) of 5-food groups cutoff to predict micronutrient adequacy in men and women 15 to 65 years old from 8 Latin American countries.
Methods:
We used a 24-hour recall from 9216 participants in the Latin American Study on Nutrition and Health (ELANS) to determine Dietary Diversity Score (DDS) based on the consumption of 10 food groups. The Mean Probability of Adequacy (MPA) was associated with DDS for the overall sample, for men, WRA, and women of nonreproductive age (WNRA). Sensitivity and specificity analyses were performed to determine if the 5-food groups cutoff point for MDD can be used to correctly identify men, WRA, and WNRA with adequate micronutrient adequacy (MPA ≥ 0.70).
Results:
We found a mean DDS of 4.78 ± 1.33 and an MPA of 0.64 ± 0.16, with 59% of participants showing a diverse diet (DDS ≥ 5). The 5-food groups-cutoff point showed a better balance between sensitivity and specificity predicting an MPA ≥0.70 in men, WRA, and WNRA. MPA was significantly associated with DDS in WRA and for men and WNRA, as well.
Conclusion:
The 5-food group MDD, originally intended to be used in WRA, performed equally well in predicting MPA ≥0.70 in men, WRA, and WNRA, and can be used as a proxy of micronutrient adequacy in Latin American population.
Plain language title
Assessment of the FAO Minimum Dietary Diversity Index to Estimate Micronutrients Intake in Urban Cities of 8 Latin America Countries
Plain language summary
The Women’s Dietary Diversity Score (WDDS) proposed by the Food and Agriculture Organization is an indicator that measures the variety of foods consumed by women of reproductive age (WRA), and it has been reported in several studies that the more diverse the diet, the greater the probability of meeting micronutrients requirements. This indicator has not been validated in other population, but few studies have been conducted in the Latin American region. So, we aimed to investigate whether the Minimum Dietary Diversity for Women (MDD-W) established for WRA could also predict sufficient micronutrient intake in men and women aged 15 to 65 years in the Latin American population. To accomplish this objective, we used data from the Latin American Study of Nutrition and Health (Estudio Latino Americano de Nutrición y Salud—ELANS) that collected dietary data from 24-h recalls from 9216 participants and analyzed the association between DDS and the Mean Probability of Adequacy (MPA). Additionally, we determined if the MDD cutoff point could correctly identify individuals with appropriate vitamin and mineral intake. We found that the overall mean DDS was 4.78 ± 1.33, the MPA was 0.64 ± 0.16, and approximately 59% of participants had a diverse diet. The MDD of 5-food groups cutoff point was demonstrated to be useful in predicting sufficient micronutrient intake for men, WRA, and women over 50 years. Respondents with a DDS ≥5 had higher micronutrient adequacy. These findings suggest that DDS can serve as a proxy for assessing micronutrient adequacy in urban populations beyond WRA. The effect of promoting diverse diets on micronutrient adequacy as part of intervention programs can be captured by the DDS in urban Latin American populations.
Keywords
Introduction
It is crucial to assess the consumption of healthy diets at a national level worldwide, in order to keep track of the progress toward nutrition-related Sustainable Development Goals (SDGs), SDG 2 (United Nations General Assembly, 2015). 1 In general terms, a healthy diet ensures an adequate intake of essential nutrients and energy and physiologic needs for optimal health. 2 Dietary recommendations advocate for enhancing dietary diversity and reducing the consumption of certain specific food groups such as energy-dense foods, processed meats, saturated fats, refined carbohydrates, sweetened beverages, and foods high in salt, that have been linked to a higher risk of noncommunicable diseases. 2 -4
Several indicators have been developed to measure diet quality (DQ) based on current nutrition knowledge, including the assessment of diet variety, nutrients, or foods to consume in moderation and the overall balance of macronutrients. 5 The Healthy Eating Index, the Diet Quality Index, the Healthy Diet Indicator, and the Mediterranean Diet Score are commonly utilized tools for assessing DQ. However, these methods rely on quantitative data collection such as 24-hour recall, dietary records or food frequency questionnaires, dietary assessment tools that are expensive and require the involvement of trained interviewers and surveyors, as well as a significant time investment in data collection and analysis. 6,7
Dietary diversity has been widely recognized as a fundamental component of DQ, based on the principle that no individual food can supply all the essential nutrients required for optimal health. 8 Different dietary diversity indicators have been developed and used as proxies of micronutrient adequacy 9 -12 and household food security. 13 -15 Some common dietary diversity indicators include Dietary Diversity Score (DDS), 16 Food Variety Score, 16 Household Dietary Diversity Score, 17 and Minimum Dietary Diversity Score for Women (MDD-W), 4 all of them are based on the simple count of foods consumed in a specific time frame.
The MDD-W is a dichotomous indicator based on a cutoff of ≥5 out of 10 defined food groups that state that women of reproductive age (WRA) who include food from 5 or more groups are more likely to consume animal sources, pulses, nuts, or seeds, and fruits and vegetables, and are prone to a greater probability of micronutrient adequacy than those who consume from 4 groups or less. 4,6,18,19 This MDD-W has demonstrated a significant correlation with micronutrient adequacy, 9 -12 and can also be used for tracking changes across time or as a result of nutritional intervention, or comparison of dietary diversity between women from different sociodemographic settings. 7
Even though the MDD-W was validated and intended to be used as a proxy of micronutrient adequacy specifically in WRA’s diet, it has been used in other populations groups such as children, 11,20,21 adolescents, 9,22,23 adults including men, 24,25 and elderly. 26
Despite the importance to assess dietary diversity in the overall population, the relation between MDD-W and adequate micronutrient intake has not yet been validated in different sex and age groups. This study aimed to determine if the 5-food groups cutoff proposed by the Food and Agriculture Organization of the United Nations (FAO) can be used in urban Latin American men, WRA, and women of nonreproductive age (WNRA) to identify adequate micronutrient intake.
Methods
Study Population
The Latin American Study on Nutrition and Health/Estudio Latinoamericano de Nutrición y Salud (ELANS) is a large-scale, epidemiology, multicountry, multicentric, cross-sectional design and household-based study. The ELANS was conducted in 8 Latin American countries (LAC; Argentina, Brazil, Chile, Colombia, Costa Rica, Ecuador, Peru, and Venezuela) from November 2014 to December 2015, which aims to assess nutritional status, physical activity, and dietary intake of Latin American urban population. The study included a representative sample of the urban population of 9216 adults aged 15-65 years old. More details can be reviewed in Fisberg et al. 27
All participants signed a written informed consent/assent. Participants’ confidentiality for the pooled data was maintained using numeric identification codes rather than names. All data transfer was done with a secure file-sharing system. Western Institutional Review Board (#20140605) and ethics review boards of participating institutions approved this study, and it was registered at ClinicalTrials.gov (#NCT02226627).
Dietary Assessment
All the participants were visited on 2 different occasions. In each visit, interviewers previously trained conducted a face to face 24 hours dietary recall following the multiple-pass method to determine food and beverages’ daily consumption. Local and traditional foods reported were harmonized with a USDA composition table, considering the nutritional equivalency, 28 and mandatory food fortification was considered according to each country’s legislation. Professional nutritionists in each country followed a standardized procedure for matching local foods to US Department of Agriculture foods. 28 Consumption data were analyzed using the Nutrition Data System for Research version 2014 (NDS-R). 29
To determine the DDS all food items reported to be consumed during the first 24-hour recall were classified into 10 food groups based on Women Dietary Diversity Project (WDDP) food groups classification: (1) grains, white roots, tubers, and plantains, (2) pulses (beans, peas, and lentils), (3) nuts and seeds, (4) milk and milk products, (5) meat, poultry, and fish, (6) eggs, (7) dark green leafy vegetables, (8) other vitamin A-rich fruits and vegetables, (9) other vegetables, and (10) other fruits. 4 One point was assigned for the consumption of at least 15 grams of each group, or 0 points if consumption was less than 15 grams. Higher scores indicate higher diversity, as more food groups were eaten. 4
Data Analyses
Micronutrient probability of adequacy
The Probability of Adequacy (PA) of 11 micronutrients (thiamin, riboflavin, niacin, vitamin B6, folate, vitamin B12, vitamins A, vitamin C, calcium, iron, and zinc) for each participant was estimated according to the approach developed by the Institute of Medicine (IoM, 2003). 30 To consider these variabilities, which were given by the coefficient of variation (CV), as recommended by the Food and Nutrition Board of the Institute of Medicine (IoM/DRI), a CV of 10% for all nutrients was assumed, except niacin, whose CV was established as 15% for analytical purposes. Therefore, this method considers the variability of the ingestion to calculate a z-score, which corresponded to an estimated probability of adequacy, according to the normal distribution. The z-score was estimated by the following equation:
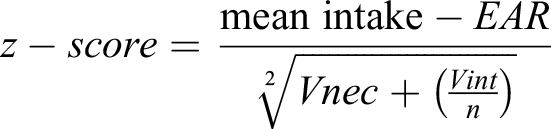
In which: mean intake equal dietary intake, assessed by two 24-hour dietary recalls, EAR: Estimated Average Requirement (IoM, 2000), Vnec: variability of the individuals’ necessities, Vint: interpersonal variance, obtained from North American population studies (IoM, 2000), and n: number of days in which the individual’s ingestion was assessed. The Mean Probability of Adequacy (MPA) was calculated as the sum of all PAs divided by the number of nutrients assessed (n = 11).
Minimum Dietary Diversity (MDD) cutoff determination
As an indicator of micronutrient adequacy, MDD cutoff points were assessed according to the FAO methodology 7 for the ELANS overall sample and each sex/age-group: men, WRA (15-49 years), and WNRA (≥50 years). The steps followed were (1) generate receiver-operating characteristics curves to determine the cutoff point, (2) determine the correct classification rate of the determined cutoff point, (3) verify that at least one of the values of specificity or sensitivity for the MPA and MDD cutoff points selected were higher than 0.50, and (4) verify that at least 10 participants reached the selected MPA threshold, to give robustness to the analysis. 7 Furthermore, during the selection of the MDD cutoff points, the Youden J-Index value for each ROC curve was also evaluated, as a common summary measure of a ROC curve. 31 The chosen MDD cutoff points demonstrated values of this index closer to 1. A Youden J-Index value closer to 1 indicates an enhanced balance between sensitivity and specificity in a diagnostic test, 32 implying a better discriminatory capacity of the MDD cutoff point for assessing nutritional adequacy within a given sample.
Statistical analyses
Data were reported as means ± standard deviations (SD) for continuous variables and frequencies (%) for categorical variables. The overall sample was analyzed according to sex/age groups as follows: men, WRA (15-49 years), and WNRA (≥50 years). The normal distribution of continuous variables was assessed with the Shapiro-Wilk test. Among-group comparisons (sex/age groups within a country or countries) in DDS and MPA were tested using ANOVA or Kruskal-Wallis tests (according to variable distribution) with a post hoc test when required. The continuity-corrected Wald test was used to compare the proportion of participants between categories of diet diversity (diverse vs nondiverse diets) for the overall sample, while the Chi-square test (χ2) with Bonferroni post hoc test was used to compare these proportions among sex/age groups. Pearson’s correlation coefficients (r) were also computed among PA for micronutrients and DDS. Data were analyzed using STATA software (version 14.1, 2015, College Station, TX, USA), 31 and IBM SPSS® (version 27, IBM Corp.). 32 All tests were two-tailed, and P values <.05 were considered statistically significant.
Results
Sample Characteristics
The mean age of the overall sample (n = 9216) was 35.8 ± 14 years (range 15-65 years). Men represented 47.8% of the sample with an average age of 34.5 ± 13.9 years (range 15-65 years). Women were categorized into 2 groups: the WRA group (40.2%) had an average age of 31.1 ± 9.8 years (range 15-49 years), while the WNRA group (12%) had an average age of 56.8 ± 4.6 years (range 49-65 years).
MDD Cutoff Point for Men, WRA, and WNRA in Latin American Countries
After testing different MDD cutoff points for specificity and sensitivity versus different definitions of a nutritionally adequate diet (MPA ranging from 0.65-0.75; Figure 1), an MPA equal to 0.70 was used as the cutoff point to define nutritional adequacy.
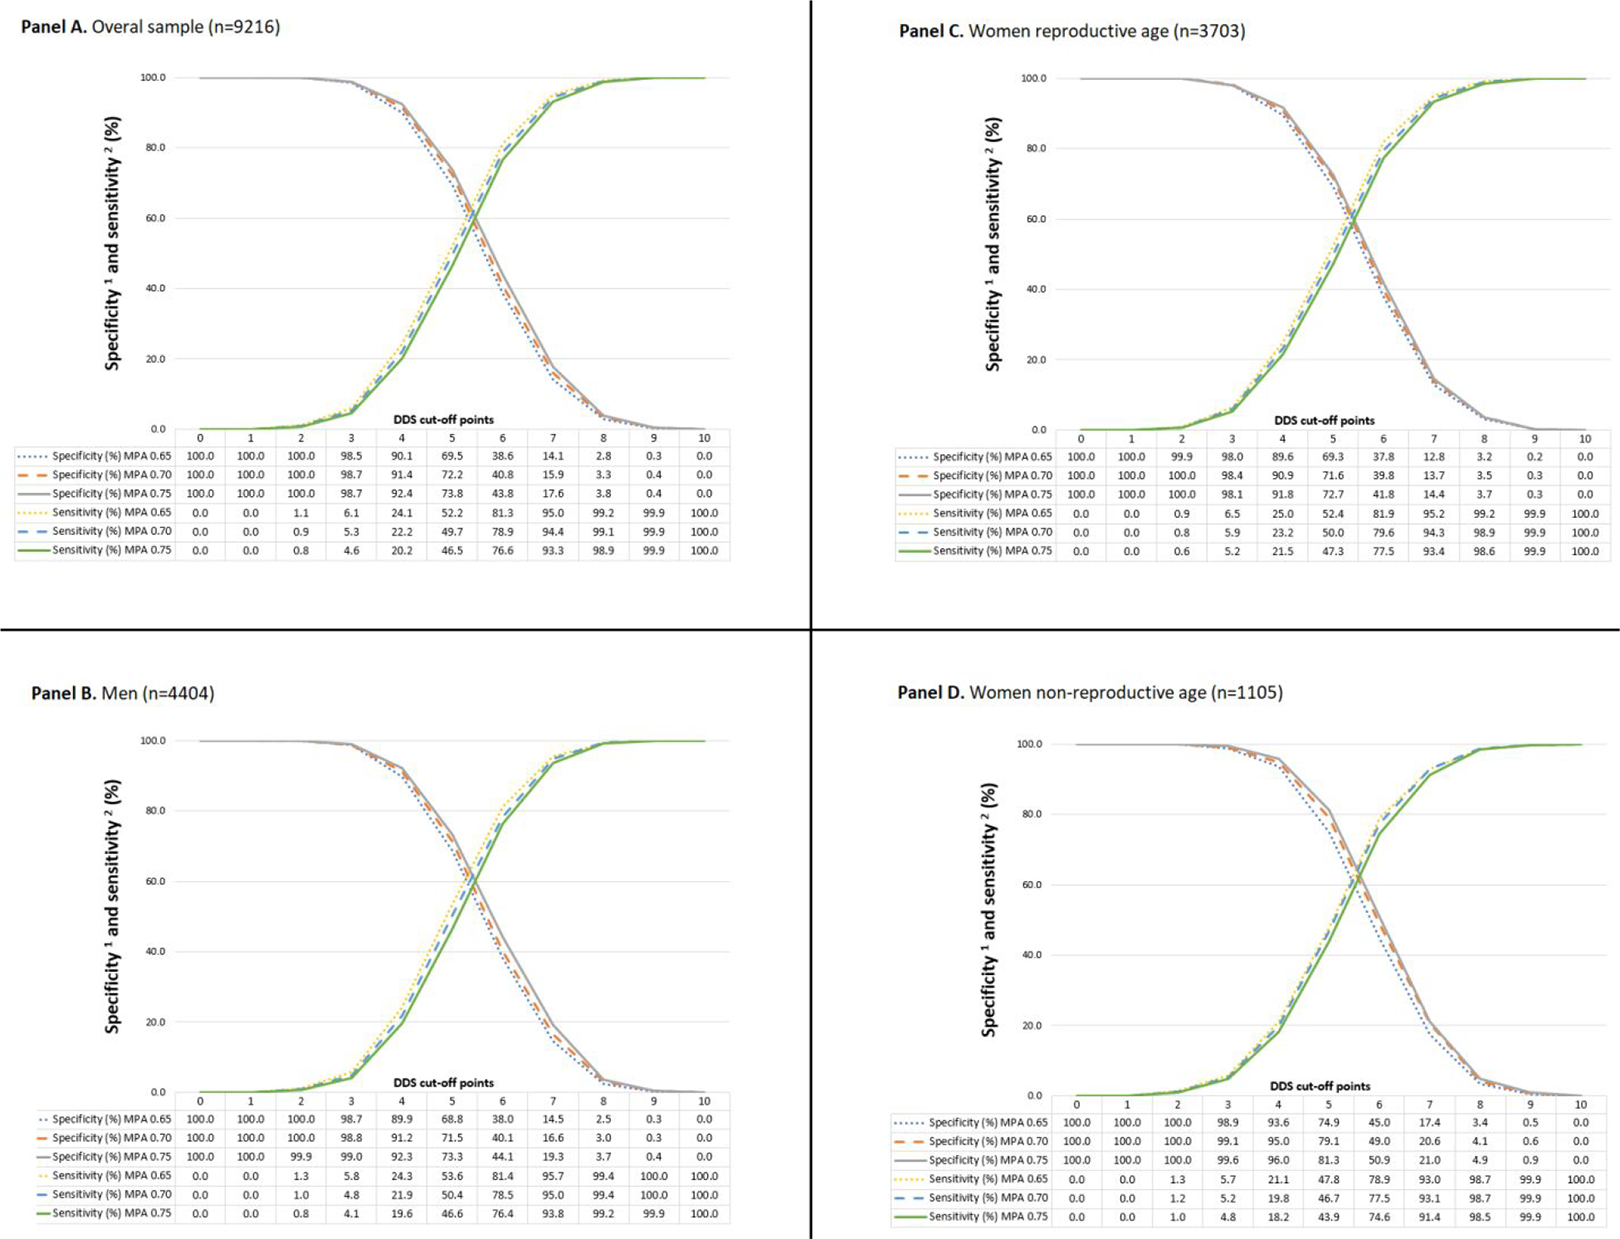
Specificity and sensitivity of different DDS cutoff points with MPA ranging from 0.65 to 0.75 for the ELANS overall sample (panel A), men (panel B), WRA (panel C), and WNRA (panel D). Note: Specificity identifies nutritionally appropriate diets as adequate. Sensitivity identifies nutritionally inappropriate diets as inadequate. DDS indicates Dietary Diversity Score; MPA, Mean Probability of Adequacy; WNRA, women of nonreproductive age.
For the ELANS overall sample, an MPA cutoff point equal to 0.70 and an MDDS cutoff point equal to 5 resulted in 72.2% specificity and 49.7% sensitivity (Figure 1: Panel A). If the MDD cutoff point was increased to 6, specificity would decrease to 40.8%, while sensitivity would increase to 78.9%. An MDD cutoff point of 5 is considered robust in the ELANS sample since the Youden J-index value (0.219) was the closest to 1, 33 compared to the values observed while analyzing other MDD cutoff points. Also, the MDD cutoff point of 5 offers a balance between the positive (0.73) and the negative (0.49) predictive value for the ELANS sample. Similar results to those determined for the ELANS overall sample were observed for men (Figure 1: Panel B), WRA (Figure 1: Panel C), and WNRA (Figure 1: Panel D).
On the other hand, the correct classification rates of the MDD cutoff point equal to 5 were higher than 58% for the overall sample and each sex/age-group (Table 1). This classification rate was similar to the 60% value recommended by FAO. 7
Correct Classification Rate of Nutritional Adequacy Determination (MPA ≥ 0.70) Using DDS ≥5 as the MDD Cutoff Point for the ELANS Sample and Each Sex/Age-Group.
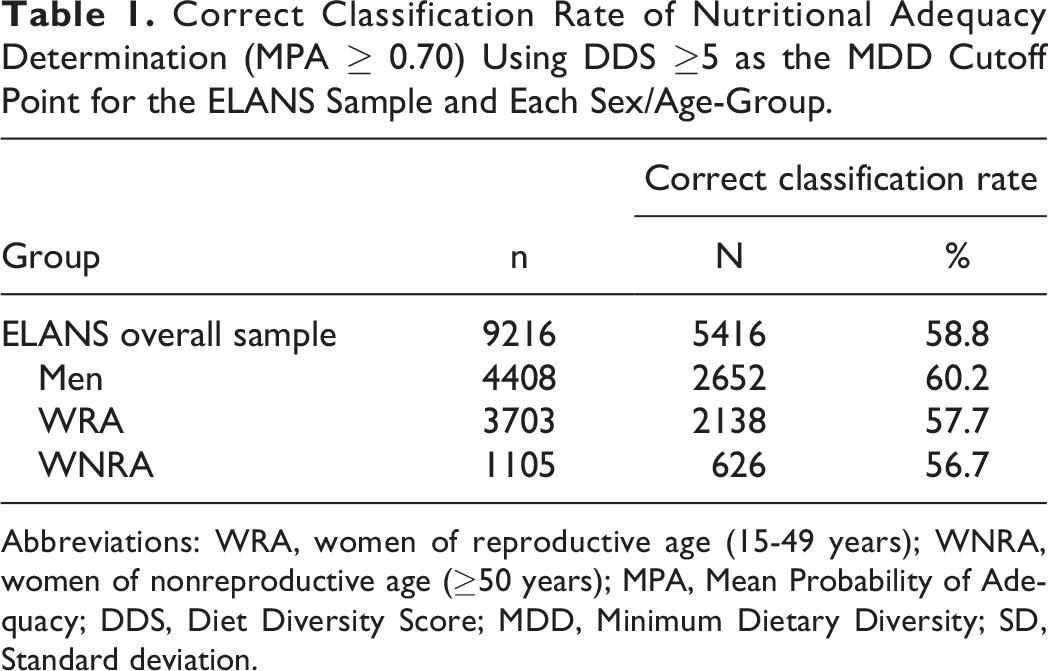
Abbreviations: WRA, women of reproductive age (15-49 years); WNRA, women of nonreproductive age (≥50 years); MPA, Mean Probability of Adequacy; DDS, Diet Diversity Score; MDD, Minimum Dietary Diversity; SD, Standard deviation.
The specificity for MPA ≥0.70 and DDS ≥5 was higher than 0.50 in the ELANS overall sample (0.722), men (0.715), WRA (0.716), and WNRA (0.791) (Figure 1), which agrees with the FAO criteria to define the MDD for Women (MDD-W) cutoff point for WRA during the WDDP. 7 Finally, 3704 participants in the ELANS overall sample (2040 men, 1325 WRA, and 339 WNRA) reached the MPA threshold (≥0.70), a considerably higher frequency than the one proposed by FAO (at least 10 participants). 7 Given the results, an MDD cutoff point equal to 5-food groups was confirmed as an adequate diet diversity and micronutrient adequacy predictor for the ELANS overall sample and for each subsample analyzed.
Consumption of Food Groups Among Men, WRA, and WNRA
Consumption of the food group used to estimate the DDS based on the first 24 h recall is shown in Table 2. For all 8 countries, the highest usual intake (g/day) was reported for the “grains, white roots and tubers, and plantains,” followed by “meats,” “milk and milk products”; whereas the lowest usual intake was for the “nuts and seeds” followed by “dark green leafy vegetables” groups. Consumption of all food groups varies highly among countries, especially for some groups such as “pulses,” whose consumption was 50 times higher in Costa Rica than in Argentina, while “other fruits” consumption was 3-fold higher in Peru than that in Venezuela (Supplemental Table 1).
Usual Intake (g/day) of Food Groups Used to Determine the Dietary Diversity Score (DDS) and Percentage of Participants Consuming at Least 15 g/d of These Food Groups According to Sex/Age-Group.
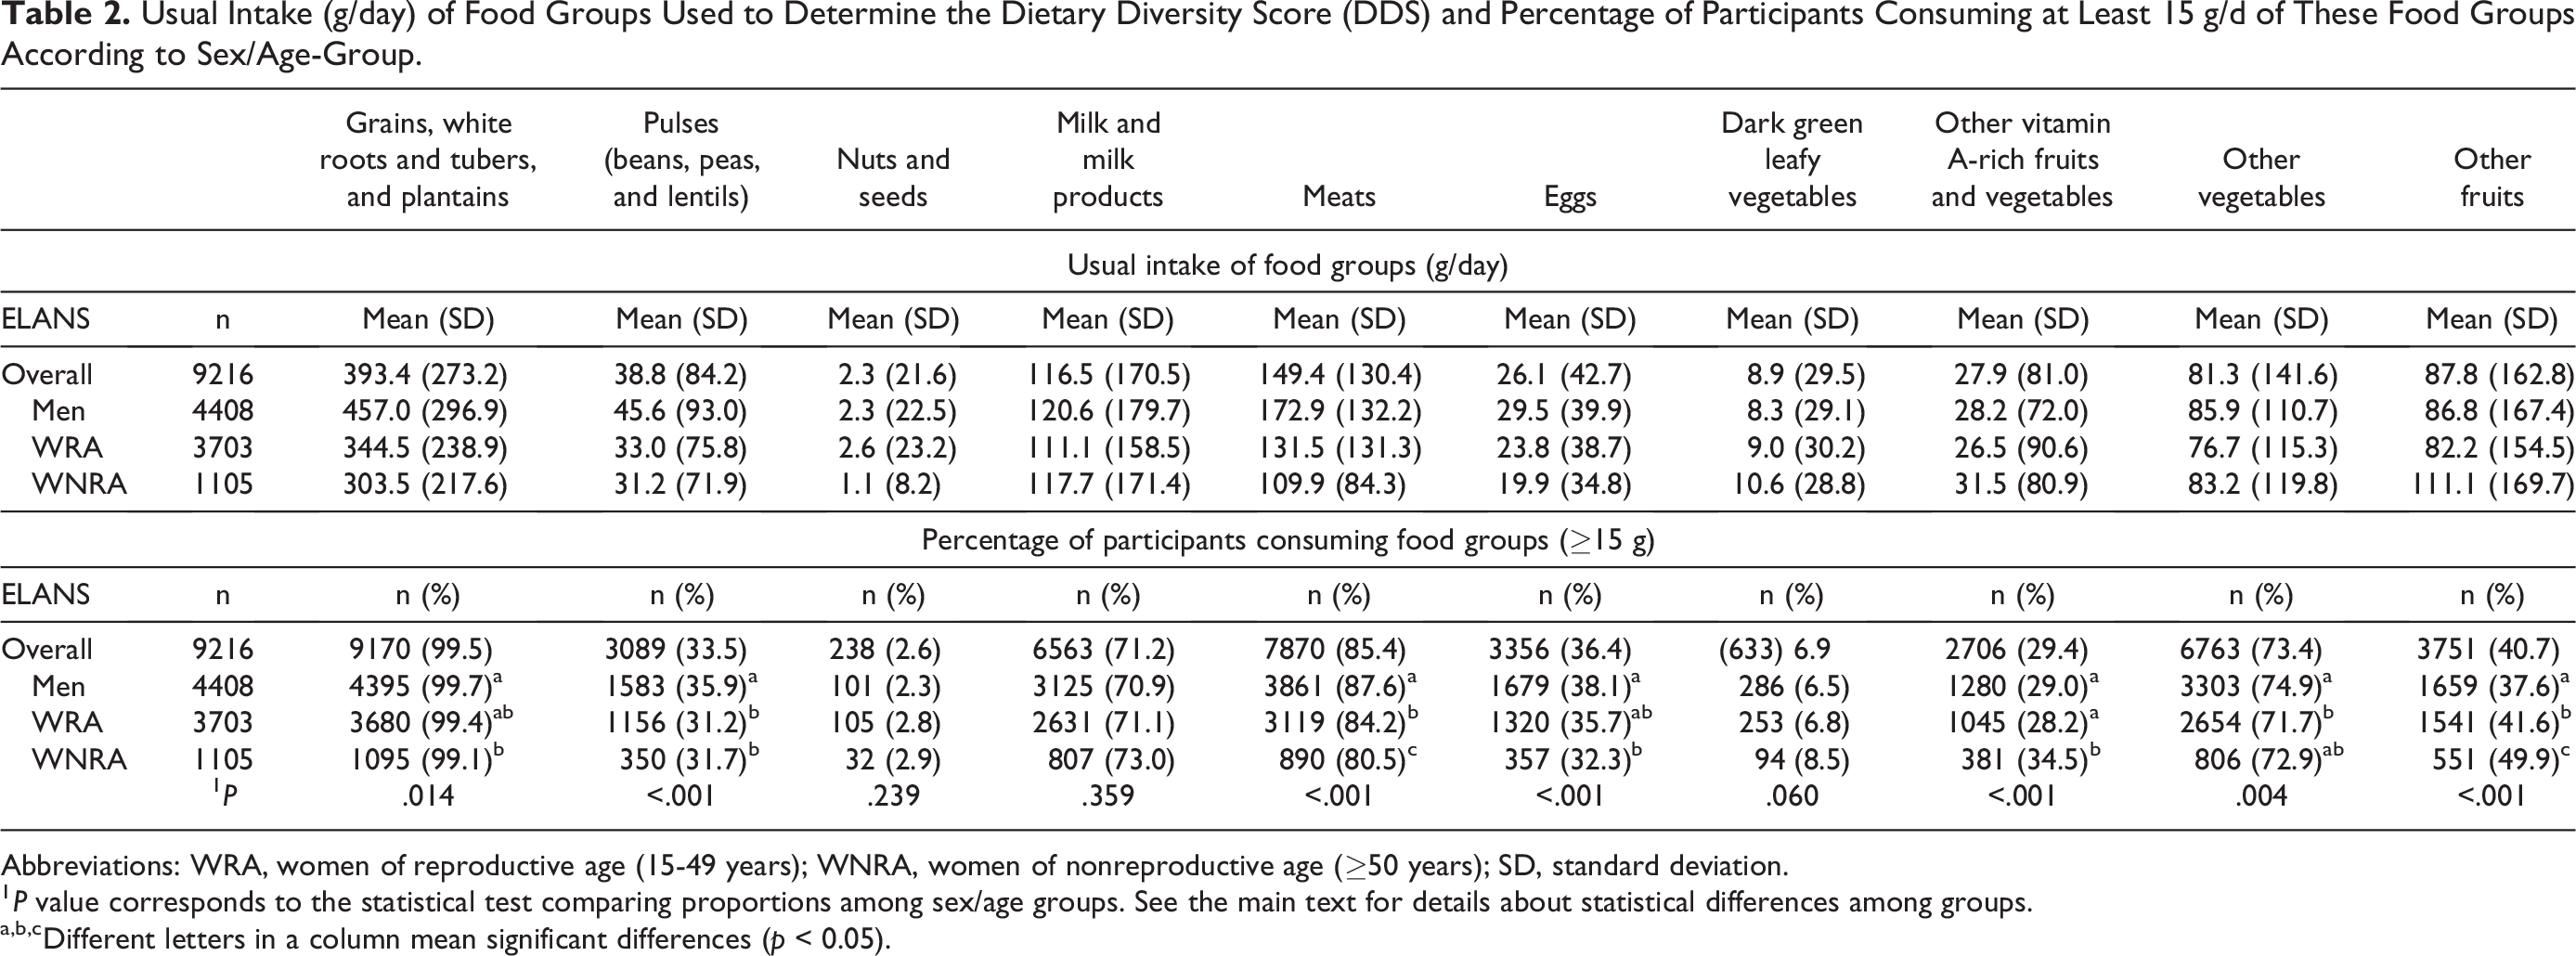
Abbreviations: WRA, women of reproductive age (15-49 years); WNRA, women of nonreproductive age (≥50 years); SD, standard deviation.
1 P value corresponds to the statistical test comparing proportions among sex/age groups. See the main text for details about statistical differences among groups.
a,b,cDifferent letters in a column mean significant differences (p < 0.05).
Based on the relative number of participants consuming the food groups, they were ranked in the following order: “grains, white roots and tubers, and plantains,” “meats,” “other vegetables,” and “milk and milk products,” which were consumed by the 99.5%, 85.4%, 73.4%, and 71.2% of the whole sample, respectively. Other groups were consumed by less than 50% of the sample, such as “other fruits” (40.7%), “eggs” (36,4%), “pulses” (33.5%), and “other vitamin A-rich fruits and vegetables” (29.4%), whereas the “dark green leafy vegetables” and “nuts and seeds” were consumed only by 6.9% and 2.6% of respondents, respectively.
When comparing the percentage of men, WRA, and WNRA that consumed the food groups, there were significant differences for all food groups except for “nuts and seeds,” “milk and milk products,” and “dark green leafy vegetables” (P < .05). Namely, WNRA and men exhibited the highest and lowest percentages of participants consuming “other fruits,” whereas the opposite pattern was observed for “meats” (P < .001). There were significantly more men consuming “pulses” compared with WRA and WNRA (P < .001), while there were significantly more WNRA consuming “other vitamin A-rich fruits and vegetables” (P < .001) than the other 2 groups. For “grains, white roots and tubers, and plantains” and “eggs” there were significantly more men consuming those groups than WNRA, with no differences for WRA (P < .05). Finally, significantly more men were consuming “other vegetables” compared to WRA, with no differences relative to WNRA (P = .004).
Comparisons of DDS and MPA Scores Among Men, WRA, and WNRA
The mean DDS for the whole sample was 4.78 ± 1.33 points, which differed significantly (t (9215) = −15.16, P = .0001) from the cutoff criterion of 5 (DDS values ranged from 0 to 10 points), with significant differences in the DDS among countries. Participants from Ecuador and Peru showed the highest MDDS differing from all other countries (P < .001). In contrast, Argentina (4.48 ± 1.33 points) and Venezuela (4.38 ± 1.14) showed the lowest scores, with both countries differing from all other countries, except between them (P < .001).
As shown in Table 3, the DDS for the overall ELANS sample differed among sex/age groups, with men and WNRA showing the highest scores and WRA the lowest (P < .001). Argentina and Brazil followed the same trend, but significant differences were only detected between the highest (WNRA) and lowest (WRA) scores (P < .05). In Ecuador, men exhibited the highest scores than those observed for the 2 women groups (P = .002).
Dietary Diversity Score (DDS), Mean Probability of Adequacy (MPA), and Correlation Between DDS and MPA According to Country and Sex/Age-Group.
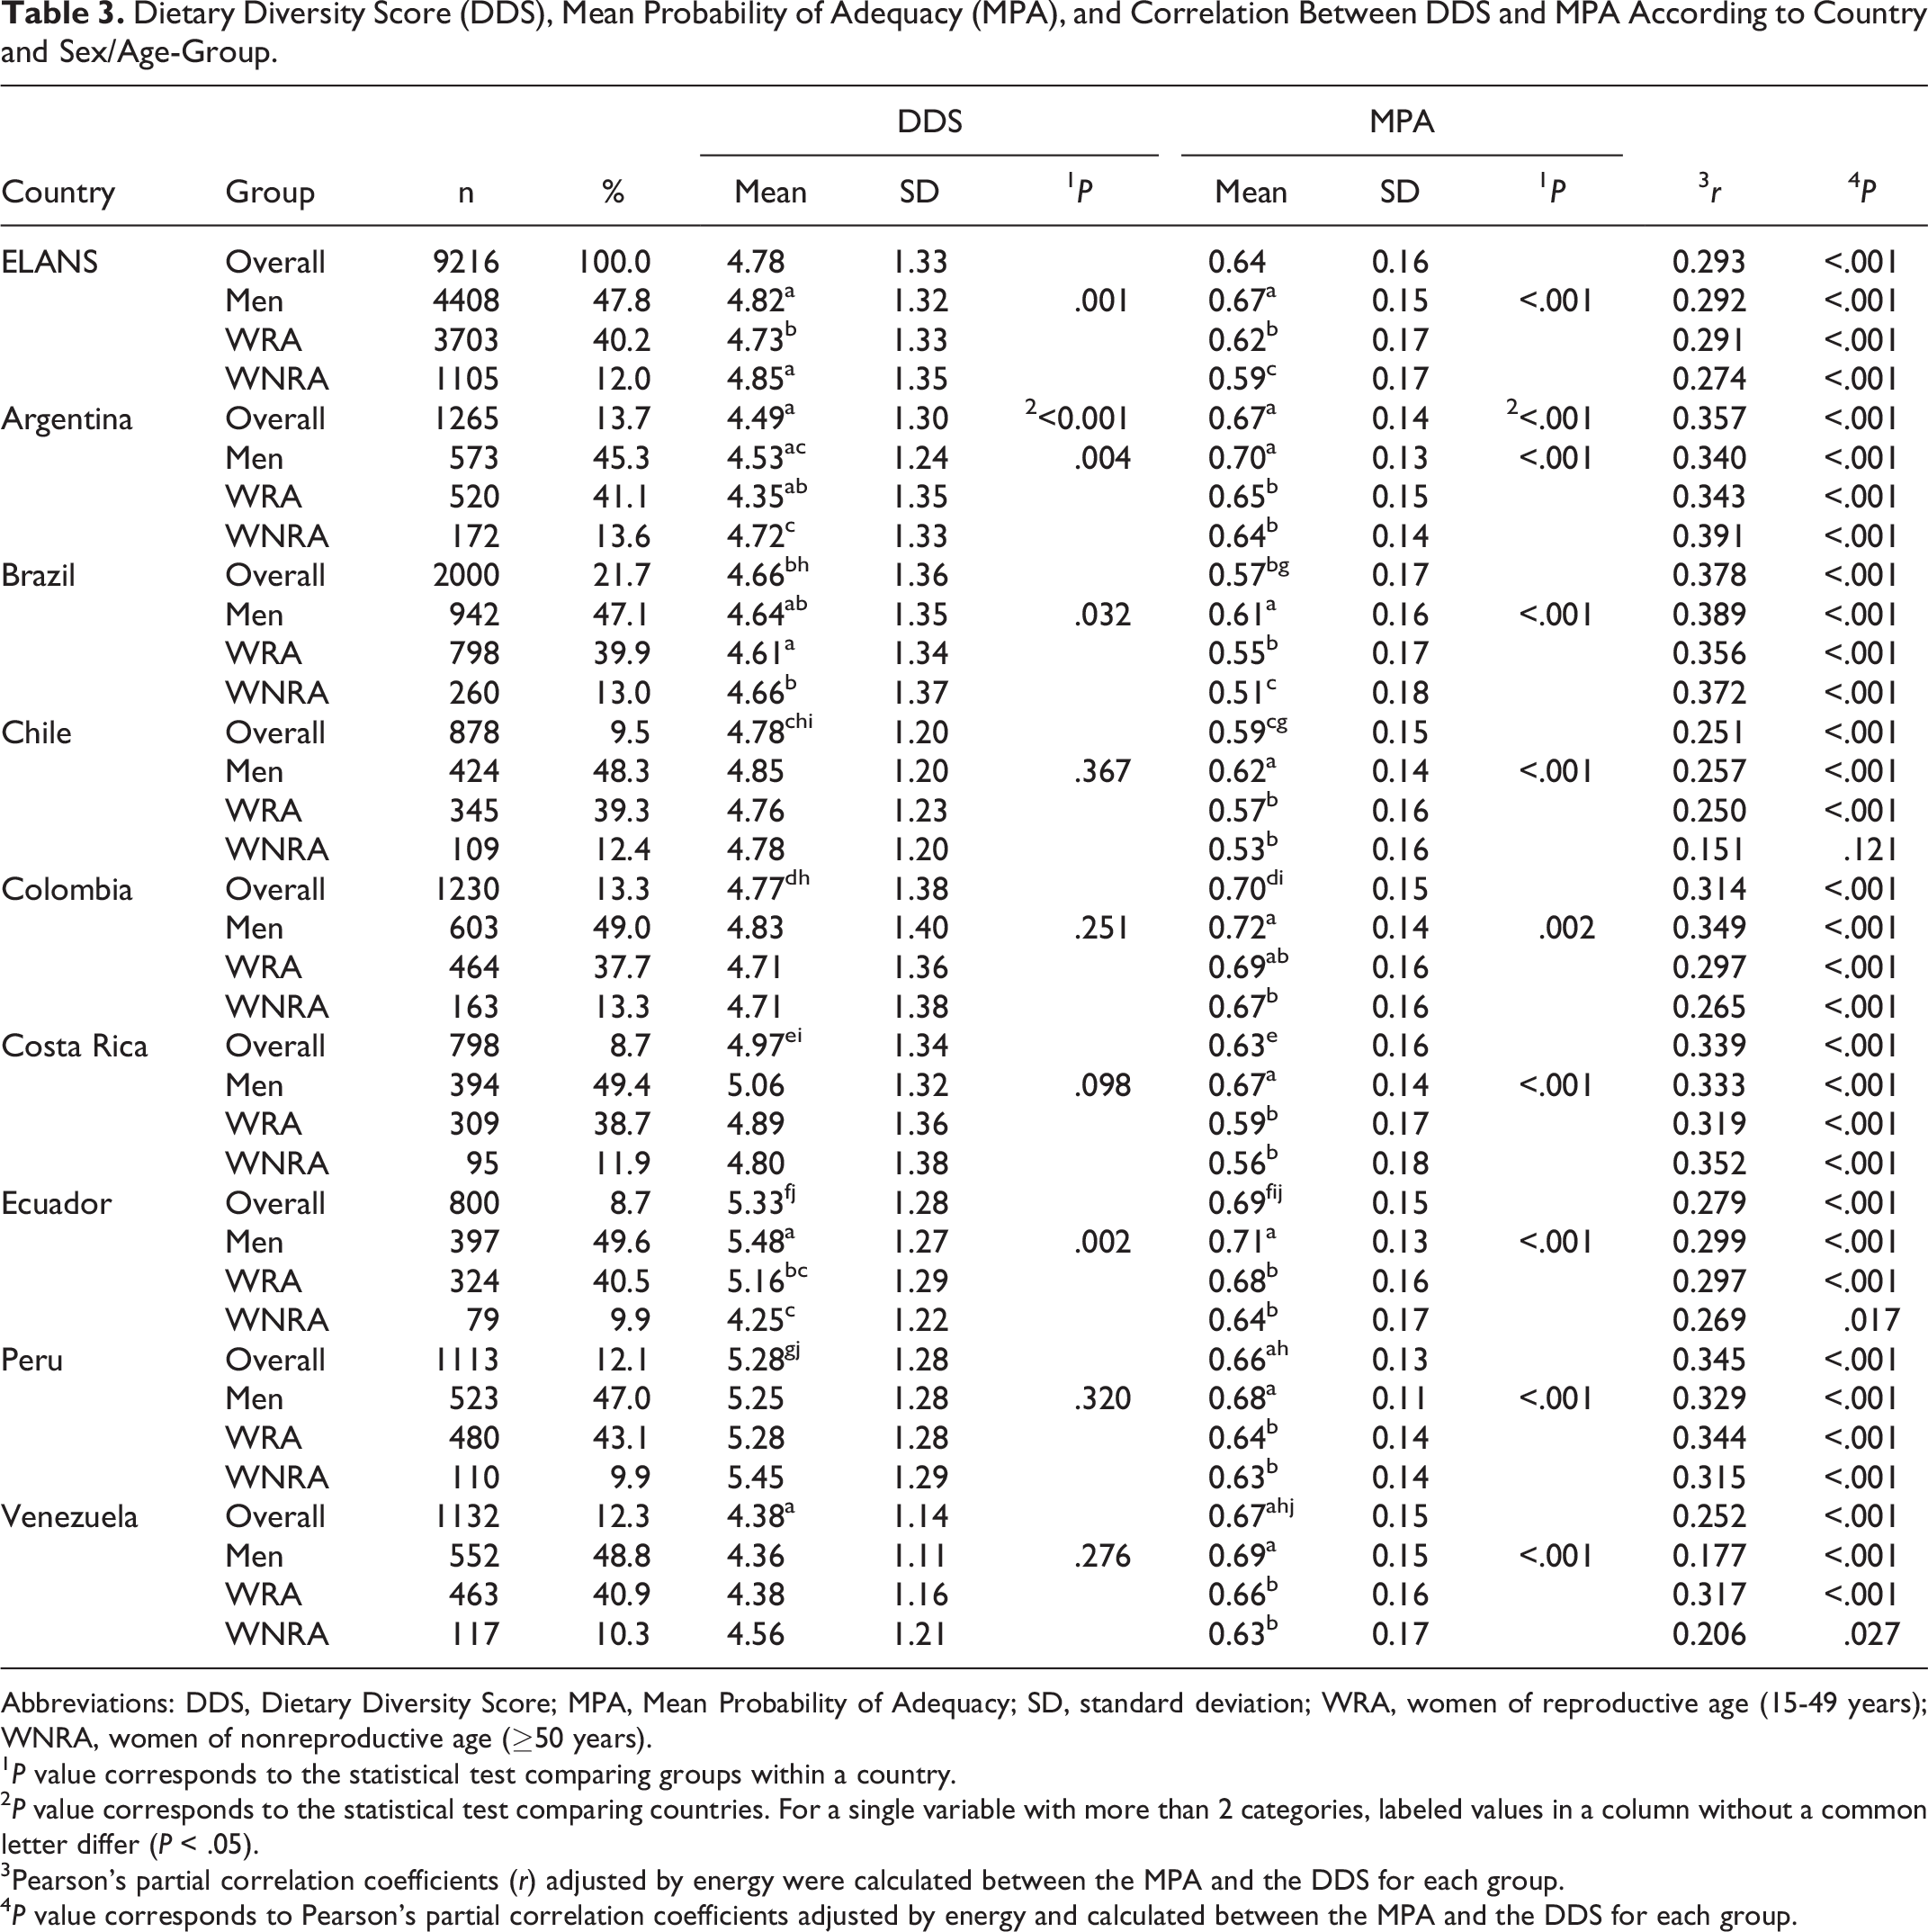
Abbreviations: DDS, Dietary Diversity Score; MPA, Mean Probability of Adequacy; SD, standard deviation; WRA, women of reproductive age (15-49 years); WNRA, women of nonreproductive age (≥50 years).
1 P value corresponds to the statistical test comparing groups within a country.
2 P value corresponds to the statistical test comparing countries. For a single variable with more than 2 categories, labeled values in a column without a common letter differ (P < .05).
3Pearson’s partial correlation coefficients (r) adjusted by energy were calculated between the MPA and the DDS for each group.
4 P value corresponds to Pearson’s partial correlation coefficients adjusted by energy and calculated between the MPA and the DDS for each group.
Regarding the MPA values, significant differences among all groups were detected for the whole ELANS sample, with men showing the highest score and WNRA the lowest (P < .001). Within countries, in Argentina, Chile, Peru, Colombia, Costa Rica, Ecuador, and Venezuela, men showed higher scores than both WRA and WNRA groups, which did not differ from each other (P < .05). In all these cases, the WNRA group exhibited the lowest MPA scores. Brazil followed the same trend of the MPA values as the overall sample.
For the overall ELANS sample, the proportion of participants (59.1%) with a diverse diet (DDS ≥ 5) was significantly different from that (40.9%) with a nondiverse diet (DDS < 5) (P < .001). Despite the large differences among sex/age groups, the proportion of participants with a diverse diet was not significantly different among men, WRA, and WNRA (P = .064; Table 4). The same table shows that the PA for all 11 micronutrients was significantly higher for participants with a diverse diet in comparison with those with a nondiverse diet. This was true across each sex/age-group (P < .001). Nutrients with overall higher differences in the PA between participants with a diverse and a nondiverse diet were vitamin B6 (ΔPA = 0.14), folate (ΔPA = 0.14), vitamin C (ΔPA = 0.14), and vitamin A (ΔPA = 0.12). Similar trends were observed by sex/age-group. Additionally, the same nutrients showed the highest significant correlations (r) adjusted by energy between micronutrient PA and DDS: vitamin B6 (0.217), folate (0.151), vitamin C (0.257), and vitamin A (0.316) (P < .001; Supplemental Table 2).
Probability of Micronutrient Adequacy (PA) According to Dietary Diversity for the ELANS Overall Sample and According to Sex/Age-Group.
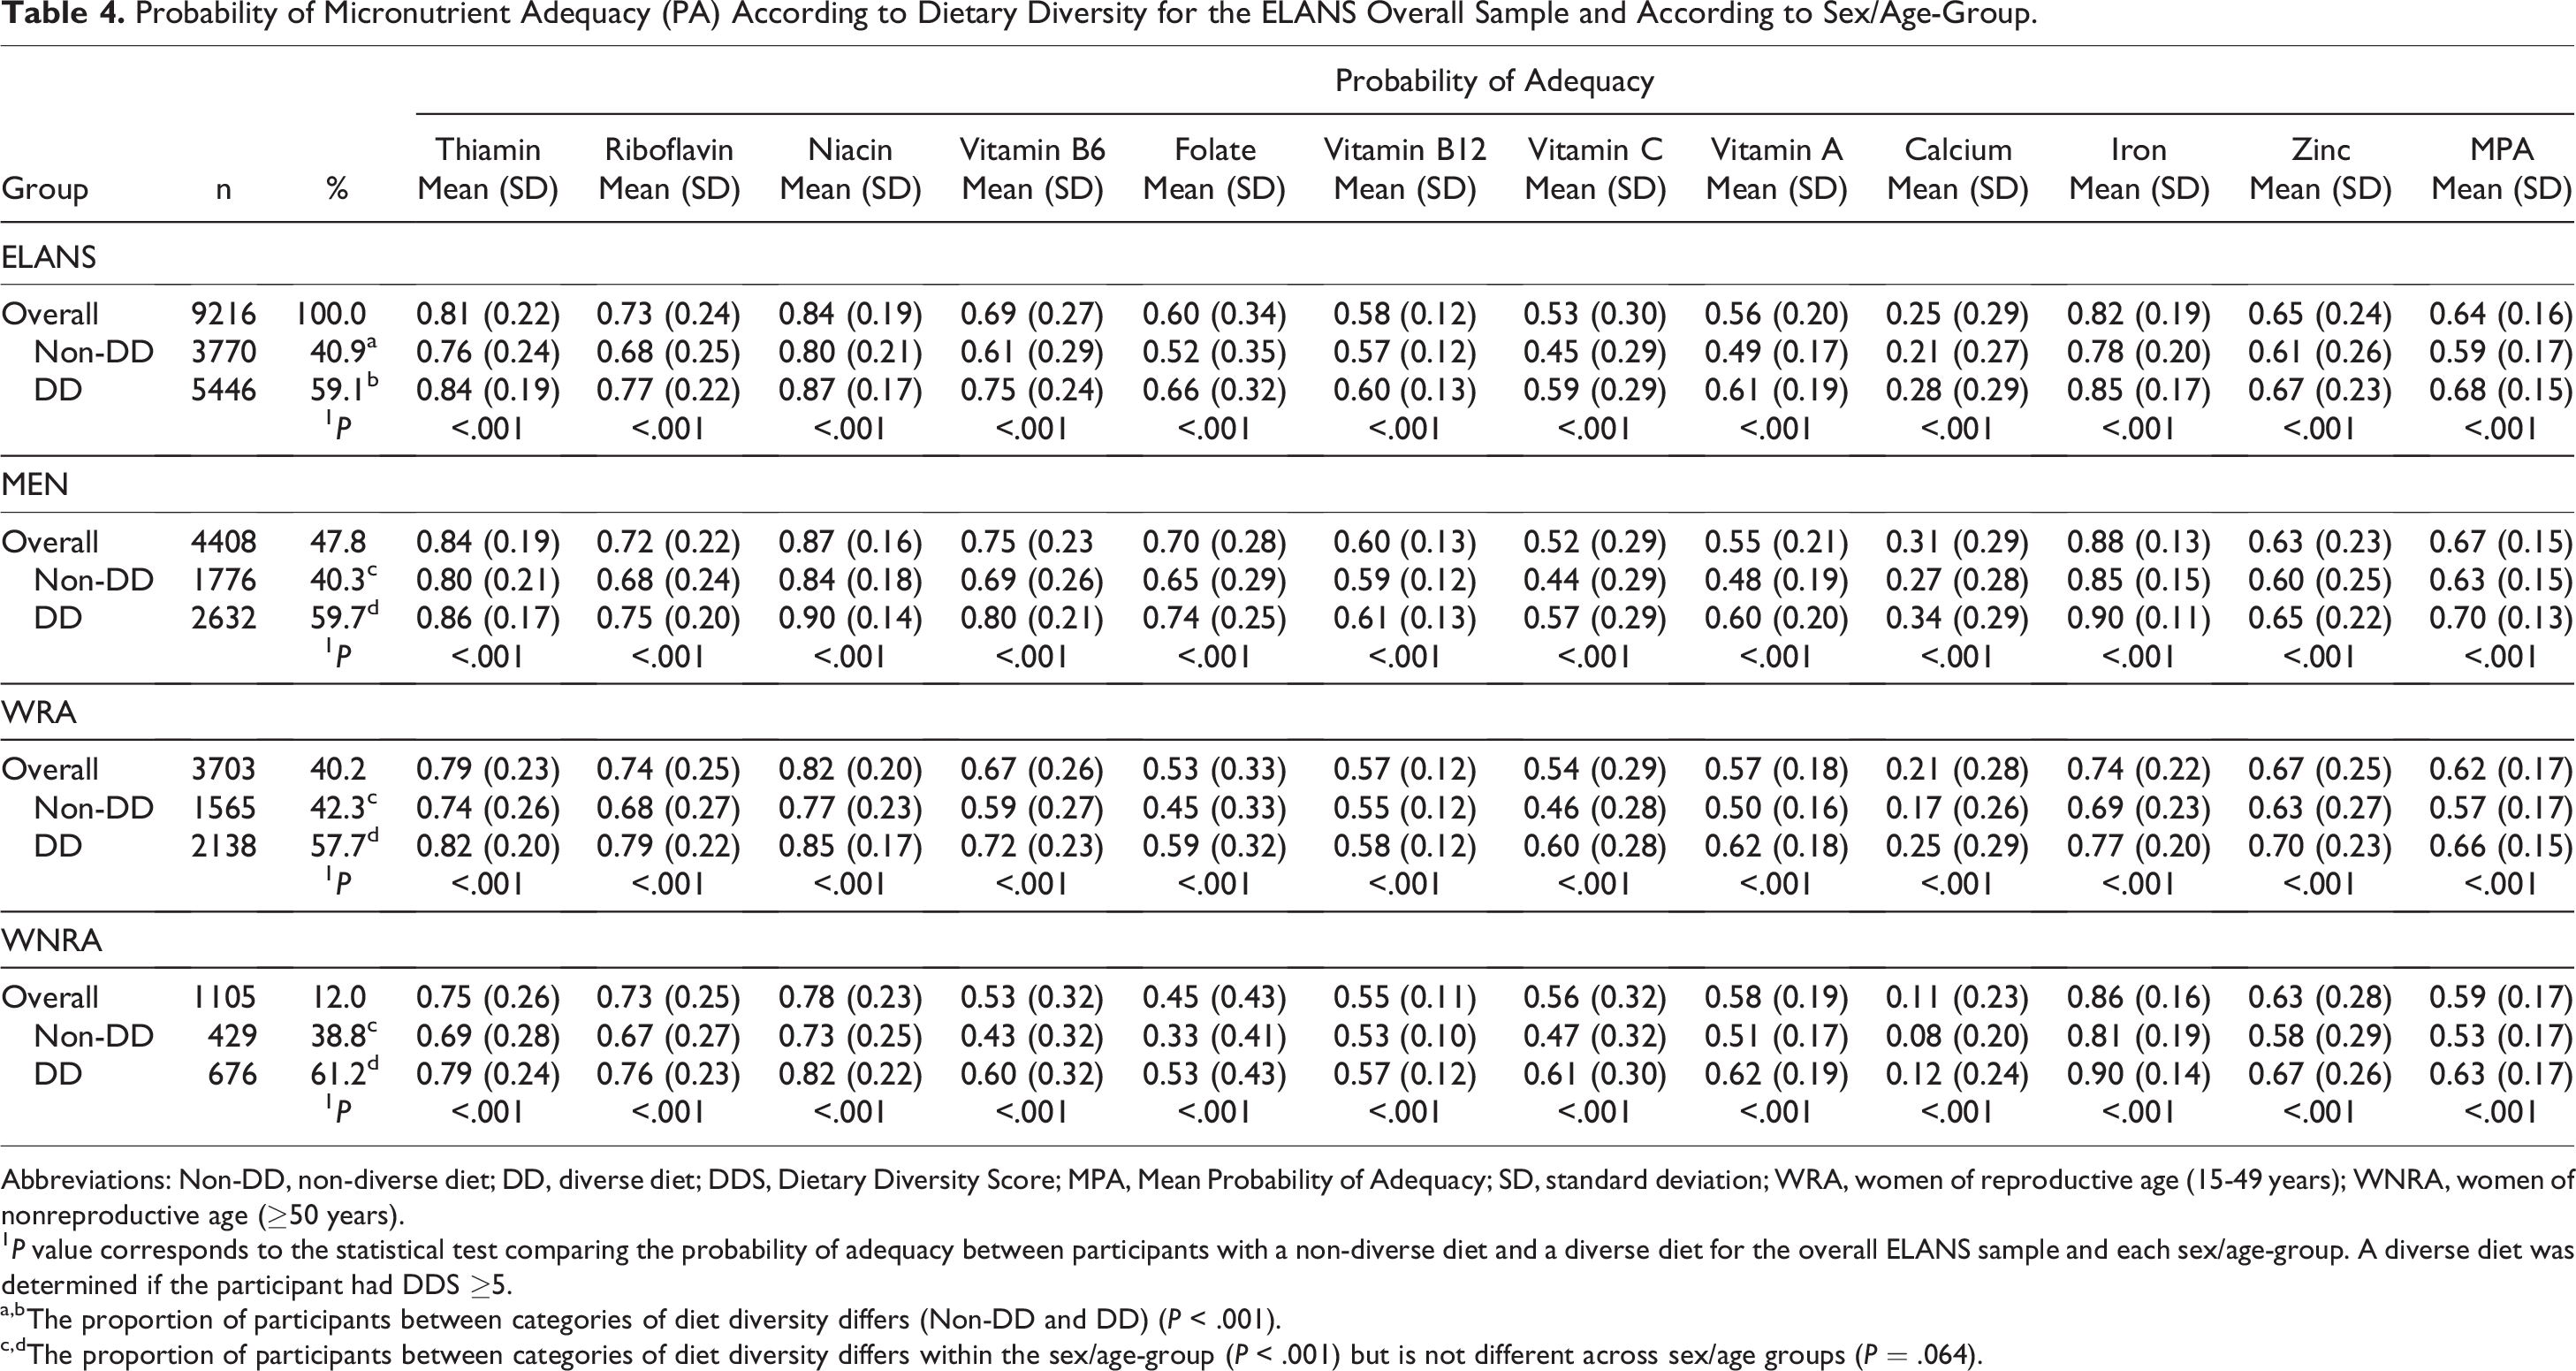
Abbreviations: Non-DD, non-diverse diet; DD, diverse diet; DDS, Dietary Diversity Score; MPA, Mean Probability of Adequacy; SD, standard deviation; WRA, women of reproductive age (15-49 years); WNRA, women of nonreproductive age (≥50 years).
1 P value corresponds to the statistical test comparing the probability of adequacy between participants with a non-diverse diet and a diverse diet for the overall ELANS sample and each sex/age-group. A diverse diet was determined if the participant had DDS ≥5.
a,bThe proportion of participants between categories of diet diversity differs (Non-DD and DD) (P < .001).
c,dThe proportion of participants between categories of diet diversity differs within the sex/age-group (P < .001) but is not different across sex/age groups (P = .064).
Discussion
The present study aimed to determine if the 5-food groups cutoff proposed by the FAO can be used in urban Latin American men, WRA, and WNRA to identify adequate micronutrient intake. Few studies have assessed dietary diversity in the region, and to the best of our knowledge, this is the first one conducted simultaneously using the exact same methodology among a large representative sample of the urban Latin American population.
The cutoff of MDD ≥5 of 10 food groups for men, WRA, and WNRA found in this study was similar to that identified by the FAO for WRA. 7 This cutoff point has been considered adequate since it is related to a high probability of micronutrient adequacy for 11 micronutrients. 7
Despite the similarity in the methodology for determining the cut-off point for the DDS with the one employed by the FAO, 7 which deems a correct classification rate ≥60% as appropriate, concerns could arise regarding whether this 40% misclassification introduces bias in classifying individuals with or without a diverse diet. Notably, in the validation of the WDDS, the FAO highlights that dichotomizing the DDS increases the misclassification percentage but considers it acceptable. 7 Moreover, during the validation of both the WDDS7 and the Infant and Young Child Project, 34,35 it is emphasized that moderate to high misclassification rates, confirming food group diversity indicators, should be deemed satisfactory for population-level assessment and not be applied at the individual level.
The determination of acceptable absolute levels of sensitivity, specificity, and misclassification lacks fixed criteria. Nevertheless, the FAO underscores that the acceptability of these factors relies on the specific purpose for which the indicator is intended. 7 Generally, benchmarks for population-level assessments may tolerate more misclassification, whereas indicators used for resource allocation or triggering action require stricter requirements. Indicators employed at the individual level, such as in screening, may necessitate even higher standards.
Other studies have reported that for specific population samples the 5-food groups cutoff is not suitable to predict MPA. Nguyen suggested a cutoff of ≥6 food groups-cutoff for Bangladeshis adolescents and women to identified those with MPA ≥0.6. 9 On the other hand, Monge-Rojas et al, 22 reported that a 4-food groups cutoff resulted in higher sensitivity and specificity in adolescents from Costa Rica. The latter suggests that a 5-food group cutoff may not be suitable in all age groups and geographical settings.
Our findings suggest using an MPA ≥0.70 as a suitable value to assess micronutrient intake in adult urban populations of middle-income countries in the LA region. FAO has indicated that 0.70 cannot be qualified as the optimal value to define a “good micronutrient adequacy” of the diet, but this value constitutes a good indicator in low-resource contexts. 7 However, it may also be an adequate value in high- and middle-income countries, where there is a high prevalence of inadequate intakes of some key micronutrients. 7,36,37
In Latin America, in which the countries are low- and middle-income, an MPA ≥0.70 seems to be just as reasonable as in low-income countries. This decision was taken considering 2 aspects: (1) Higher MPA values were tested as possible cutoff points (0.75-0.80) to determine micronutrient adequacy. However, even though the large sample size, the high prevalence of micronutrient inadequacy derived from a higher MPA cutoff point suggested to set a lower but globally accepted cutoff point for the MPA (data not shown), 7 (2) In the urban areas of LAC, a food environment characterized by the wide availability of food and multiple food fortification programs coexists with a high level of poverty that limits access to food, and approximately 60% of the poor and half of the extremely poor population live in urban areas, and the urbanization of poverty is projected to continue in the region. 9 Migration to urban areas shifted the location of global poverty to cities, triggering the process known as the “urbanization of poverty.” 7,38
After identifying those with a diverse diet, we found 59.1% of participants reaching the minimum diversity, which is higher than that found in studies from other latitudes. For example, Mesfin et al (2023) 39 reported 53% of pregnant women from Southern Ethiopia achieving the MDD-W, Shenka et al (2018) 40 43% of pregnant women from Ethiopia, Teferi et al (2023) 41 39.8% of postpartum mothers from Southwest Ethiopia, 30.6% reported by Custodio et al (2018) 15 in WRA in Burkina Faso, and Gitagia et al 42 a 25% in WRA from Kenya. This difference could be associated with food availability or socioeconomic and cultural factors.
When comparing men, WRA, and WNRA in the overall sample, we found 59.1%, 57.9%, and 59.7% achieving dietary diversity, respectively. The prevalence of inadequate intake of all micronutrients was significantly higher in those with a diverse diet. These results reflect that those participants that consumed a diverse diet were eating more nutrient-density foods increasing the probability of micronutrient adequacy, even when less than 50% of respondents reported the consumption of green leafy vegetables, fruits, and vegetables rich in vitamin A, other fruit and other vegetables, food groups that are a good source of micronutrients.
The DDS was positively associated with MPA, as well as with PA of all micronutrients assessed, consistent with previous studies. 9,10,23,43 The same association was observed for WRA as for men and WNRA, highlighting the possibility of MDD-W to also be used as a simple indicator of micronutrient adequacy in other populations different than WRA.
Our results suggest that the MDD indicator proposed by FAO can be considered as an adequate and low-cost tool to be used in the assessing of micronutrient intake, in men and in WRA and WNRA, constituting an important input to provide the knowledge that should guide the design of nutritional policies addressing micronutrient deficiency in the urban areas of LAC.
Moreover, promoting dietary diversity will enhance the probability of micronutrient adequacy, it is therefore important to highlight that dietary diversity is only one component of a healthy diet, and the DDS does not consider the amount of food consumed or the consumption of food groups or nutrients that have been associated with chronic diseases such as sweets, sugar-sweetened beverages, sodium, saturated fats, and red meats. Also, there is limited evidence on the association of dietary diversity with total energy intake, and suboptimal eating patterns or body weight. 44 Further investigation is required to elucidate these associations, and when promoting a diverse diet, it is crucial to emphasize the consumption of nutrient-dense foods.
One limitation of this study is that responses rely on participants' memory of what they ate the day before the interview. Another limitation is that using one 24-h recall does not reflect the usual intake of the food groups assessed. However, the use of one 24-h recall to calculate the MDD indicator is a low cost and simple resource, widely used in low- and middle-income countries to assess diet diversity and as a proxy of micronutrient intake adequacy. In addition, the Latin American countries included in this study have a higher development index score compared with the countries where the MDD indicator was originally validated. Notwithstanding the foregoing, the MDD cut-off points determined for the different sex-age groups of this study were similar to the cut-off point for women of reproductive age in the original validation. 36 This study has the strength of having data collected simultaneously in eight LAC, with the same methodology, which allows us to use a large sample of men and women to test if MDD indicator performs equally well in men and women of non-reproductive age, as it has been previously validated in women of reproductive age. Also, having followed a similar methodology than the one proposed by FAO (2021), enhance the accuracy of our data validating the use of the MDD indicator in populations different than WRA.
Conclusions
Our results provide evidence that a higher DDS was associated with a higher Mean Probability of Adequacy for the 11 micronutrients assessed. Using this MDD indicator as a proxy of micronutrient adequacy proved to be effective not only in women of reproductive age but also in men and women of nonreproductive age in the urban areas of Latin American region.
Supplemental Material
Supplemental Material, sj-pdf-1-fnb-10.1177_03795721241242920 - Exploring the FAO Minimum Dietary Diversity Indicator as a Suitable Proxy of Micronutrient Adequacy in Men and Women Across Reproductive and Non-reproductive Ages in 8 Latin American Countries
Supplemental Material, sj-pdf-1-fnb-10.1177_03795721241242920 for Exploring the FAO Minimum Dietary Diversity Indicator as a Suitable Proxy of Micronutrient Adequacy in Men and Women Across Reproductive and Non-reproductive Ages in 8 Latin American Countries by Georgina Gómez, Rafael Monge-Rojas, Rulamán Vargas-Quesada, Agatha Nogueira Previdelli, Dayana Quesada, Irina Kovalskys, Marianella Herrera-Cuenca, Lilia Yadira Cortes, Martha Cecilia Yépez García, Reyna Liria-Domínguez, Attilio Rigotti, Regina Mara Fisberg, Gerson Ferrari, Mauro Fisberg and Juan C Brenes in Food and Nutrition Bulletin
Supplemental Material
Supplemental Material, sj-pdf-2-fnb-10.1177_03795721241242920 - Exploring the FAO Minimum Dietary Diversity Indicator as a Suitable Proxy of Micronutrient Adequacy in Men and Women Across Reproductive and Non-reproductive Ages in 8 Latin American Countries
Supplemental Material, sj-pdf-2-fnb-10.1177_03795721241242920 for Exploring the FAO Minimum Dietary Diversity Indicator as a Suitable Proxy of Micronutrient Adequacy in Men and Women Across Reproductive and Non-reproductive Ages in 8 Latin American Countries by Georgina Gómez, Rafael Monge-Rojas, Rulamán Vargas-Quesada, Agatha Nogueira Previdelli, Dayana Quesada, Irina Kovalskys, Marianella Herrera-Cuenca, Lilia Yadira Cortes, Martha Cecilia Yépez García, Reyna Liria-Domínguez, Attilio Rigotti, Regina Mara Fisberg, Gerson Ferrari, Mauro Fisberg and Juan C Brenes in Food and Nutrition Bulletin
Footnotes
Acknowledgments
The authors would like to thank the staff and participants from each of the participating sites who made substantial contributions to ELANS, and the Ibero-American Nutrition Foundation (FINUT) for covering the article processing charges.
Declaration of Conflicting Interests
The author(s) declared no potential conflicts of interest with respect to the research, authorship, and/or publication of this article.
Funding
The author(s) disclosed receipt of the following financial support for the research, authorship, and/or publication of this article: The authors received financial support for the publication of this article from Fundación Iberoamericana de Nutrición—FINUT. This research was performed using the database of the ELANS study. The funders had no role in the design of the study; in the collection, analyses, or interpretation of data; in the writing of the manuscript, or in the decision to publish the results. The original methods and funding information for the ELANS fieldwork are published elsewhere. 27
Supplemental Material
Supplemental material for this article is available online.
References
Supplementary Material
Please find the following supplemental material available below.
For Open Access articles published under a Creative Commons License, all supplemental material carries the same license as the article it is associated with.
For non-Open Access articles published, all supplemental material carries a non-exclusive license, and permission requests for re-use of supplemental material or any part of supplemental material shall be sent directly to the copyright owner as specified in the copyright notice associated with the article.