
Abstract
Background:
Rapid economic growth, urbanization, and globalization have resulted in dietary transformation in India. Triple burden of malnutrition remains a significant concern, with high prevalence of undernutrition, widespread micronutrient deficiencies, and rising obesity.
Objective:
This article reviews the dietary transition in India by analyzing trends in food consumption across time and space.
Methods:
Household consumption survey data from 1993 to 2012 are analyzed to examine both national- and state-level trends to investigate how diets have changed and vary across the country. Typical Indian diets are characterized using k-mean cluster analysis and associated with socioeconomic and geographical aspects.
Results:
The article finds that on average Indian household diets have diversified slowly but steadily since the 90s. Indians diets have shifted away from cereals to higher consumption of milk. However, progress on micronutrient-rich food groups such as fruits, vegetables, meat, and egg has been worryingly slow. Even by 2012, about a fifth of rural Indian households did not consume fruits or milk, while more than half of both urban and rural households did not consume any meat, fish, or eggs. Five predominant dietary types are identified. Sections of the Indian households do consume reasonably balanced diets, but large percentages consume cereal-focused, dairy-focused, or processed food heavy diets with high processed food content.
Conclusions:
Diets in India have not transformed sufficiently to overcome major gaps in intakes of micronutrient-rich foods. Large regional heterogeneities in diets call for regionally differentiated strategies to improve diets.
Introduction
Following economic liberalization policies introduced in the early 1990s, India has experienced rapid economic growth, urbanization, and globalization. However, malnutrition remains a significant concern in India, with the 2013-15 Rapid Survey of Children reporting stunting prevalence of 38.7% among under-fives 1 and widespread micronutrient deficiencies in the population. 2 The nutritional adequacy of Indian diets has therefore been the subject of debate, and much of this debate has revolved around energy intakes. In particular, attention has centered on explaining the puzzle of decreasing calorie intakes across income classes in spite of growth in household incomes. 3,4 Other work has described dietary transformation in the country, 5,6 noting in particular the diversification out of staple grains and pulses and into more expensive sources of energy such as milk and meat. However, an apparent slowing of such diversification in the second half of the 2000s has been observed. 7 Dietary quality improvements have been found to be insufficient, and micronutrient deficiencies remain widespread. 2,8
In this article, we contribute to this literature by analyzing trends in dietary diversity in India across space and time. An important aspect of our contribution is to examine regional differences in the evolution of diets at national level for India, on which relatively little attention has been focused in the previous literature. Given the size and diversity of India, nutrition-related outcomes and their drivers can vary substantially across states and regions, and national trends can mask large regional heterogeneities of relevance to policy and practice. 9 Also, by investigating trends based on household micro data from the National Sample Survey Organization (NSSO) over almost 2 decades from 1993 to 1994 to 2011 to 2012, we are able to capture medium to long-term temporal evolution in consumption pattern. Finally, we add to the literature by developing a data-defined typology of Indian diets and examining the characteristics of households consuming these typical diets. Our analysis holds relevance not only for the important case of India but also for other South Asian countries experiencing economic, nutritional, and epidemiological transitions.
The article is structured as follows. Section 2 describes the data and methodology used in the article. Section 3 presents the results, while section 4 provides discussion and conclusion.
Data and Methods
Data
The article uses various rounds of household consumer expenditure surveys (HCES) conducted by NSSO. The NSSO conducts quinquennial surveys on consumer expenditure on various items including food and nonfood expenditures. The quinquennial surveys, referred to as NSSO “thick rounds,” are nationally representative and have sample sizes of over 100 000 households. In this research, we focus particularly on the 50th and 68th thick rounds corresponding to years 1993-1994 and 2011-2012, respectively. However, we also use data from the intermediate thick rounds and years for some of our analysis. The NSSO surveys are comparable over the years with only minor changes in the food consumption questionnaire. Thick round data collection happens over quarterly subrounds to account for seasonality. The food questionnaire records both quantity and expenditure value of over 250 food and beverage items purchased over a recall period of 30 days. 10 In spite of some shortcomings (Note 1), such as data collection on food purchases at household rather than individual level, recording of food purchases rather than intakes, and a relatively long recall period of 30 days, NSSO dietary data are considered a valuable source of information on Indian diets and have been used in many studies (eg, the study by Deaton and Drèze, 3 and Gaiha et al 7 ).
Measuring Household Dietary Diversity
Household dietary diversity is measured by the Household Dietary Diversity Score (HDDS) using the 12 food groups classification suggested by Food and Nutrition Technical Assistance Project/United States Agency for International Development (Note 2). Each food group is categorized as 1 if the household consumes the food group and 0 if they do not consume it over a 30-day recall period. We also estimate the per capita quantity of food consumed. It is calculated for each household by summing up the quantity of each food group and dividing by the household size.
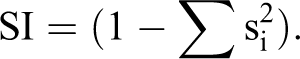
The HDDS provides a simple, robust, and easily interpretable indicator of dietary diversity at the household level, but it fails to capture the distribution of food groups consumed. Thus, in this article, dietary diversity is also measured using the Simpson index (SI). The SI originates from the measurement of species diversity and economic competitiveness and has been applied previously as a measure of dietary diversity. 11 -13 It is calculated as 1 minus the sum of squares of the expenditure shares (si) of food groups. A high score would indicate a diverse food basket, while a low score indicates a concentrated diet.
Identifying Diets Using Cluster Analysis Methods
We use multivariate methods to define patterns in household dietary data by employing a clustering technique. 14 The objective is to group sampled households into clusters based on similarity of diets, allowing identification of distinct and predominant dietary patterns in the data. The method uses Euclidean distances between observations to empirically estimate clusters within a given data set. 15 Analysis was conducted using partition cluster analysis, also known as the K-means method. Partition clustering is an iterative process that minimizes within-cluster variability while maximizing between-cluster variability at the same time. The technique assigns observations into a distinct number of nonoverlapping clusters defined by researchers. Each observation is assigned to the cluster with the closest mean. New cluster means are then calculated after each observation is assigned. The process continues iteratively until no observations change clusters. 16
We started by including all 12 food groups to define clusters. Stepwise, we excluded individual food groups from the clustering criteria if they did not contribute to variations in dietary patterns. The final clustering criteria included shares of expenditure on starchy foods, vegetables, fruits, meat, egg, dairy, and fish/seafood. Food groups with insufficient contribution to dietary variability and therefore not used as indicators in the clustering were oils; spices, condiments, and beverages; legumes, seeds, and nuts; and sweets. Expenditure shares for cereals and tubers were combined to constitute “starchy foods.” The article uses expenditure shares instead of quantity in order to compare minor changes in food item list in the survey questionnaire over time. Further, there are multiple units for different food items. For example, bananas and eggs were counted in numbers while milk was measured in liters and lentils in grams. Expenditure value provided a standard unit for all food items.
Results: Dietary Transition in India
Food Consumption and Dietary Diversity
Expenditure on food
Figure 1 presents evolution of food expenditure at the national level over time. Expenditure on food is seen to comprise a large proportion of Indian household budgets. In 1993-1994, both urban and rural households spent over 60% of their monthly expenditure on food. Since then, there has been a gradual decline in the food expenditure share. In 2011-2012, rural households spent approximately half of their budget on food, while urban households spent a little over 40% on food.
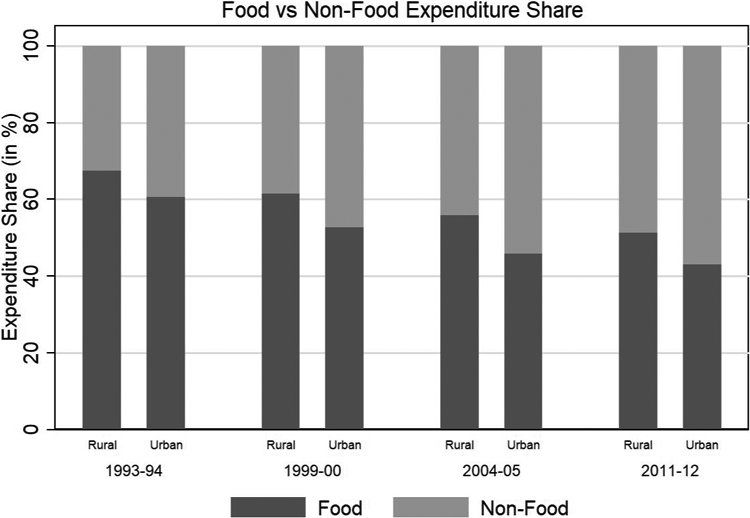
Household expenditure share on food and nonfood items.
Household dietary diversity
Figure 2 presents average household DDS and SI for both urban and rural India for the period 1993-1994 to 2011-2012. In 1993-1994, rural households consumed 9.08 out of 12 food groups over the 30-day recall period, while urban households consumed approximately 9.34 food groups. By 2011-2012, rural households consumed 9.71 food groups out of a total of 12 food groups on average, while urban households consumed approximately 9.57 food groups. Thus, dietary diversity for urban areas has only slightly improved over the 2-decade period, while rural diets have improved by 0.63 food groups over this period, resulting in rural diets now being somewhat more diverse than urban diets on average. This pattern is also reflected in graphs for S I, which show that SI for urban areas has inched up by 2% over the period, while the SI for rural India has increased by 8%.
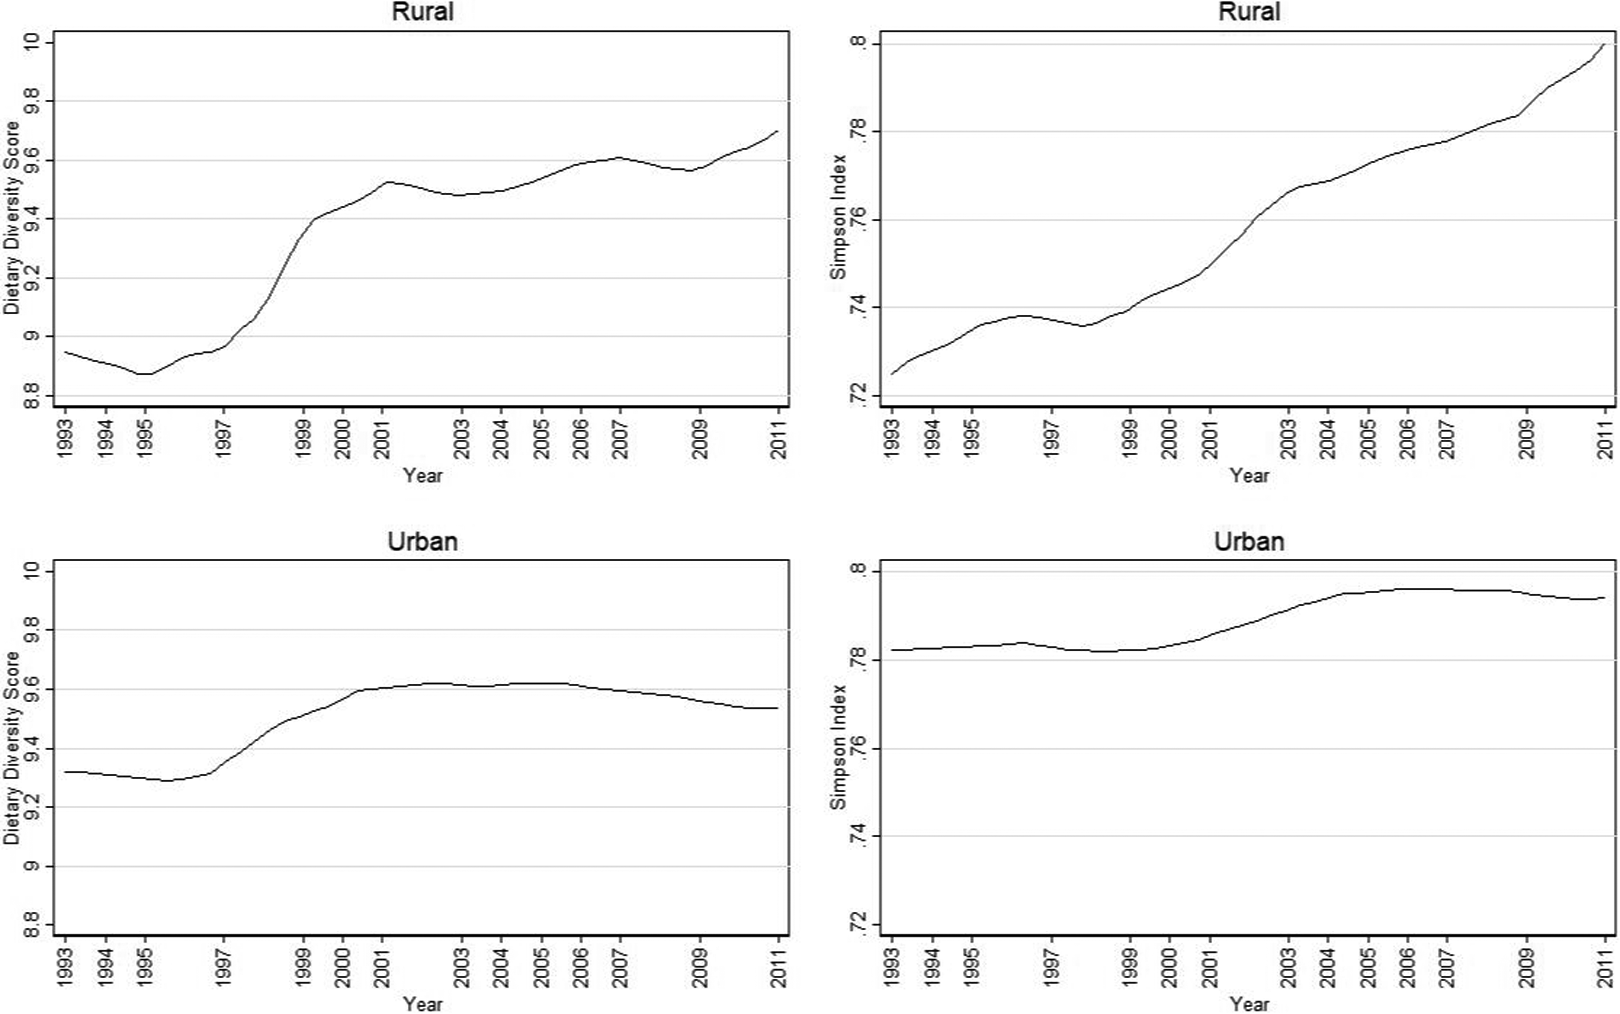
Household Dietary Diversity in India (1993-2011). 1. Local polynomial curves. 2. Missing years on x-axis refer to missing data points.
Figures 3 and 4 show state-level variation in HDDS across India and its temporal evolution. Separate maps are presented for rural and urban India and for 1993-1994 and 2011-2012. We find clear regional patterns in diversity of rural diets as seen in Figure 3. Rural areas of the Southern peninsula and Eastern states along with Jammu and Kashmir display the highest household dietary diversity. The Northern, Western, and Central regions of the country have relatively low dietary diversity scores. In terms of states, the Southern states of Kerala and Tamil Nadu and the Eastern state of Assam have consistently high diversity scores, while Rajasthan is among the states with least diverse diets in India. Rural diets are seen to have to have improved over time, with most Northern, Central, and Western states going past the threshold of 9 food groups during this period, and most Southern states exceeding a DDS of more than 10 by 2011-2012. Rajasthan and Haryana were the only 2 states with average DDS of less than 9 food groups in rural areas by 2011-2012.
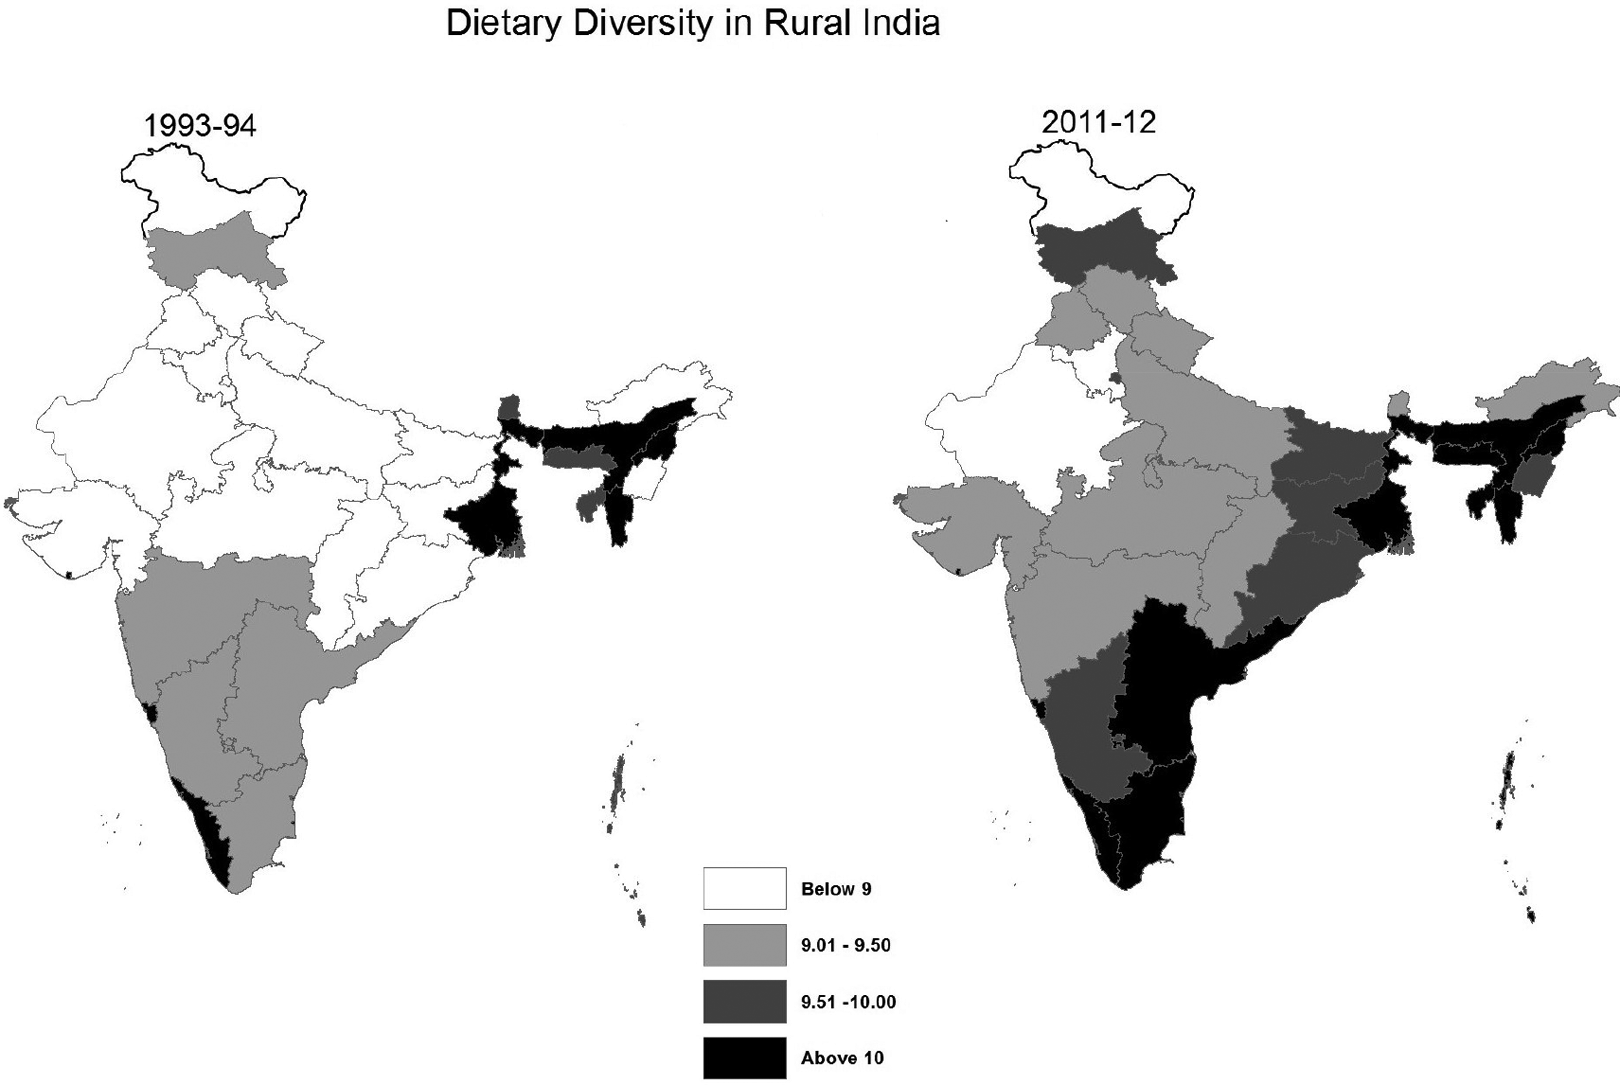
Spatial variation in rural dietary diversity.
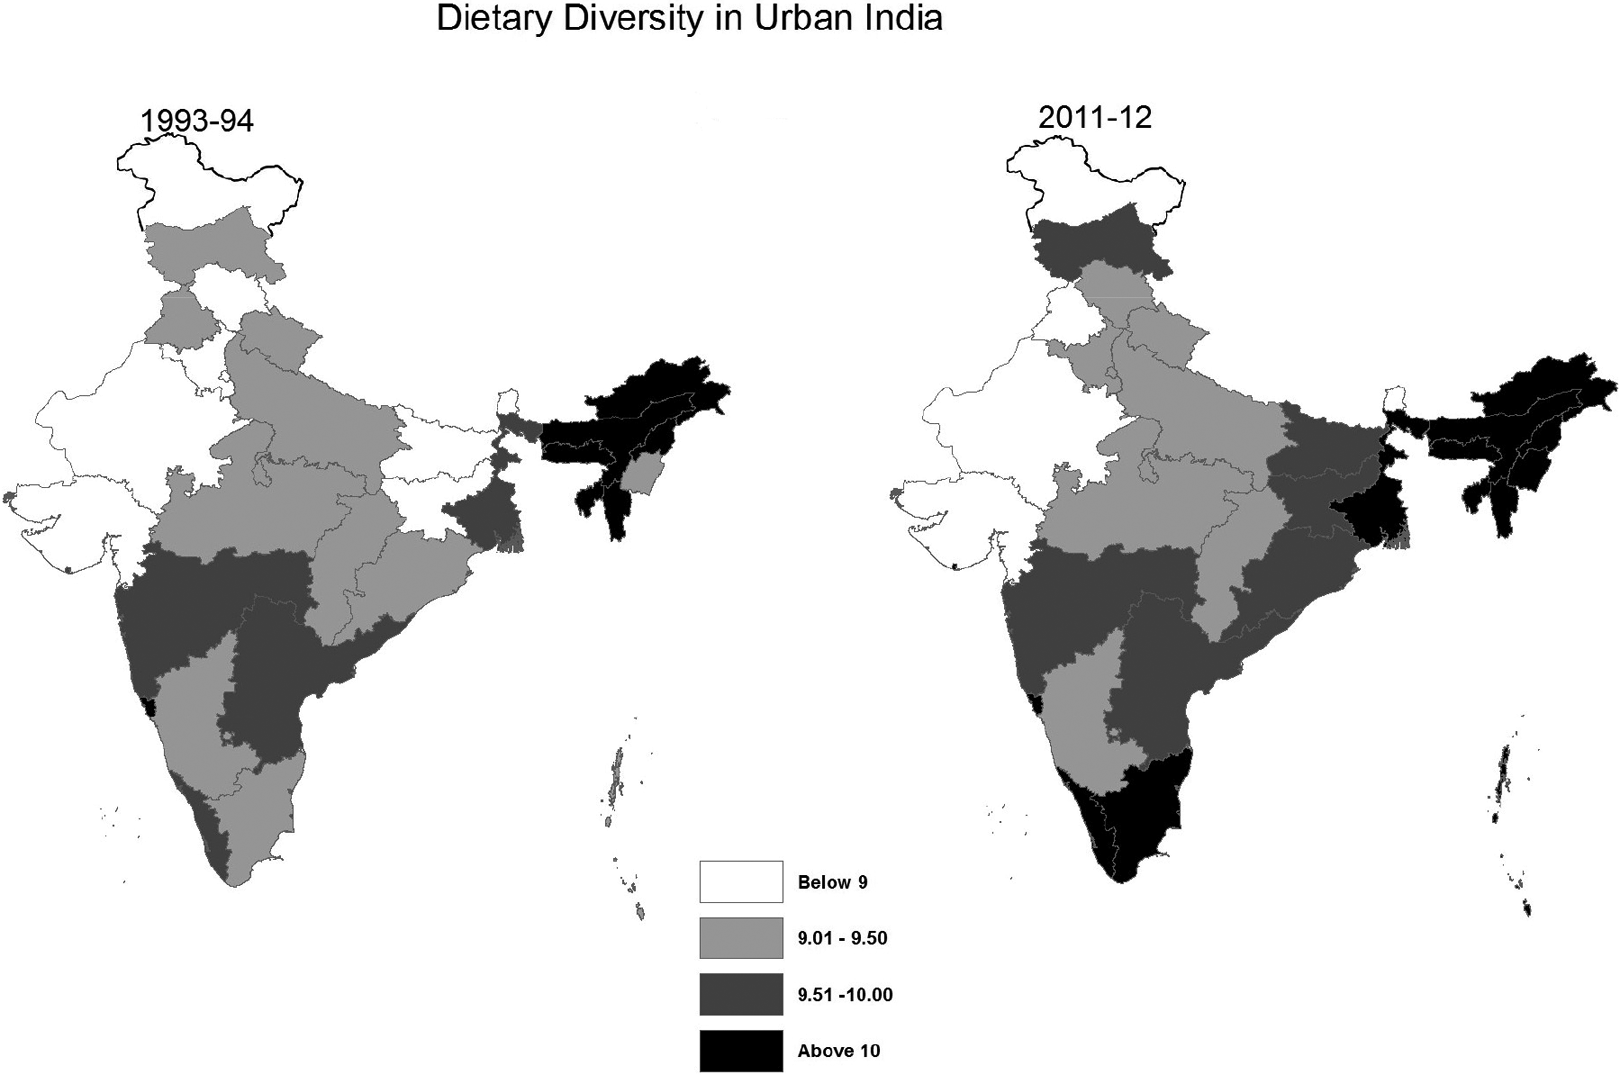
Spatial variation in urban dietary diversity.
Figure 4 shows that DDS for urban India has a less clearly delineated regional pattern than for rural areas. Generally, urban areas of the Southern peninsula and Eastern states have more diverse diets than urban areas of the Northern belt and Central Indian states. Western states have the least diverse urban diets within the country. Notably, there has been significant improvement in urban HH dietary diversity in 2 states that have historically scored poorly in social development indices, Bihar and Jharkhand, while urban Tamil Nadu has improved substantially to achieve an average DDS in excess of 10 food groups by 2011-2012. However, urban diets have only shown marginal improvements in much of the rest of the country. In particular, urban Gujarat and Rajasthan continue to have average DDS below 9 food groups, while urban Punjab has actually seen average DDS decline from 9.08 to 8.93 food groups over 1993-1994 to 2011-2012.
Consumption of individual food groups
We next turn to changes in the consumption of individual food groups in terms of per capita quantity as well as expenditure shares. Figures 5 and 6 present changes to the per capita quantity of food consumed between 1993-1994 and 2011-2012.
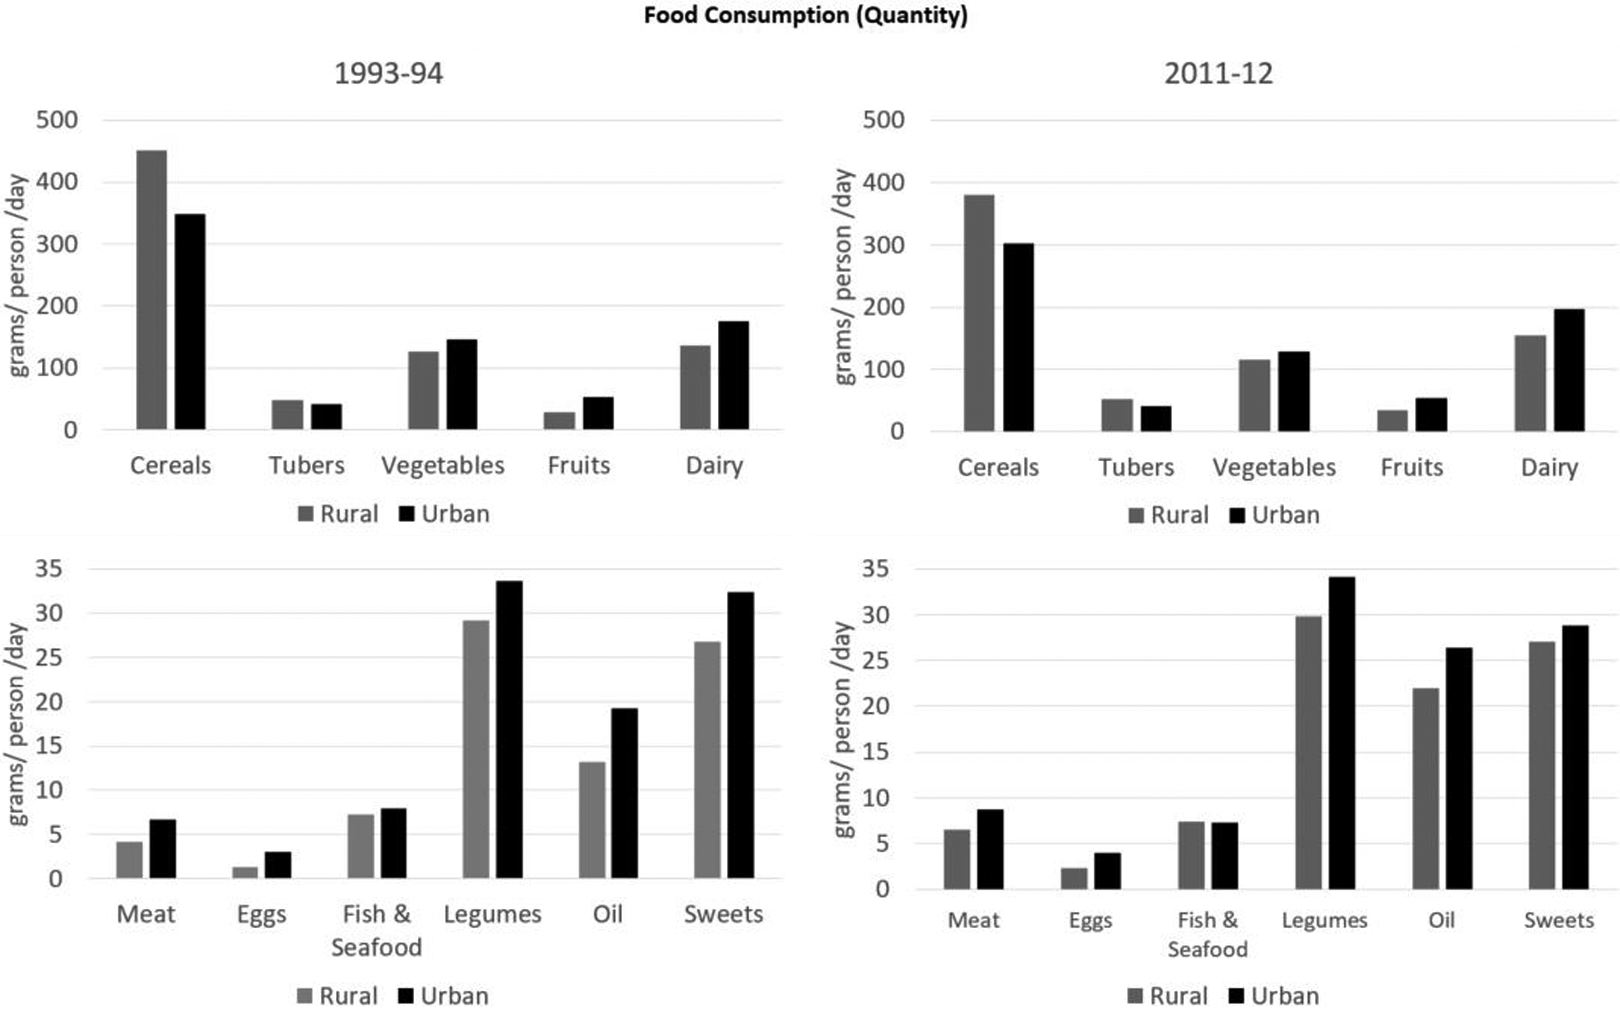
Quantity of food consumed.
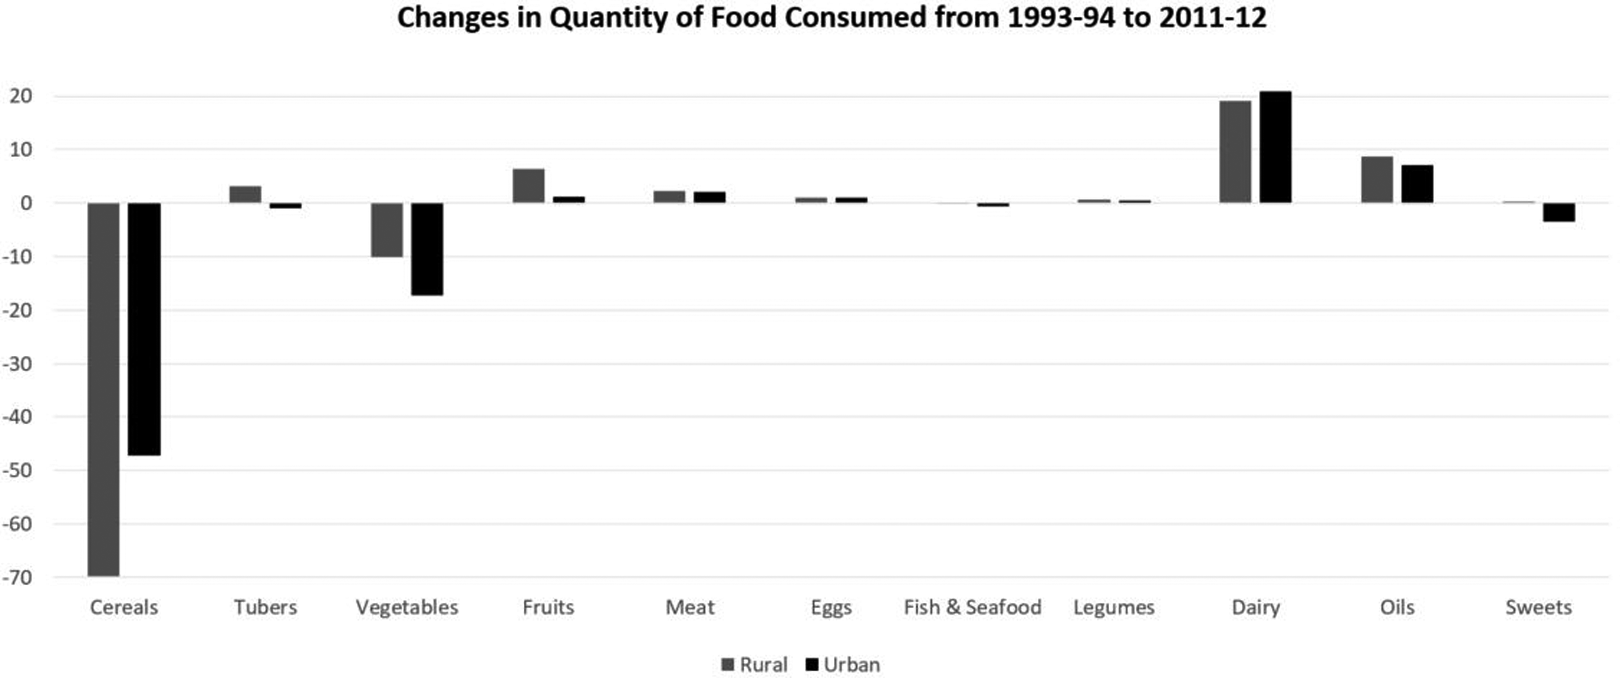
Changes to quantity of food consumed.
The decline in the importance of cereals is apparent. In 1993-1994, rural Indian households consumed 450 g per capita per day and urban households 350 g. By 2011-2012, this had declined to 380 and 300 g/d, respectively. Consumption of all nonstarchy (Note 3) groups is lower in rural areas. Rural households on average consumed approximately 13 g less vegetables, 20 g less fruits, and 42 g less dairy products per day compared to urban households, even though their HDDS scores are on average now somewhat higher than for urban households.
Consumption of animal source foods has increased, from a very low base in the case of meat and egg. Consumption of dairy has increased significantly from 136 g/person/d for rural areas and 176 g for urban areas in 1993-1994, to 155 g and 197 g, respectively, in 2011-2012. Meat consumption in rural areas increased from 4.17 g/person/d in 1993-1994 to 6.46 g in 2011-2012. Urban India consumed 6.68 g/person/d of meat in 1993-1994. This increased to 8.72 g in 2011-2012. Similarly, rural consumption of eggs rose from 1.28 to 2.36 g, while urban consumption increased from 3.00 to 3.99 g/person/day.
Per capita consumption of fish and seafood changed by less than a gram per capita per day over the 2 decade period. Rural intake stood at 7.25 g/capita/day in 1993-1994 and 7.38 g/capita/day in 2011-2012. Quantity of fish and seafood consumed more or less matched rural consumption and stood at 7.88 g/capita/day in 1993-1994 versus 7.25 g/capita/day in 2011-2012. Consumption of pulses, nuts seeds, and legumes has changed little over time.
Next we turn to edible oils and sweets, key foods associated with nutrition-related chronic diseases. The NSSO data show that consumption of oil increased substantially over the 2 decades, from 13.1 to 21.9 g/capita/day in rural areas and from 19.24 to 26.37 g/capita/day in urban areas. However, consumption of sweets remained fairly constant, with a slight rise from 26.80 to 27.05 g/capita/day in rural areas and a slight decline from 32.41 to 28.90 g/capita/day in urban areas.
Figures 5 and 6 also indicate that fruit and vegetable consumption is quite low and that there has actually been a decline in quantity of vegetables consumed and only a marginal increase in fruit consumption in the last decades. Consumption of vegetables decreased from 125.81 to 115.67 g/capita/day in rural areas and from 145.99 to 128.71 g/capita/day in urban areas. Average fruit consumption increased from 27.93 to 34.27 g/capita/day in rural areas and 52.20 to 53.37 g/capita/day in urban areas. Consumption of fruits is remarkably lower in rural than in urban areas.
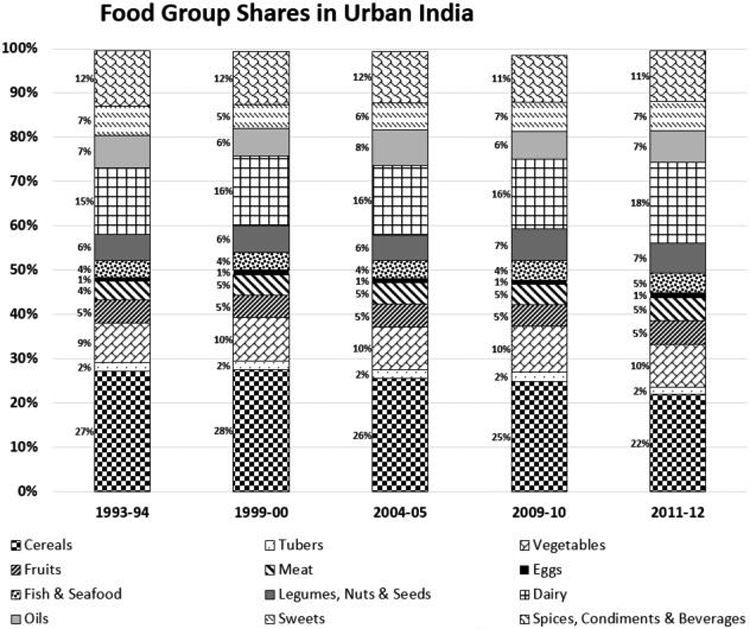
Figures 7 and 8 present relative change in consumption of food groups within the context of overall food consumption, by presenting per capita expenditure on each group as a percentage of total food expenditure. In rural India, the importance of cereals has declined, going from 42% in 1993-1994 to 27% of total food expenditure in 2011-2012. Milk has experienced the largest gain, increasing from 12% to 17%. A range of other food groups have expanded marginally in the total budget share to make up the declining share of cereals—food groups such as oils, vegetables, meat, and fish/seafood have expanded by 1 or 2 percentage points each in the rural budget shares. Urban budget shares have shown less movement. As Figure 8 shows, share of cereals in urban food budgets has declined from 28% to 21%, while the share of milk has increased from 16% to 19%. Otherwise, apart from marginal increases in vegetable, fruit, and meat shares, urban food expenditure shares have remained largely static.Given the low levels of consumption and expenditure on micronutrient-dense foods, we next explore in Table 1 the proportion of households that did not consume specific food groups during the 30-day recall period in 2011-2012. Table 1 also presents values for each dietary diversity indicator by region. We find that states in Eastern and Southern regions of India have more diverse diets than Northern and Western states by almost a whole food group on average. Southern India has the most diverse diets in terms of both indicators.
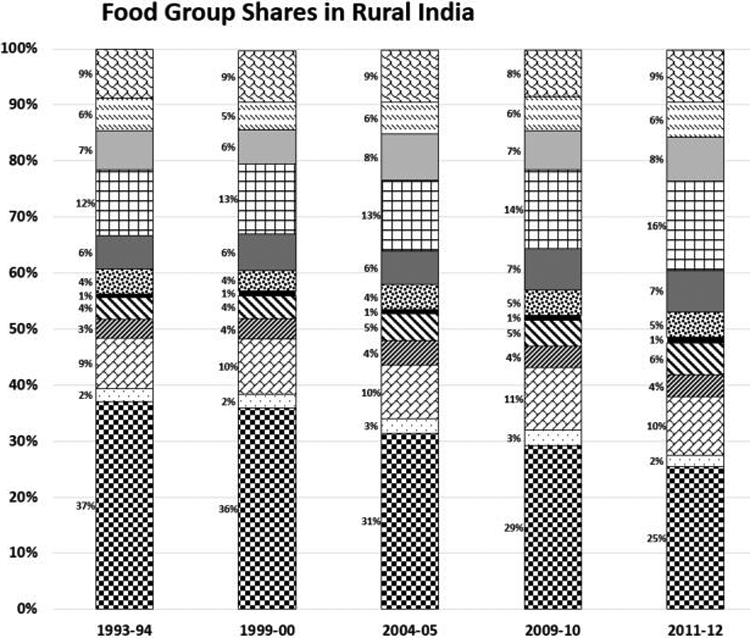
Change in food budget shares in rural India (1993-1994 to 2011-2012).
Percentage of Households That Did Not Consume Specific Food Groups in the Last 30 Days in 2011-2012.
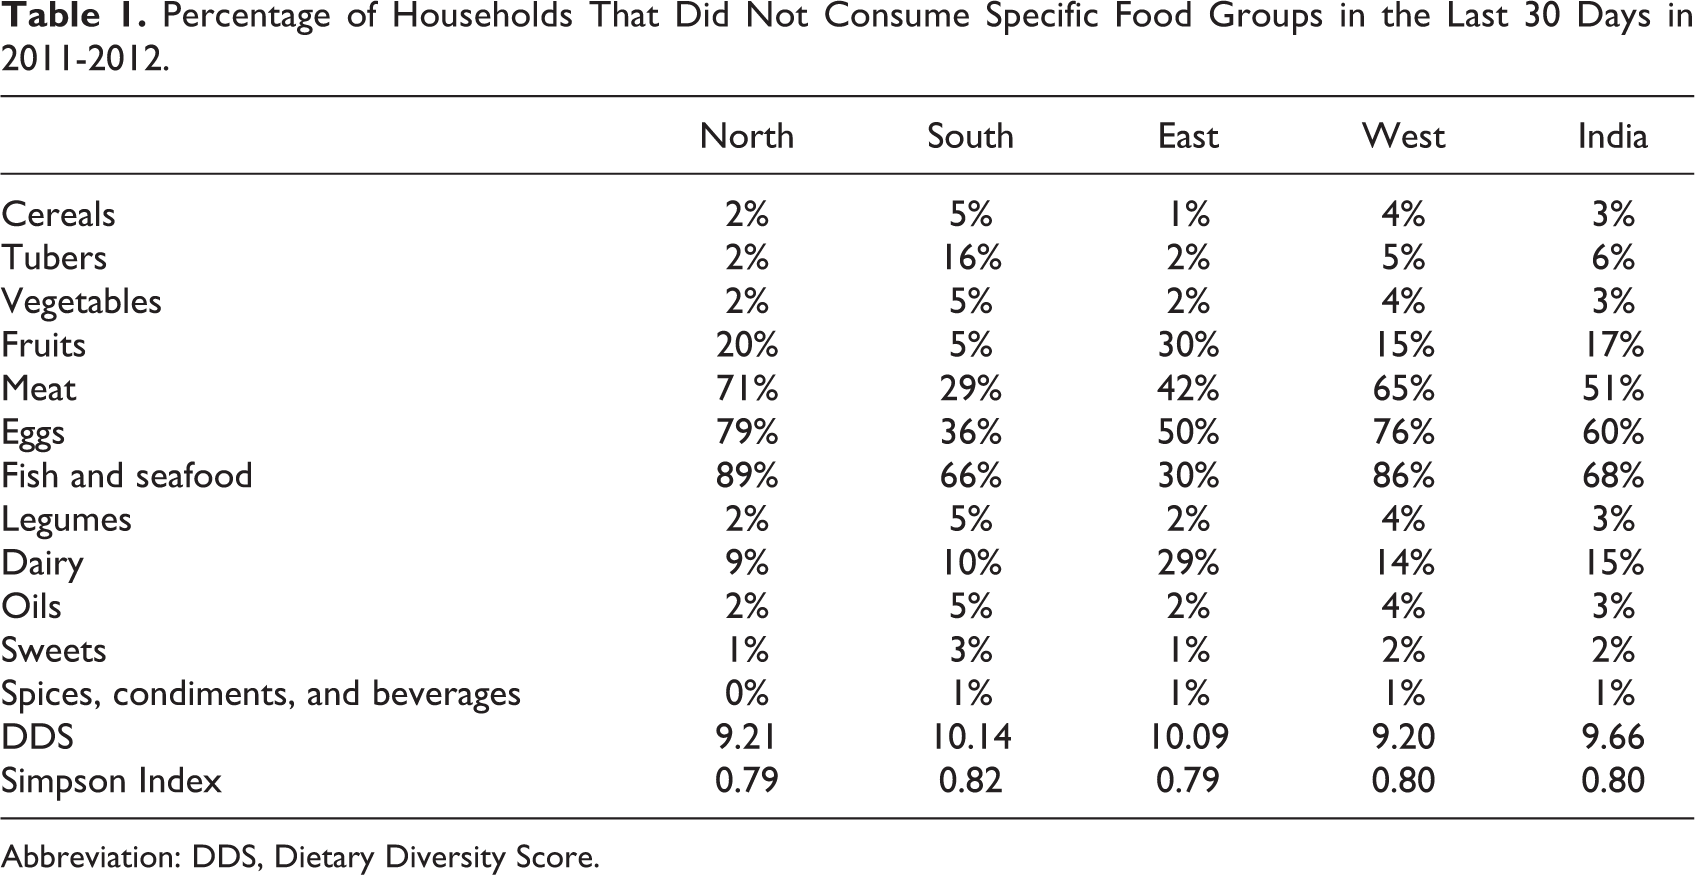
Abbreviation: DDS, Dietary Diversity Score.
A large proportion of households did not consume food groups that are rich in micronutrients during the recall period in 2011-2012. The rates of nonconsumption of animal-source foods other than dairy are striking. For example, 51% households in India did not consume any meat products during the recall month in 2011-2012, while 60% of households did not consume egg. While some of this may be attributable to cultural and taste preferences such as vegetarian diets, nonconsumption is also significant with certain other food groups. Even though milk is the second biggest contributor to Indian diets in terms of expenditure shares, 15% households did not consume it in the last 30 days in 2011-2012. Despite the low and declining quantity of per capita vegetable consumption quantity, almost all households consumed vegetables in the month preceding the survey. However, approximately 17% of households did not report consumption of any fruits.
There exist regional differences too in the consumption of micronutrient-rich foods. Significantly higher proportions of households in the North and the West reported nonconsumption of animal-source foods (other than dairy) compared to the South and the East. Nonconsumption of any vegetables in the past month was confined to a small minority across the country. However, the significant proportions of households in the East (30%), North (20%) and the West (15%) reported consuming no fruit at all in the recall period. In contrast, only 5% of households in the South reported nonconsumption of fruit.
Household dietary diversity and food budget shares by income groups
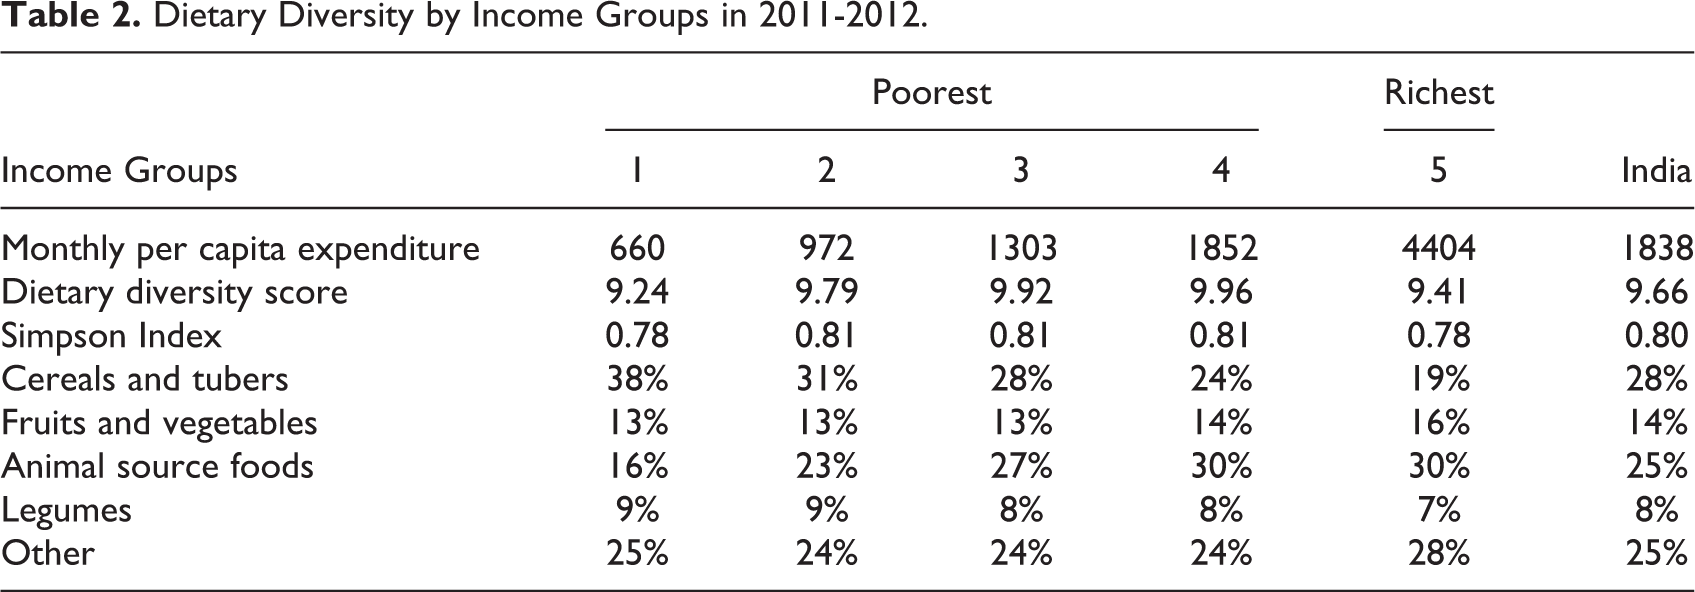
Table 2 presents HH dietary diversity and consumption patterns (Note 4) by income (Note 5) groups for 2011-2012. Households are divided into quintiles based on monthly per capita expenditure using population weights. The share of starchy food groups is seen to decrease as income increases. While the poorest income group spent 38% of their food expenditure on cereals and roots and tubers, the richest spent less than a fifth. However, the relationship between dietary diversity and income is not linear. Diets become more diverse as income increases, but the richest quintile of households actually has less diverse diets than households with half their total expenditures. However, the richest groups in terms of expenditure do have the lowest expenditure shares on starchy food groups and highest for micronutrient-rich foods such as fruits, vegetables, and animal sourced foods.
Dietary Diversity by Income Groups in 2011-2012.
Dietary Patterns
Given the diversity in culture and food preferences in India, 17 we next attempt to identify key patterns in diets across India. Results from the cluster analysis of dietary patterns are presented in Table 3. The cluster analysis identified 5 distinct types of dietary patterns in India for both 1993-1994 and 2011-2012 surveys. Furthermore, the 5 types of diets identified were consistent throughout the 2 decade period, that is, no new dietary pattern emerged between 1993-1994 and 2011-2012. Below we describe the 5 diets in detail along with general characteristics of households consuming these diets. The identified diets are named according to the major distinguishing characteristic of the diet. For example, a diet that has the highest budget share for cereals across the 5 patterns is named cereal-based diet. The other dietary clusters identified are processed foods heavy diet, dairy-based diet, balanced diet with dairy, and balanced diet with meat.
Dietary Patterns in India.
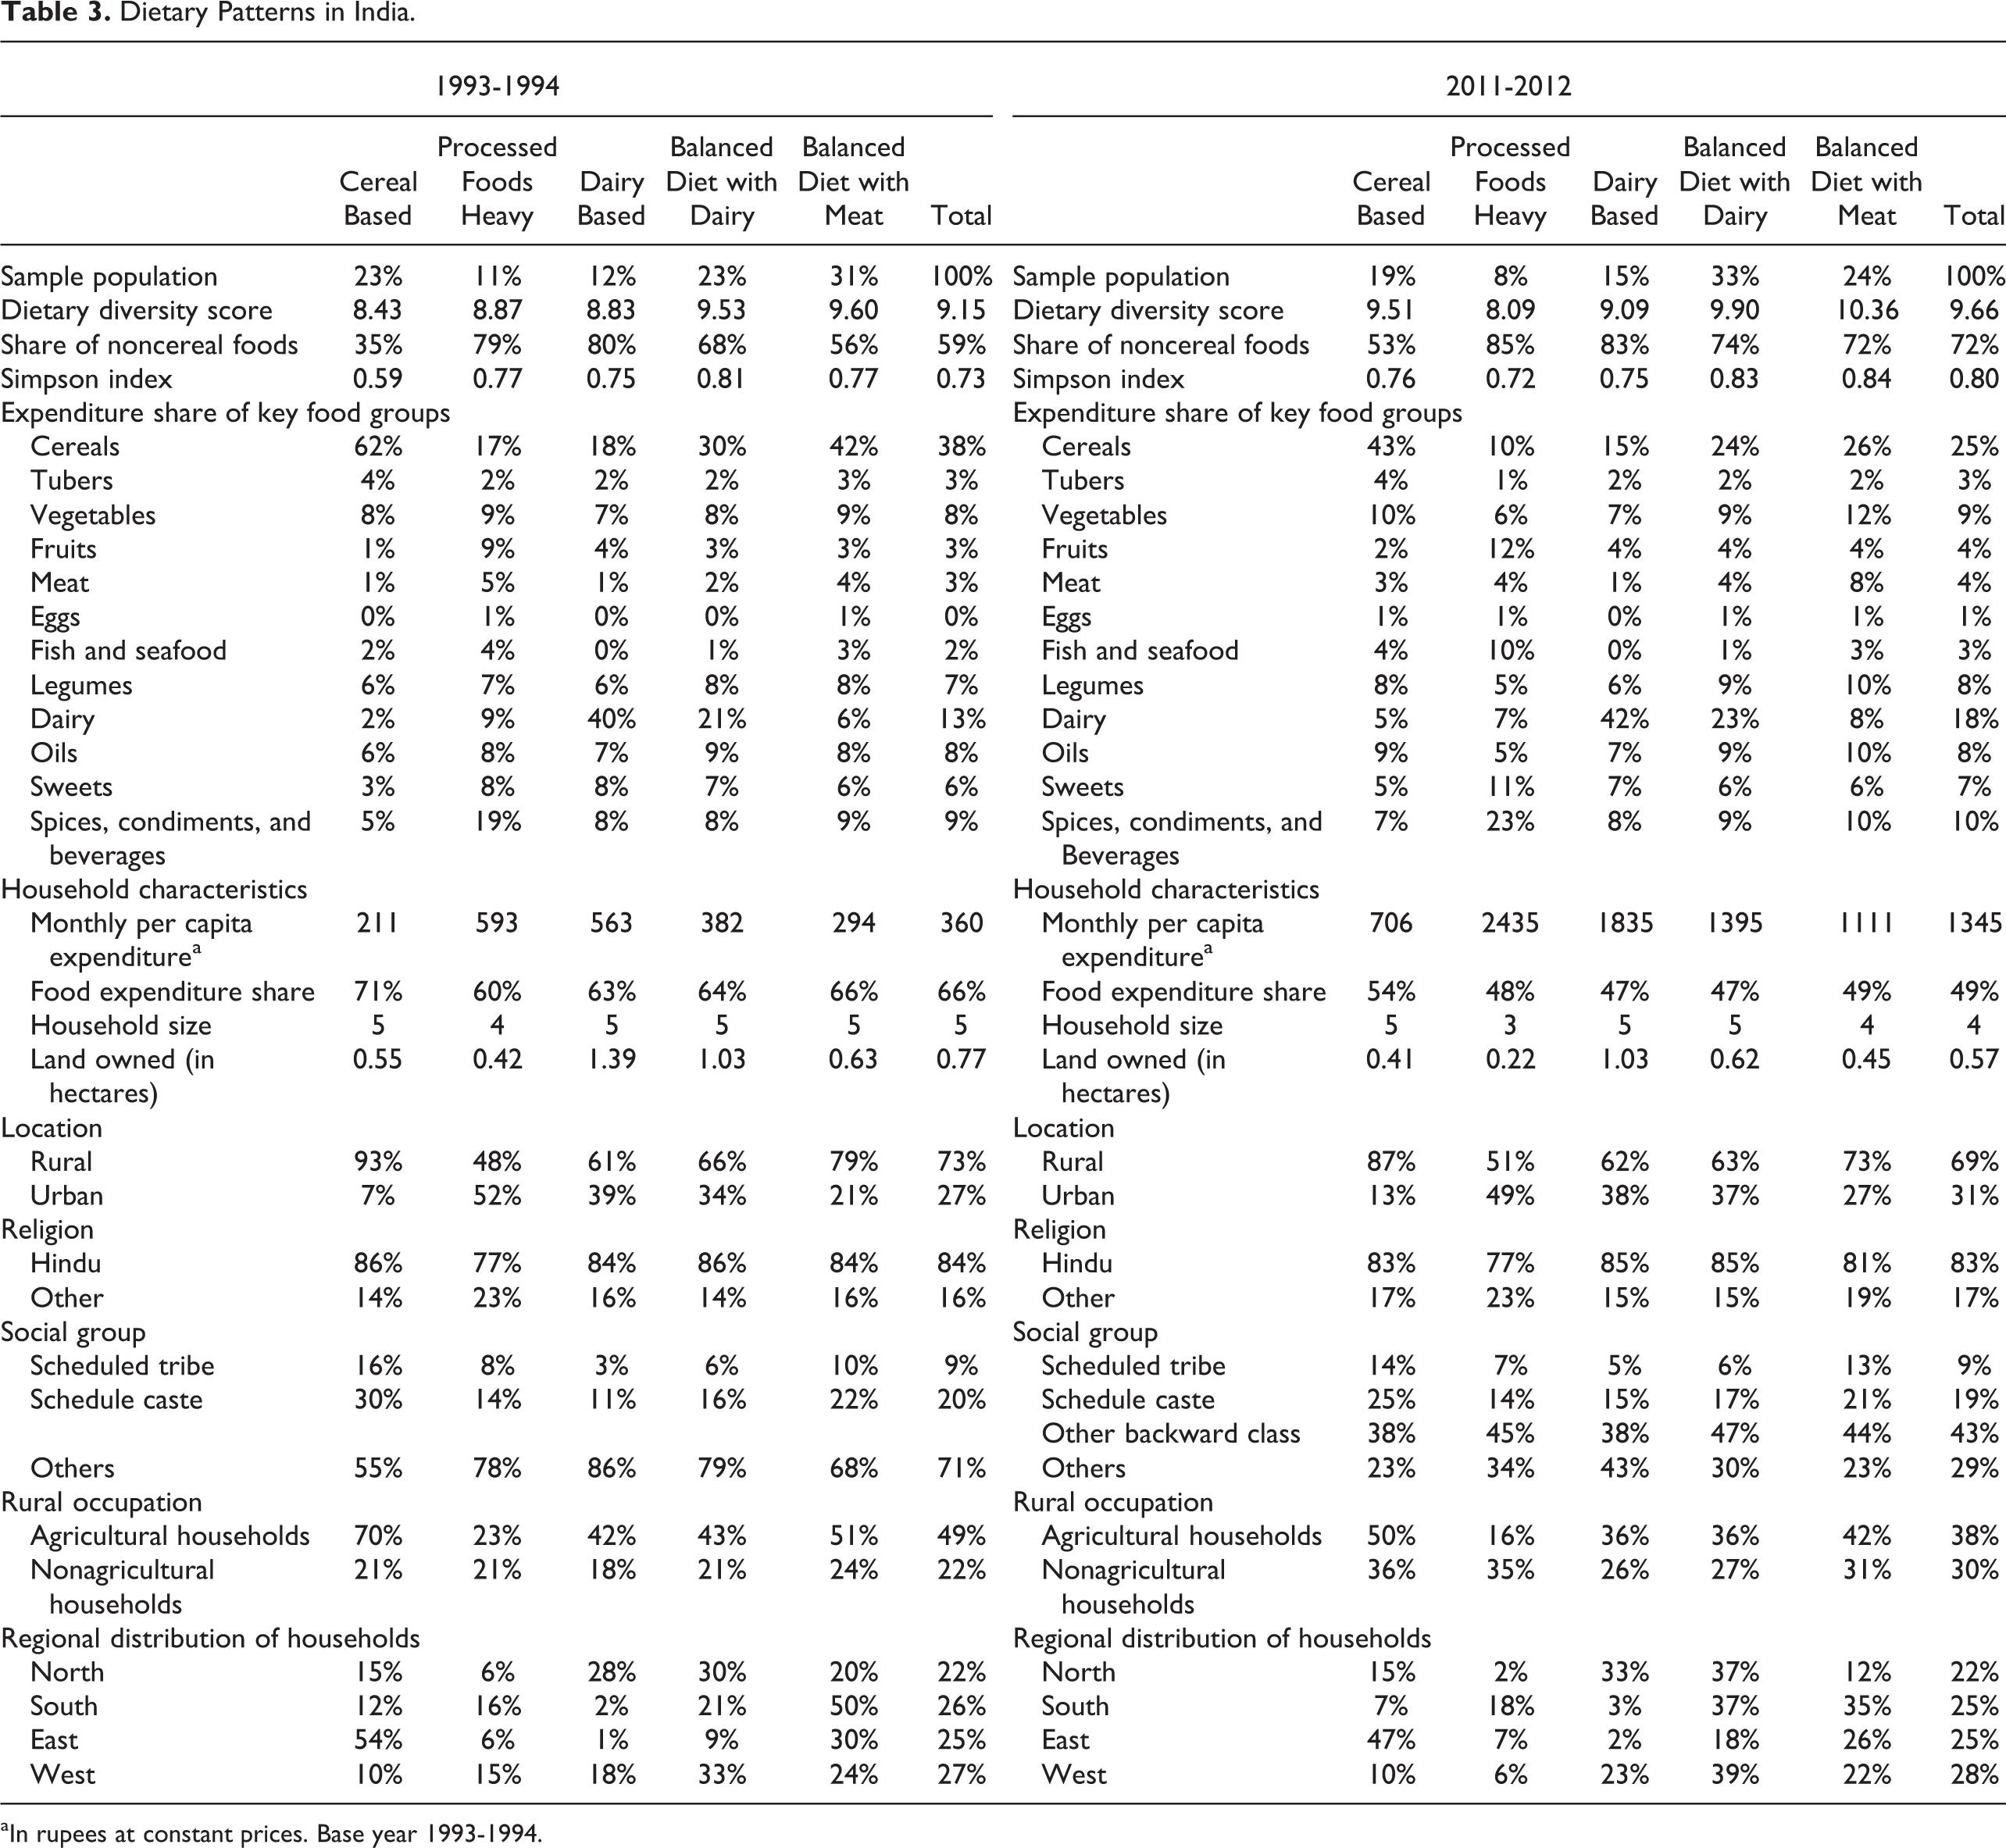
aIn rupees at constant prices. Base year 1993-1994.
The cereal-based diet is a traditional Indian diet that strongly relies on cereal consumption. At 43% in 2011-2012, the mean value of food share of cereals was highest for this diet type. Expenditure on other food groups was relatively small. In 2011-2012, approximately a fifth (19%) of the Indian population consumed the cereal-based diet. The vast majority of households (87%) with this dietary pattern were based in rural areas, and about half were classified as agrarian households. Those consuming this diet had the lowest average incomes (in expenditure terms) compared to the other dietary groups. This diet was prominent in the East of the country—43% of the household following the cereal-based diet in 2011-2012 were located in the East. Temporally, the prominence of cereals for this diet type declined over time in this diet, from 65% of the budget share in 1993-1994 to 47% in 2011-2012. Consumption of sweets; oils, spices, and condiments; and beverages has increased over time from 14% of the budget share to 21%. The average land owned (Note 6) by this group was 4.12 hectares in 2011-2012, the second lowest among the 5 defined dietary pattern groups.
The second type of diet is categorized as a diet with processed foods due to the highest spending (Note 7) on foods groups with processed foods. Food groups comprising sweets and spices and condiments, and beverages constituted 11% and 23% of the food budget share, respectively, in 2011-2012. This group spent the least on starchy foods and tubers; 8% of the sample consumed this diet in 2011-2012. Although the group was distributed evenly across urban and rural areas, the majority of the households were based in the South in 2011-2012. The proportion of households from the West consuming this diet declined from 15% in 1993-1994 to 6% in 2011-2012. Interestingly, diversity scores were amongt the lowest for this dietary pattern, while monthly per capita expenditure was highest and food budget share was the lowest. This group on average had the lowest land ownership and smallest household size.
The third type of diet includes a relatively large share of food expenditure on dairy products (42%) and thus is named dairy-based diet. Starchy foods constituted a sixth (15%) of the food expenditure in 2011-2012. This particular dietary pattern was less likely to include other animal source foods, such as fish and seafood, meat, and egg. Even though this dietary type spent over 80% of its budget share of noncereal foods, consumption of vegetables, fruits, and legumes was lower than other dietary patterns observed; 15% of the sample population consumed this diet in 2011-2012. This is predominantly a rural diet with 62% of these households based in rural areas, while 38% were urban households. Households were predominantly based in Northern India and the West.
The final 2 diet types were balanced diets, one with a greater proportion of dairy (33% of sample population) and the other with a greater proportion of meat (24% of sample population). The key distinguishing characteristic of these diets was a reasonably even spread of consumption proportion across food groups. In these groups, cereal proportions were neither as high as in the cereal-based diets nor as low as in the processed food heavy diets. Balanced diets with dairy were more likely to be encountered in the North and West of the country, while balanced diets with meat were more prevalent in the South. The households in these groups had the highest dietary diversity scores among all the groups and were typically located in the middle income quintiles.
Discussion and Conclusion
This article has explored trends in household dietary diversity in India across space and time. We have examined trends over almost 2 decades across the Indian states and regions using nationally representative data and have uncovered predominant dietary patterns in the country and how they overlay with socioeconomic status and geographical regions.
The MPCE quintiles in Table 2 present all India values to descriptively showcase the variation in dietary diversity indicators and food consumption shares across expenditure/income groups. This table does not present the variation across rural and urban India nor does it present state-level information. Thus, care must be taken in interpreting national-level aggregates. These aggregates are not generalizable at household level. Especially, urban and rural realities differ considerably in India. This is a limitation of the article. However, the national-level analysis contributes to literature by showcasing temproal and spatial understanding of food consumption and dietary patterns at a macrolevel in India.
Indian diets have slowly but steadily diversified since the 1990s, with rural diets becoming more diverse than urban by 2011-2012. Two key shifts in consumption patterns have been observed that have also been commented on by other authors. 5,8 Firstly, dependence on cereals has declined. Secondly, consumption of dairy foods has risen. However, although diets have diversified since the 90s, consumption of micronutrient foods remains dismally low especially in rural areas. Even by 2012, a significant proportion of the Indian population was unable to consume fruits, milk, meat, fish/seafood, or egg. Consumption of legumes has stagnated. At the same time, some foods associated with chronic diseases, such as edible oil, have expanded considerably in Indian diets.
The extent to which India continues to lag behind other parts of the world with respect to consumption of key micronutrient-rich foods is striking. Average 2011-2012 fruit and vegetable consumption of 154 g/person/day in rural areas and 181 g/person/day in urban areas as reported here is less than half the 400 g/person/day recommended by the World Health Organization and Food and Agriculture Organization. 18 Particularly worrying is our finding that vegetable consumption has actually declined since the early 1990s. Meat consumption, at 6 g/person/day in rural areas and 8 g/person/day in urban areas in 2011-2012, has increased over the 2 decades. Meat intake in India is a fraction of the intakes in the rest of Asia and very low even compared to its neighbours in South Asia (Flores-Martinez, 2016). 19 This is particularly concerning given that less than 30% (note 8) of the Indian population above the age of 15 years is actually vegetarian. 20 In a country where anemia among women is endemic, the lack of bioavailable iron via meats in the diet is a concern.
We have identified 5 predominant dietary patterns in India, namely, cereal-based diet, processed food heavy diet; dairy diet; balanced diet with dairy; and balanced diet with meat. Broadly, these dietary patterns have remained the same over the 2-decade period studied suggesting habit persistence. The traditional cereal-based diets are predominant in rural areas, particularly among agricultural households with low incomes (in expenditure terms) and land endowments. The dairy diet is common in higher income rural households. It involves lower cereal consumption and higher dairy intake than the traditional cereals diet but does not involve improved intakes of other foods. The processed food heavy diet can be found in both urban and rural areas and, in contrast to the cereal-based diet, is consumed largely by higher income households. The remaining 2 clusters, “balanced diet with dairy” and “balanced diet with meat,” present better dietary diversification and are consumed by a significant proportion of the population, particularly from the middle income quintiles. These diets provide an indication of the feasibility for improved diets in India taking into account socioeconomic and cultural constraints.
Several policy and research implications follow from this research. Unsurprisingly, there is a strong regional dimension to Indian diets and dietary adequacy. In terms of targeting, a focus on the North and the West is advisable, where dietary diversity is lowest and diversifcation from traditional cereal-based diets tends to be limited to an expansion in dairy food intake. The South and, to a lesser extent, the East are on better dietary trajectories.
Secondly, a particular effort is needed to improve fruit, vegetable, and meat intakes in India. Several factors underlie low observed historical intakes of fruits and vegetables (F&V) and meat, including poverty, habits, culture, and government strategies and policies. Sustained economic growth in the country has increased demand, boosting the potential of “high-value” agriculture, including F&V and meat production, for smallholders. High transactions costs of linking smallholders to markets and inadequate infrastructure have been identified as major obstacles to producer response. 21,22 Gandhi and Namboodri 23 characterize F&V value chains in India as highly inefficient marketing structures with numerous poorly coordinated middlemen, limited flows of information, and high proportions of spoilage due to inadequate infrastructure. A concerted research as well as policymaking effort focused on overcoming these constraints to deliver reliable, safe, and inexpensive supplies of fruit, vegetable, and meat supplies remains important.
Thirdly, and related to the point above, policy debates on Indian agriculture and food systems have tended to revolve around food security and poverty and hunger eradication aims. This is understandable, as feeding India’s large, growing and predominalty poor population has historically been a fundamental and monumental challenge. As several authors have pointed out, 24,25 the research and policy focus has overwhelmingly been on calorie (and cereal) provision, with a corresponding neglect of dietary quality and provision of micronutrient-rich foods in Indian diets. However, as incomes have improved in India and important strides have been made towards food security, improvement in dietary quality must become an additional aim.
Footnotes
Appendix A
Authors’ Note
M.T. and B.S. conceptualized and designed the study. M.T. analyzed the study and wrote the first draft. B.S. and S.K. reviewed subsequent versions and added policy recommendations.
Declaration of Conflicting Interests
The author(s) declared no potential conflicts of interest with respect to the research, authorship, and/or publication of this article.
Funding
The author(s) disclosed receipt of the following financial support for the research, authorship, and/or publication of this article: M.T. would like to thank LCIRAH for supporting the doctoral studies at SOAS. This article is part of the research generated by the Leveraging Agriculture for Nutrition in South Asia Research (LANSA) research consortium and is funded by UK aid from the UK Government. The views expressed do not necessarily reflect the UK Government’s official policies.