
Abstract
Background:
Cross-sectional surveys using the Standardized Monitoring and Assessment of Relief and Transitions methodology have been conducted annually in Chad since 2015 to evaluate population-level nutritional status.
Objective:
This analysis characterizes national and subnational trends in child wasting and women’s thinness from 2015 to 2021 in Chad and identifies risk factors during the COVID-19 pandemic.
Methods:
Annual survey data with 12,000 to 15,000 households were included. Wasting was estimated for children 6 to 59 months using the WHO child growth standards, and among women 15 to 49 years, thinness was defined as mid-upper arm circumference <23 cm. Trends were stratified by agroecological zone, and chi-square tests used to assess statistical significance. Simple and multivariate logistic regression models were conducted for 2020 and 2021 to identify risk factors of wasting and thinness.
Results:
About 11,958 to 17,897 children and 9883 to 15,535 women contributed values each year. National wasting and thinness rates did not significantly decrease over the 7-year period (wasting: 14.1% to 12.1%, P = .43; thinness: 15.2% to 13.4%, P = .51) and wasting rose from 2020 to 2021. The Saharan and Sahelian zones had consistently higher rates compared to the Sudanian zone. Younger age, male sex, inadequate infant and young child feeding practices, and poorer household socio-economic factors were associated with greater odds of child wasting. For women, younger age, lack of nutrition knowledge, and poorer household socio-economic factors increased the odds of thinness.
Conclusions:
Undernutrition in Chad has not improved since 2015, and the COVID-19 pandemic likely exacerbated the crisis among children nationally and among women subnationally. Multisectoral approaches and regional targeting of interventions are recommended.
Plain language title
Undernutrition Among Women and Children in Chad: A Persistent Challenge Exacerbated by the COVID-19 Pandemic
Plain language summary
Standardized Monitoring and Assessment of Relief and Transitions (SMART) surveys have been conducted annually in Chad since 2015. These nationally representative surveys capture data on women and children’s health and nutrition condition. In this study, we conducted a secondary data analysis of SMART surveys to explore if rates of undernutrition have changed over the past 7 years, and whether the pandemic played a role. We also explored what factors were associated with children and women’s nutritional status in 2020 and 2021, specifically. Our findings indicate that rates of undernutrition in Chad have remained high, with 12.1% of children younger than 5 years suffering from wasting and 13.4% of women of reproductive age experiencing thinness in 2021. While wasting appeared to be on the decline between 2018 and 2020, the COVID-19 pandemic likely contributed to an uptick seen in 2021. Conversely, women’s thinness at the national level experienced little change before or during the pandemic. Differences in undernutrition by region were apparent; the Saharan and Sahelian zones experienced consistently higher rates of wasting and thinness compared to the Sudanian zone. However, in 2021, the Sudanian zone experienced a considerable increase in wasting and thinness not observed in the rest of the country, indicating potential regional differences in the pandemic’s effect on food security and nutritional status. In the pandemic period, regional differences in wasting could be only somewhat explained by infant and young child feeding practices. Other important predictors included child age, sex, and household socioeconomic factors. Risk factors for women’s thinness included younger age, lack of nutrition knowledge, and lower household socioeconomic status. These findings highlight the need for multisectoral interventions for the prevention of undernutrition, and regional targeting of treatment programs to address high burden areas in Chad.
Introduction
Chad, a landlocked nation in the African Sahel, is among the least developed countries, ranking 187 out of 189 on the Human Development Index in 2019. 1 Poverty and food insecurity are prevalent and were likely exacerbated by the COVID-19 pandemic. An analysis of the economic impacts of COVID-19 in Chad observed that impacts were greatest among already vulnerable groups which is consistent with evidence from a multi-country study in sub-Saharan Africa. 2,3 At a global level, COVID-19 related lockdowns, supply chain disruptions, and price inflation have led to decreases in household income and purchasing power, which has caused a marked increase in food insecurity. An estimated 2.3 billion people, or 11.7% of the global population, were moderately or severely food insecure in 2021. 4
Food security in Chad deteriorated markedly from 2020 to 2021, and by mid-2021, 1.8 million people in Chad were facing crisis or above levels of food insecurity (Integrated Food Security Phase Classification 3 or above)—a 75% increase since 2020 and the highest level ever recorded in Chad. The Sahelian zone and Lake Chad Basin areas of the country were the most affected due primarily to increased conflict and insecurity, with weather extremes and economic shocks also contributing to rises in food insecurity in 2021. 5
Owing to the high level of food insecurity and other factors including poor access to health care, poor sanitary practices, and poor infant and young child practices, the prevalence of all forms of malnutrition remains high with over 1.6 million Chadian children suffering from global acute malnutrition. 6
The Chad Ministry of Public Health has conducted annual Standardized Monitoring and Assessment of Relief and Transitions (SMART) surveys since 2015, a standardized approach for assessing the crude mortality rate and prevalence of acute malnutrition, among other health indicators. 7 This data can be leveraged to understand spatialtemporal trends in nutrition outcomes, the factors associated with them, and the impacts of COVID-19.
This analysis describes national trends in undernutrition, including wasting in children 6 to 59 months of age and thinness in women of reproductive age for the 6-year period leading into and during the onset of the COVID-19 pandemic. In addition, risk factors for wasting in both children and women are explored for 2020 and 2021 with the aim of identifying at risk groups and informing national nutrition policies and programs in the post-pandemic period.
Methods
We conducted a secondary data analysis of SMART surveys implemented in Chad by the Ministry of Public Health along with other nongovernmental partners from 2015 to 2021. The surveys were conducted in all 23 administrative provinces annually, though conflict-affected subdivisions were excluded. Surveys were typically conducted between July and September to capture the “lean” or hunger season, apart from 2015 and 2020, when they occurred between October and December. The target population included children under 5 years of age (0-59 months), and women of reproductive age (15-49 years). The methodology and data collection procedures for each survey year are detailed in the annual reports. 8 -14
Briefly, the cross-sectional surveys applied a 2-stage design where clusters are allocated based on probability proportional to population size using census data to produce representative samples at the national and regional levels. This was followed by a second stage random sampling to select households within the identified clusters. Sample sizes ranged from approximately 12,000 to 15,000 households each year and were calculated using the Emergency Nutrition Assessment for SMART software. 15
Questionnaires were administered at the household level to collect socio economic information, including income sources and education level. In 2020, heads of household responded to a COVID-19 specific questionnaire to assess knowledge of COVID-19 symptoms and preventative measures, and the pandemic’s impact on the household. Women 15 to 49 years of age were interviewed to collect mid-upper arm circumference (MUAC), pregnancy status, receipt of nutritional advice, and knowledge of essential nutrition behaviors. For each child under 5 years of age, measures of weight, height, MUAC, and oedema were conducted. Additionally, child age, sex, morbidity, and receipt of health services were reported. Among children aged 6 to 23 months, the World Health Organization infant and young child feeding (IYCF) questionnaire was administered to collect information on child diet and feeding practices. 16 Details on data collection and monitoring are available in the final reports.
For this analysis, child wasting and women’s thinness were used as indicators of acute malnutrition and were the outcomes of interest. Wasting was defined as weight-for-height z-score less than −2 SD, based on the 2006 WHO child growth standards. 17 Women’s thinness was defined as a MUAC of less than 23.0 cm, as defined in the survey reports. Data collected from the IYCF questionnaire included information on 8 food groups consumed throughout the previous day. Minimum dietary diversity (MDD) was defined as consumption of ≥5 food groups during the previous day. Minimum meal frequency (MMF) was defined as breastfed infants receiving 2 or 3 feedings of solid, semi-solid, or soft foods for those 6 to 8 months and 9 to 23 months, respectively, and nonbreastfed infants aged 6 to 23 months receiving 4 feedings of solid, semi-solid, or soft foods or milk feeds where at least one of the feedings included solid, semi-solid, or soft foods. Minimum acceptable diet (MAD) was defined as achieving both MDD and MMF. 16 Other covariates of interest for women and children included agroecological zone (Saharan, Sahelian, and Sudanian) and head of household marital status, education level, and primary income source. For women, age, pregnancy status, receipt of nutrition counseling in the past 3 months, and self-reported knowledge of women’s nutrition and anemia prevention were investigated; and for children, sex and age were included as covariates.
Annual prevalence of wasting in children younger than 5 years and thinness in women, stratified by agroecological zone and province, was assessed from 2015 to 2021; chi-square tests were conducted to determine if differences between years were statistically significant (P < .05). Regression analyses were performed for the 2020 and 2021 data after linking household questionnaire data to the women and child data, respectively. Simple logistic regression models were conducted to analyze the relationship between acute malnutrition and the individual and household characteristics independently for child and woman outcomes. Multivariate regression models were performed for each variable that had a significant odds ratio in the simple regression for that year, adjusted for the other significant variables. For the MAD IYCF regression models, other significant IYCF variables were excluded to avoid collinearity. Analyses were performed using Stata version 15 and R statistical software. 18,19 The study was reviewed by the Johns Hopkins University Bloomberg School of Public Health Institutional Review Board and received a not human subjects research determination.
Results
Trends in acute malnutrition in Chad are presented for 2015 to 2021. An in-depth analysis of the most recent years, 2020 and 2021, follows to examine risk factors for child wasting, poor IYCF practices and women’s thinness.
Trends in Acute Malnutrition, 2015 to 2021
Wasting values were available for 11,958 to 17,897 children aged 6 to 59 months and thinness values were available for 9883 to 15,535 women. In 2015, the national prevalence of wasting among children 6 to 59 months of age was 14.1% (95%CI: 13.6-14.7) and in 2021 the prevalence was 12.1% (95%CI: 11.5-12.6); there were no significant differences in national or regional wasting prevalence between 2015 and 2021 (Figure 1 and Supplementary Table 1). The Saharan zone consistently had the highest prevalence of child wasting from 2015 to 2021, with large variability over time and across the 4 provinces within the zone. In 2017, Ennedi Est and Ennedi Ouest experienced the highest rates of wasting across all provinces over the 7-year period, at 29.1% (95%CI: 25.1-33.1) and 26.9% (95%CI: 22.5-31.3), respectively (Supplementary Table 2). The overall prevalence of wasting in the Saharan zone decreased significantly from 20.2% (95%CI: 16.8-23.6) in 2015 to 14.4% (95%CI: 13.0-15.9) in 2021 (P = .07). In the Sahelian zone, annual wasting prevalence ranged from 10% to 25% in the various provinces, and the zone average was consistently above the national prevalence rate each year. In N’Djamena, the prevalence of wasting decreased from 16.8% (95%CI: 14.6-18.9) in 2015 to 11.2% (95%CI: 8.6-13.9) in 2021, a difference that was not statistically significant (P = .05). In the Sudanian zone, wasting prevalence was consistently low and increased modestly between 2015 (6.8%, 95%CI: 6.1-7.5) and 2019 (10.0%, 95%CI: 9.0-10.9), and then fell to 5.3% in 2020 (95%CI: 4.6-6.0) before rising again to 8.2% (95%CI: 7.4-9.0) in 2021.
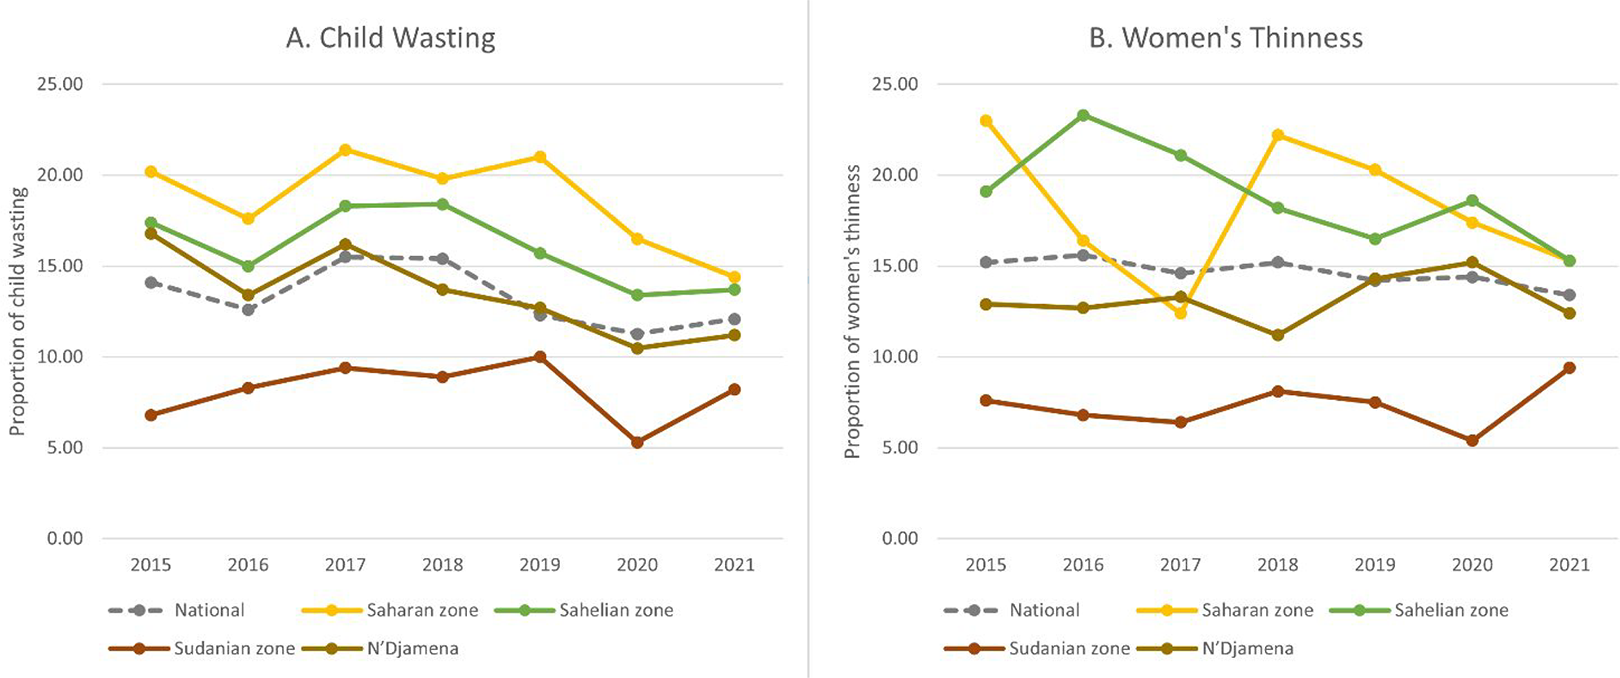
Trends in the prevalence of wasting in children younger than 5 years and thinness in women of reproductive age by agroecological zone in Chad, 2015 to 2021.
The national prevalence of women’s thinness remained fairly consistent over time, beginning at 15.2% (95%CI: 14.6-15.8) in 2015 and ending at 13.4% (95%CI: 12.8-14.0) in 2021 (P = .51; Figure 1). In the Saharan zone, women’s thinness rates varied considerably by year and province, with Ennedi Est and Ennedi Ouest experiencing consistently higher levels of thinness than the national average. In the Saharan zone, there was a statistically significant decline in women’s thinness from 2015 to 2021 (P = .02, Supplementary Table 3) despite high variability in 2017 and 2018. In the Sahelian zone, most provinces had higher rates of thinness than the national average, and the zone average declined from 19.1% (95%CI: 18.2-20.0) in 2015 to 15.3% (95%CI: 14.4-16.2) in 2021, though this difference was not significant (P = .22). Kanem province had the highest prevalence of women’s thinness, where the rate exceeded 30% in 2016, 2017, and 2019. The Sudanian zone had the lowest rates of women’s thinness from 2015 to 2020, between 7.6% (95%CIs: 6.8-8.4) and 5.4% (95CI: 4.7-6.1) (Supplementary Table 4). However, in 2021, all provinces in the Sudanian zone experienced an increase in women’s thinness compared to 2020, though the zone average (9.4%, 95%CI: 8.5-10.3) remained below the national rate (13.4%, 95%CI: 12.8-14.0).
Characteristics of Children, Women, and Households in 2020 and 2021
Data were available for 13,518 and 13,735 children 6 to 59 months of age in 2020 and 2021, respectively. Across both years, there were slightly more boys in the sample than girls (52.1% and 51.2%) and age was evenly distributed (Table 1). Among children 6 to 23 months of age, 63.6% and 65.1% achieved MMF in 2020 and 2021, respectively. Attainment of MDD was low across both years (8.5% and 12.2%), as was MAD (5.2% and 9.4%; Table 2).
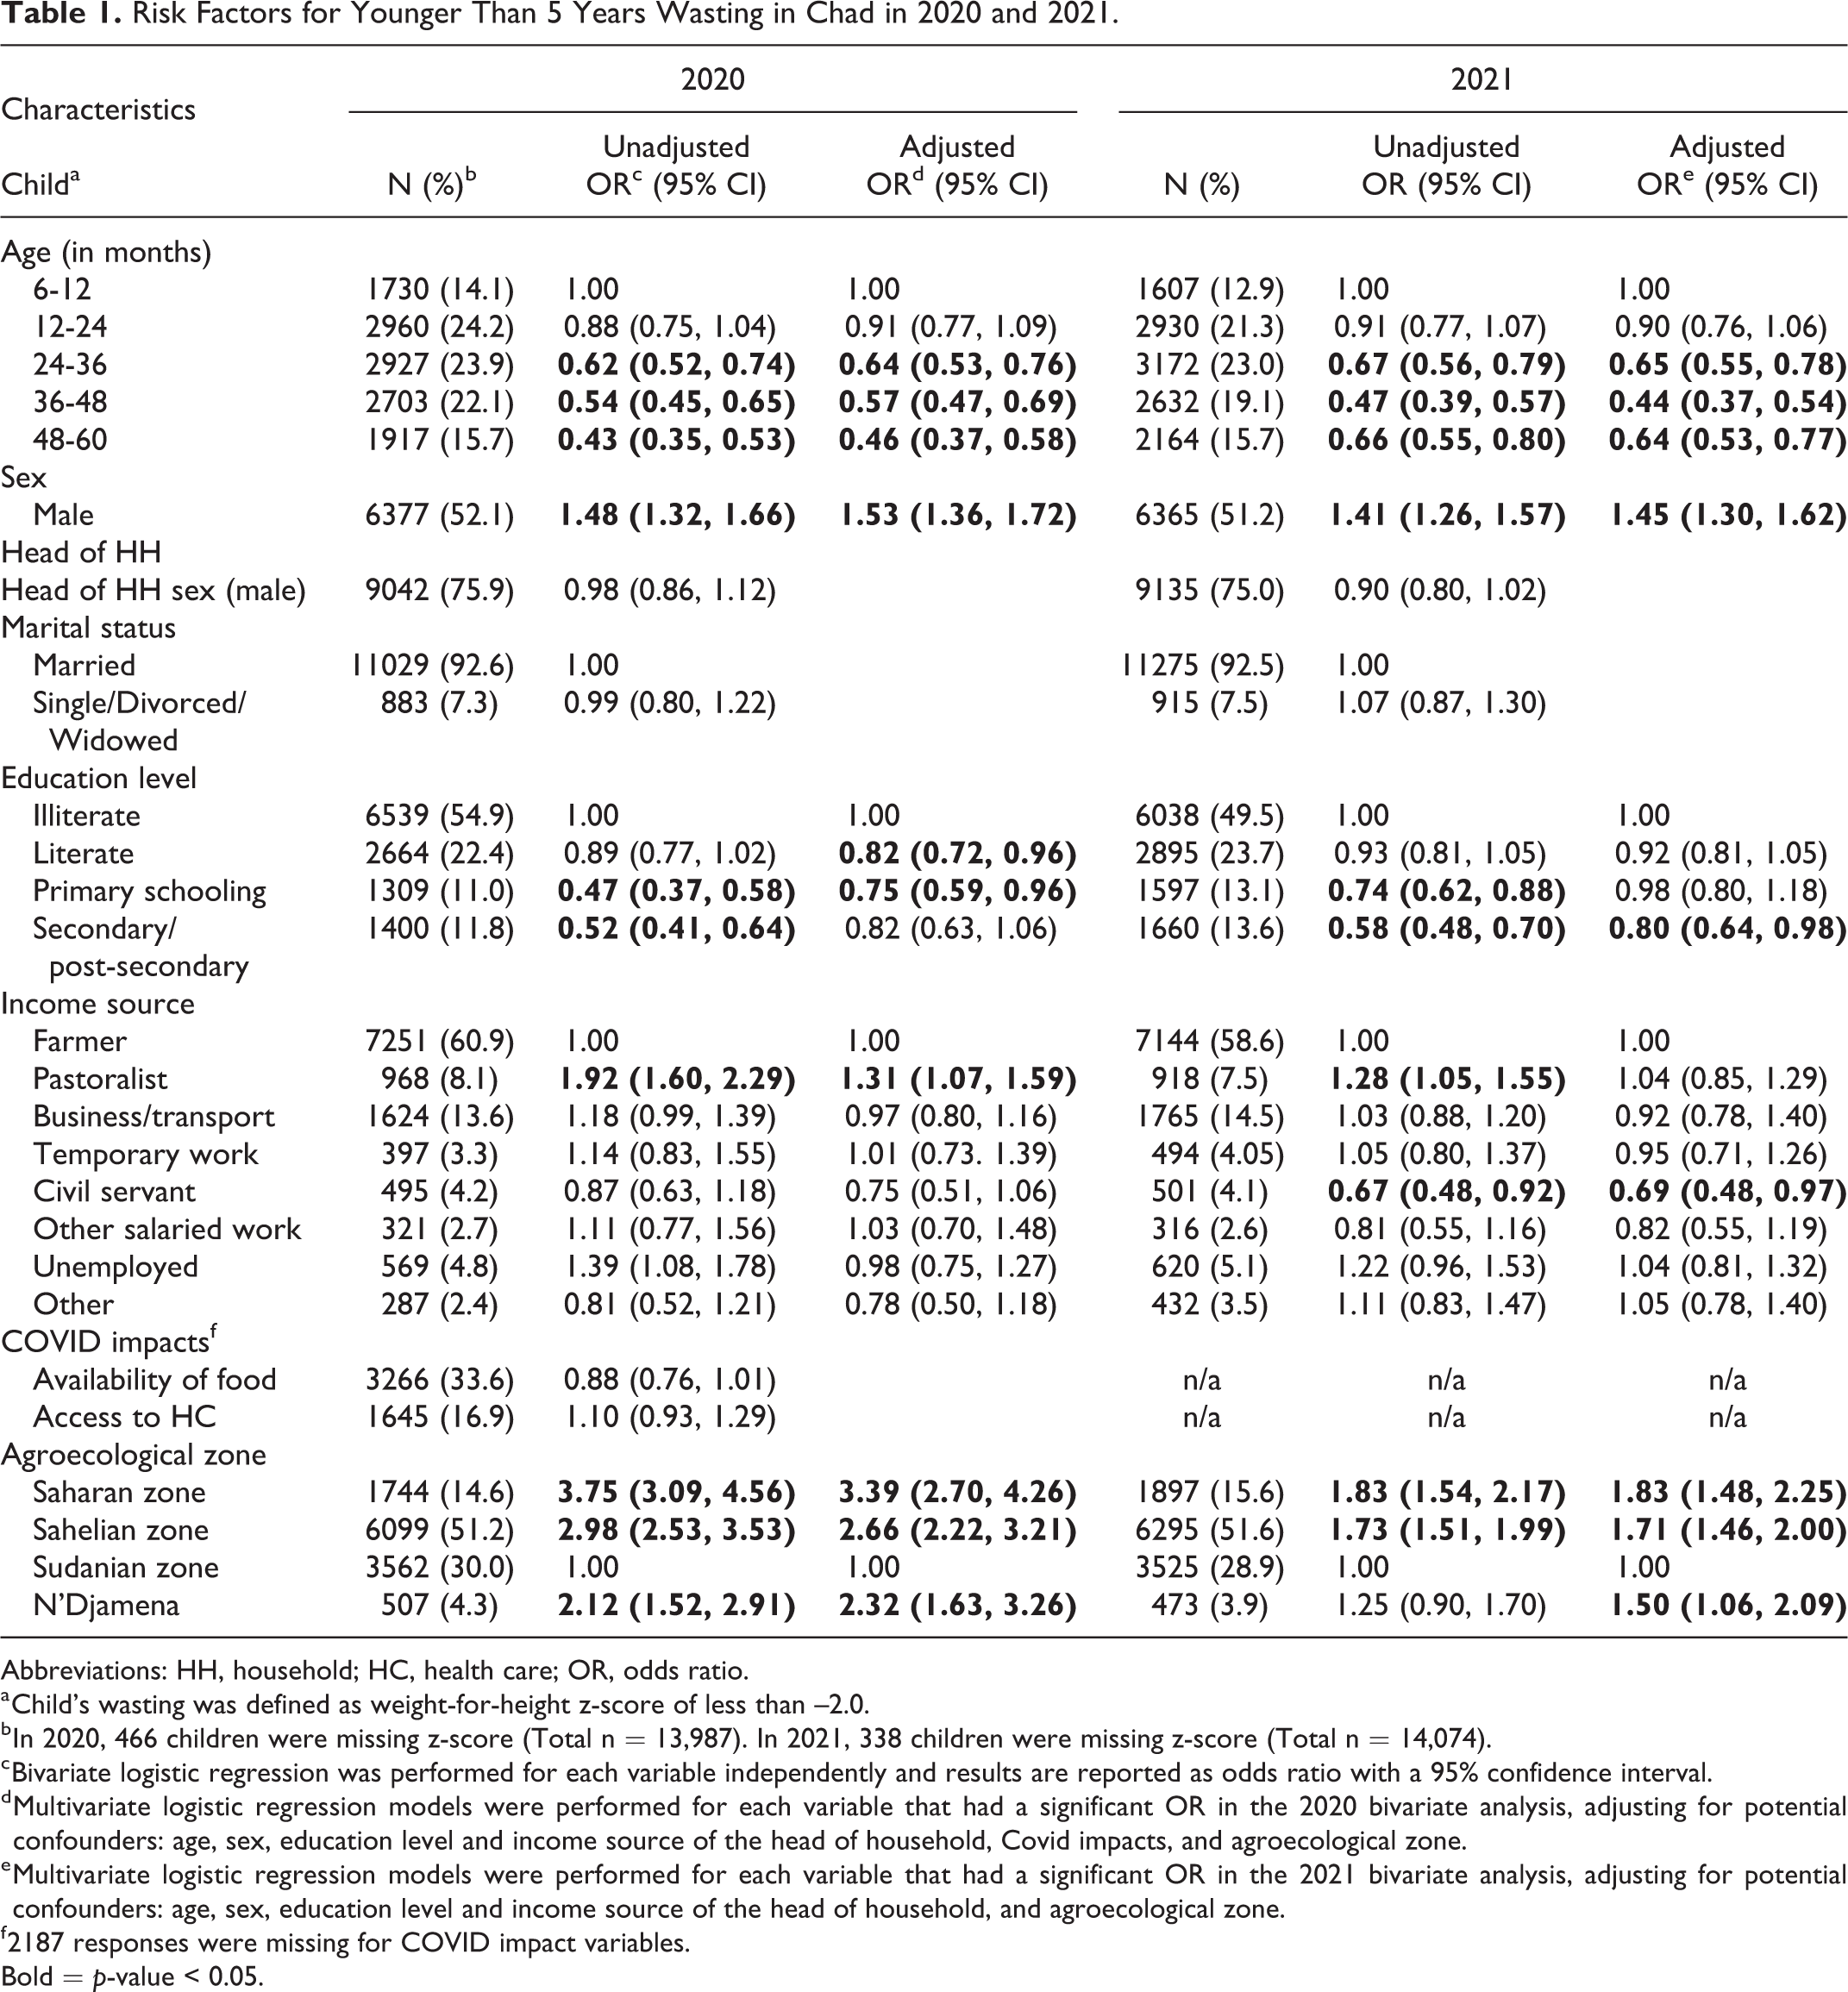
Risk Factors for Younger Than 5 Years Wasting in Chad in 2020 and 2021.
Abbreviations: HH, household; HC, health care; OR, odds ratio.
a Child’s wasting was defined as weight-for-height z-score of less than –2.0.
b In 2020, 466 children were missing z-score (Total n = 13,987). In 2021, 338 children were missing z-score (Total n = 14,074).
c Bivariate logistic regression was performed for each variable independently and results are reported as odds ratio with a 95% confidence interval.
d Multivariate logistic regression models were performed for each variable that had a significant OR in the 2020 bivariate analysis, adjusting for potential confounders: age, sex, education level and income source of the head of household, Covid impacts, and agroecological zone.
e Multivariate logistic regression models were performed for each variable that had a significant OR in the 2021 bivariate analysis, adjusting for potential confounders: age, sex, education level and income source of the head of household, and agroecological zone.
f 2187 responses were missing for COVID impact variables.
Bold = p-value < 0.05.
IYCF Indicators and Odds of Wasting Among Children 6 to 23 Months in Chad in 2020 and 2021.
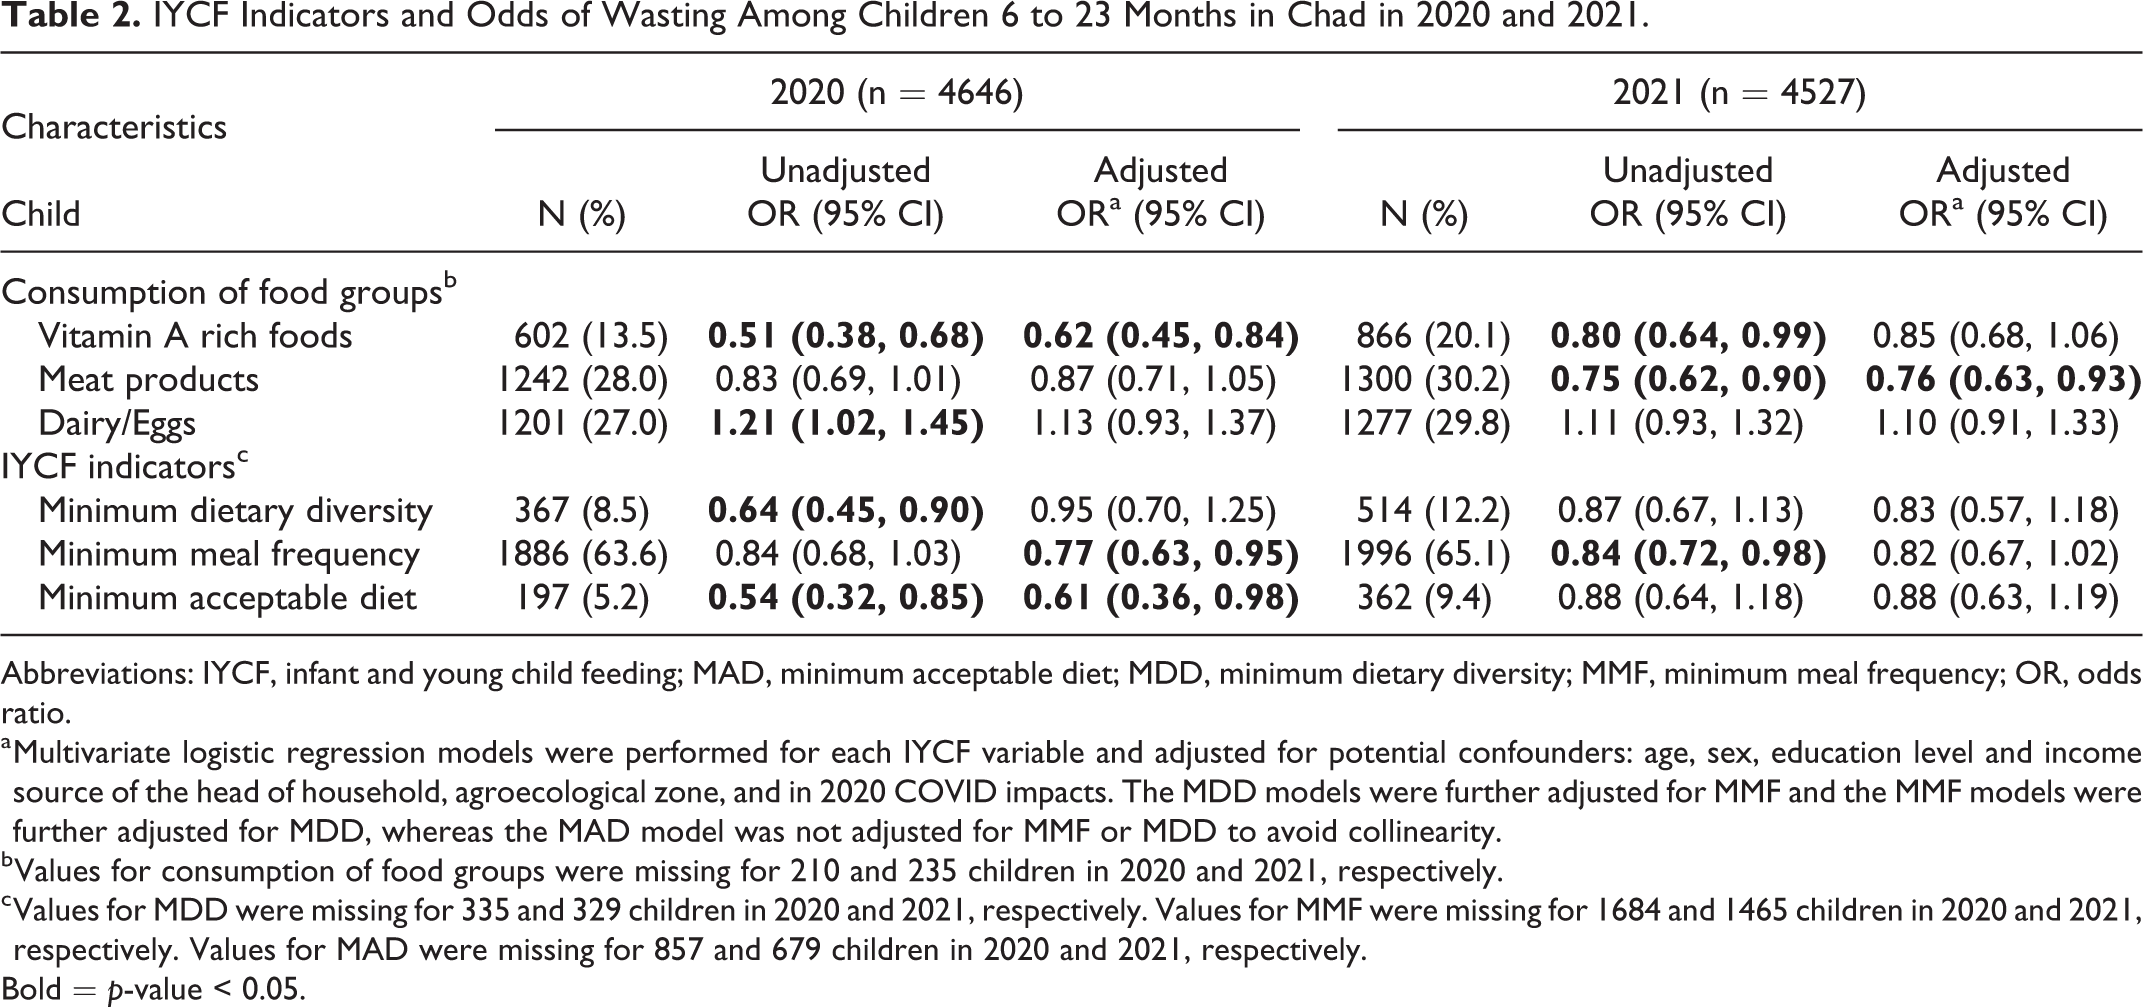
Abbreviations: IYCF, infant and young child feeding; MAD, minimum acceptable diet; MDD, minimum dietary diversity; MMF, minimum meal frequency; OR, odds ratio.
a Multivariate logistic regression models were performed for each IYCF variable and adjusted for potential confounders: age, sex, education level and income source of the head of household, agroecological zone, and in 2020 COVID impacts. The MDD models were further adjusted for MMF and the MMF models were further adjusted for MDD, whereas the MAD model was not adjusted for MMF or MDD to avoid collinearity.
b Values for consumption of food groups were missing for 210 and 235 children in 2020 and 2021, respectively.
c Values for MDD were missing for 335 and 329 children in 2020 and 2021, respectively. Values for MMF were missing for 1684 and 1465 children in 2020 and 2021, respectively. Values for MAD were missing for 857 and 679 children in 2020 and 2021, respectively.
Bold = p-value < 0.05.
Among women of reproductive age, data were available for 11,737 and 12,525 women in 2020 and 2021, respectively. Across both years, age was normally distributed and almost half of the women were nonpregnant and nonlactating (46.3% and 48.4%), about a third were lactating only (35.5% and 34.0%), less than a fifth were pregnant only (17.3% and 16.4%), and few were both pregnant and lactating (0.9% and 1.2%; Table 3). In both years, approximately a fifth (21.3% and 21.8%) of women received nutrition counseling in the previous 3 months, and a quarter reported some knowledge of women’s nutrition (26.4% and 27.2%) and less than 7% reported knowledge of anemia prevention.
Risk Factors for Thinness in Women of Reproductive Age in Chad in 2020 and 2021.
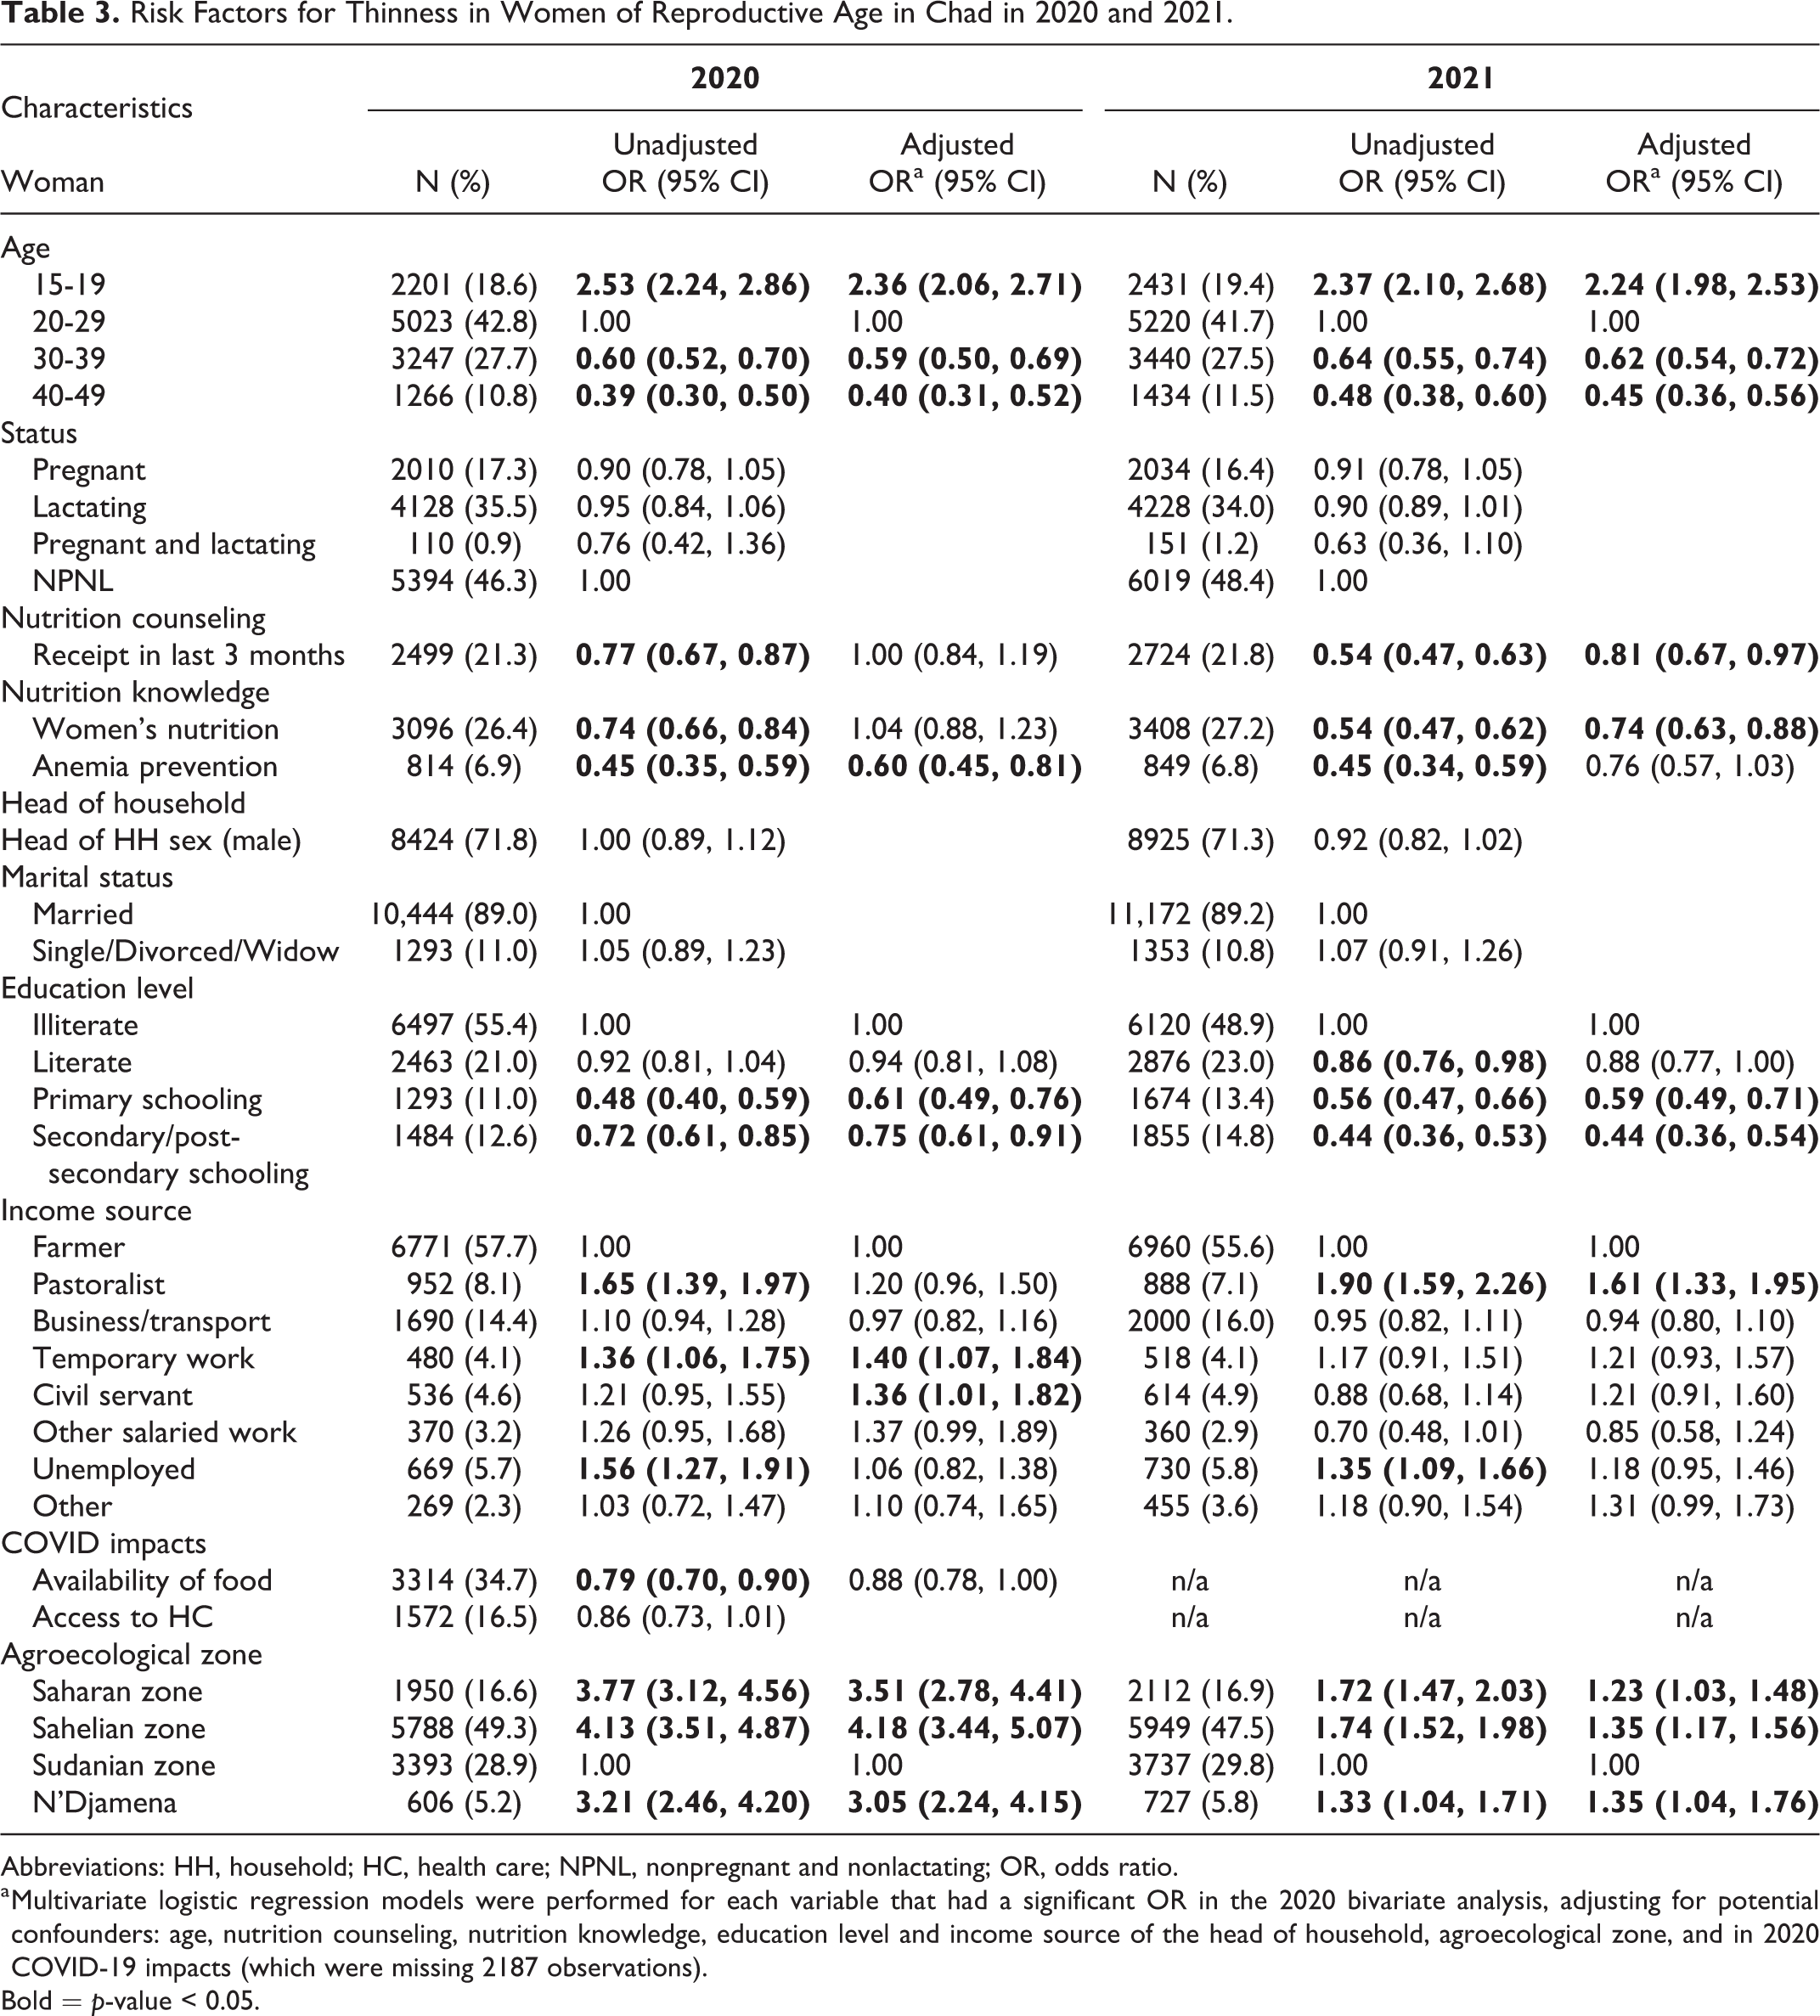
Abbreviations: HH, household; HC, health care; NPNL, nonpregnant and nonlactating; OR, odds ratio.
a Multivariate logistic regression models were performed for each variable that had a significant OR in the 2020 bivariate analysis, adjusting for potential confounders: age, nutrition counseling, nutrition knowledge, education level and income source of the head of household, agroecological zone, and in 2020 COVID-19 impacts (which were missing 2187 observations).
Bold = p-value < 0.05.
Household characteristics of the sampled children and women in 2020 and 2021 are presented in Tables 1 and 3, respectively, and the distributions are similar. Most households were male headed (71.8%-71.3%) and the majority were married (89.0%-92.6%). Approximately half of household heads were illiterate (48.9%-55.4%) and the most common primary income source was farming (55.6%-60.9%). In 2020, 34.7% of households reported that the COVID-19 pandemic negatively impacted their ability to access food and 16.5% reported it affected their ability to access health services. About half of households resided in the Sahelian zone, less than one-third in the Sudanian zone, about 15% in the Saharan zone, and roughly 5% in N’Djamena.
Determinants of Wasting in Children 6 to 59 Months of Age, 2020 and 2021
In 2020 and 2021, the odds of wasting decreased with increasing age and this association remained after adjusting for the other significant variables (Table 1). In 2020, children aged 48 to 60 months were about half as likely to experience wasting compared to children 6 to 12 months (OR: 0.46, 95%CI: 0.37-0.58). Boys were significantly more likely to experience wasting than girls in both years in adjusted and unadjusted models (2020 adjusted odds ratio [AOR]: 1.53, 95%CI: 1.36-1.72; 2021 AOR: 1.45, 95%CI: 11.30-1.62). Higher levels of household head education were associated with reduced odds of wasting in children, though this relationship was attenuated in adjusted models where increased levels of education remain significantly associated with lower odds of wasting in 2020 and 2021 (Table 1). Head of household marital status and sex did not have a significant relationship with wasting in 2020 or 2021, and the pandemic’s impact on household availability of food or access to health care was also not associated with child wasting in 2020. In 2020, children of pastoralists had higher odds of wasting (AOR: 1.31 95%CI: 1.07-1.59) and in 2021, children of civil servants had lower odds of wasting (AOR: 0.69 95%CI: 0.48-0.97), when compared to children of farmers.
Agroecological zone had the most significant relationship with the odds of wasting in both 2020 and 2021, even after adjusting for individual and household characteristics (Table 1). Children in Sudanian zone consistently had the lowest wasting prevalence. In 2020, children in the Saharan zone were 3.39 (95%CI: 2.70-4.56) times more likely to experience wasting compared to children in the Sudanian zone, and children in the Sahelian zone and N’Djamena were also at increased risk (AOR: 2.66, 95%CI: 2.22-3.21 and AOR: 2.32, 95%CI: 1.63-3.26, respectively). In the 2021 adjusted models, the odds of wasting in the Saharan and Sahelian zones were similar: 1.83 (95%CI: 1.48-2.25) and 1.71 (95%CI: 1.46-2.00) and children in N’Djamena also had an elevated risk of wasting (AOR: 1.5, 95%CI: 1.06-2.09) compared to Sudanian zone children.
Diet and the Relationship to Wasting Among Children 6 to 23 Months of Age, 2020 and 2021
In children 6 to 23 months, where IYCF data were available, the relationship between food groups and IYCF indicators were different depending on the year (Table 2). In 2020, children who consumed vitamin A rich foods had significantly lower odds of wasting (AOR: 0.62, 95%CI: 0.45-0.84) whereas consumption of meat or dairy/egg products was not significantly associated with wasting after adjusting for other variables. In the adjusted model, children who achieved a MAD were significantly less likely to experience wasting (AOR: 0.61, 95%CI: 0.36-0.98), but the relationships between MDD and MMF and wasting were not significant once adjusted. In 2021, children who ate meat products had significantly lower odds of wasting (AOR: 0.76, 95%CI: 0.63-0.93) in adjusted models but consumption of Vitamin A rich foods and dairy/eggs were not protective. Unlike in 2020, the IYCF indicators were not significantly associated with wasting in 2021 after adjusting for confounders.
Table 4 presents the odds ratio of children’s wasting by agroecological zone, unadjusted, and adjusted for MDD, MMF, and MAD independently. In 2020, the unadjusted odds of wasting were 3.75 times and 2.98 times greater in the Saharan and Sahelian zones as compared to the Sudanian zone. These were attenuated by the addition of any one of the 3 IYCF indicators but remained significant; odds ratios in adjusted models ranged from 2.16 to 2.30 in for the Saharan zone and from 1.90 to 1.93 for the Sahelian zone, as compared to the Sudanian zone. In N’Djamena, the greater odds of wasting were similarly attenuated by the addition of any one of the IYCF indicators and were no longer significant in 2020. In 2021, a similar pattern was observed where the addition of any one of the IYCF indicators to the model appeared to mediate the relationship between agroecological zone and wasting. Unadjusted odds for wasting were statistically significant at 1.83 and 1.73 in the Saharan and Sahelian zones, respectively. With the addition of MDD, MMF, or MAD in the models, the odds of wasting remained statistically significant only in the Sahelian zone (AORs range from 1.31-1.51).
Odds of Wasting by Agroecological Zone After Adjusting for Child Diet Among Children 6 to 23 Months in Chad, 2020 to 2021.
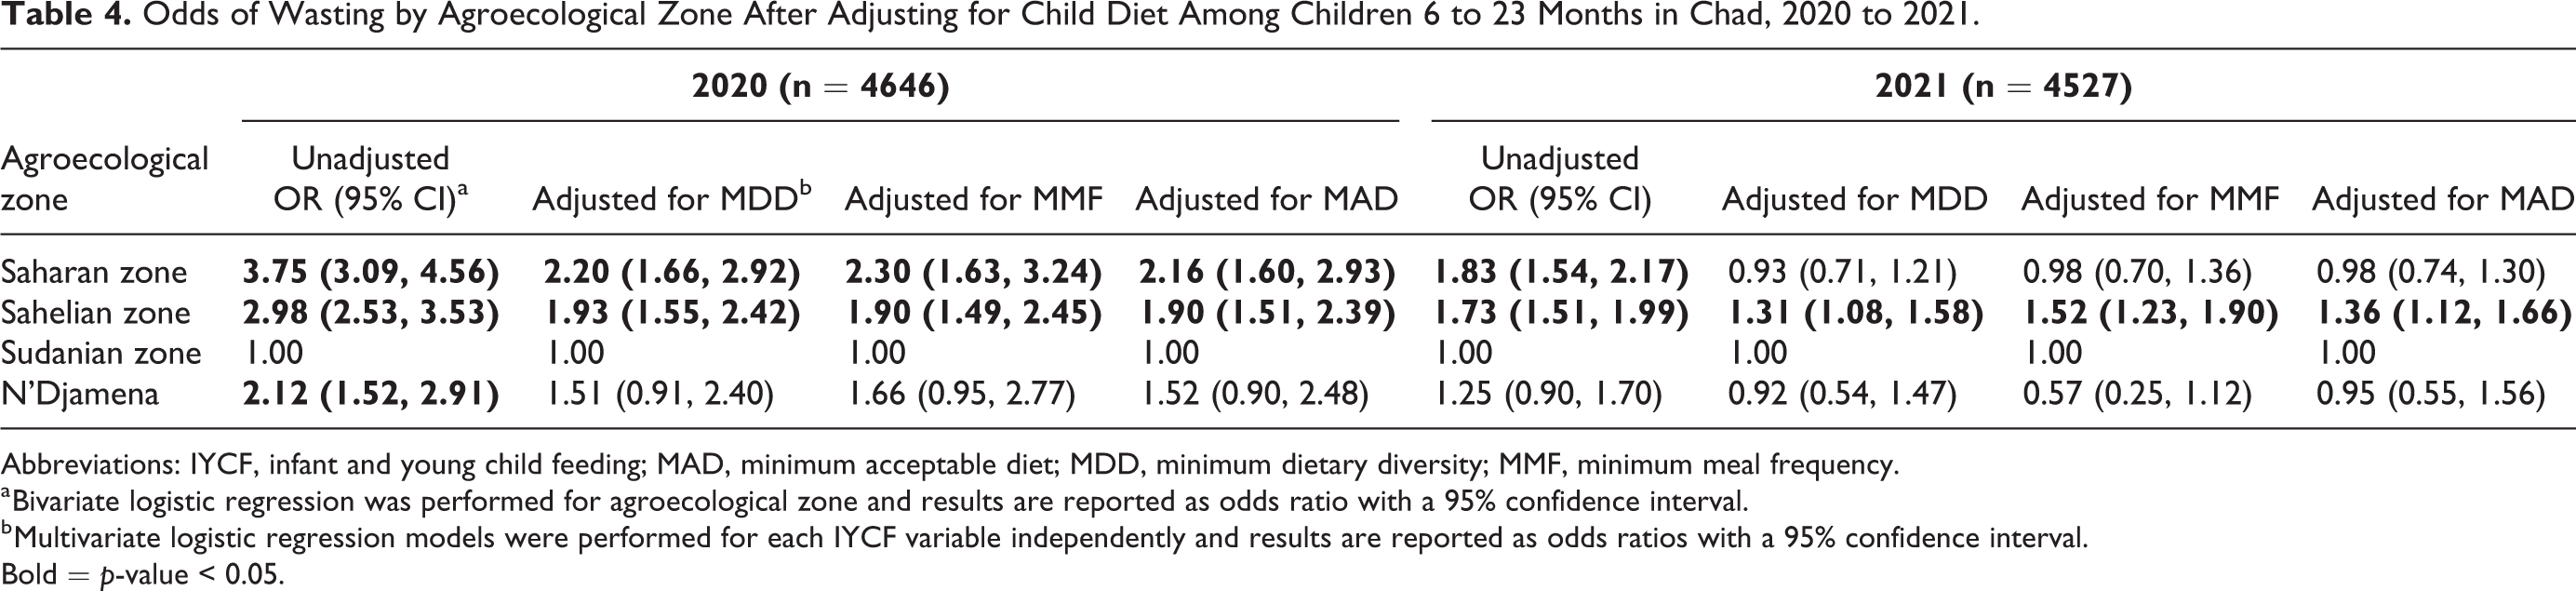
Abbreviations: IYCF, infant and young child feeding; MAD, minimum acceptable diet; MDD, minimum dietary diversity; MMF, minimum meal frequency.
a Bivariate logistic regression was performed for agroecological zone and results are reported as odds ratio with a 95% confidence interval.
b Multivariate logistic regression models were performed for each IYCF variable independently and results are reported as odds ratios with a 95% confidence interval.
Bold = p-value < 0.05.
Determinants of Women’s Thinness in 2020 and 2021
Women’s age was significantly associated with the odds of thinness in 2020 and 2021, even after adjusting for other individual and household level characteristics (Table 3). Adolescents (15-19 years) were over 2 times more likely to be thin (2020 AOR: 2.36, 95CI: 2.06-2.71; 2021 AOR: 2.24, 95%CI: 1.98-2.53) as compared to the 20 to 29-year-old reference group. In contrast, women 30 to 39 and 40 to 49 had significantly reduced odds of thinness, a pattern that was consistent across years and adjusted models. In adjusted models, women 30 to 39 years were approximately 40% less likely to experience thinness (2020 AOR: 0.59, 95%CI: 0.50-0.69; 2021 AOR: 0.62, 95% CI: 0.54-0.72) whereas odds decreased further to 55% to 60% among women 40 to 49 (2020 AOR: 0.40, 95%CI: 0.31-0.52; 2021 AOR: 0.45, 95%CI: 0.36-0.56). The importance of nutrition counseling in the past 3 months varied by year and was associated with reduced odds of thinness only in 2021 (AOR: 0.19, 95%CI: 0.67-0.97). Similarly, women who reported knowledge of women’s nutrition had reduced odds of thinness in 2021 (AOR: 0.81, 95%CI: 0.67-0.97), but not in 2020. In contrast, those who reported knowledge of anemia prevention had lower odds of thinness in 2020 (AOR: 0.60, 95%CI: 0.45-0.81), but not in 2021 (AOR: 0.76, 95%CI: 0.57-1.03).
Among the household characteristics, head of household educational attainment was significantly associated with women’s thinness in both 2020 and 2021, where completion of primary and secondary schooling predicted lower odds of women’s thinness by ∼40% and 25% to 65%, respectively (Primary school 2020 AOR 0.61, 95%CI: 0.49-0.76; 2021 AOR 0.59, 95%CI: 0.49-0.71/Secondary school 2020 AOR 0.75, 95%CI: 0.61-0.91; 2021 AOR 0.44, 95%CI: 0.36-54; Table 3). When compared to farmers, pastoralist households had higher odds of women’s thinness in both 2020 and 2021 in unadjusted models, but the association remained significant only in 2021 (AOR: 1.61, 95%CI: 1.33-1.95). In 2020, temporary work and civil servant primary income sources were also associated with higher odds of women’s thinness in adjusted models (AOR: 1.40, 95%CI: 1.07-1.84 and AOR 1.36, 95%CI: 1.01-1.82, respectively), but these associations were not present in 2021. Women’s pregnancy status, head of household sex and marital status, and the pandemic’s effect on household access to food or health services were not associated with women’s thinness in the adjusted models.
Similar to children’s wasting, agroecological zone was significantly associated with the odds of women’s thinness in 2020 and 2021, and women were at increased risk of wasting in all regions of the country as compared to the Sudanian zone, with risk more pronounced in 2020 than 2021. In the 2020 adjusted model, women were 3 to 4 times more likely to suffer thinness in the Saharan zone (AOR: 3.51, 95%CI: 2.78-4.41), Sahelian zone (AOR 4.18, 95%CI: 3.44-5.07), and N’Djamena (AOR 3.05, 95% CI: 2.24-4.15) when compared to women in the Sudanian zone. In 2021, a similar but less pronounced phenomena was observed where women outside the Sudanian zone were 23% to 35% more likely to experience thinness (Saharan zone AOR 1.23, 95%CI: 1.03-1.48/Sahelian zone AOR: 1.35, 95%CI: 1.17-1.56/N’Djamena AOR 1.35, 95%CI: 1.04-1.76).
Discussion
The overall trend in acute malnutrition for children and women over the past 7 years in Chad is declining, but the decline is not significant and there is considerable variability by region and province. However, a recent uptick in 2021, specifically in the Sudanian zone, is a cause for concern. There is also notable variation by region; women and children in the Saharan and Sahelian zone had significantly higher odds of thinness and wasting in 2020 and 2021, even after adjusting for individual and household level factors. The higher odds of wasting among children in the Saharan and Sahelian zones could be partially explained by poor IYCF practices, as the odds were somewhat attenuated in the IYCF-adjusted models, but remained significantly higher than the Sudanian zone, especially in 2020. A convergence of risk factors in the 2 regions are likely to contribute to the higher rates of children’s wasting and women’s thinness. Besides the annual recurrence of severe food insecurity in the region, a recent analysis by the Global Food Security Cluster in 2 provinces (BEG and Kanem) found that acute malnutrition and food insecurity are highly clustered according to differences in access to health care, presence of conflicts such as between farmers and pastoralists, and seasonal access to natural resources such as water. 20 The Nutrition Cluster analysis of selected SMART surveys also adds poor household access to safe drinking water and high morbidity rates as key contributors to high malnutrition rates. 6
Additionally, the national increase in child wasting and the Sudanian zone increase in women’s thinness in 2021 could be attributed to the economic impacts of the COVID-19 pandemic. Food insecurity increased on a global scale in 2020 and 2021 due to disrupted supply chains, lockdowns, and increased food prices due to limited availability. 21 These effects were felt in Chad, where Kang et al found that the household economic impact of COVID-19 was greatest in urban areas in 2020 and greatest in rural areas in 2021. 3 This may help explain why different primary income sources, such as temporary work and civil service, which are more common in urban settings, were associated with higher odds of women’s thinness in 2020, but not in 2021. Additionally, worsening economic conditions in Chad may have contributed to the higher rates of undernutrition in 2021, as a result of decreased consumer purchasing power for food. 22
Furthermore, acute COVID-19 relief programs have lapsed even though Chad is still experiencing the economic effects of the pandemic. In 2020, various forms of food assistance were provided to targeted households. For example, World Food Programme (WFP) reported that in response to the socio-economic impact of COVID-19 433,450 people were reached with food assistance in 8 provinces, 144,000 school going children were provided with take-home rations, and additional children received a malnutrition treatment and prevention package. 23 This may provide some explanation for why the perception of the pandemic impact on household availability of food was not associated with wasting or thinness in 2020. However, by 2021, such relief programmes had significantly scaled down with WFP integrating most of its assistance within the regular lean season intervention. Vulnerable households were, and likely still are, experiencing the economic effects of the COVID-19 pandemic, thus the conclusion of these programs may have contributed to the increase in food insecurity in 2021, and subsequently the increase in wasting and thinness.
It is unclear why different food groups, such as vitamin A rich foods in 2020 and meat products in 2021, and different IYCF indicators, such as MAD in 2020 and MMF in 2021, were associated with a reduced odds in wasting 1 year versus the other. However, the difference in the time of year of when the surveys were conducted may have played a role in what food groups were available in those seasons. Differences in seasonal foods and products, along with the aforementioned economic impacts, likely contributes to differences seen across indicators from 2020 to 2021. Despite these differences, the overall improvement of food groups and IYCF indicators was associated with reduced odds of wasting across both years, aligning with existing evidence on adequate child diets and nutritional status. 24
Considering the persistence and co-occurrence of the drivers of food insecurity and malnutrition, the trajectory of undernutrition among women and children since 2015 is to be expected. The current burden of undernutrition outstrips available resources painting a grim picture on the likely evolution beyond the period analyzed. In view of the evidence, a set of essential, though not exhaustive, actions to leverage current nutrition interventions for accelerated progress toward the SDG 2 target on malnutrition in Chad include:
This study is not without limitations. SMART surveys have a cross-sectional design, so it was not possible to conduct longitudinal analyses to understand the drivers influencing the changes in nutritional status over time. The scope of the SMART surveys limited the ability to explore other known risk factors, such as morbidity in children and women, and diet in women. Additionally, we were unable to link child and mother data due to the nature of the datasets, making it impossible to explore the links between maternal factors and child nutritional status for this analysis. Despite these limitations, this study has several strengths. We utilized nationally representative samples across 7 years of data from government led SMART surveys. Additionally, the study questionnaire was generally consistent each year, allowing for temporal comparison. To our knowledge, this is the first study that presents nationally representative trends of acute malnutrition in women and children in Chad and provides a deeper understanding of the determinants associated with those risks within the COVID-19 pandemic context.
Conclusions
Overall, acute malnutrition in Chad remains a critical public health problem for both children and women, and the pandemic only exacerbated the crisis. The Saharan and Sahelian zones exhibit higher rates of acute malnutrition each year, whereas the Sudanian zone has relatively lower rates, though it experienced significant increases in 2021. These findings call for a targeted approach to addressing wasting in Chad, including scaling up of effective treatment and prevention programs for acute malnutrition and focusing on regions and provinces where food insecurity is greatest. Additionally, integrated approaches to address the various contributors of acute malnutrition need to be adopted and implemented more broadly. These may include nutrition education and supplementation for women of reproductive age, including adolescents, promotion of IYCF practices, adoption of safe water and sanitation practices, and nutrition-sensitive social protection programs. Continued monitoring of nutritional status in these populations will support the development and evaluation of programmatic activities.
Supplemental Material
Supplemental Material, sj-pdf-1-fnb-10.1177_03795721231190203 - Trends and Determinants of Children’s Wasting and Women’s Thinness in Chad, 2015 to 2021
Supplemental Material, sj-pdf-1-fnb-10.1177_03795721231190203 for Trends and Determinants of Children’s Wasting and Women’s Thinness in Chad, 2015 to 2021 by Sarah Adler, Eleonor Zavala, Edgar Wabyona, Martin Ahimbisibwe, Fanga Haisset and Shannon Doocy in Food and Nutrition Bulletin
Footnotes
Author Contributions
SD, EW, EZ, and SA developed the research questions and designed the study. EZ and SA conducted the analysis. SA and EZ wrote the first draft. SD, EW, MA, FH provided critical feedback and edits. All authors reviewed and approved the final version.
Declaration of Conflicting Interests
The authors declared no potential conflicts of interest with respect to the research, authorship, and/or publication of this article.
Funding
The authors disclosed receipt of the following financial support for the research, authorship, and/or publication of this article: Funding for this work was provided by the World Food Programme.
Supplemental Material
Supplemental material for this article is available online.
References
Supplementary Material
Please find the following supplemental material available below.
For Open Access articles published under a Creative Commons License, all supplemental material carries the same license as the article it is associated with.
For non-Open Access articles published, all supplemental material carries a non-exclusive license, and permission requests for re-use of supplemental material or any part of supplemental material shall be sent directly to the copyright owner as specified in the copyright notice associated with the article.