
Abstract
Background:
Protein quality refers to the amounts and ratios of essential amino acids in a food. Two methods most commonly used for determining protein quality are the protein digestibility-corrected amino acid score (PDCAAS) and the digestible indispensible amino acid score (DIAAS).
Objective:
To use existing literature to compare different amino acid profiles and PDCAAS and DIAAS scores in individuals with acute inflammation and to assess their relationship with weight gain in children with severe acute malnourished (SAM).
Methods:
A series stable isotope studies were previously conducted in children with SAM and acute infection, and these data were reviewed with respect to protein synthesis. Eleven published treatment trials for SAM with different therapeutic foods were analyzed to examine the relationship between protein quality scores with weight gain (g/kg/d). Protein scores were calculated with the PDCAAS and DIAAS amino acid reference patterns. A DIAAS score adjusted for the higher weight gain expected in malnourished children was also used. Bivariate correlation analysis was used to examine this relationship.
Results:
The protein kinetic data supported the hypothesis that a balance of amino acids that matches the composition of acute-phase proteins maximizes amino acid synthesis. Protein quality scores were highly correlated with the rate of weight gain in recovery from SAM, and the DIAAS scoring system adjusted for the higher expected weight gain had the strongest correlation with the observed weight gain.
Conclusion:
Protein quality scores must account for physiologic status so that they better match with needs and thus better promote health.
Introduction
Protein quality is an index based on the amount of digestible, essential amino acids in a food source. Nine amino acids cannot be synthesized at all in the human and are referred to as essential amino acids: phenylalanine, valine, threonine, tryptophan, methionine, leucine, isoleucine, lysine, and histidine. Different proteins can be digested to differing extents in the human gastrointestinal tract, for example, casein (one of the main milk proteins) is 100% digestible, while protein from common bean is only 75% digestible. Digestibility is determined by empiric measurements in animals or in humans with an ileostomy, a surgical diversion that circumvents the colon. By knowing the amino acid content of a food and its digestibility, one can calculate the quantity of each essential amino acid available to the human in a given food. Comparing these calculated values to a reference standard for amino acid utilization, one can determine which amino acid is least abundant, often referred to as the limiting amino acid, and this determines the score of the protein. Food and Agriculture Organization of the United Nations (FAO) and World Health Organization (WHO) recommend the use of 3 reference standards for calculating this score: (1) breast milk, used for infants aged 0 to 6 months, (2) children at 6 to 36 months of age, and (3) children 3 to 10 years of age. These reference standards assume that the individual is healthy without any comorbid conditions. Two commonly used protein quality scoring systems are the protein digestibility-corrected amino acid score (PDCAAS) and the digestible indispensible amino acid score (DIAAS). The PDCAAS uses rat digestibility in its determinations, and DIASS uses pig digestibility. The DIASS is newer and preferred by the FAO.
About 20 years ago, Reeds et al introduced a concept of protein quality which included estimates of the amino acid utilization in physiologic states of stress. 1 This is an attractive notion in that different proteins with different amino acid compositions are synthesized in different physiologic states. It is not only age or body size that determines amino acid utilization but what proteins are being synthesized. The inflammatory response requires a 3-fold increase in aromatic amino acids. It is also well known that people who have burn injuries need a 3-fold increase in protein intake. Dietary protein needs vary tremendously with rapid tissue damage and regeneration.
We will now consider a particular physiologic condition, and the amino acid requirements thereof, treatment during acute, life-threatening infection in childhood, severe acute malnutrition (SAM).
Protein Quantity and Quality in Children With Severe Acute Malnutrition and Infection
Manary et al conducted a series of studies to test the hypothesis that children with SAM and a life-threatening infection would mount a more vigorous protein synthetic response if they were given a diet with more of the amino acids needed to synthesize acute-phase proteins. 2 –4 Acute-phase proteins are made in response to systemic infection. At the time the study was being conducted, the prevailing viewpoint was that feeding children with SAM too much protein could be toxic. Thus, standard recommendations limited the amounts of protein that should be fed in children with SAM to very low levels. Others, including Reeds and Manary, questioned this recommendation; nevertheless, they were constrained to using very low amounts of protein when treating SAM outside research.
Children who had SAM and were very likely infected were given 1 of 3 different protein contents in their diets. Their rates of protein synthesis and leucine oxidation were measured with stable isotopes. 4 The study had 3 groups: children who received the standard food called F75, which provides milk protein at 1.2 g/kg/d. The second and third groups received novel diets: an improved amino acid composition, based on the amino acid requirements for responding to infection, which consisted of 1.2 g/kg/d egg white protein with added tryptophan, and, finally, a higher protein diet, consisting of 1.8 g/kg/d egg white with added tryptophan.
Figure 1 shows the results of this study. The bars in panel A show the amount of protein being oxidized for energy. Protein oxidation was reduced when fed the more optimal amino acid composition diets. The bars in panel B of Figure 1 show that giving more protein of the optimal amino acid composition resulted in more protein synthesis. The concentrations of acute-phase proteins were greater in those children receiving the egg white and tryptophan at 1.8 g/kg/d. These data provided evidence to corroborate the notion that in this particular physiological state—SAM with an inflammatory response—the pattern of the amino acid mixture and the amount of protein determine the amount of protein synthesized. 4
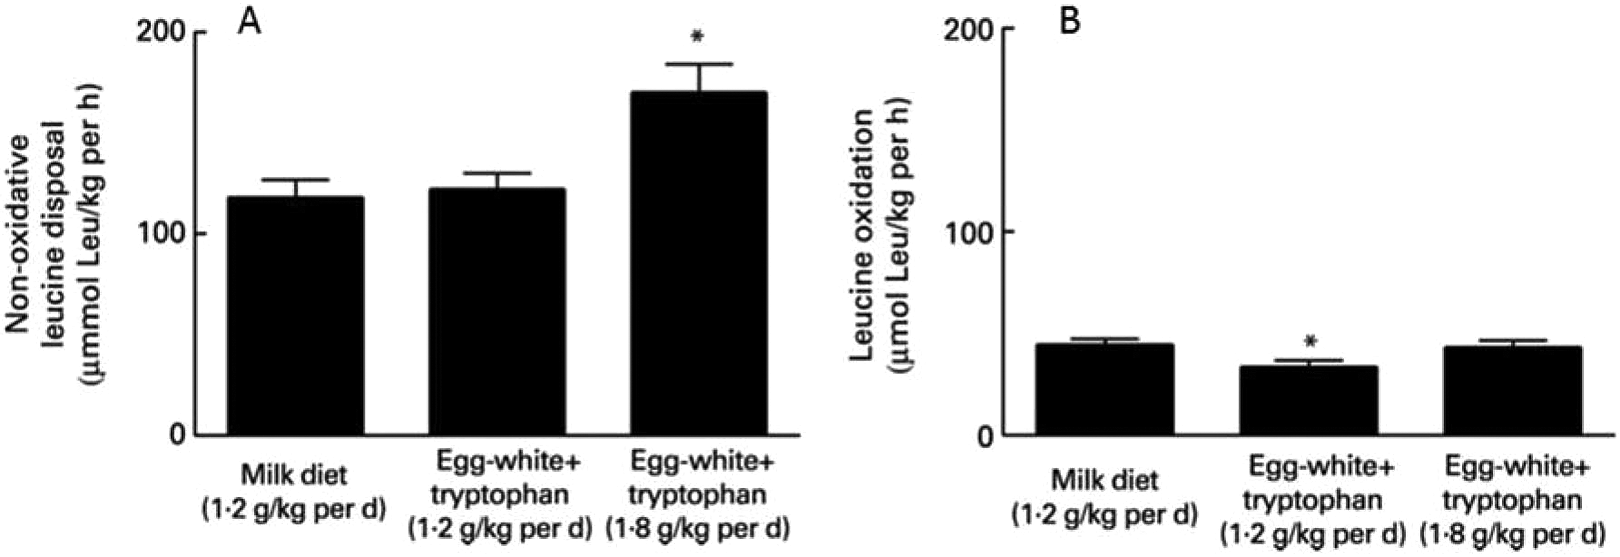
Both bar graphs represent data from the same children with severe acute malnourished (SAM) and acute infection. A, Protein synthesis is greater when more protein is given, not simply protein of higher quality. B, Amino acid oxidation is less when higher quality protein is used.
Protein Requirements During Rapid Catch-Up Growth
The rate at which new tissue is being created is a determinant of the dietary protein requirement. Children recovering from SAM are creating new tissue at a very rapid rate, and it has been recognized that protein requirements and the proportion of energy derived from proteins are higher during rapid catch-up growth. It has been estimated that during the initial phase of treatment, when the weight is stable, children require about 0.62 g/kg/d of protein, representing 3% of energy requirement, whereas during catch-up growth, when weight gain can go up to 10 g/kg/d, these children require 2.72 g/kg/d of protein, representing 8.4% of energy. 5
The effect of rapid weight gain on the need to have high-quality protein received less attention. When considering the 3 reference populations, none seems particularly suited to an infant recovering from SAM. The DIAAS is an improvement over PDCAAS, as has been described elsewhere, but both still use the same 3 reference standards by age—breast milk for young children, 6 to 36 months old for rapidly growing children, and older children for all others. 6 Protein quality is important when protein intake is limited, when therapeutic diets are given with very specific protein concentrations, and when protein requirements are high. Pregnancies and other periods of rapid growth or repletion of tissue are also times of high protein requirements.
Protein quality also matters recipients of food aid. Because food aid recipients are often underweight, they need to regain and rebuild tissues, yet they eat a very monotonous diet. Furthermore, because they may be displaced from their home environment, they may be unable to prepare and store their own foods and are forced to live in conditions where they cannot make choices about what they eat. Protein quality specifications for populations on limited diets may be helpful.
Which Amino Acid Score should be used to Assess the Protein Quality of Diets during the Catch-Up Growth of Malnourished Children?
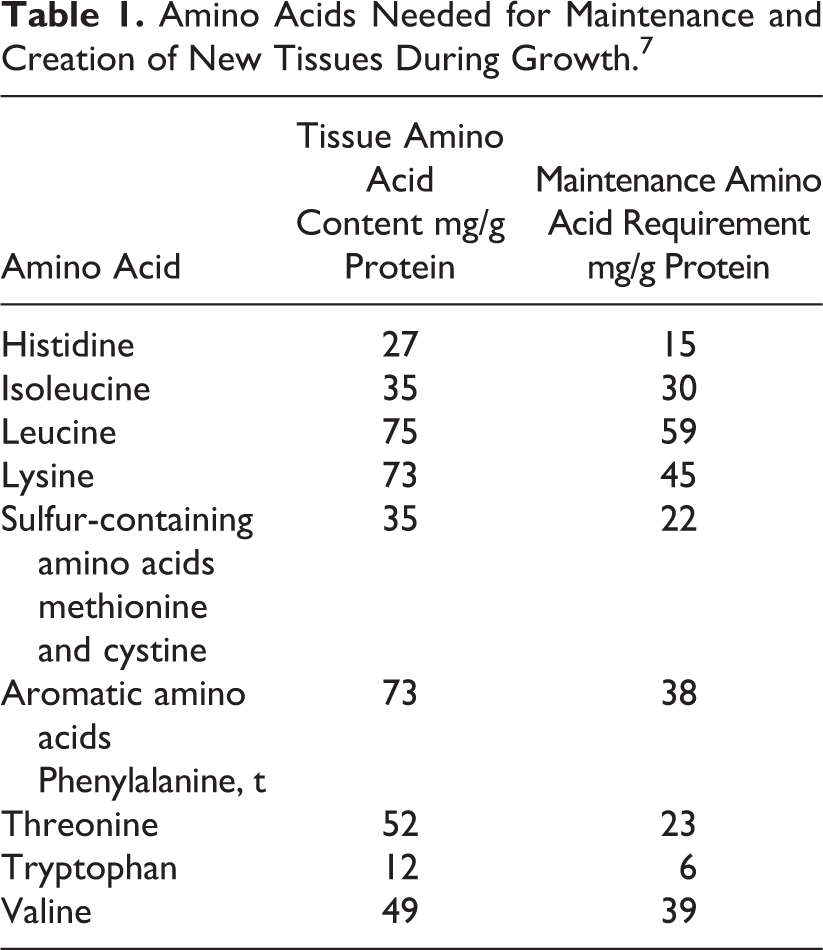
The scoring amino acid pattern to be used to assess the protein quality of diets in children has been described in the 2013 FAO WHO document on protein quality. 7 In children younger than 6 months, the amino acid profile of breast milk is used as reference. In children aged more than 6 months, the report calculates the requirement of each amino acid by adding the amount needed for maintenance and the amount needed for growth. The amino acids needed for maintenance, expressed in g/kg/d, are assumed to be the same in children as in adults. The amino acids needed for growth reflect the amino acid composition of new tissues being synthesized during growth. These 2 amino acid profiles are shown in Table 1. For calculation of amino acid needed for growth, the tissue pattern of amino acid is increased by a factor of 1.72 to take into account a coefficient of utilization of 58%.
Amino Acids Needed for Maintenance and Creation of New Tissues During Growth. 7
Children have a weight gain expressed in g/kg/d and an amount of protein gained each day which decreases steadily with age. 5,8 As a result, the scoring amino acid pattern varies with age, with the growth component of amino acid requirement decreasing and the reference pattern moving toward adult values as the child grows older.
For simplification, the FAO WHO 2013 document recommends to use the score calculated for 6-month-old children in the whole age range of 6 to 36 months. Children aged 6 months gain on average 0.27 g/kg/d of proteins, which corresponds to a protein requirement for growth of 0.46 g/kg/d (0.27/0.58). This is considerably less than the expected protein gain of children recovering from malnutrition during their catch-up growth. Some children can put on 10 to 15 g/kg/d, and assuming that half of this is lean tissue with 20% protein, this corresponds to a gain of 1 to 1.5 g/kg per day of protein or 1.72 to 2.58 g/kg/d of proteins required for growth. 5 The use of the standard amino acid pattern to assess protein quality seems poorly adapted for these children.
Table 2 shows the standard amino acid scoring patterns and an amino acid profile adapted for children recovering from malnutrition during the catch-up growth phase. Table 3 shows the protein quality scores foods typically used to treat malnutrition. For the calculation of this adjusted score, it was assumed, as above, that 50% of weight gain represents lean tissue with 20% protein. As in the 2013 FAO WHO report, it was assumed that protein utilization for synthesizing new tissues is 58%. This calculation suggests that protein used for feeding these children should have a higher content of essential amino acids, particularly for tryptophan, aromatic amino acids, and threonine, which are amino acids that are in higher proportions in tissues compared to maintenance requirements.
Amino acid Scoring Patterns That Were Used for the Calculation of Each Protein Quality Score.
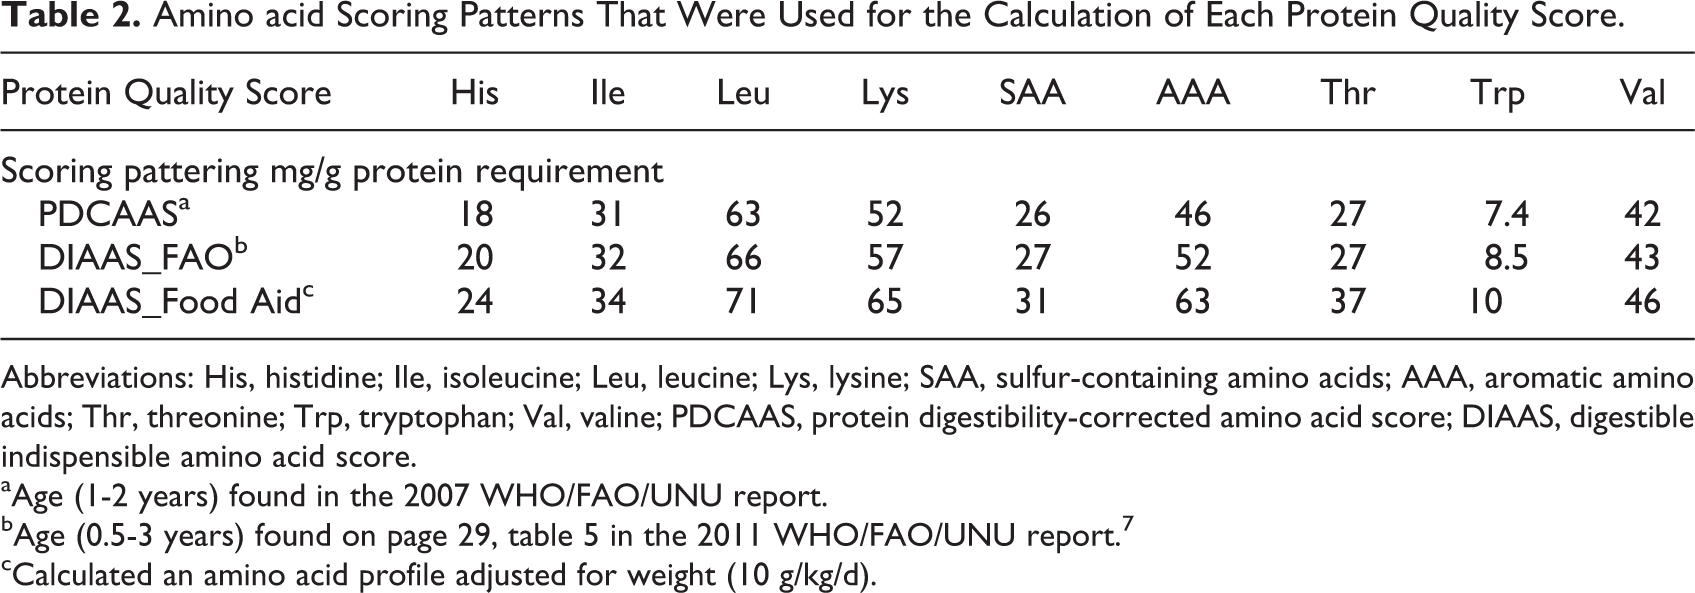
Abbreviations: His, histidine; Ile, isoleucine; Leu, leucine; Lys, lysine; SAA, sulfur-containing amino acids; AAA, aromatic amino acids; Thr, threonine; Trp, tryptophan; Val, valine; PDCAAS, protein digestibility-corrected amino acid score; DIAAS, digestible indispensible amino acid score.
aAge (1-2 years) found in the 2007 WHO/FAO/UNU report.
bAge (0.5-3 years) found on page 29, table 5 in the 2011 WHO/FAO/UNU report. 7
cCalculated an amino acid profile adjusted for weight (10 g/kg/d).
Protein Quality of Food Aid Products.
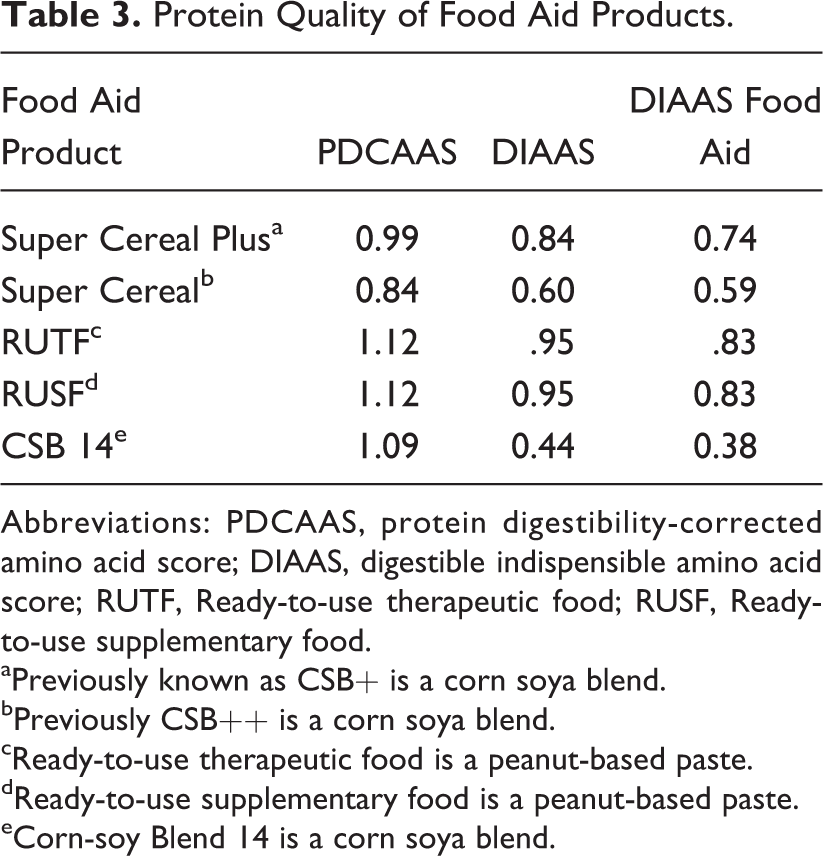
Abbreviations: PDCAAS, protein digestibility-corrected amino acid score; DIAAS, digestible indispensible amino acid score; RUTF, Ready-to-use therapeutic food; RUSF, Ready-to-use supplementary food.
aPreviously known as CSB+ is a corn soya blend.
bPreviously CSB++ is a corn soya blend.
cReady-to-use therapeutic food is a peanut-based paste.
dReady-to-use supplementary food is a peanut-based paste.
eCorn-soy Blend 14 is a corn soya blend.
Table 4 summarizes the descriptive statistics of treatment trials on children with SAM comparing different therapeutic foods. Data from 11 studies that were conducted in Malawi, Senegal, Zambia, Niger, or India with children ranging in age from 6 to 60 months between 2001 and 2010 are summarized as the 11 clinical trial data. 9 –19 Four of these 11 trials were small, with <100 participants. 10,14,17,18 When these 4 were removed, this is referred to the 7 clinical trial data. One of the remaining 7 trials was remarkably different from the other 7 in average weight gain, 11 and when this study was removed, this is referred to as the 6 clinical trial data.
Descriptive Statistic on Data Sets Used for Analysis.
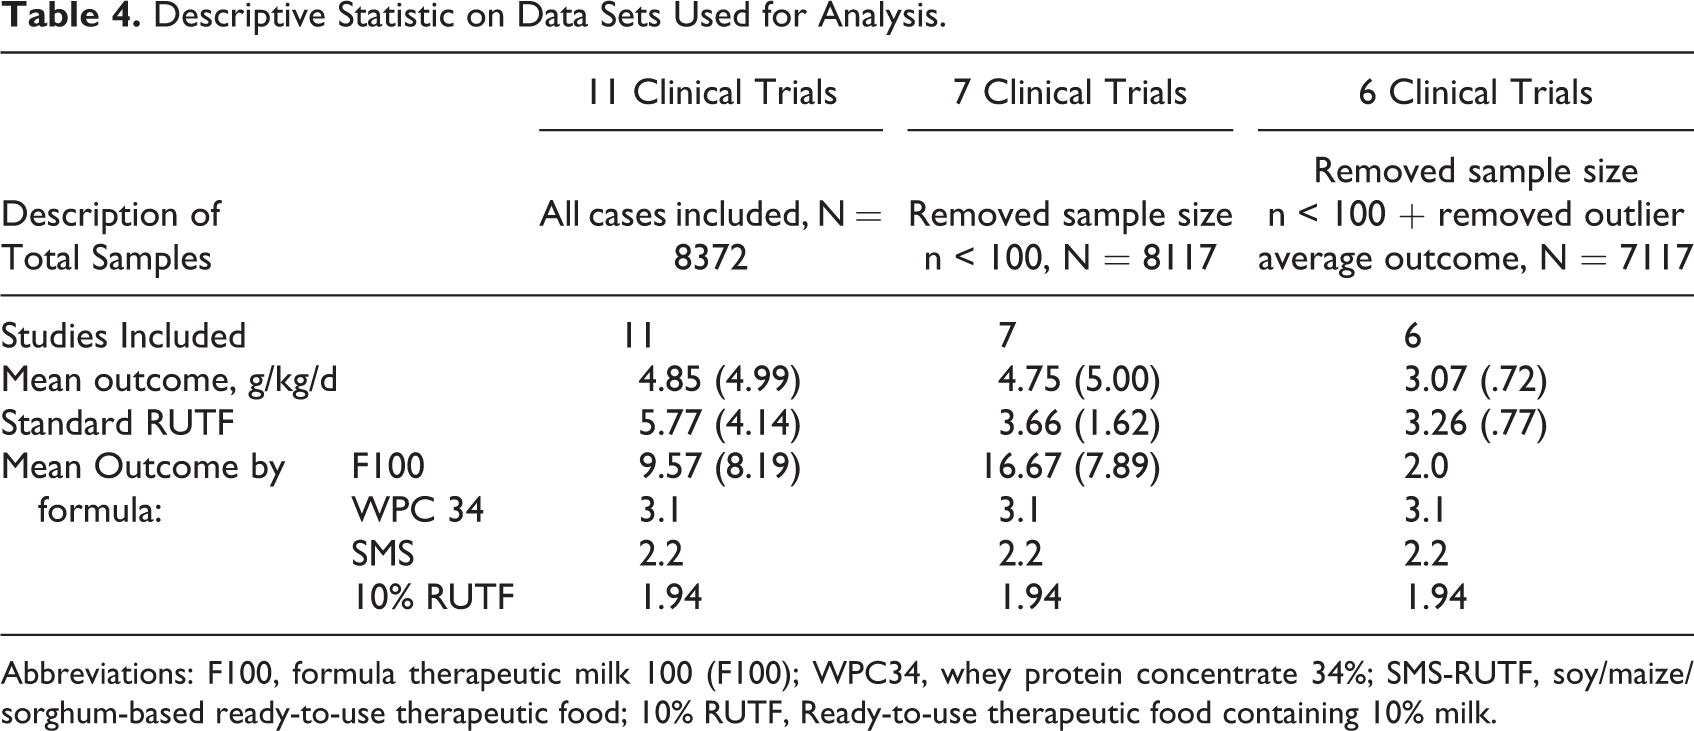
Abbreviations: F100, formula therapeutic milk 100 (F100); WPC34, whey protein concentrate 34%; SMS-RUTF, soy/maize/sorghum-based ready-to-use therapeutic food; 10% RUTF, Ready-to-use therapeutic food containing 10% milk.
Table 4 also shows the results of data set when studies with samples sizes less than 100 are removed and outlier average outcome. The rate of weight gain, expressed as g/kg/d, is shown for different diets with different protein quality scores. The formulas tested were formula therapeutic milk (F-100), whey protein concentrate 34% (WPC34), soy/maize/sorghum-based ready-to-use therapeutic food (SMS-RUTF), and RUTF containing 10% milk (10% RUTF). As shown in Table 5, the protein quality scores were highly correlated with the rate of weight gain, with some correlation coefficients over 0.8. Figure 2 depicts the correlations between rates of weight gain versus the protein digestibility scores based on data from the 11 trials. The line depicting DIAAS Food Aid has the steepest slope, indicating the greatest recovery outcome per unit protein digestibility score.
Bivariate Correlation Analysis Showing the Correlation Between Protein Score Method and Average Recovery Outcome (g/kg/d) Cases Weighted by Sample Size of the Study.a
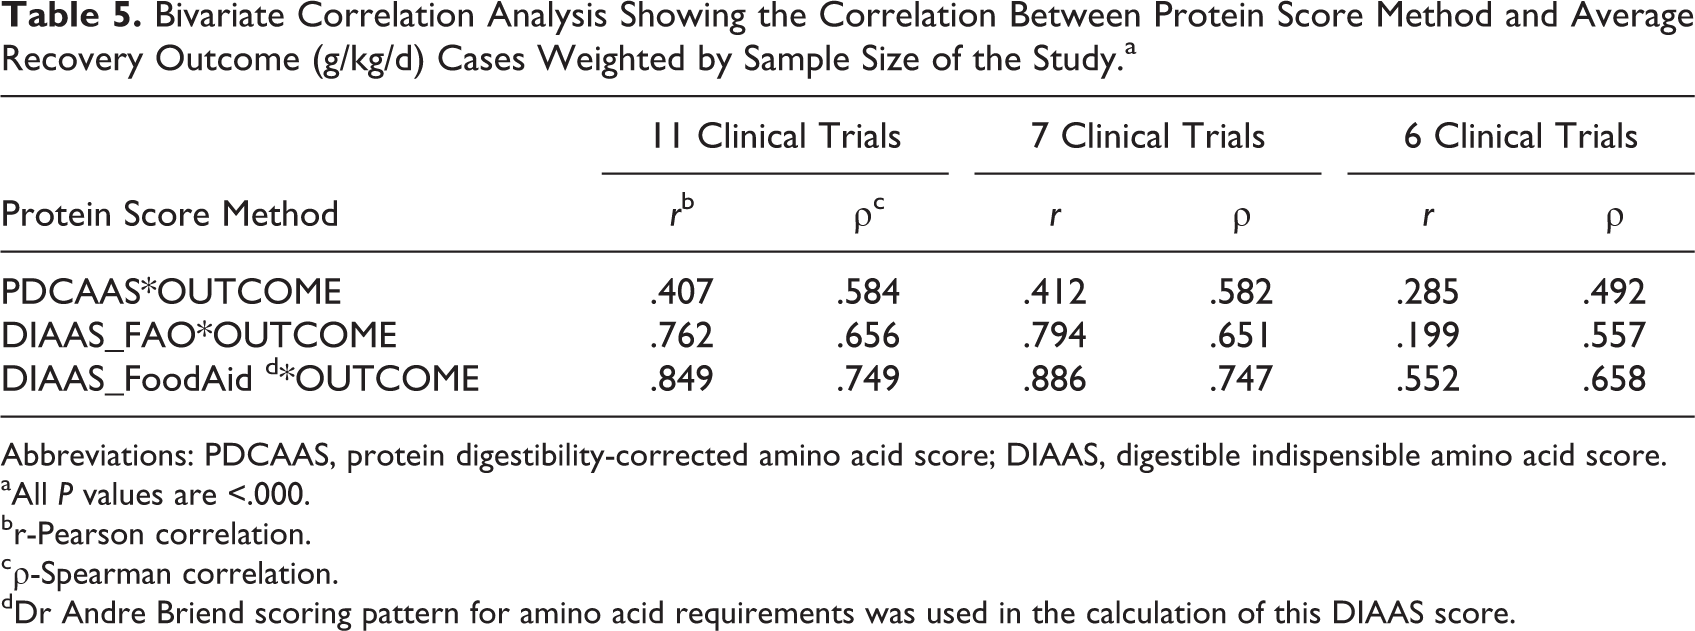
Abbreviations: PDCAAS, protein digestibility-corrected amino acid score; DIAAS, digestible indispensible amino acid score.
aAll P values are <.000.
br-Pearson correlation.
cρ-Spearman correlation.
dDr Andre Briend scoring pattern for amino acid requirements was used in the calculation of this DIAAS score.
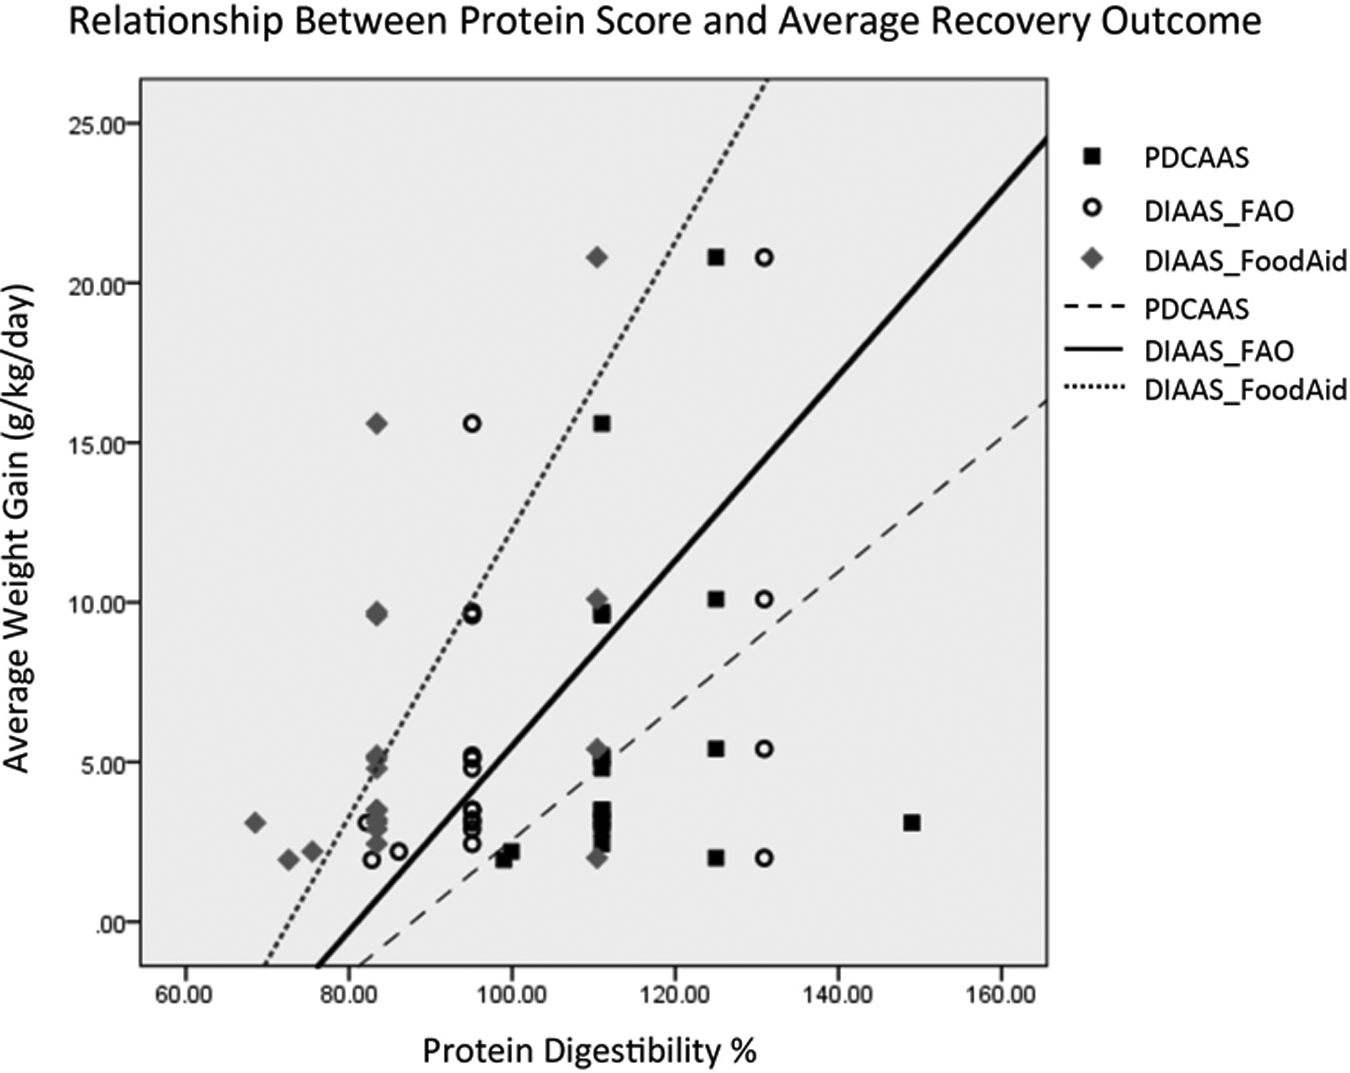
This figure shows the scatterplot of the protein digestibility scores and the outcomes from data set 1. The reference lines represent the linear equation. All 3 digestibility scores have linear relationships with outcome, with the strongest linearity seen with the DIAAS_FoodAid score. DIAAS indicates digestible indispensible amino acid score.
Figure 3 shows the results using 6 clinical trials, where the results are even more dramatic. The steep slope of average recovery outcome versus protein digestibility score for DIAAS Food Aid illustrates how much protein quality may matter. In other words, matching protein quality to what the body needs at that time results in greater rates of weight gain.
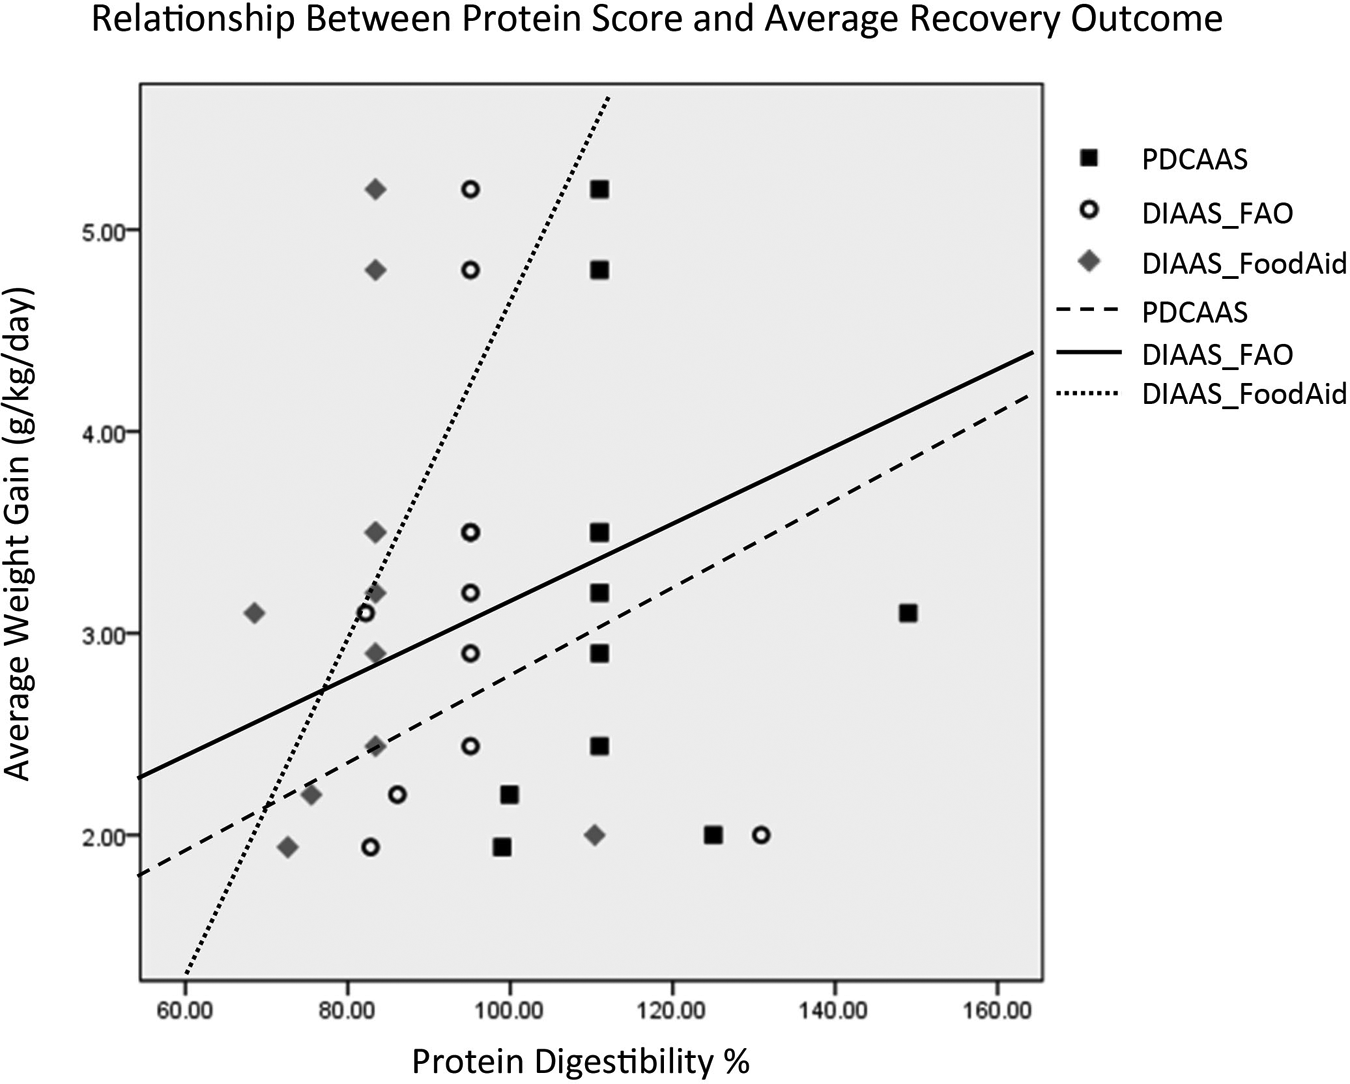
The scatterplot of the protein digestibility scores and the outcomes from data set 3, which excludes some of the data based on sample size and generalizability of outcome. The reference lines represent the linear equation. All 3 digestibility scores have linear relationships with outcome, with the strongest linearity seen with the DIAAS_FoodAid score. DIAAS indicates digestible indispensible amino acid score.
The effect of using proteins of different quality for feeding malnourished children on their weight gain and rate of recovery is not known. In theory, feeding proteins with suboptimal amino acid scores can be compensated by giving more proteins. It may also lead to suboptimal weight gain or excess of fat tissue deposition. Results presented here, however, should be examined with caution. Foods with low protein quality scores tend to be given to children with less severe forms of malnutrition which also have lower weight gains. These results should be confirmed by studies, similar to the study by Oakley et al, 15 directly comparing the weight gain of randomly selected groups of children with the same degree of malnutrition and receiving foods with different protein quality scores.
Conclusion
Protein quality is not an intrinsic characteristic of a food; a food’s protein quality has to take into account how it is suited for certain physiologic situations. In general, when looking at all the protein quality scores, dairy protein is likely to be higher, and particularly for malnourished children, dairy proteins are associated with better growth.
Future efforts need to be directed toward accommodating more complexity in protein quality scores so that proteins can be better matched with physiological needs and thus better promote better recovery.
Footnotes
Acknowledgments
We are grateful to the children and families who participated in our studies.
Authors’ Note
All authors have contributed to design, implementation, writing and creation of this research and resulting manuscript.
Declaration of Conflicting Interests
The author(s) declare no potential conflicts of interest with respect to the research, authorship, or publication of this article.
Funding
The author(s) disclosed receipt of the following financial support for the research, authorship, and/or publication of this article: MM and MC received travel funding for this work from US Dairy Export Council.