
Abstract
Background:
Nigeria is a significant contributor to the global burden of chronic undernutrition in children under 5 years of age. The undernutrition challenge constrains the productivity of rural households. This study was carried out among beneficiaries of the productivity-enhancing Nigerian Dairy Development Programme (NDDP) to guide incorporation of nutrition into the successor program—Advancing Local Dairy Development in Nigeria (ALDDN). Therefore, this study contributes to the literature about operationalizing nutrition-sensitive agricultural frameworks.
Objective:
The study sought to determine potential entry points for improving the nutrition of smallholder dairy farmers (≤ 5 milk cows) with a focus on food system entry points.
Methods:
Primary data were collected from 514 smallholder dairy households in Oyo and Kano states of Nigeria. Both quantitative and qualitative data were collected. Quantitative data collected included minimum dietary diversity for women, nutrition status, and socioeconomic characteristics of households. Qualitative data included information about sources of food, markets, and other food system characteristics. Quantitative data were analysed using descriptive statistical tools and correlation analysis, while common themes were identified from qualitative data.
Conclusions:
The study showcased men’s important role in food purchase and consumption, particularly in Kano. Increasing opportunities and the ability of women to use nutrition education appeared necessary for translating knowledge into improved practices. The own consumption (i.e., the portion of the milk kept for households’ consumption as well as diversification of foods produced for consumption); income; women’s empowerment; and environmental sanitation pathways seemed to be the most feasible pathways for improving nutrition within the context of the study population.
Introduction
There is now consensus among the global nutrition community that addressing undernutrition requires both nutrition-specific and nutrition-sensitive interventions, including nutrition-sensitive agriculture. 1 -3 There are 6 major recognized pathways through which agriculture can improve nutrition. 4 -6 However, the evidence to support the sustained translation of these pathways into actual nutrition impacts is inadequate. 7 Indeed, although the actions necessary to implement nutrition-sensitive interventions are already known, 4,8 operationalizing these actions remains a challenge. 9 Gillespie et al reviewed the available evidence and found that choosing strategies and pathways that were contextually relevant was one of the crucial factors for achieving successful implementation and scale-up of nutrition action. 9
Nigeria is a significant contributor to the global burden of chronic undernutrition in children under 5 years of age. 1,10 The Nigerian government has demonstrated some commitment to addressing malnutrition, 11,12 including with efforts to develop an Agricultural Sector Food Security and Nutrition Strategy (AFSNS). 2 This Nigerian AFSNS 2016-2025 includes outputs targeted at improving nutrition among households who derive their livelihoods from smallholder agriculture, including smallholder pastoralists. 13
Smallholder pastoralists in Nigeria face many challenges to their livelihoods, including limited use of modern inputs and improved technologies/techniques; poor access to credit facilities; inadequate mechanization; poor farm-gate prices; and limited institutional and basic infrastructure, such as research and extension services. 13,14 Specific to milk production, poor genetic composition of local cattle breed; poor feeding practices; archaic production practices; poor milk safety, hygiene, and sanitation practices; lack of cold chain infrastructure; and inadequate market access are significant challenges. 14 -17 Thus, the government plans to improve milk production, yields, and safety among smallholder pastoralists in addition to nutrition objectives through a Dairy Transformation Agenda. 14 The Nigerian Government is currently reviewing the draft national dairy policy document that is meant to regulate the players’ activities in the landscape with a specific focus on local milk sourcing. Therefore, the Nigerian dairy sector has attracted more attention and investments from the organized private sector and development partners toward building a resilient and inclusive industry.
The Advancing Local Dairy Development in Nigeria (ALDDN) is a 5-year program (2020-2024) that aims to improve the livelihoods, productivity, and nutrition of smallholder dairy farmers and the communities in which they live. The design of the ALDDN Programme project was based on a previous project, the Nigerian Dairy Development Programme (NDDP). Nigerian Dairy Development Programme was implemented in 2017 to 2019 to strengthen the Dairy Transformation Agenda of the Federal Government of Nigeria by demonstrating proof-of-scale in processor-led initiatives for dairy development in Nigeria and enhancing the livelihoods of participating dairy farmers. Given reportedly high malnutrition rates among the pastoralists in Nigeria,
18,19
NDDP also included a nutrition assessment to identify potential approaches for improving nutrition among smallholder dairy producers in Nigeria. Nigerian Dairy Development Programme was implemented in Oyo State, South-West Nigeria, and Kano State, North-West Nigeria, among the Fulani pastoralists that dominate the local dairy sector. The specific objectives of the nutrition assessment were to: Understand the determinants of malnutrition among NDDP participating smallholder dairy households in Oyo and Kano states, Characterize their food system and identify factors that likely influence food choices, and Determine potential entry points for improving their nutrition, with a focus on food system entry points.
The study’s findings were used to incorporate a nutrition component into the ongoing ALDDN programme. This article reports the study’s findings to contribute to the literature about operationalizing nutrition-sensitive agricultural frameworks.
Methods
Study Sample
The study used a descriptive, cross-sectional design. In Kano State, 15 Fulani pastoralist settlements across 4 communities were selected from 4 Pastoralist clusters, while in Oyo State, 24 settlements across 17 communities were selected from 5 clusters. The study included both integrated and nonintegrated households from each community. Integrated households already supplied milk to processors involved in NDDP, while nonintegrated households were households in the community that produced milk but did not yet supply milk to these processors. Data was collected between September and November 2017, corresponding with the harvest season in both study states.
A multistage sampling technique was used to select study households, emphasizing households currently participating in the NDDP. In the first stage, Local government areas (LGAs) and clusters were purposively selected based on partnering dairy processors’ focus areas. Subsequently, sample sizes for each cluster were calculated using proportionate allocation such that clusters with larger populations of integrated households had larger sample sizes. Integrated households within the clusters were then listed and study households were selected using simple random selection. Nonintegrated households were also selected. All selected households who were available and willing to participate were included in the study. Within households, male respondents were selected if they were the household head and female respondents had to be a wife of the household head to be eligible. Preference was given to wives who had children under 5 when available. Approval for the study was received from the Federal Ministry of Agriculture and Rural Development and the study was conducted in adherence to the Declaration of Helsinki principles. Verbal informed consent was obtained from community leaders for data to be collected in their communities, as well as from each study respondent before questionnaires were administered or interviews conducted.
Data Collection Tools
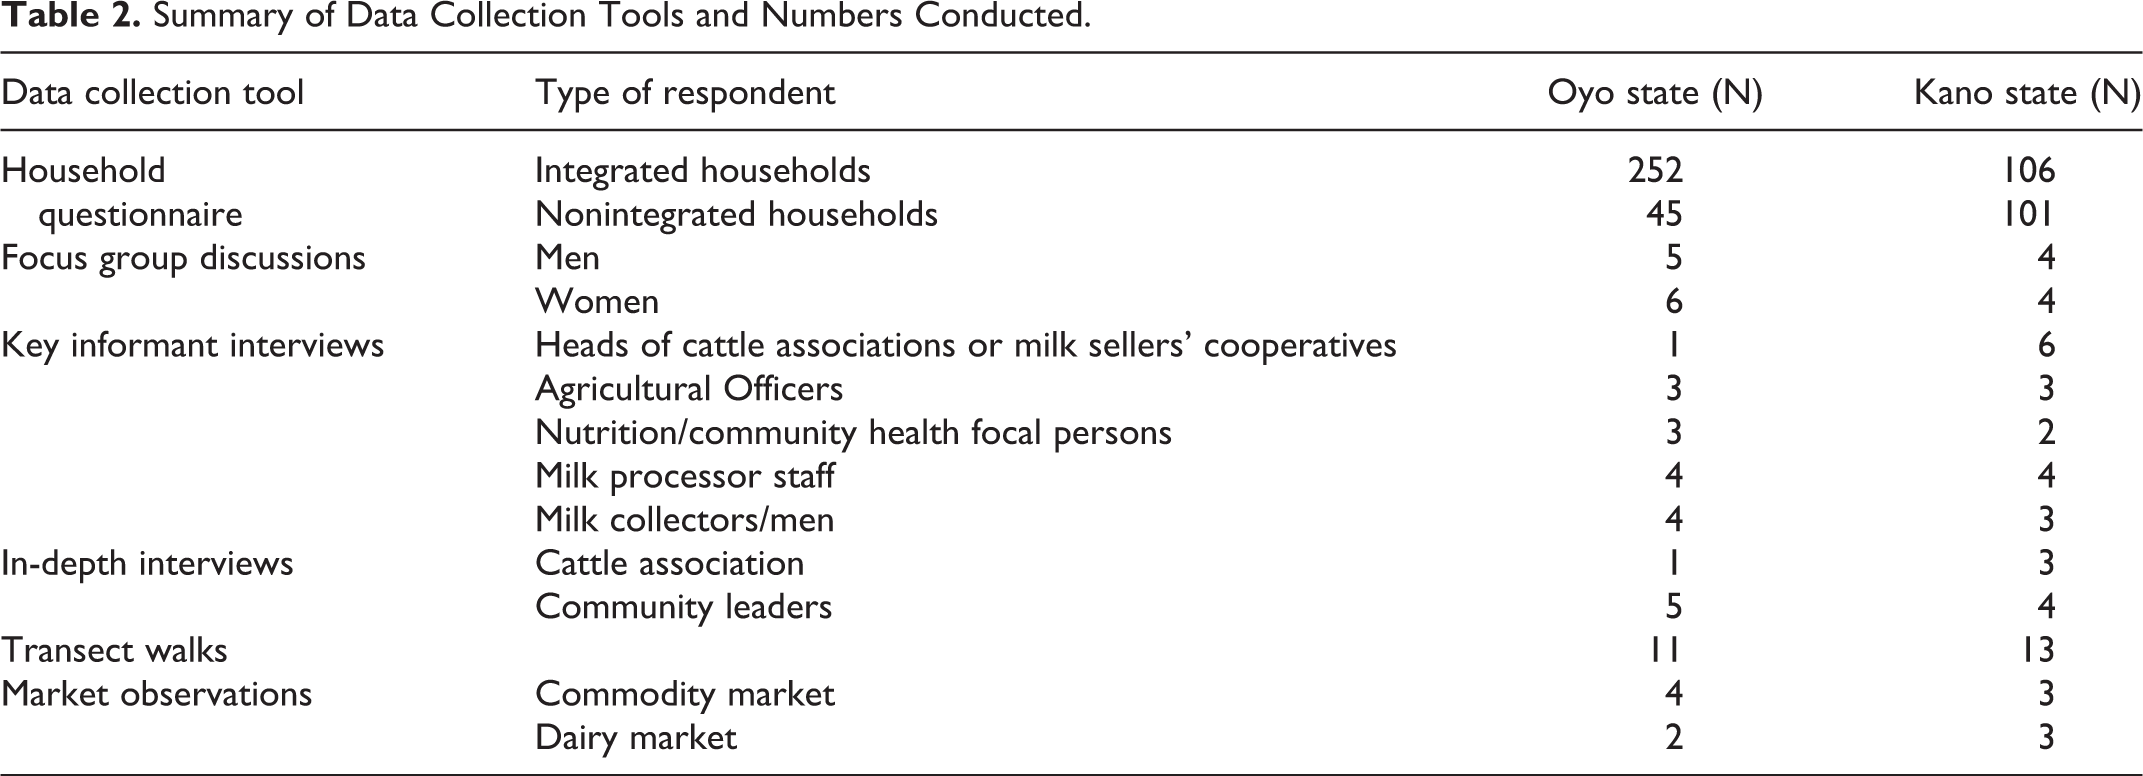
Data were collected at household and community levels. At the household level, a pretested, semi-structured questionnaire was interviewer-administered. The questionnaire included sections about sociodemographic characteristics; food consumption patterns, including food frequency; nutrition training and knowledge; milk production, consumption, and marketing; food production; and questions related to all indicators specified in Table 1. A section of the questionnaire collected open 24-hour dietary recall for women in the household. At the community level, focus group discussions (FGDs), key informant interviews, in-depth interviews, community transect walks, and market observations were used to collect qualitative data about the food system, food economy, and food choices. Table 2 summarizes the type of respondent and sample sizes achieved for each data collection tool per state. Trained research assistants collected data for Kano and Oyo states in the local language in each state – Hausa/Fulfude and Yoruba, respectively.
Indicators and Definitions Used to Assess Nutrition Situation.
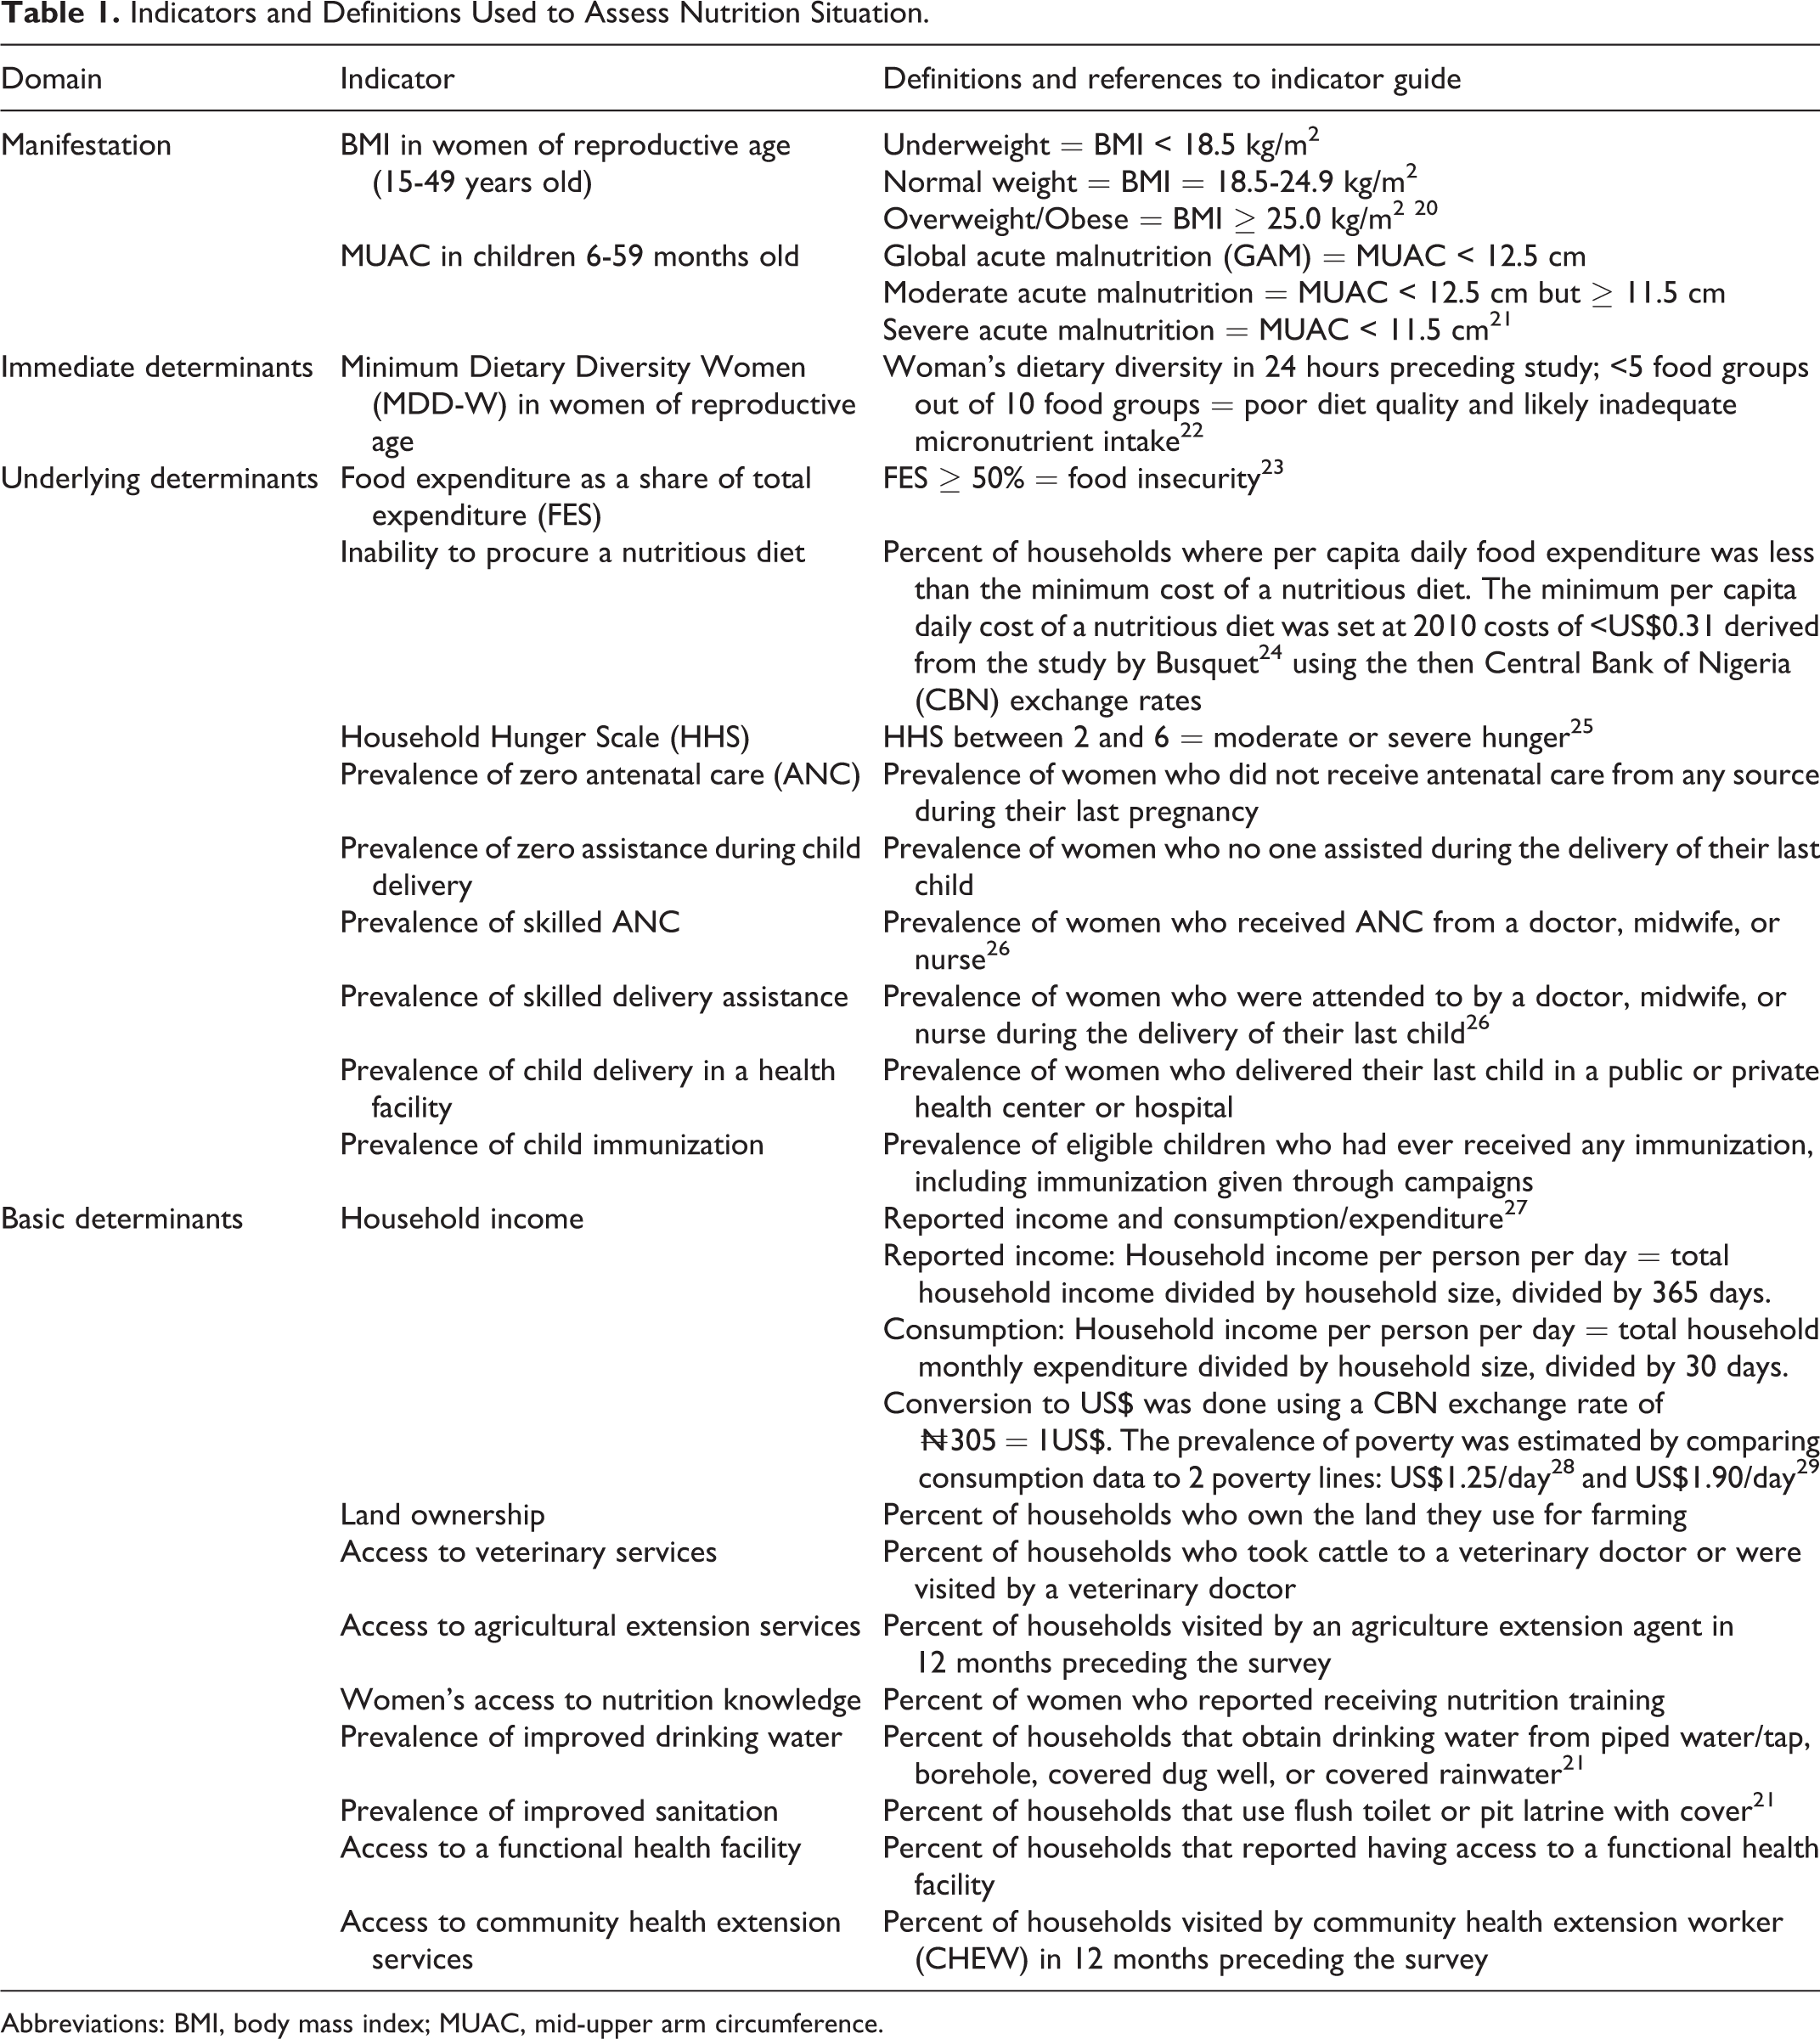
Abbreviations: BMI, body mass index; MUAC, mid-upper arm circumference.
Summary of Data Collection Tools and Numbers Conducted.
Indicators Assessed
Data collection and analyses for the study objectives were guided using existing frameworks. The conceptual framework of malnutrition 30,31 was used to guide data collection and analyses to assess the nutrition situation. Data were collected at the level of the manifestation, that is, nutritional status outcome, and the immediate, underlying, and basic levels of determinants, using the domains specified in the framework. The indicators to assess each domain were identified from the extended UNICEF model developed by Engle, Menon, and Haddad, 32 the consolidated approach to reporting indicators of food security, 23 and the compendium of indicators for nutrition-sensitive agriculture. 33 Table 1 highlights the different indicators used to assess the domains and the definitions used to categorize the nutrition situation.
To characterize the food system and identify factors that likely influence food choices, constructs and domains specified by the Food Insecurity and Vulnerability Information and Mapping Systems framework 34 and the Value Chains and Nutrition framework 35 were used. Food availability was determined by assessing food production and market provisioning. Food access was measured by examining transport and market infrastructure, physical access to markets, and household food sources. Stability was measured by assessing the seasonality of food availability, access, and consumption. Habitual diet quality was examined by assessing the consumption patterns of various food groups. Underconsumed and overconsumed foods, gender roles around food purchase and preparation, intrahousehold food distribution and cultural beliefs, and practices around food were further assessed. The significant drivers of food consumption choices were subsequently examined.
Determining potential entry points for improving nutritional status was achieved by testing hypotheses around the 6 acknowledged pathways that agriculture can improve nutrition. 2 Empirically, hypotheses examined 3 pathways in which agriculture’s impact on nutrition is mediated through food security and the women’s status pathway. The hypotheses also assessed the potential effect of a common mediator, nutrition knowledge and examined whether improved diet quality was likely to enhance nutritional status among the population. Table 3 highlights the pathways assessed, hypotheses tested, and indicators used for hypotheses testing.
Summary of Pathways Empirically Assessed and Corresponding Hypothesis.
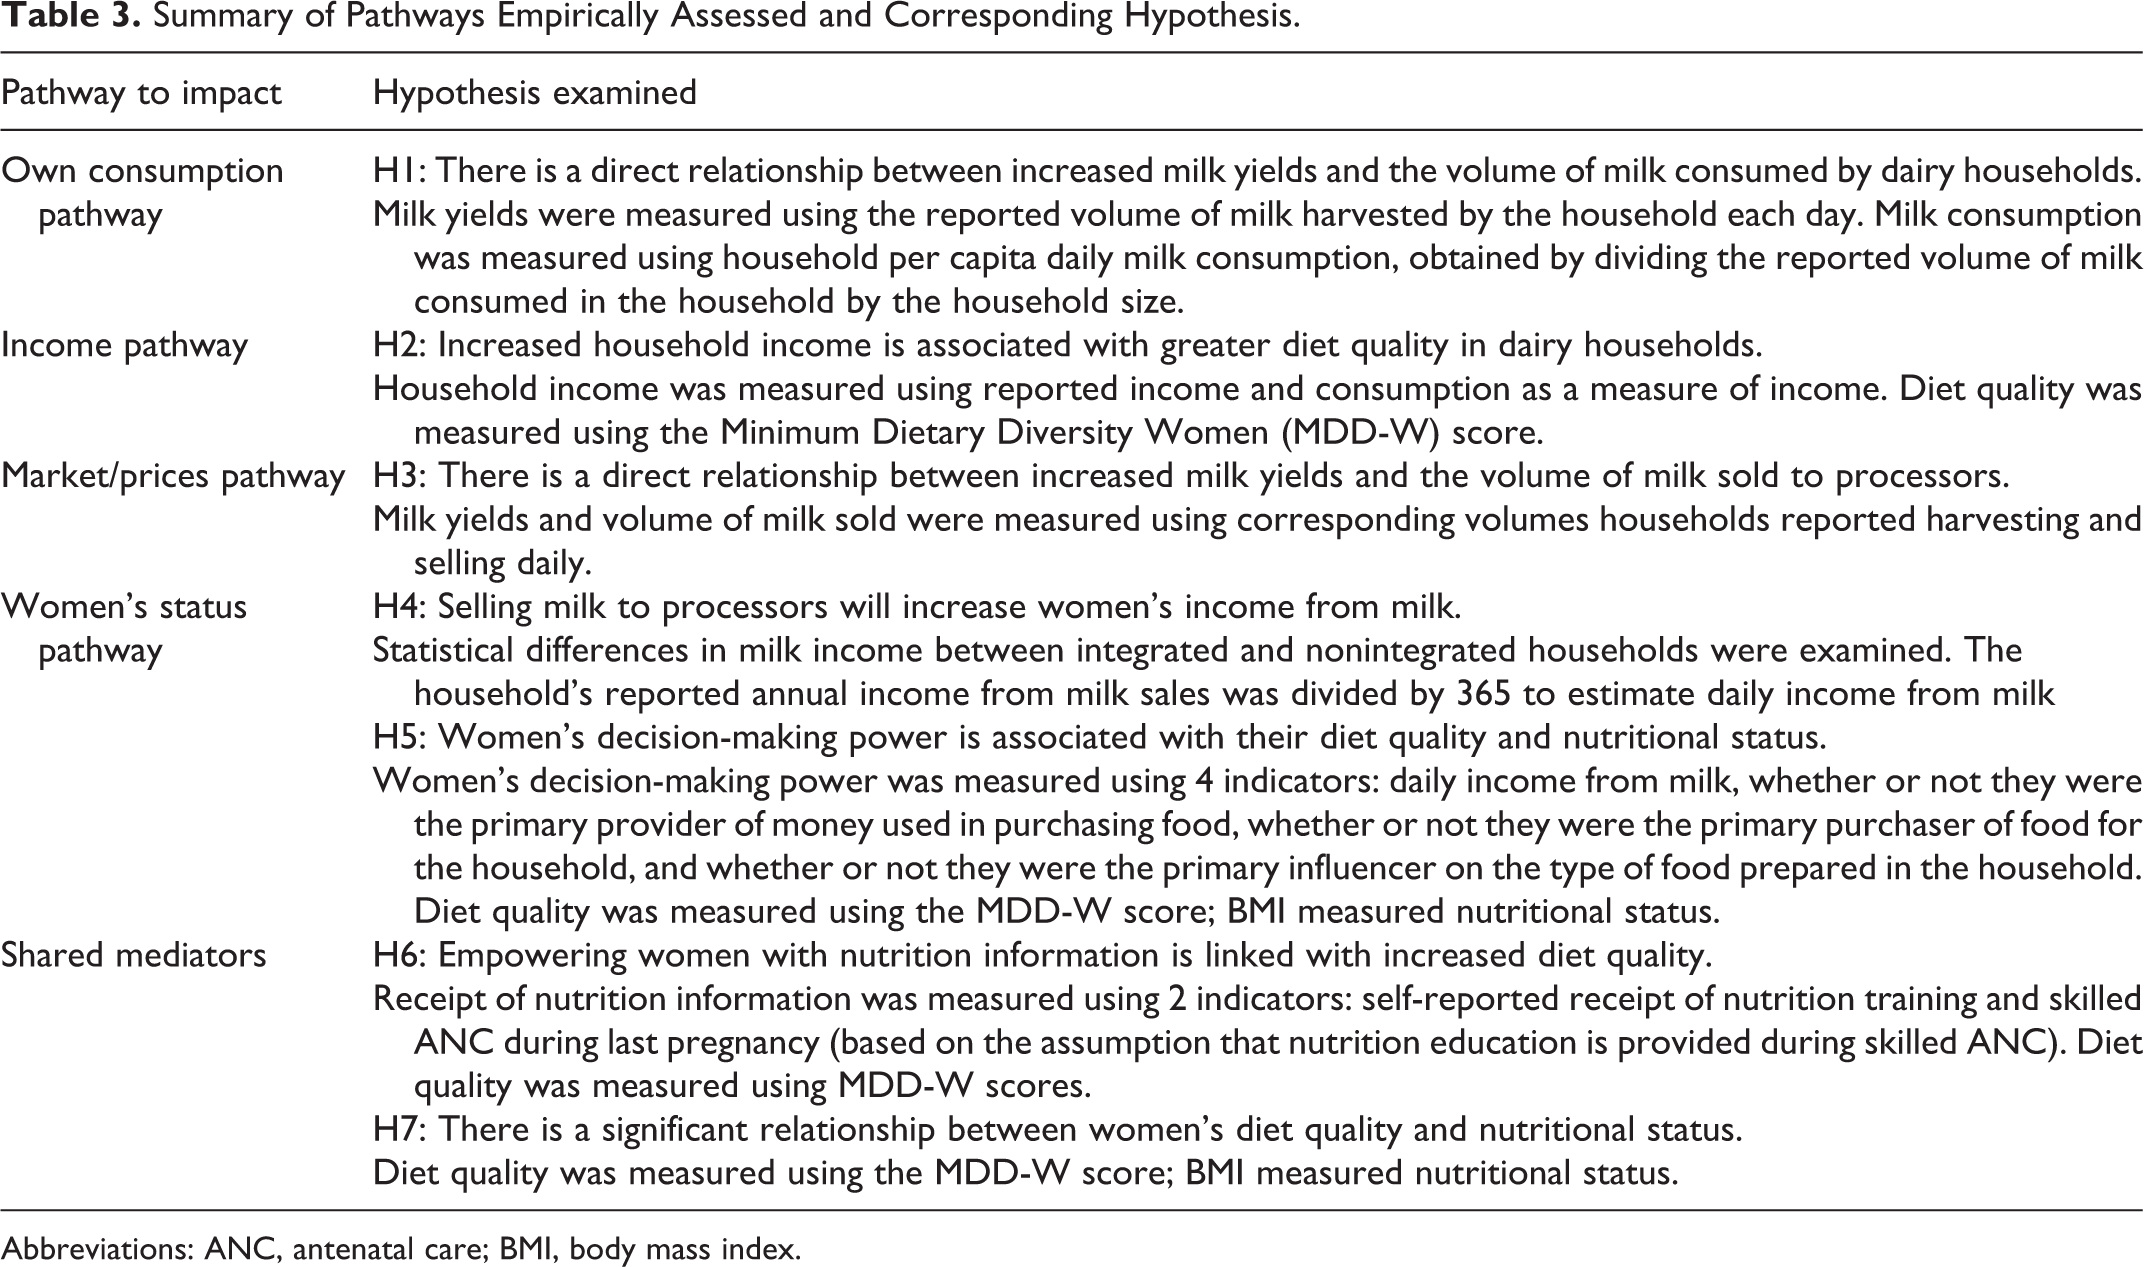
Abbreviations: ANC, antenatal care; BMI, body mass index.
Data Analysis
Quantitative data were analyzed at the state level in Stata 12.0. Percentages were reported for categorical variables and means were reported for continuous variables with minimal outliers. Where there appeared to be outliers, median values were reported. The presence of outliers was detected using scatterplots. Tests for statistical differences were done using chi-square models for categorical variables and t tests to compare means. Hypotheses were tested using chi-square models when variables were categorical. Hypotheses tests between continuous variables were conducted using Pearson correlation coefficient or Spearman rank correlation coefficient, depending on which assumptions of linearity, normality, and no outliers were met. Where the assumptions for neither Pearson nor Spearman coefficient were met, the variables were recoded into categorical variables and chi-square was used to test associations. The probability of decision error, α, was set at 0.05.
Tests and statistics using body mass index (BMI) and MDD-W included only women of reproductive ages (15-49 years) and thus excluded women younger than 15 or older than 49 years. 26,36 Statistics including BMI also excluded pregnant women. Data collected about the frequency of consumption of various foods were collapsed into food groups and compared with South African food-based dietary guidelines (FBDGs). 22,37 South African FBDGs were used because Nigerian FBDGs were worded vaguely and did not suggest a specific number of days in a week that any food group is consumed. South African FBDGs recommend that each of the 5 food groups—cereals/tubers, legumes, vegetables/fruits, meat/fish/eggs, dairy—be consumed daily. Although the study was not statistically powered to compare integrated and non-integrated households, one hypothesis was still tested comparing volumes of milk sold by the two household types. This analysis was conducted to gauge the possibility of an intervention causing harm if it increased the volume of milk sold by integrated households and inadvertently caused them to sell even milk that should be kept for their own consumption.
Qualitative data were transcribed and translated from Hausa/Yoruba to English by competent third parties to minimize bias. Atlas.ti version 7 was then used to code similar patterns of responses and identify major themes and subthemes. The coding was done in relation to the specific objectives and domains/constructs under the assessment.
Results
Households included in the study were primarily integrated households (Table 2). In Oyo and Kano States respectively, 252 and 106 integrated households were surveyed, compared to 45 and 101 non-integrated households respectively. The targeted sample sizes for the survey were 223 and 124 integrated households in Oyo and Kano respectively, and 117 and 78 non-integrated households respectively. Thus, a response rate of >100% was achieved for integrated households in Oyo and non-integrated households in Kano State, while a response rate of 38% and 85% respectively was achieved for non-integrated households in Oyo and integrated households in Kano. Migration of households was the primary reason for non-response. More than 60% of women were 20 to 39 years old in both states, with the average age of 33 and 31 years in Oyo and Kano, respectively. Nearly all women were married, Muslims and Fulani. Arabic schooling was the most common form of education. Almost all women in Oyo (95%) and 85% of those in Kano could not read or write in English. Patterns were similar regarding education of household heads, though they tended to be more educated than their wives. The prevalence of no formal education among household heads was 60% and 36% in Oyo and Kano, respectively. The sale of milk and milk products was the predominant occupation among the women, whereas the household heads reported cattle rearing as their primary occupation. Households were a median of 9 and 8 persons in Oyo and Kano, respectively.
Nutrition Situation
The average BMI of studied women in Kano and Oyo was 21 and 20, respectively, while mid-upper arm circumference in young children was 13 and 15, respectively. The underweight prevalence was 34% and 27%, respectively, while overweight was 2% and 13%, respectively, in Oyo and Kano states (Table 4).
Nutrition and Food System Indicators in Oyo and Kano States.
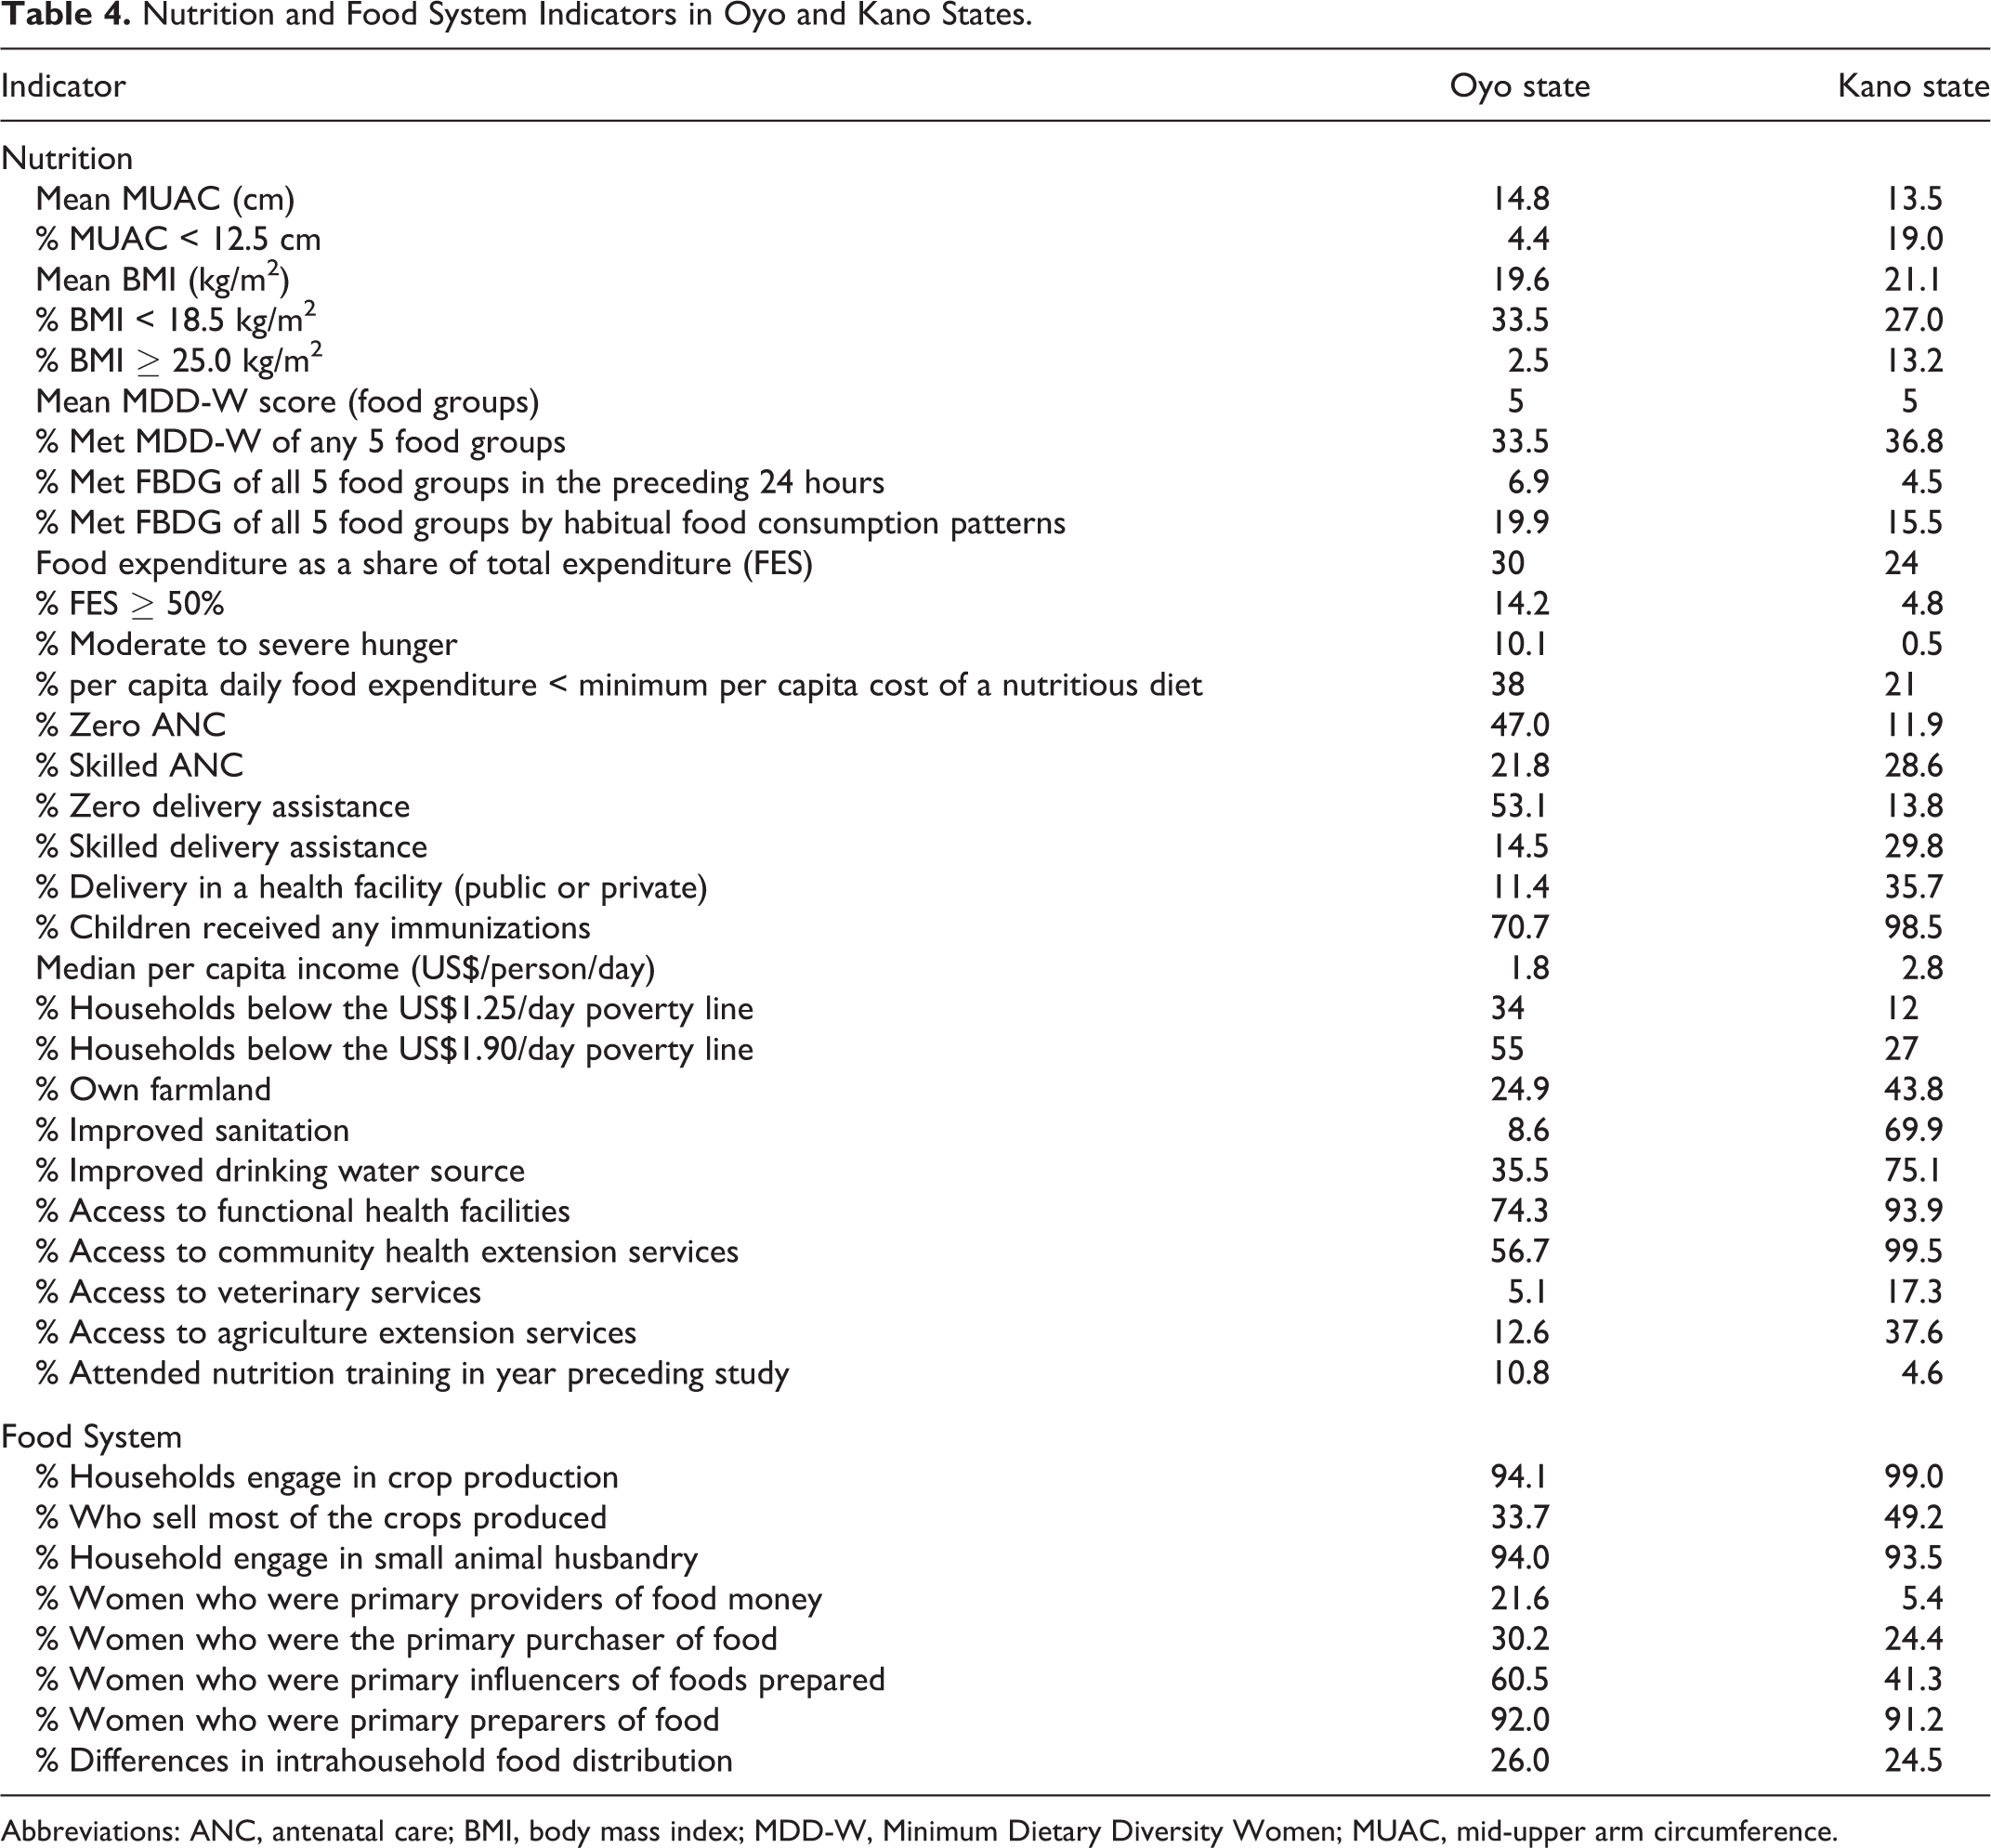
Abbreviations: ANC, antenatal care; BMI, body mass index; MDD-W, Minimum Dietary Diversity Women; MUAC, mid-upper arm circumference.
The average minimum dietary diversity of women (MDD-W) score was 5 food groups in both Oyo and Kano, with a range of 2 food groups to 9 food groups in both states. In Oyo and Kano, 33% and 37% of the surveyed women 15 to 49 years old did not meet the MDD-W of 5 food groups. Diets appeared to be quite monotonous, with many women eating the same foods several times a day. The range of foods consumed by the women was also quite limited and was similar in both states. Women who met the MDD-W (67% and 63% in Oyo and Kano, respectively) generally consumed a starchy meal with a dark green leafy vegetable cooked with red bell peppers (or other vitamin A-rich vegetables), tomatoes (vegetable), and locust bean seeds. Women who ate fish or meat with at least one of their meals, and/or drank milk or another dairy product during the day, and/or ate a bean dish for one or more meals achieved MDD-W scores of 6 or higher. Consumption of eggs was very low (≤10%) and consumption of fruits was virtually nonexistent (≤1%) in both states (Figure 1).
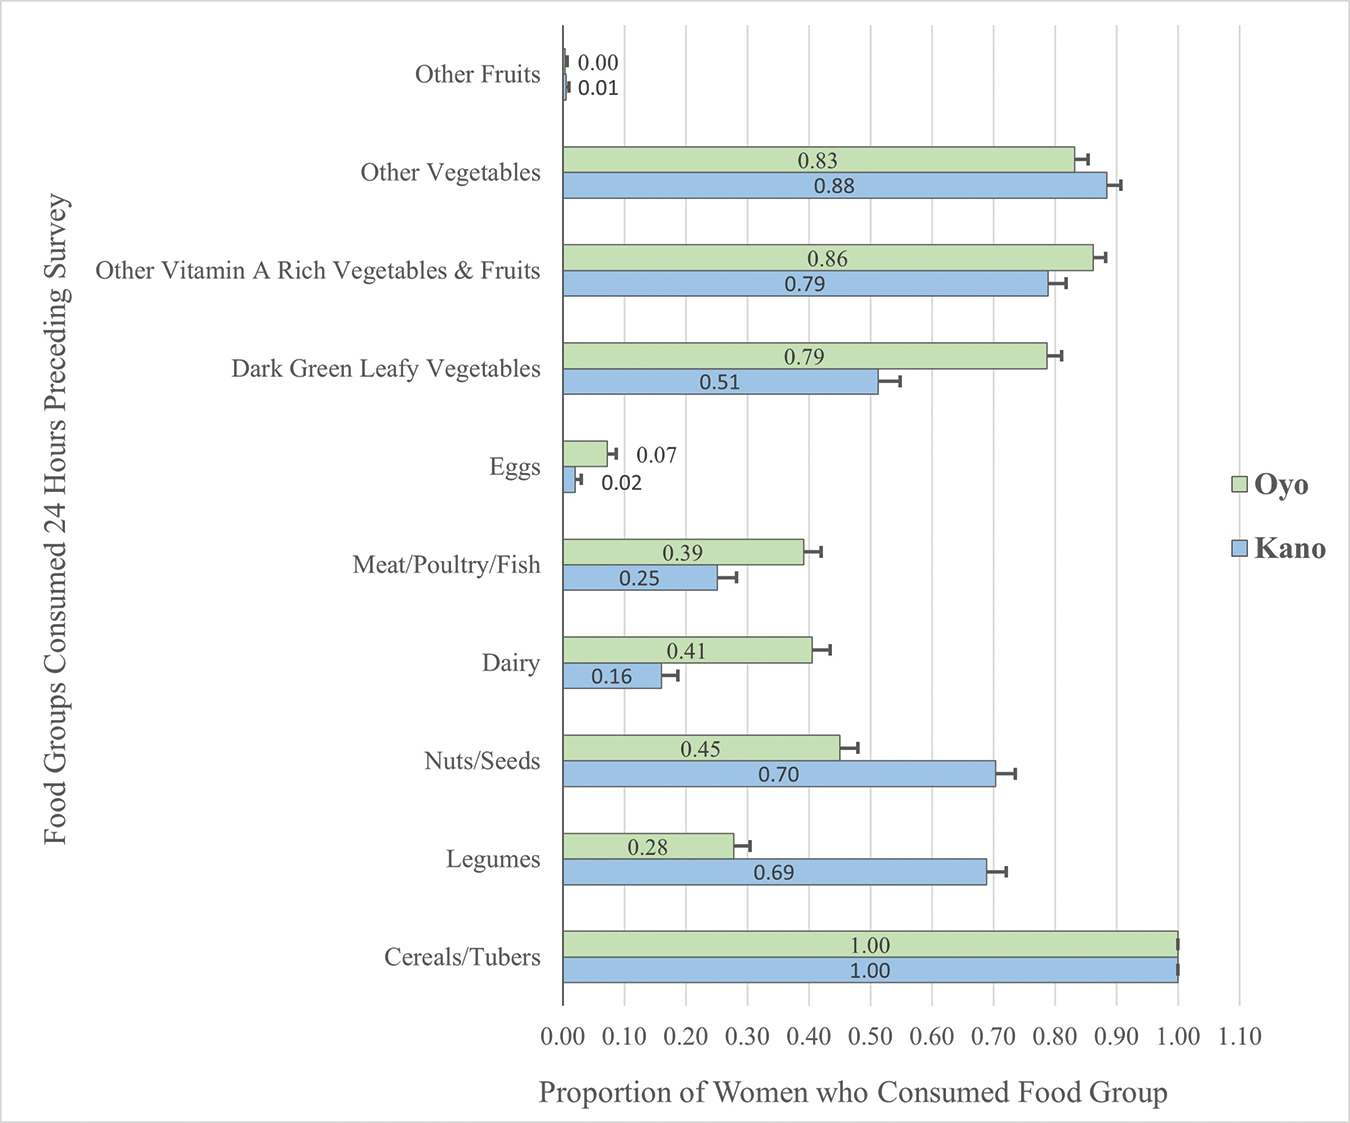
Proportion of surveyed women who consumed each of the 10 minimum dietary diversity of women (MDD-W) foods groups in Oyo and Kano in 2017 (with standard errors).
Food insecurity and hunger were low among households in Kano but evident among households in Oyo; 14% of households in Oyo had food expenditure as a share of total expenditure (FES) ≥50%, compared to 4.8% in Kano. Also, the prevalence of moderate/severe hunger was 10% in Oyo and 0.5% in Kano. There was no overlap between FES ≥50% and hunger in Kano, and only a 1% overlap between FES ≥50% and hunger in Oyo. This means that food insecure households either had FES ≥50% or experienced hunger. Furthermore, estimated per capita daily food expenditure was less than the minimum per capita daily cost of a nutritious diet for a meaningful percent of households in both states. In Oyo and Kano, 38% and 21% of households had spent less than the minimum per capita cost of a nutritious diet in the 30 days preceding the study. Mean per capita daily food expenditure in Oyo and Kano was US$0.63 and US$0.99, respectively. Generally, the prevalence of essential care, sanitation, and access to health services were inadequate but considerably more so in Oyo than in Kano (Table 4).
Resources for food security, health, and care were poor in both states but much more inferior in Oyo. For instance, 34% and 55% of the households in Oyo were below the poverty lines of US$1.25/day and US$1.90/day, respectively, compared to 12% and 27% of households in Kano. Less than 30% of households in Oyo had access to services and factors that could increase their productive capacities, such as land ownership (25%) and access to veterinary (5%) and agriculture extension (13%) services. In Kano, land ownership, access to veterinary services, and agriculture extension services were 44%, 17%, and 38%, respectively. Although 74% of households in Oyo had access to functional health facilities (compared to 94% in Kano), the facilities were quite a distance away, with 99% of households having to take a vehicle or a motorcycle for a mean of 54 minutes (median of 45 minutes) to get to the health facility. For care resources, 11% and 5% of households in Oyo and Kano, respectively, reported having attended nutrition training in the year preceding the survey. More than half of these households in Oyo (58%) reported that the training had been received from the milk processor to which they supplied milk. However, milk processor informants stated that training focused on animal nutrition; human nutrition education had been ad hoc and informal. Other sources of training mentioned included health center and mosque events.
In addition to the quantitative evidence, key informants’ perceptions supported a poor nutrition situation among the smallholder dairy-producing households. Key informants mentioned contributing factors to malnutrition included poor personal hygiene and water, sanitation, and hygiene (WASH) conditions, inadequate use of health services, and inadequate food purchase and consumption decisions.
Characteristics of the Food System
Although a minority of households surveyed owned land, nearly all households (≥94% in both states) reported being engaged in crop production, with farmland commonly rented. A considerable proportion (49% in Kano and 34% in Oyo) produced crops primarily for sale. Nearly all (≈94%) of the Kano and Oyo households also engaged in small animal husbandry. In both places, women were the primary food preparers in households (>90%). However, more women in Oyo (60%) were the primary influencers of foods prepared by their households, while more men in Kano (59%) primarily influenced foods prepared. Oyo also had a meaningful proportion of women who were the primary provider of money for food purchases (22%), compared to 5% in Kano (Table 4). About a quarter of households in both states reported prioritizing one or more family members when serving food. Among households that prioritized specific members differently, husbands (household heads) were generally reported to be prioritized as a sign of respect. However, a few women reported prioritizing their husbands to get the husband's attention.
Food frequency data showed that fish/meat, eggs, and fruits were the food groups least consumed daily in both Oyo and Kano. Based on the food frequency data, 20% and 15% of households in Oyo and Kano, respectively, met FBDGs. However, based on MDDW data, just 7% and 4% of households in Oyo and Kano met FBDGs. The FGD participants confirmed these findings; for instance, they highlighted that meat consumption is occasional, occurring during significant events. Kano’s key informants noted that men were the primary decision-makers around food in smallholder dairy farmer households. They indicated that husbands decide first, and the wives decide next. Key informants explained that food choices were heavily influenced by food availability, accessibility, and affordability. Food choices were also reportedly influenced by migration, education/knowledge, tradition/culture, and storage infrastructure. The foods preferred and consumed were heavily dependent on the crops planted, but households purchased some food items that they did not produce. Food was abundant in the major markets used by NDDP study households. Though these markets had tarred access roads, well-structured stalls, water supply and shops with locks, they were not readily accessible as they were, on average, at a distance of about 50 minutes by foot from most households in both states. Many communities in Oyo, in particular, were in what may be considered rural areas deep in the interior parts of the state.
High poverty levels, large family sizes, and seasonally high food prices were significant challenges affecting the purchase and consumption of adequate diets. Apart from the food itself, availability and access to cooking fuel were other issues affecting food consumption. Firewood was the cooking fuel for 96% and 98% of households in Oyo and Kano, respectively. Most (80%) households in Oyo reported cooking fuel readily available, while only 40% of households in Kano reported availability. Even when food was available, accessible, and affordable, respondents’ knowledge about the importance and adequate food combinations was critical to healthy eating. When households were asked to state what they understood by the term “eating well”; “eating healthy” and “body building food” were the most frequent definitions used in both states. In Kano, “good food” and “variety of food” were also commonly used.
Potential Entry Points for Improving Nutrition
There was a significant and positive correlation between volume of household milk yields and the volume of milk consumed per capita (Spearman ρ was 0.30 [P < .0001] and 0.33 [P < .0001] in Oyo and Kano, respectively). The median milk volume produced in Oyo and Kano was 30 L/day and 25 L/day, respectively, while the median volume consumed was 0.5 L/person/day and 0.7 L/person/day, respectively.
This NDDP study also found a very strong positive relationship between the volume of household milk yields and the volume of milk offered for sale, indicating that increased milk production will increase the market supply of milk. The median volume of milk sold in Oyo and Kano is 25 L/day (mean of 40 L/day) and 22 L/day (mean of 29 L/day), respectively. Spearman ρ for correlation between the volume of milk produced and volume sold was 0.90 (P < .0001) for Oyo and Kano states. Five percent and 3% of integrated households in Oyo and Kano sold milk volumes equal to their total production.
There was no statistical difference between the volume of milk produced by integrated households versus nonintegrated households in either state. However, integrated households in Kano sold a significantly (P = .016) higher proportion of the milk they produced than nonintegrated households. The mean daily milk income in Oyo was substantially lower than that in Kano because milk prices were higher in Kano.
There appeared to be no relationship between household per capita income and MDD-W in the NDDP study. There also seemed to be no relationship between per capita income and BMI. In Oyo State, there was a significant association (P = .002) between milk income tertiles and whether or not a woman met MDD-W. In the lowest tertile, 56% of women met MDD-W, compared to 72% and 84% of women in the middle and highest tertiles, respectively. In Kano State, although 61% of women in the lowest tertile met MDD-W, compared to 67% and 66% in the middle and highest tertiles, respectively, there appeared to be no statistical association between milk income and MDD-W (P = .89). There was no significant association (P > .05) between any of the indicators of women’s status and MDD-W or BMI category in either state.
Significantly (P = .04) more women in Oyo (11%) than in Kano (5%) reported having received nutrition training. While there appeared to be no relationship between training attendance and MDD-W in Kano, women who attended training in Oyo were statistically more likely to meet MDD-W. In Oyo, 86% of women who attended training met MDD-W compared to 64% of women who had not (P = .048). Similarly, there was a significant relationship (P = .04) between the use of skilled antenatal care (ANC) during the last pregnancy and MDD-W in Oyo State. There was no relationship between skilled ANC and MDD-W in Kano (P = .71). There was also no relationship between attendance at training and BMI category in either state.
Discussion
This study aimed to understand factors associated with malnutrition among smallholder dairy households to facilitate the design of the nutrition component of a dairy development program. The study found that diets were generally poor among the target households. Food insecurity was prevalent among households in Oyo but not so much in Kano. Care practices and access to health services were inadequate in both states, but more so in Oyo. The consumption of adequate diets was limited by insufficient physical and financial access to nutritious foods, with high poverty levels, large family sizes, and high food prices, particularly limiting the affordability of nutritious diets. Poor knowledge about healthy diets, traditions, and culture also limited the consumption of nutritious diets.
Based on Nigeria’s seasonal calendar, 38 the study was conducted during the harvest season for both Oyo and Kano states. A study 39 conducted in Katsina and Sokoto states in northern Nigeria at the beginning of harvest reported an average MDD-W score of 5, with 71% of women surveyed meeting MDD-W. The report further stated that the MDD-W score was likely to reflect the highest score for the population since vegetables and other foods were most abundant during this period. The relatively high prevalence of food insecurity and hunger in Oyo was worrisome since the data were collected during a period in which food was expected to be abundant. It, however, aligns with previous studies of smallholder farmer households 40 and other households 41 in Oyo State, which reported a high prevalence of food insecurity. Adebayo (2012) reported a 53% food insecurity prevalence, 40 while Ganiyu and Omotayo (2016) reported a 29% prevalence of food insecurity among the households in one LGA of the state. 41 For access to care and health, the 2013 Nigeria Demographic and Health Survey results indicate that the households included in the NDDP study were worse off than the average household in Oyo, while those in Kano appeared better off than average.
The reliance of food consumption on household’s produced foods is well-documented in the literature. It is, as previously mentioned, one of the pathways that can be harnessed to improve nutrition through agriculture. 2 The influence of culture and religion on food system characteristics among studied households is similar to that previously documented for smallholder farmers in northern Nigeria. 39 The issues around intrahousehold food distribution and gender roles in the household food system were likewise similar to those previously documented. A recent review 42 highlights men’s prioritization in traditional communities’ intrahousehold food distribution.
Although study households defined “eating well” to mean eating healthy, body building food, good food, and a variety of food, the definitions of these terms may be more consistent with cultural perceptions than with evidence-based definitions. A large multinational study around definitions of healthy eating 43 found that people’s definitions of healthy eating were influenced by their access to nutrition and health information. Individuals with limited access to such information consistently defined healthy eating in terms that were not aligned with standard dietary guidelines for nutrition and health.
Although the volumes of milk consumed in this study appeared high, it should be noted that consumption was estimated using the amount of milk kept for household use. This means that the consumption includes all dairy products consumed and not just fluid milk. One of the popular products locally made from milk is butterfat, comparable to ghee, which is nutritionally classified as fats and oils and not as dairy. 26 Moreover, the food consumption patterns data and the MDD-W results emphasize that many women do not consume milk or other dairy daily. Apart from the multiple uses of milk, the nondaily consumption of milk could be due to unequal intrahousehold milk allocation, as noted in the study by Azzari et al. 44
Unlike this study, other studies have documented associations between achieving MDD-W and higher socioeconomic status. 45,46 Studies have also consistently documented that undernutrition decreases with higher income 47,48 and that overweight/obesity increases with higher income in countries with a per capita gross national product in Nigeria’s range. 49,50 Nevertheless, some studies have found no relationship between socioeconomic status and MDD-W 51 and reports highlight how increased income may not be associated with improved nutritional status. 4
One explanation for the lack of direct relationship between per capita income and MDD-W or BMI in this nutrition study may be the strong influence that culture and religion have on nutrition and health. The effect of higher income on malnutrition is at least partly mediated by the impact of greater access to all the determinants of nutrition. 52 Yet, having greater access to all the determinants of nutrition will not translate to improved nutrition if utilization does not follow access. It is possible that in this population, the effect that higher income could have in addressing malnutrition is attenuated by the fact that individuals largely conform to the same practices regardless of household income. The apparent lack of relationship could also be because increased income is used to procure items that have no impact on nutrition. 53 Other nutrition studies in northern Nigeria 54 similarly found no relationship between wealth and anthropometric outcomes even after adjusting for confounding. Moreover, the dietary diversity indicator that has been validated with household socioeconomic status is the household dietary diversity score. 26,55 Minimum Dietary Diversity Women likely reflects women’s status and socioeconomic status. 60
The relationship between the volume of milk produced and the volume sold is consistent with the market pathway for improving nutrition through agriculture. However, the study also observed a possibility that greater market access, measured using integration status, may be causing households to sell even milk that should be kept for own household consumption. International Fund for Agricultural Development emphasizes the need to consider and mitigate such tradeoffs when supporting households to increase market access to facilitate the sale of nutritious foods. 39
The positive association between milk income and MDD-W in Oyo but not in Kano is a possible reflection of the greater ability of women in Oyo to buy food with milk money earned, as is discussed further below. A national study in Ghana 51 found that women who participated in decision-making around household purchases had higher MDD-W.
The importance of nutrition education and behaviour change communication (BCC) in mediating the effect of the assessed pathways on improved nutrition cannot be overemphasized. Without nutrition education and BCC, interventions acting on any or all pathways are not likely to improve nutrition. 4 For instance, the need for adequate and appropriate nutrition education in this NDDP nutrition study was reflected in the probability that some households were selling milk at the expense of their own consumption. Furthermore, this study found that achievement of MDD-W in Oyo, but not in Kano, was associated with whether or not women reported receiving nutrition training and whether or not women had received skilled ANC. Again, this finding may reflect the more significant influence women in Oyo have over food decisions. Worsley, in a review of the relationship between nutrition knowledge and food behaviour highlighted that the relationship is affected by many factors, including the opportunity and ability to use the knowledge. 56 Significantly more women in Oyo than in Kano were the primary influencers of foods prepared in their households, suggesting a greater ability to use nutrition training. The findings suggest that women’s empowerment is not only a pathway for agriculture to improve nutrition, as is established in the literature 57 ; it is also a mediator between other pathways and nutrition, as is increasingly recognized in recent studies. 39,58
Limitations and Strengths of the Study
The study was conducted during the harvest season where access to food from own harvest may be higher relative to the pre-harvest or planting season. Increased disposable income among rural households at this time may also influence market dynamics differently than at other times of the year. Thus, the findings from the study may not reflect the situation of the study population all year round. In addition, the study used a cross sectional design, assessing both exposures and outcomes at the same time, and thereby making it impossible to establish causality. It is therefore possible that the agriculture-nutrition relationships observed are due to some other unobserved factors. The study further covered smallholder dairy producers in just two out of the 36 states in Nigeria, and the findings may not be representative of such producers nationally. Nevertheless, the study has some strengths that encourage confidence in the findings. For instance, the study was designed based on established theoretical frameworks and therefore collected data about many of the multisector factors that influence nutrition. Moreover, the study used multiple data collection methods and involved a wide range of relevant stakeholders, allowing triangulation of findings.
Implications of the NDDP Study for the Advancing Local Dairy Development in Nigeria Programme
The lessons from NDDP implementation informed the design and implementation of the ALDDN. The ALDDN programme is implemented in Adamawa, Kaduna, Kano, and Plateau states. The ALDDN programme, launched in January 2020, is targeted at developing a vibrant local dairy sector in an inclusive and resilient manner through improving productivity, livelihoods, and nutrition of smallholder dairy farmers, especially women and the local communities in which they live. 59 Advancing Local Dairy Development in Nigeria applies the social and BCC approach to capacity building in nutrition. The intervention involves participatory training, action planning, and minimizing barriers to change to improve the dietary diversity and hygiene of 120 000 program beneficiaries. Advancing Local Dairy Development in Nigeria works with key local influencers in identifying and promoting key training messages.
Specifically, based on the NDDP nutrition study findings, the interpretations of these findings using existing literature, and general principles for nutrition-sensitive agriculture,
8
the following nutrition-sensitive actions were incorporated into the design of the ALDNN programme. Nutrition education, BCC, and social marketing: nutrition education for ALDDN focuses on increasing declarative knowledge—awareness of things, and procedural knowledge—knowing how to do something. Nutrition education, BCC, and social marketing are targeted at both men and women in beneficiary households, given the role both genders play in food decisions. Support for home gardening: ALDDN beneficiary households are being supported to diversify food production in rainy and dry seasons and facilitate household access to diverse nutritious foods all year round. Support for improved water and hygiene facilities: ALDDN provides boreholes in program communities to increase household access to improved water sources. The program also aims to train households about soapmaking and the construction of handwashing facilities, to reduce barriers to optimal hygiene practices.
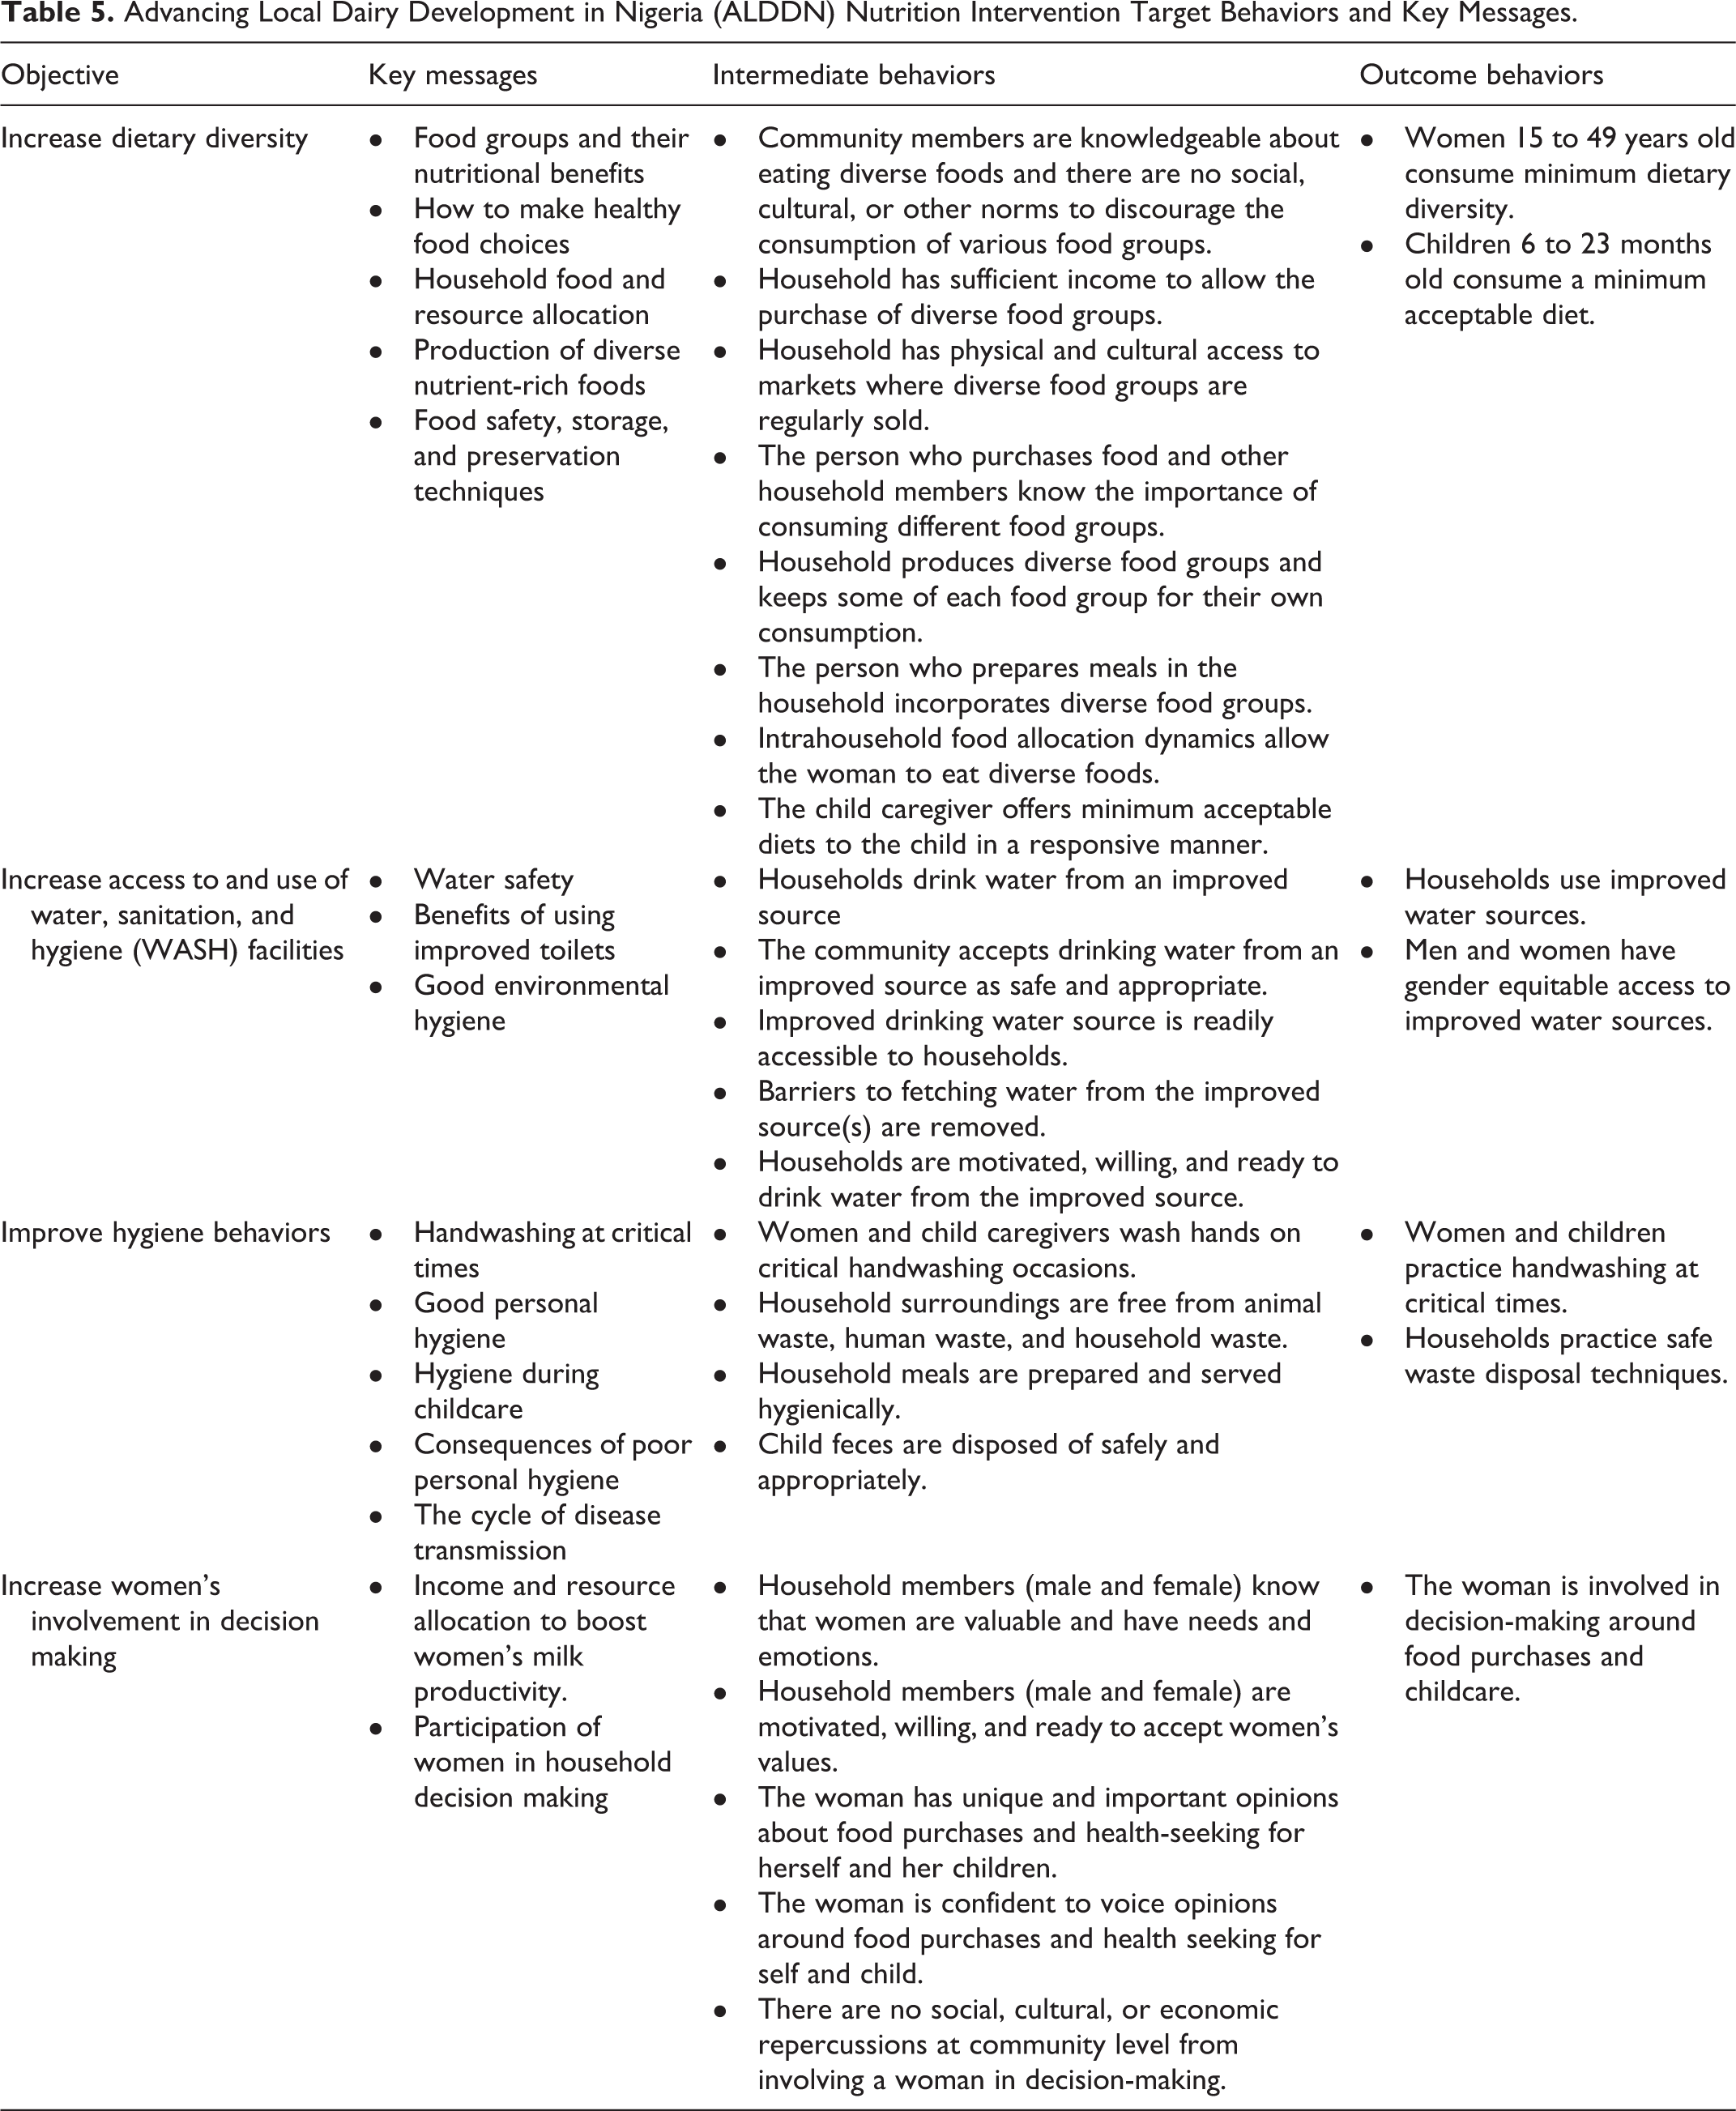
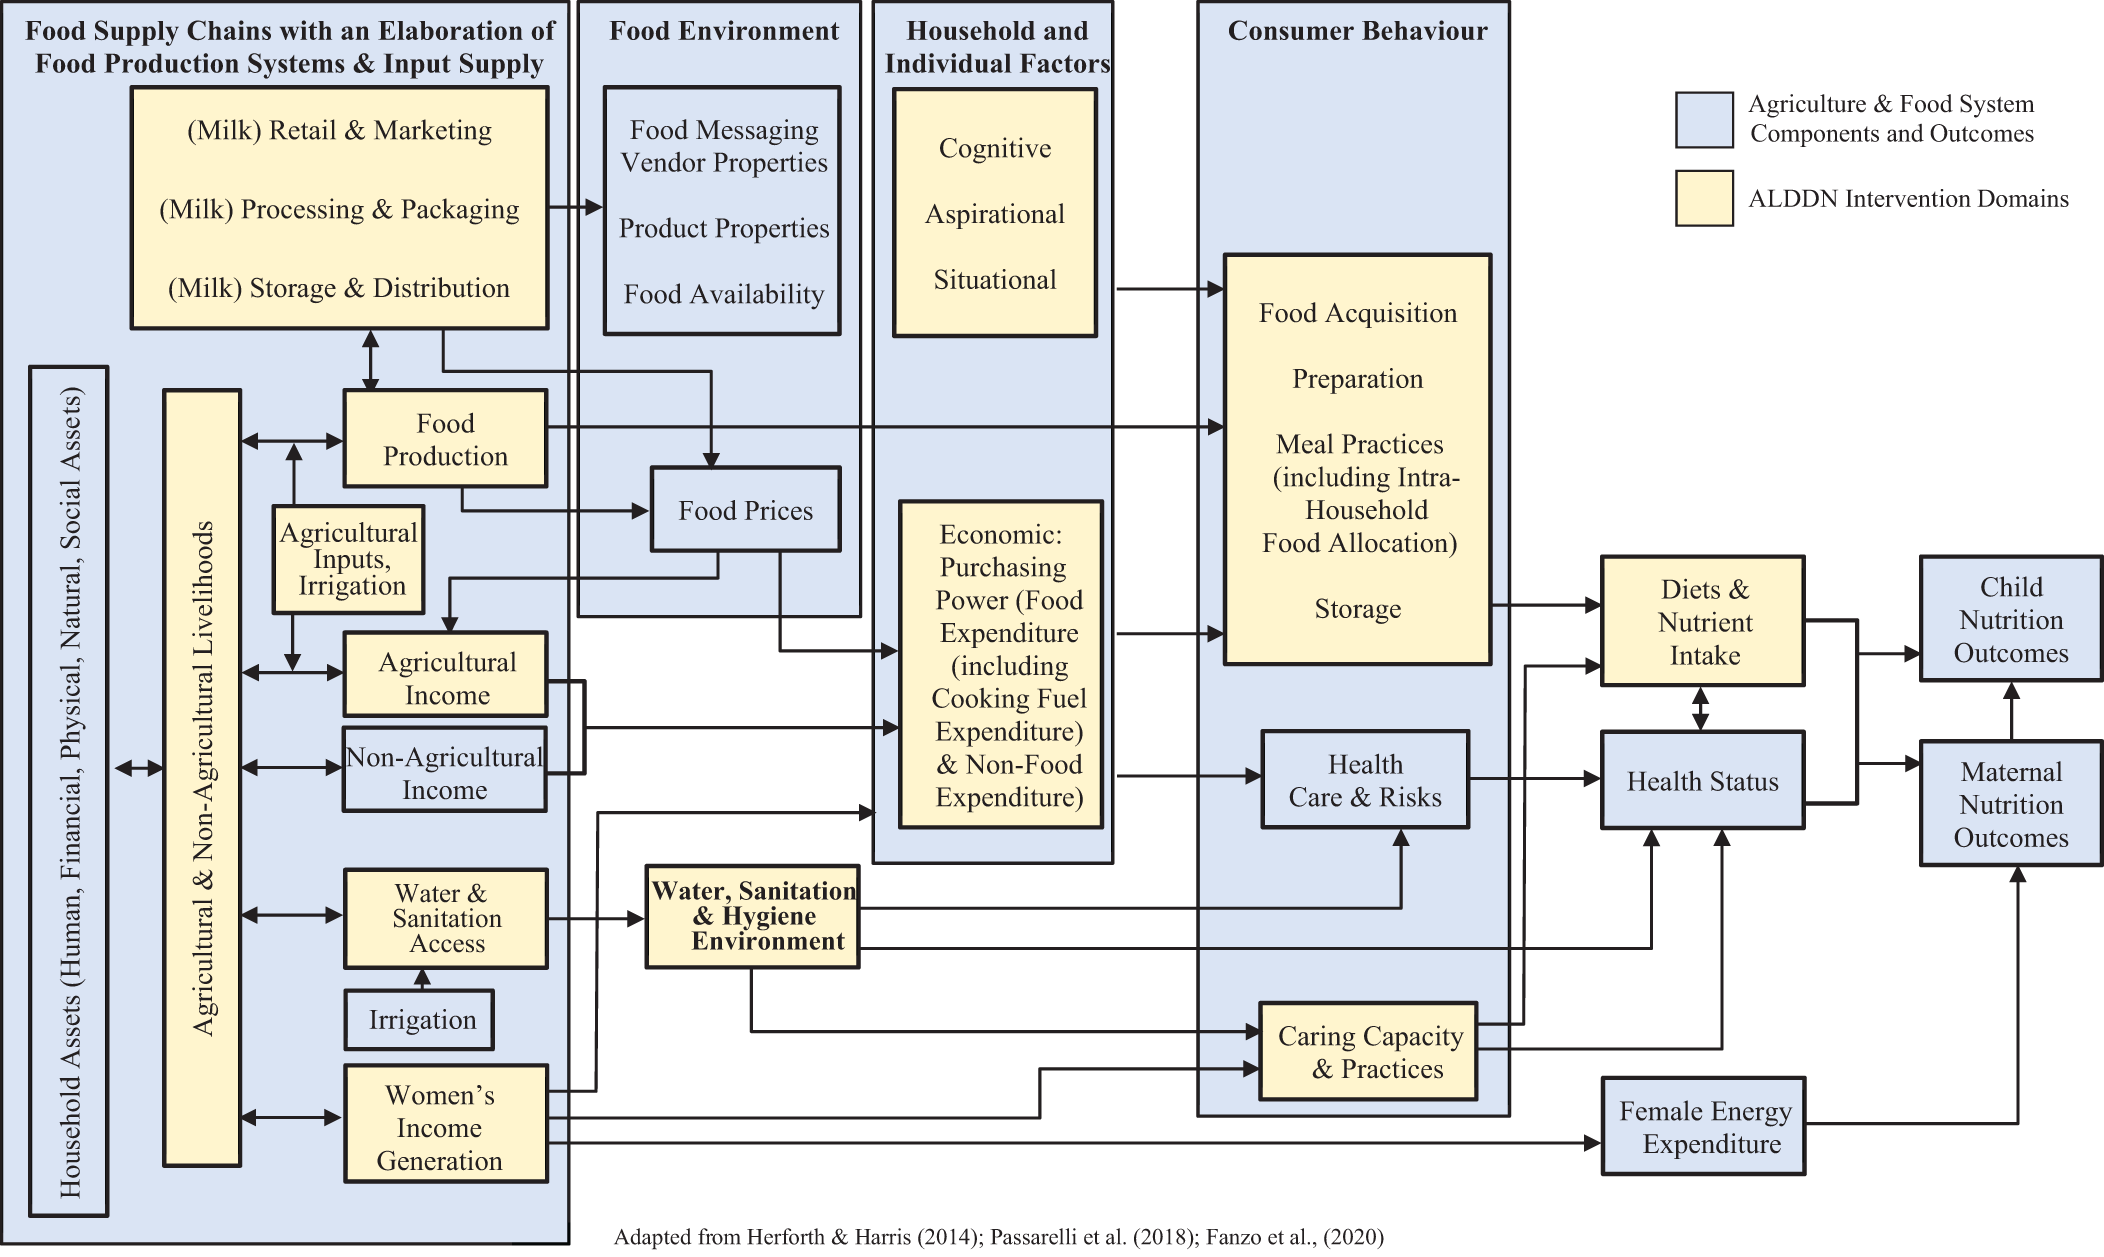
Table 5 highlights the nutrition objectives of the ALDDN programme and the targeted nutrition outcomes, and Figure 2 highlights the proposed pathways through which the ALDDN project will improve nutrition.
Advancing Local Dairy Development in Nigeria (ALDDN) Nutrition Intervention Target Behaviors and Key Messages.
Conclusion
Poor nutrition was a considerable challenge among smallholder dairy producers in Oyo and Kano. Although Kano households had better access than Oyo households to resources for food, health, and care; utilization of health services and dietary intake were similarly inadequate. The study showcased men’s important role in food purchase and consumption, particularly in Kano. Women’s control over food resources and involvement in food decisions seemed critical for improving nutrition since opportunities and the ability to use nutrition education appeared essential for translating knowledge into improved practices.
The own consumption, income, women’s empowerment, and environmental sanitation pathways appeared to be the most feasible pathways for improving nutrition within the context of the study population; with the own consumption pathway focusing on the portion of milk kept for households’ consumption as well as diversification of foods produced for household consumption. The right mix of interventions for improving nutrition in the population needs to include increased food production, income, and nutrition education.
Footnotes
Acknowledgments
The authors acknowledge funding support from the Bill and Melinda Gates Foundation for this study, as part of the Nigerian Dairy Development Programme.
Declaration of Conflicting Interests
The author(s) declared no potential conflicts of interest with respect to the research, authorship, and/or publication of this article.
Funding
The author(s) disclosed receipt of the following financial support for the research, authorship, and/or publication of this article: Received funding support from the Bill and Melinda Gates Foundation.