
Abstract
Background:
Agriculture can influence diets through consumption of home-produced foods or increased purchasing power derived from sale of agricultural commodities.
Objective:
This article explores cross-sectional relationships between agricultural diversification and dietary diversity (a proxy for micronutrient adequacy) among women of reproductive age in rural Tanzania.
Methods:
Dietary diversity was measured using the women’s minimum dietary diversity score indicator. Data were analyzed from the baseline survey of a cluster randomized control trial in Rufiji, Tanzania. One woman of reproductive age was randomly surveyed from each eligible household, totaling 1006 individuals. Generalized linear mixed-effects models were used to estimate the relationship between agricultural indicators and dietary diversity.
Results:
Median dietary diversity score for women was 3.00 (interquartile range: 2-3). Approximately 73% of households grew at least 1 crop in the previous year. Women’s dietary diversity score was positively associated with cropping diversity (P for trend = .04), ownership of livestock (adjusted coefficient: 0.30; 95% confidence interval [CI]: 0.08-0.44; P = .005), cash crop production (adjusted coefficient: 0.22; 95% CI: 0.03-0.41; P = .02), and production of pulses (adjusted coefficient: 0.50; 95% CI: 0.27-0.74; P < .0001) and other vegetables (adjusted coefficient: 0.64; 95% CI: 0.11-1.17; P = .02).
Conclusions:
Average dietary diversity is well below the recommended 5 food groups per day, a widely used indicator of micronutrient adequacy. Since the majority of households participate in agriculture, the efforts to promote agricultural diversification and/or specialization and sale of agricultural goods may positively influence dietary diversity and associated health and nutrition outcomes.
Introduction
An estimated 815 million people worldwide are chronically undernourished; the majority live in low- and middle-income countries (LMICs). 1 Although an insufficient amount of food is a significant contributor to undernutrition, quantity of food alone is not sufficient for optimal health. Consuming a diverse diet is important to prevent micronutrient deficiencies. 2,3 Micronutrient deficiencies are common globally, particularly among households of lower socioeconomic status who tend to consume 1 or 2 staple grains with irregular consumption of other nutritionally dense foods, such as fruits, vegetables, and animal source foods. 4,5
Dietary diversity scores, based on the number of food groups consumed over a specified period of time, have been developed as a proxy for diet quality and have been validated as predictors of micronutrient adequacy. 2,6 These measures are becoming increasingly popular in LMIC settings, where resources to collect and analyze dietary and nutrient data are often scarce. 7 For women of reproductive age, studies have shown that increased dietary diversity score is associated with decreased incidence of maternal micronutrient deficiency 2,3,8 as well as improved pregnancy outcomes 9 and higher child dietary diversity scores. 10
Agriculture can influence the diets of farmers and their families through several mechanisms. Agriculture is particularly important for women who make up the majority of smallholder farmers in sub-Saharan Africa. 11 Jones proposes that agricultural biodiversity can affect diets through consumption of food produced at the home and via increased purchasing power to buy food at the market through the sale of crops. 12 In addition, Ruel et al propose that agriculture can also influence diets by affecting food prices at the market, improving women’s social status, and positively supporting women’s health by increasing her access to diverse and nutritionally dense food. However, agriculture can also negatively affect a woman’s health by increasing her nutritional requirements due to high energy expenditure and by increasing her exposure to agriculture-related diseases. 13 A deepened understanding of these mechanisms is needed to effectively tailor nutrition-sensitive agriculture interventions to have the greatest positive impact on women’s health.
Results from studies of agricultural diversification (the number of crops and/or livestock varieties produced) have found positive associations with household and individual dietary diversity. In Malawi, for example, agricultural diversity was strongly associated with consumption of legumes, vegetables, and fruits and was positively associated with household dietary diversity. 12 Data from Indonesia, Kenya, Ethiopia, and Malawi also found a positive association between production diversity and dietary diversity; however, gains in dietary diversity were limited when production was already quite diverse. 14
The prevalence of undernourishment in East Africa (34%) is much higher than that for Africa as a whole (20%). 1 In Tanzania, 80% of households depend on agriculture as part of their livelihood, and maize accounts for 43% of cultivated crops. 15 Since most women in Tanzania are involved in agricultural activities, we assessed the relationship between agriculture diversity and dietary diversity for women of reproductive age. Most studies to date have assessed the impact of agricultural diversity on either household dietary diversity or child dietary diversity. 16 This cross-sectional study is one of the first to explicitly assess the association of agricultural diversity with women’s dietary diversity in East Africa. Additionally, we analyze whether other factors related to agriculture and food access predict women’s dietary diversity. We hypothesize that agriculture diversity is positively associated with dietary diversity for women of reproductive age.
Methods
Study Population
The population for this cross-sectional study was participants from the baseline survey of a cluster randomized control trial (RCT) in the Rufiji River delta of Tanzania—a rural coastal region approximately 180 km south of Dar es Salaam (ClinicalTrials.gov NCT03311698). Participants for this analysis were women of reproductive age (18-49 years) living in households randomly selected from 10 villages that were purposively selected from an existing Health and Demographic Surveillance System. Characteristics of the RCT have been described elsewhere. 17 All women included in the analysis provided informed consent to participate in the study. The study protocol was approved by the Institutional Review Boards of the Harvard T.H. Chan School of Public Health, Ifakara Health Institute, and the National Institute of Medical Research for Tanzania.
Data Collection
Baseline data collection took place from August to October 2016 by trained interviewers using questionnaires developed by the research team on electronic tablets. Data collection among women of reproductive age included information on household demographics, woman’s health and previous pregnancies, agricultural production, physical activity, women’s empowerment, food security, and food consumption patterns using a food frequency questionnaire (FFQ). We assigned a composite wealth score to each household based on household assets (roof type, floor type, electricity, couch, television, and bike ownership) using principal components analysis. 18
Primary Outcome of Interest
For this analysis, the primary outcome of interest is adult women’s dietary diversity. Data from an FFQ were used to collect dietary information from participants. 19 Dietary intake was obtained by asking participants on average how many times in the last month they ate specific foods. Daily frequencies for each food were derived based on participants’ responses. Foods were categorized into 10 food groups following Food and Agriculture Organization’s minimum dietary diversity for women (MDD-W) recommendations (Table 1). 6 A participant was considered to have consumed a food group if the summation of daily frequencies for all foods in that group exceeded or equaled 1. The dietary diversity score was then calculated by summing the number of food groups consumed by each participant.
Food Groups Included in MDD-W Score.a
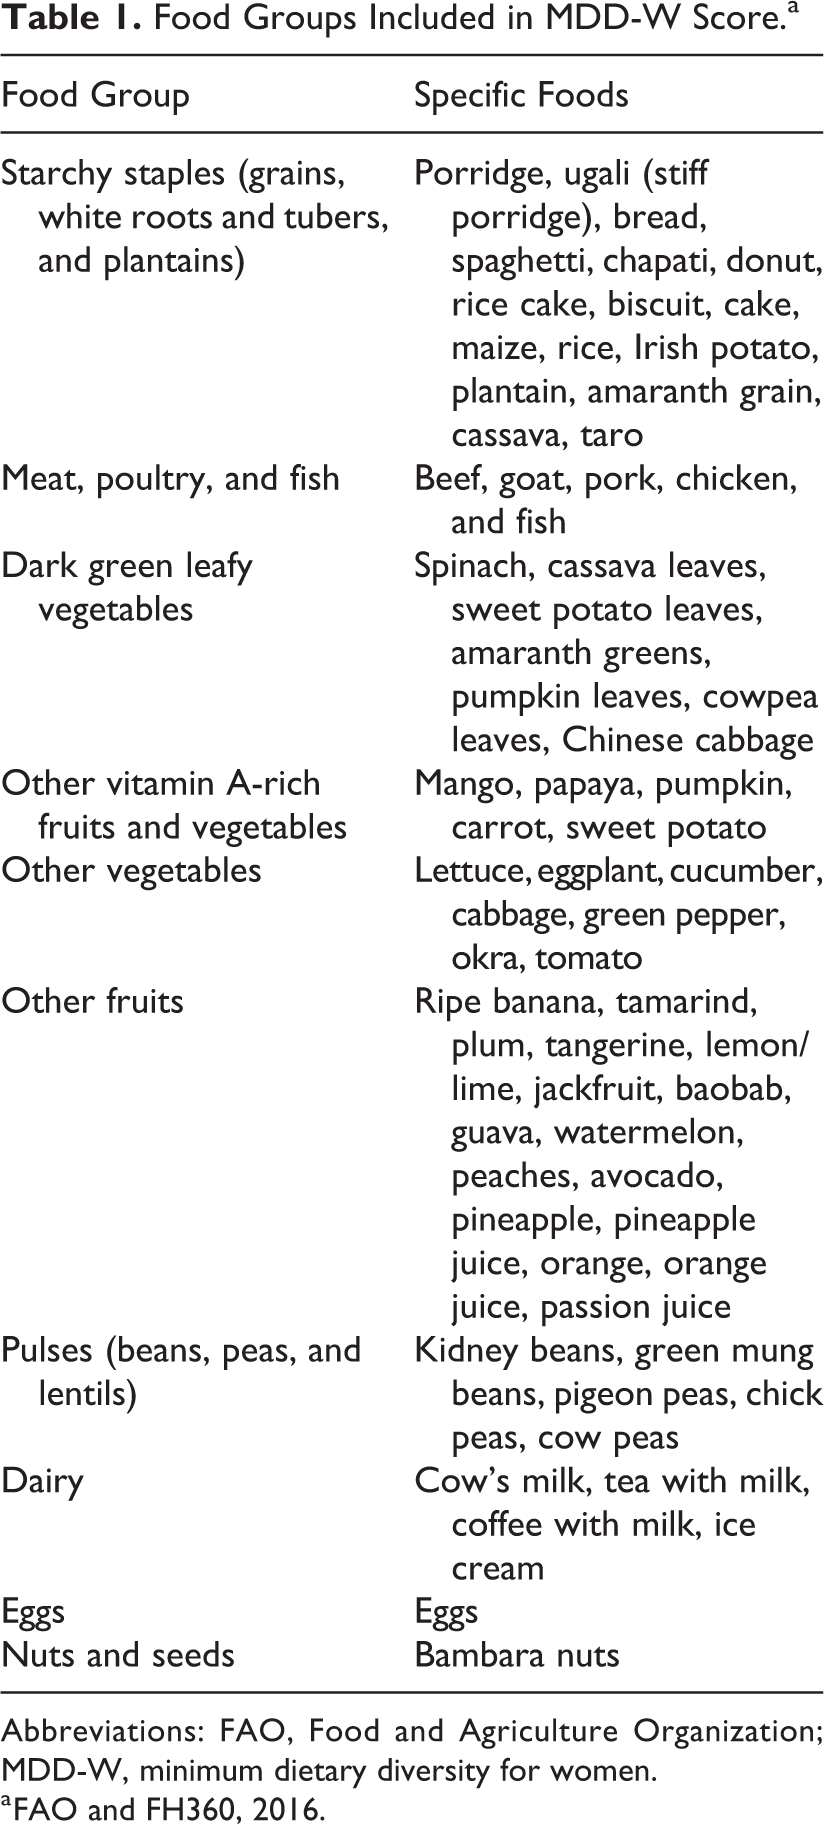
Abbreviations: FAO, Food and Agriculture Organization; MDD-W, minimum dietary diversity for women.
a FAO and FH360, 2016.
Primary Exposures of Interest
Our primary exposure of interest was crop diversity, which was calculated using 2 measures: (1) Crop Nutritional Functional Richness, calculated based on the 7 agricultural food groups included in the MDD-W (starchy staples, dark green leafy vegetables, other vitamin-A rich fruits & vegetables, other vegetables, other fruits, pulses, and nuts & seeds; Table 1) and (2) Crop Species Richness, calculated by the number of crop species grown by each household (eg, maize, rice, beans, pigeon peas, sesame, cashews, etc). Data for crop diversity were collected using a questionnaire that asked the participant to list crops grown by the household within the last year across all growing seasons. Secondary exposures of interest included household ownership of livestock (yes/no), participant engaging in cash crop production (yes/no), participant engaging in food crop production (yes/no), household growing at least 1 crop (yes/no), and household growing specific food groups included in the MDD-W (Table 1). Cash crop production was defined as crops produced primarily for sale at the market, and food crop production was defined as crops produced mostly for home consumption. Woman’s participation in cash and/or food crop production was determined by self-report (yes/no).
Statistical Analysis
All analyses were conducted using SAS 9.4. Descriptive statistics for household and participant characteristics were calculated by means or proportions for continuous and categorical data, respectively. Linear mixed-effects models were used to evaluate the associations between agricultural indicators and women’s dietary diversity. Generalized linear mixed models were used to estimate the odds of consuming 4 or more food groups, given specified agricultural indicators (link = logistic). Due to low dietary diversity in our study population, we could not use the M-DDW cutoff of 5 or more food groups in our statistical models. Those who consumed 4 food groups or more represented the highest quintile for dietary diversity scores in our population. Crop Nutritional Functional Richness Scores and Crop Species Richness Scores were divided into tertiles, with the lowest tertile as the reference category. Each crop diversity indicator of interest was run in a separate model to avoid collinearity. All multivariate models were adjusted for the average amount of money spent on food per person in the household (total amount of Tanzanian shillings spent on food for the household divided by the number of persons in the household), the number of people living in the household, woman’s education level (none, primary, secondary, and university/vocational training), household wealth index (categorical), and land size (number of hectares; categorical); P for trend was reported for both Crop Nutritional Functional Richness and Crop Species Richness categorical variables. In addition, both univariate and multivariate models were adjusted for random effects of village pair to account for clustering. Quintiles of the composite wealth score were used for statistical analysis.
Results
A total of 1006 households from 10 villages were enrolled. The number of households from each village was proportional to the size of the village population. Household characteristics are presented in Table 2. The average household size was approximately 7 people; most women reported some degree of primary education (57.5%) and receiving income through informal employment activities (67.7%) such as farming, running a kiosk or food stall, petty business, and causal labor.
Demographic Characteristics Among Female Study Participants in Rufiji, Tanzania.a
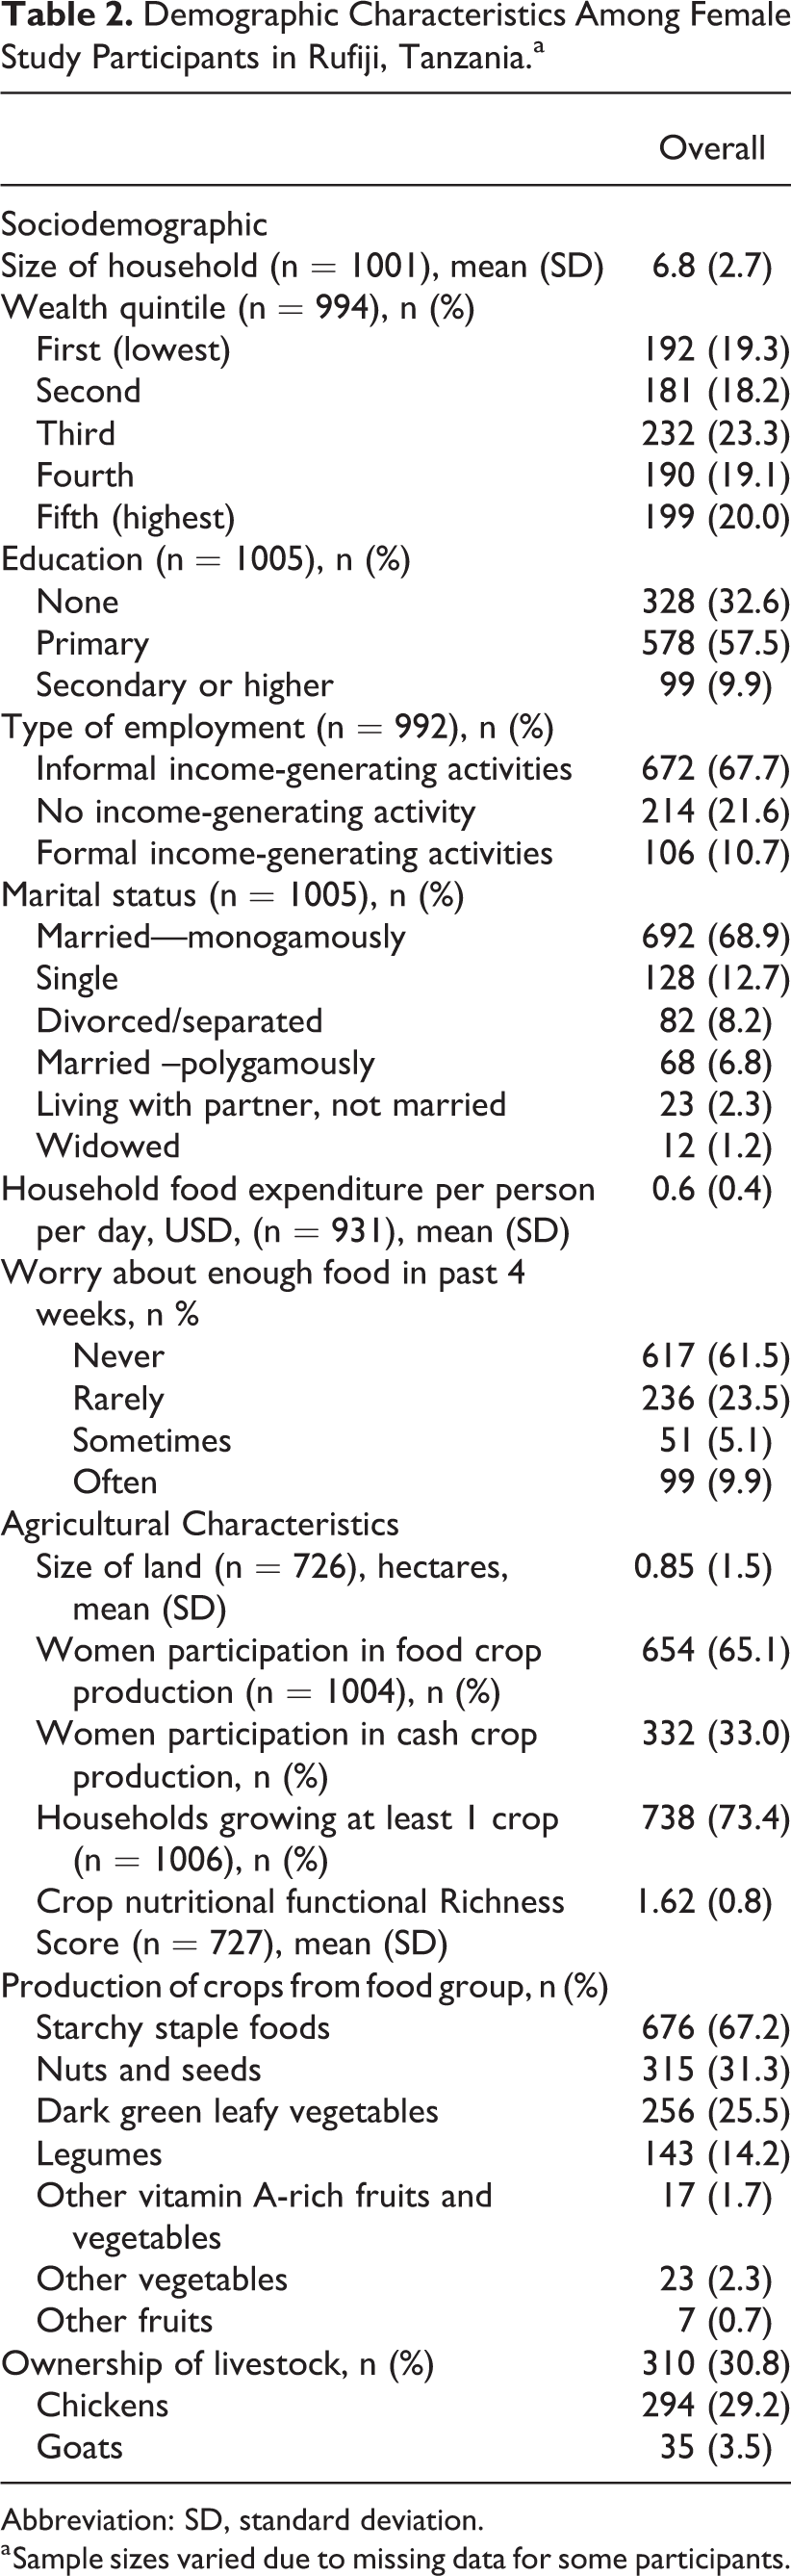
Abbreviation: SD, standard deviation.
a Sample sizes varied due to missing data for some participants.
The median dietary diversity score for women in all villages was 3.00 (25th percentile: 2, 75th percentile: 3). Ten percent of women in this study reported consuming an average of 5 or more food groups per day. Starchy staples and flesh foods were the most commonly consumed food groups (Figure 1). The 5 most common foods consumed were maize (ugali, a stiff maize-based porridge), fried fish, okra, fresh fish, and rice. Women reported spending an average of 0.57 USD (based on October 2016 TSH to USD conversion rate) per person per day on food for the household.
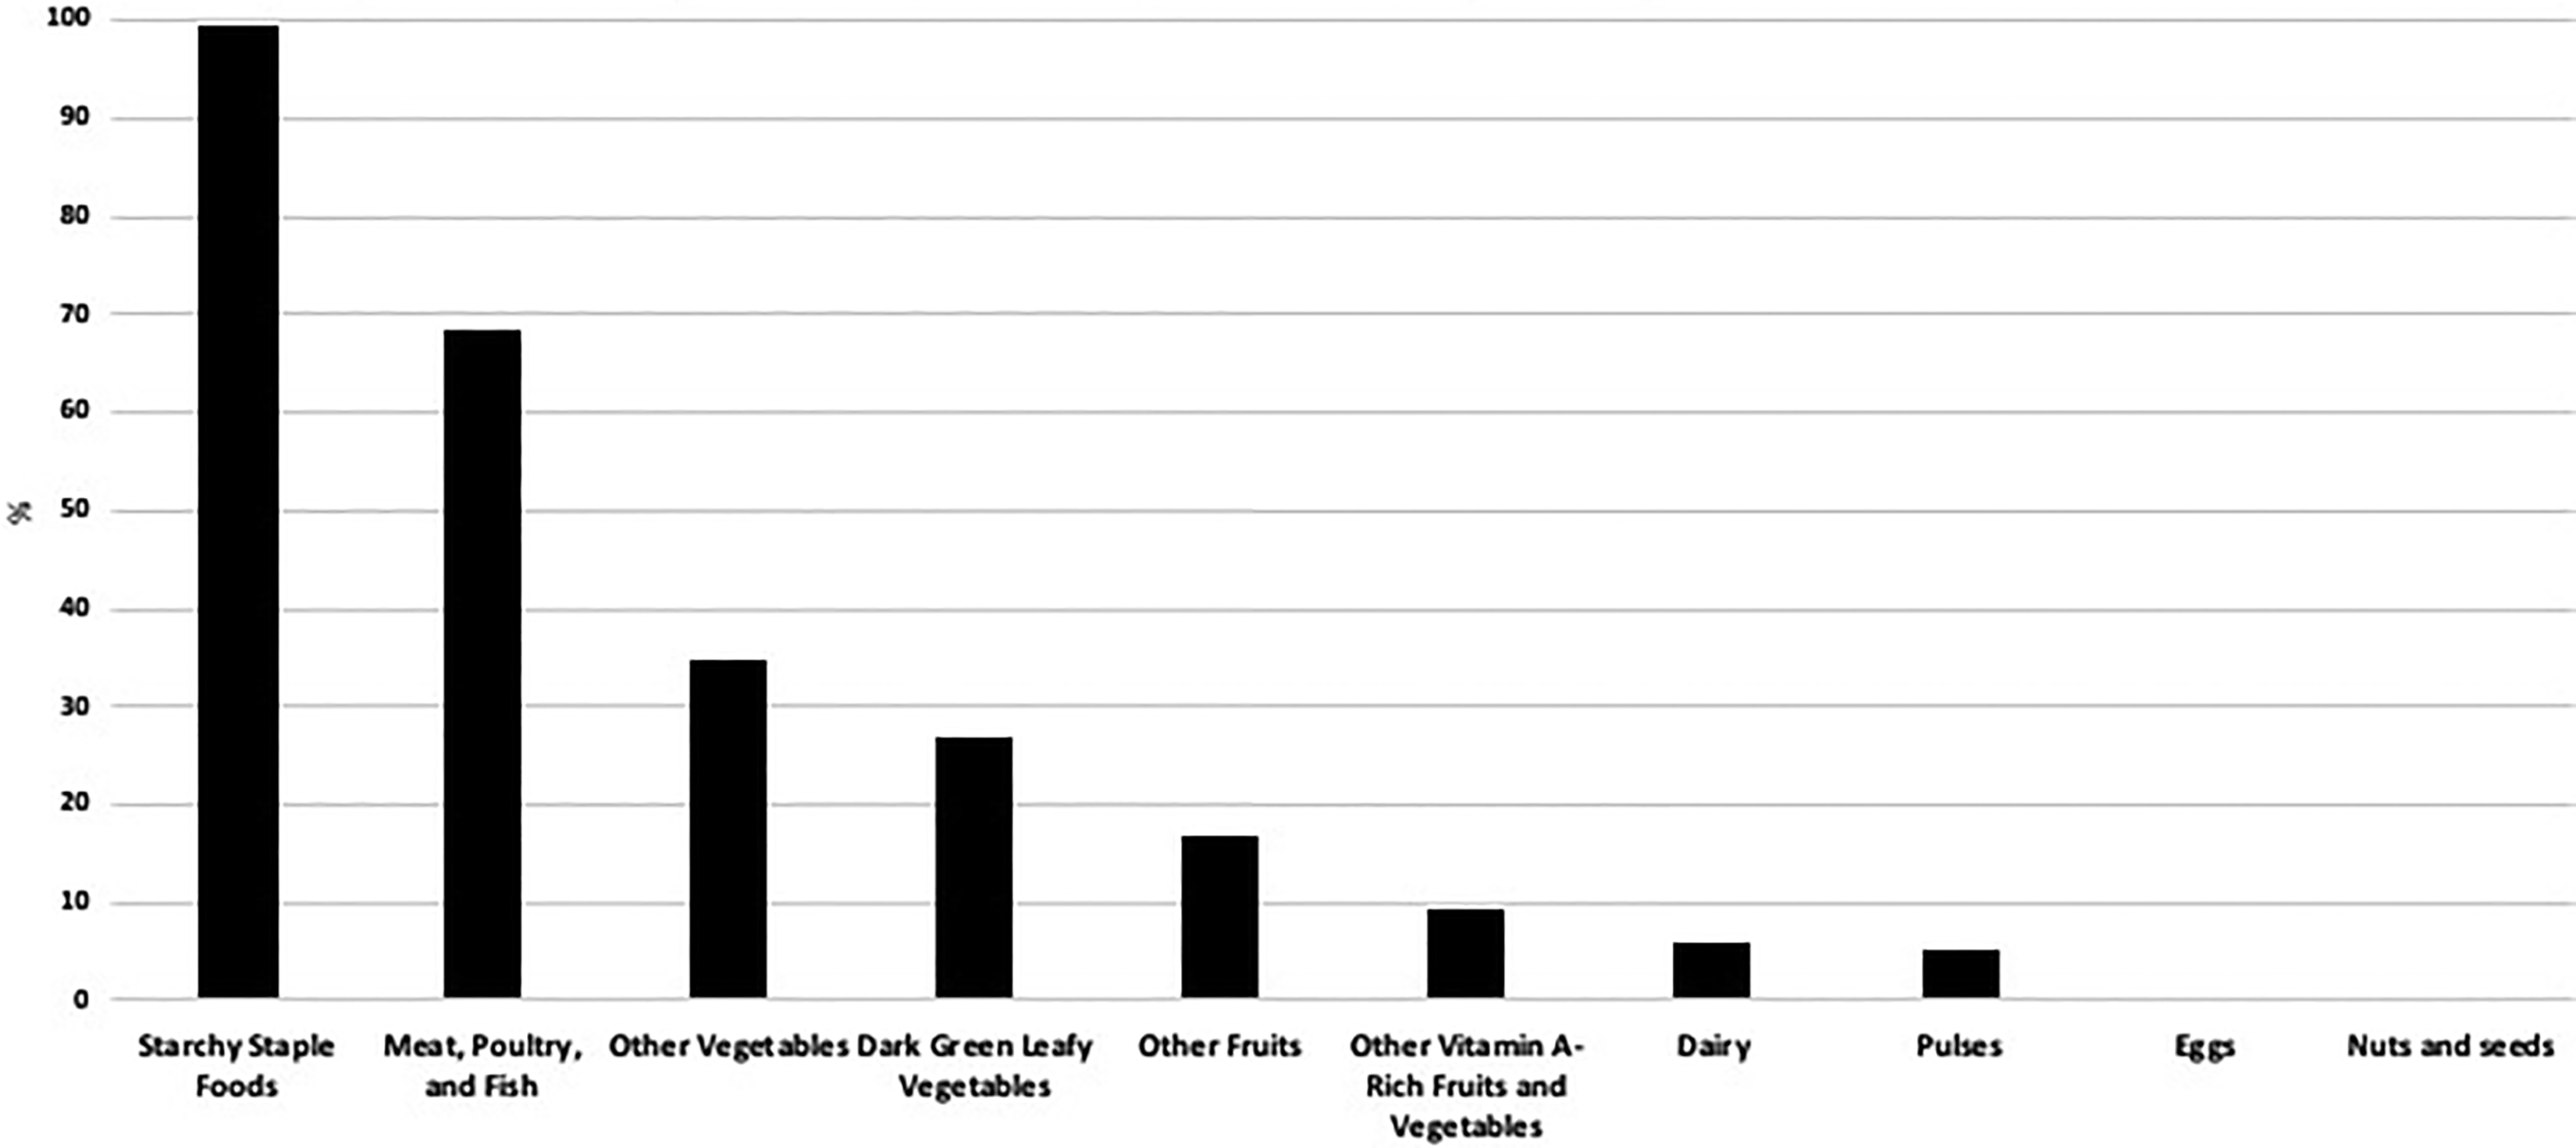
Percentage of women of reproductive age consuming each food group on a daily basis. *Food consumption pattern was derived from a food frequency questionnaire (recall 30 days) Participants were asked “In the last month how often have you consumed [a specific Food].” Foods were categorized into food groups according to minimum dietary diversity for women (MDD-W) classification. A participant is considered to have consumed a food group if the summation of daily frequencies for all foods in that group exceeds or equals one.
In the previous 12 months, 73% of households reported participating in agricultural activities. The average land size was 0.85 hectares. Among households participating in agricultural activities, median Crop Species Richness score (number of crops grown) was 2.00 (25th percentile: 2.00, 75th percentile: 4.00). The 5 most commonly grown crops were maize (50.0%), rice (49.7%), sesame (26.1%), cassava (22.9%), and cashews (12.3%). Median Crop Nutritional Functional Richness score (number of food groups grown) among households participating in agriculture was 1.00 (25th percentile: 1.00, 75th percentile: 2.00). Thirty-one percent of households reported ownership of livestock, primarily chickens.
We identified several agriculture-related indicators of women’s dietary diversity as a continuous outcome (Table 3). Higher Crop Nutritional Functional Richness scores were positively associated with dietary diversity (P for trend: .04). Household ownership of livestock was associated with a 0.30-unit higher dietary diversity score (adjusted coefficient: 0.30; 95% confidence interval [CI]: 0.08-0.44; P = .005). Woman’s participation in cash crop production was associated with a 0.22-unit higher dietary diversity score (adjusted coefficient: 0.22; 95% CI: 0.03-0.41; P = .02), growing pulses was associated with a 0.50-unit higher dietary diversity score (adjusted coefficient: 0.50; 95% CI: 0.27-0.74; P < .0001), and growing other vegetables (eg, okra, eggplant, green pepper, and tomato) was associated with a 0.64-unit higher dietary diversity score (adjusted coefficient: 0.64; 95% CI: 0.11-1.17; P = .02). Crop Species Richness score, participation in food crop production, growing dark green leafy vegetables, other vitamin A-rich fruits and vegetables, and other fruits were not associated with dietary diversity for women.
Factors Associated With Dietary Diversity Among Tanzanian Women of Reproductive Age.
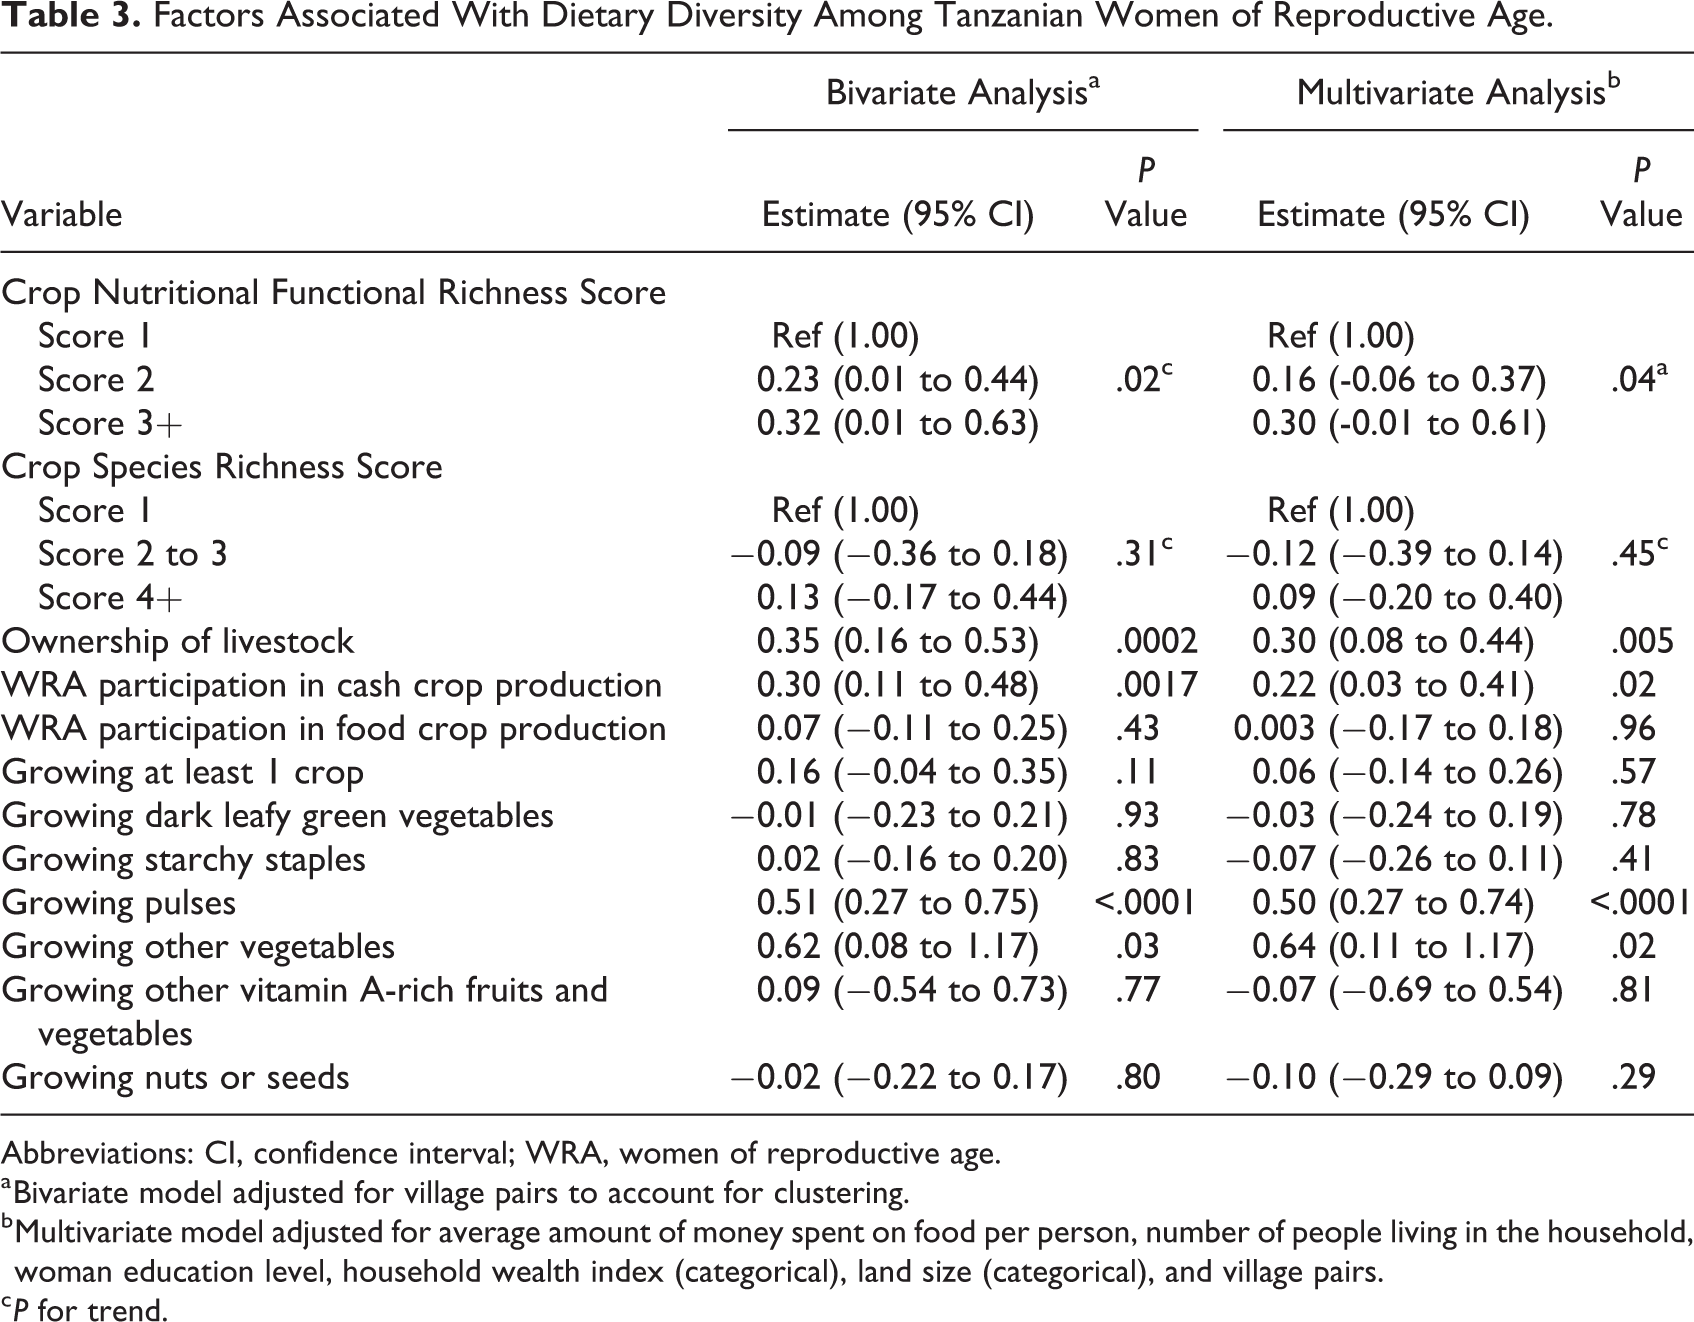
Abbreviations: CI, confidence interval; WRA, women of reproductive age.
a Bivariate model adjusted for village pairs to account for clustering.
b Multivariate model adjusted for average amount of money spent on food per person, number of people living in the household, woman education level, household wealth index (categorical), land size (categorical), and village pairs.
c P for trend.
In addition, we identified several correlates for high dietary diversity (defined as eating an average of 4 or more food groups per day; Table 4). Women in households who were in the highest tertile for Crop Nutritional Functional Richness score were significantly more likely to have high dietary diversity, adjusted odds ratio (OR) [P for trend]: 2.22 [.03], than women in the lowest tertile. In addition, women in households that owned livestock, participated in cash crop production, grew pulses, and grew other vegetables were significantly more likely to have high dietary diversity.
Factors Associated With Eating an Average of 4 or More Food Groups Per Day Among Tanzanian Women of Reproductive Age.
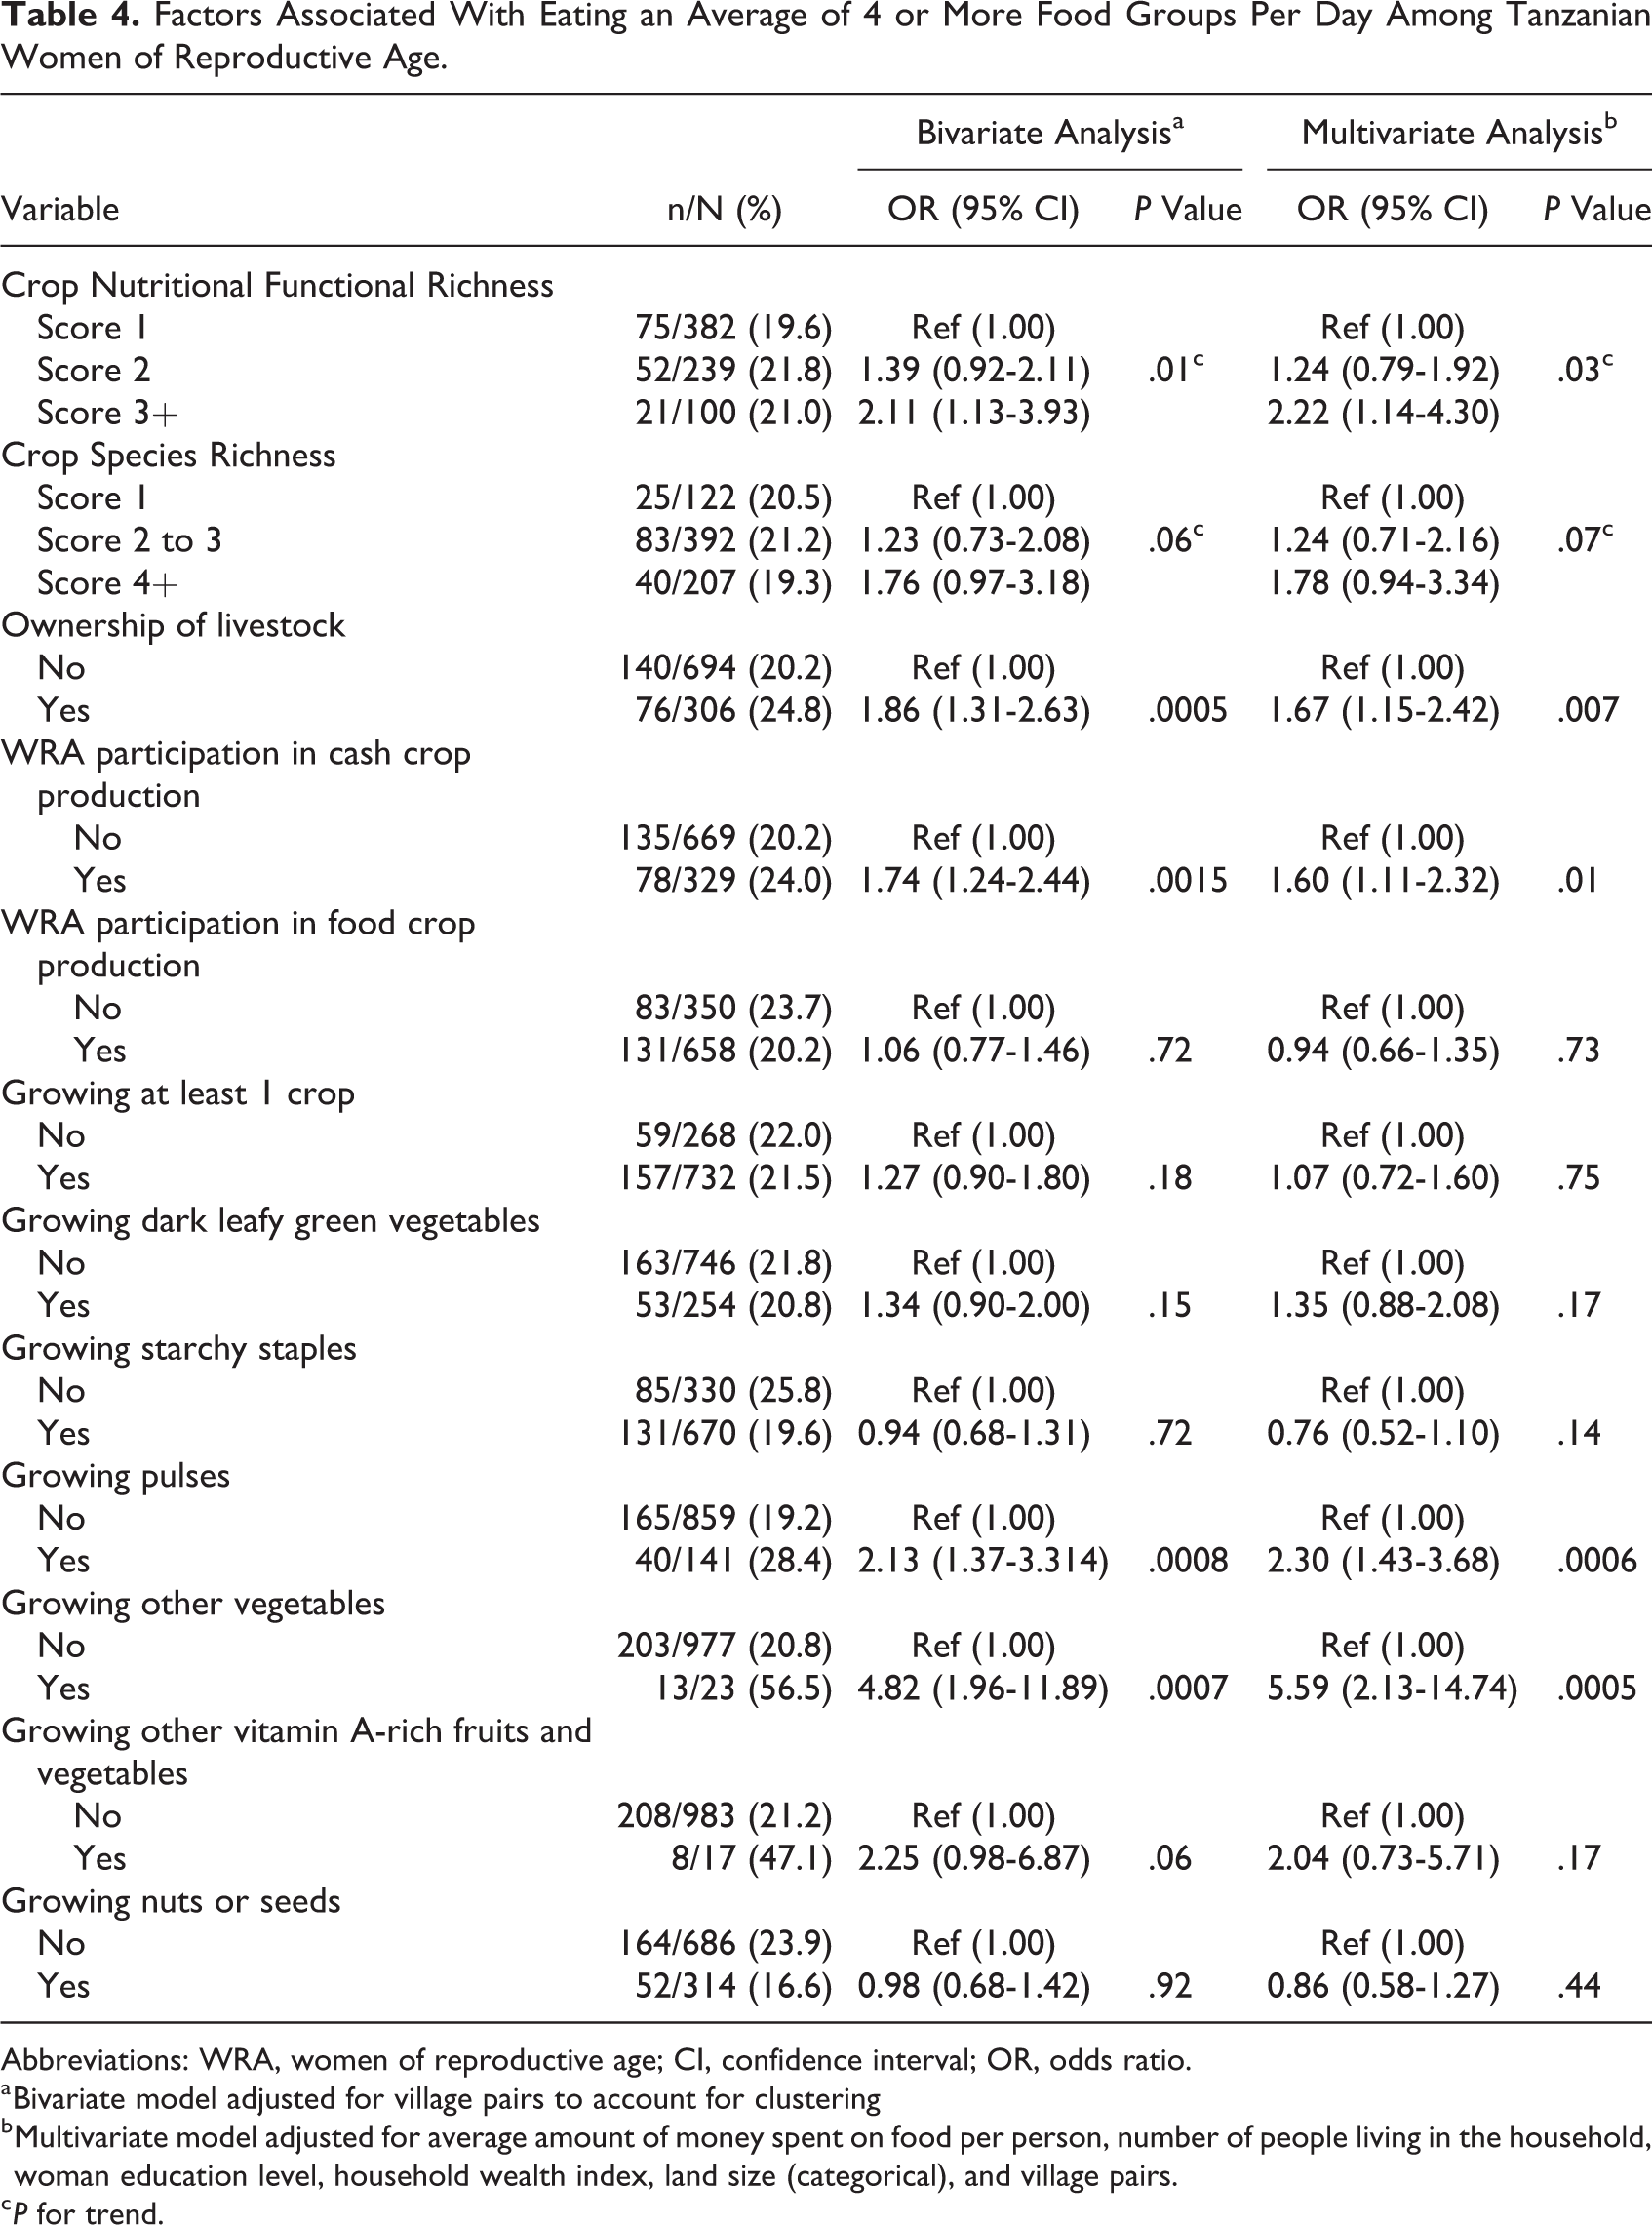
Abbreviations: WRA, women of reproductive age; CI, confidence interval; OR, odds ratio.
a Bivariate model adjusted for village pairs to account for clustering
b Multivariate model adjusted for average amount of money spent on food per person, number of people living in the household, woman education level, household wealth index, land size (categorical), and village pairs.
c P for trend.
Ownership of livestock was not predictive of daily consumption of meat, poultry, or fish (adjusted OR: 1.38; 95% CI: 0.98-1.94; P = .06), and growing pulses was not predictive of consumption of pulses (adjusted OR: 1.722; 95% CI: 0.812-3.654; P =.15). Growing other vegetables was significantly predictive of consumption of other vegetables (adjusted OR: 3.99; 95% CI: 1.52-10.48; P = .005).
Discussion
In this study population, average dietary diversity for women was low; the majority of women consumed an average of 3 food groups per day, and only 10% of women ate 5 or more food groups per day—a widely used cutoff suggested for assessing micronutrient adequacy. 6 Most individuals consumed starchy food (primarily maize), fish (either fried or fresh), and okra. The high consumption of fish may be unique to this region of Tanzania, which is located near the Rufiji River delta where fish is easily accessible in the market for a relatively low price. Most households participated in growing at least 1 crop in the past 12 months prior to the interview. Households reported growing mostly cash crops—crops that are grown primarily for sale, including starchy staples and nuts. As an agricultural zone close to Dar es Salaam city and near a major freeway, many crops grown in this region are exported to the urban center (K. N. Mlalama, personal communication, March 2018).
Our study provides evidence that homestead food production is associated with dietary diversity through the consumption pathway. Crop diversity and growing specific vegetables, such as tomatoes and okra, were associated with higher dietary diversity. It should be noted that the effect estimates for indicators of agricultural diversity (Crop Nutritional Functional Richness scores and Crop Species Richness scores) on dietary diversity were relatively small, with a 0.31 gain in score from the lowest to highest tertile. These results are in line from a recent meta-analysis, which found that in sub-Saharan Africa, small holder farmers would need to grow an additional 9 crops for a 1-unit increase in dietary diversity. 20 A significantly larger effect estimate (0.64) was seen for growing crops in the “other vegetables” category of the M-DDW (Table 1), which may indicate that certain crops are more likely to be consumed at the home instead of being sold at the market. Those who grew “other vegetables” were nearly 5 times more likely to consume 4 or more food groups. Only a small number of participants (2%) grew crops in the “other vegetable” category, but in both analyses, this was predictive of higher dietary diversity. Therefore, promotion of homestead production of nonstarchy foods such as fruits and vegetables may increase dietary diversity in women.
Ownership of livestock and participation in cash crop production were also strong correlates of dietary diversity. Interestingly, ownership of livestock is not predictive of daily consumption of meat or poultry. This suggests that the primary purpose of livestock ownership for many households is for income rather than consumption. Additionally, growing pulses was associated with higher dietary diversity yet was not associated with consumption of pulses. In the study area, some pulses such as peas are a valued crop with a high market price and are grown mostly for sale (K. N. Mlalama, personal communication, March 2018). These results are consistent with other studies that show income and market access to be the main predictors of dietary diversity. 14,16,21 For example, a study in western Kenya found a nonsignificant relationship among noncommercial farmers between agricultural diversity and dietary diversity; food from other sources, such as markets and neighbors, contributed to the low association between agricultural diversity and dietary diversity. 21
While increasing agricultural diversity alone is unlikely to be sufficient for attaining an adequate diet, except in isolated locations remote from food markets, promotion of crop diversification with fruits and vegetables may be effective for increasing women’s dietary diversity specifically in relation to nutrient-rich foods. This is in support of evidence from integrated homestead food production programs that have shown increases in maternal dietary diversity, which in turn reduced the prevalence of wasting in women. 22 It is also supportive of the need to improve access to markets in rural areas such that agricultural specialization, as well as diversification, can contribute to improving dietary quality among the rural poor.
The strengths of this study include the ability to assess multiple agricultural indicators on dietary diversity, the focus on women who have primary responsibility for agricultural activities in this context, and large sample size. In addition, the use of an FFQ allows us to capture longer term information on diets, which is less susceptible to within-person variation compared to a 24-hour recall. Limitations of this study include cross-sectional design, lack of market data on foods, and results that may not be generalizable to other areas of Tanzania or other countries. With a cross-sectional design, we are unable to examine causality between agricultural diversity and dietary diversity. Additionally, we constructed the MDD-W indicator using an FFQ instead of the recommended 24-hour recall. We chose to use the FFQ in order to more appropriately assess long-term dietary intake, but this may cause our results to not be directly comparable to other studies that constructed the MDD-W using a 24-hour recall. Furthermore, we collected data on crops grown within the last year, while our FFQ collected information on dietary intake within the last month. Therefore, our results may be susceptible to influences of seasonality. Our hypothesis would be further supported by data on household use of crops grown, including consumption and sale, and purchasing data from local markets.
Conclusions
Agricultural production diversity is a correlate of dietary diversity among women in rural farming households in Tanzania. Higher dietary diversity in this population seems to be primarily associated with correlates in agricultural income pathway, including livestock ownership, cash crop production, and growing pulses intended for the market. Interventions that promote agricultural production diversity may be effective at improving diets and nutritional status among women and children.
Key Messages
Dietary diversity, a proxy of micronutrient adequacy, is low among women of reproductive age in rural coastal Tanzania.
Higher dietary diversity in this population is associated with livestock ownership, cash crop production, and growing pulses intended for the market.
Growing vegetables for home consumption such as tomatoes and okra is also positively associated with higher dietary diversity.
While increasing agricultural diversity alone is unlikely to be sufficient for attaining an adequate diet, promotion of crop diversification with fruits and vegetables may be effective for increasing women’s dietary diversity, specifically in relation to nutrient-rich foods.
Footnotes
Declaration of Conflicting Interests
The author(s) declared no potential conflicts of interest with respect to the research, authorship, and/or publication of this article.
Funding
The author(s) disclosed receipt of the following financial support for the research, authorship, and/or publication of this article: This study was funded by the IZUMI Foundation. Analysis was funded by Nutrition Innovation Labs (Tufts University). Mosha also received support from the Fogarty International Center of the National Institutes of Health under award number D43 TW007886/TW/FIC NIH HHS/United States.