
Abstract
Many workers in global supply chains remain nutritionally vulnerable despite the income they earn. The Seeds of Prosperity (SOP) program was implemented in Tamil Nadu and Assam, India, for tea supply chain workers (estate workers, small holder farmers, and farm workers). The aim was to enhance demand for diverse and nutritious foods and improve practices related to handwashing. The program used a behavior change communication approach wherein participants received weekly 1-hour group sessions with messaging on dietary diversity for 5 weeks and handwashing for 4 weeks. An impact evaluation was conducted to estimate changes in reported dietary and hygiene knowledge and behaviors among women. The study used a longitudinal quasi-experimental design in a subsample of program participants at baseline and post-intervention among both intervention and comparison. There was a small but significant increase in mean dietary diversity (DD) for all 4 worker groups (ranging from DD score changes of 0.3 to 0.7; P < .05) and in the proportion of women meeting the minimum dietary diversity in 2 of the 4 groups. Similarly, a significant increase in the mean number of handwashing moments was observed in 2 of the worker groups. An increase in home garden use was observed in 1 of the 4 worker groups. While the SOP program resulted in improvements in dietary diversity, most tea farming women still do not achieve minimum dietary diversity. Nutritious food access may be an important constraint to further improvement.
Introduction
Many workers in global supply chains remain nutritionally vulnerable despite the income they earn. Many tea growing regions within countries (notably in India, Malawi, and Sri Lanka) exhibit rates of undernutrition higher than national averages—for child underweight, stunting, wasting and women’s BMI, and anemia status. 1,2 India’s tea industry provides direct employment to over 1 million people and indirect employment to another 10 million. 3 Women constitute nearly 51% of the total tea workforce in India making it one of the largest employers of women among the organized industries. 4 Low levels of education, low wages, limited access to markets, and long working hours are common. 3,5
With support from Unilever and the Sustainable Trade Initiative, under a public–private partnership supported by the Dutch Ministry of Foreign Affairs, the Global Alliance for Improved Nutrition (GAIN) designed the Seeds of Prosperity (SOP) program for tea supply chain workers (estate workers, smallholder farmers, and their workers) to enhance demand for diverse and nutritious foods, in addition to improving practices related to handwashing. Increased dietary diversity was identified as a key desired behavior because low dietary diversity was documented in these populations, and diversity is positively associated with micronutrient quality of diets. 6,7 Furthermore, handwashing with soap was promoted because it is still not widely practiced in these settings and is known to reduce diarrhoeal disease. 8
Implemented over a period of 9 consecutive weeks, the SOP program used a behavior change communication (BCC) approach wherein participants received weekly messaging on dietary diversity for 5 weeks and handwashing for 4 weeks as part of 1-hour group sessions. Trainings were delivered by master trainers, selected among estate workers by their employers, who received a 3-day training of trainers. The BCC approach is based on Unilever’s levers of change: awareness, commitment, reinforcement, and reward. 9 In addition, home gardens were promoted through free seed distribution to improve access to diverse and nutritious vegetables and fast growing fruits. Seeds were selected based on nutrient value, suitability, and farmer preference. All program participants were provided seeds for spinach, carrot, and beetroot and in addition to these, papaya in Assam and bush bean in Tamil Nadu.
The SOP program was developed to reach household members in 3 different categories of tea workers households: (i) tea estate workers, (ii) independent smallholder farmers of tea, and (iii) workers on smallholder farms. Farm workers tend to be the most vulnerable with no formal labor contract or land holding. In Assam, only tea estate workers were targeted after low participation and interest by smallholder farmers.
According to India’s Plantation Labor Act of 1951, employers are responsible for wages and housing, health, education, and welfare of workers and their family members living on the estates. 10 A typical tea garden in Assam also provides subsidized firewood, rice, and wheat to its workers. Tea garden workers in Assam earn slightly lower daily wages (Indian National Rupee [INR] 177/US$2.75) than their counterparts in Tamil Nadu (INR 241/US$3.74). Tea estate workers generally work 6 days a week and the production season, when work is more intensive, is between March and November. 11
The targeted reach of the program was 27000 households in Tamil Nadu and 10 000 households in Assam. Attendance at training by someone from the household was tracked by the master trainer during each session.
The primary objective of this article is to report on the results of an evaluation to determine the impact of this nutrition program on reported dietary and hygiene related behaviors among women in India.
Methods
The evaluation used a longitudinal quasi-experimental design consisting of measures in a subsample of program participants once pre- and once post-intervention in intervention and comparison groups. Comparison groups were sampled from non-randomized tea estates who received the full intervention after the evaluation was completed. In Tamil Nadu, the pre- and post-surveys were performed 1 year apart in order to control for seasonality which is known to have a large impact on food availability. In Assam, due to delays in implementation, the endline survey was carried out 6 months after the baseline, before and after the lean season. There may have been some impact on food availability, however, the use of a comparison group and the avoidance of the lean season should have attenuated some of the seasonality bias.
A household survey was administered face-to-face by trained enumerators using digital tablets. The structured surveys were the same in both Assam and Tamil Nadu.
Indicators collected included reported behaviors on (1) dietary diversity score (DDS) based on 10 food groups for women, (2) Minimum Dietary Diversity for Women of Reproductive Age (MDD-W; minimum 5 of 10 food groups consumed the previous day), 12 (p360) (3) handwashing during 5 key moments (as defined by Unilever these were agreed to be: before eating breakfast, lunch, and dinner, after defecation and while bathing), 9,13 and (4) the existence of a home garden. Secondary outcomes examined knowledge in relation to both dietary diversity and key handwashing moments and were collected using a series of questions in the survey.
Interview respondents included the reproductive-aged women 18 and older in the selected supply chain worker/farmer households. Females were selected because in the India, women tend to be the food preparers in the households and more nutritionally vulnerable than men. The program was open to any household member, so some women interviewed may have been indirect recipients of the BCC group trainings. An underlying assumption was that knowledge was shared among household members.
Sample size estimates were based on the number of participants needed in each group to detect (with a significance of P < .05 and power >0.80) a minimum difference of 10% to 15% of women meeting MDD-W, and assuming an attrition rate of 30% which was anticipated due to season migration. In Tamil Nadu, an effect size of 15% was used based on the pilot study data and intracluster correlation estimates whereby clusters were groupings of estates or tea farms surrounding and supplying tea processing factories, resulting in an estimated sample size of 702 farmers, 187 farm workers, and 223 estate workers. In Assam, previous data on intracluster correlation was not available, therefore a more conservative effect size of 10% was used to calculate the sample size, which was 506 estate workers. Analysis was conducted by State and by worker type, based on the underlying differences in terms of income and level of education.
The only exclusion criteria for this study were households where the participant intended to move out of the study area or cease their employment in the supply chain within 1 year, during the study period.
Participants were sampled from lists of estate workers, smallholder farmers contracted to deliver to the Unilever supply chain, and workers of those farmers. The allocation to the intervention and comparison group was based on dividing the entire population of the program area into geographically defined clusters of which approximately half were to receive the intervention in year one, and hence form the sample universe for the “intervention group.” The other half received the intervention in year 2 (after the endline evaluation) and hence formed the sample universe in the comparison group for the evaluation after year 1 implementation.
Data analyses focused on ascertaining the net change—through difference in difference (DID) analysis between the treatment and comparison groups—representing any change attributable to the program. All analyses were carried out using the Stata statistical software package version 14.2 (2017; StataCorp, College Station). The data were analyzed by study area and worker groups due to socioeconomic and contextual differences. Differences between sociodemographic characteristics of the treatment versus comparison groups were compared using (1) chi-square test for categorical variables, (2) independent t test for continuous variables with normal distributions (household size), and (3) Mann-Whitney U test for variables with non-normal distributions (household income). Multivariate linear regression analysis for DID, controlling for household size, education, social category, migration status, and household income, were used to examine the program effect on the primary and secondary outcomes.
The final sample sizes analyzed were 367 in Assam and 768 in Tamil Nadu (457 farmers, 132 farm workers, and 179 estate workers). Attrition rates varied from 10% to 27% by worker group due to unavailability, seasonal migration, incomplete data, and refusal to participate. Although the age range for the MDD-W indicator is validated for women up to 49 years old, some older respondents were included due to enumerator error. Subanalysis later showed that diets did not differ greatly from women under 49 years of age, therefore, the cutoff was extended to 59 years for inclusion in the analysis.
Ethical approval for these studies was given by the Indian Council of Medical Research.
Results
Some significant differences were observed in the characteristics of informants between treatment and comparison groups (see Table 1), most notably in migration status and median income. Among estate workers in Assam and farm workers in Tamil Nadu, the treatment group had a higher median monthly income across households.
Sociodemographic Characteristics of Respondents at Baseline by Treatment Group for Each Study Area.
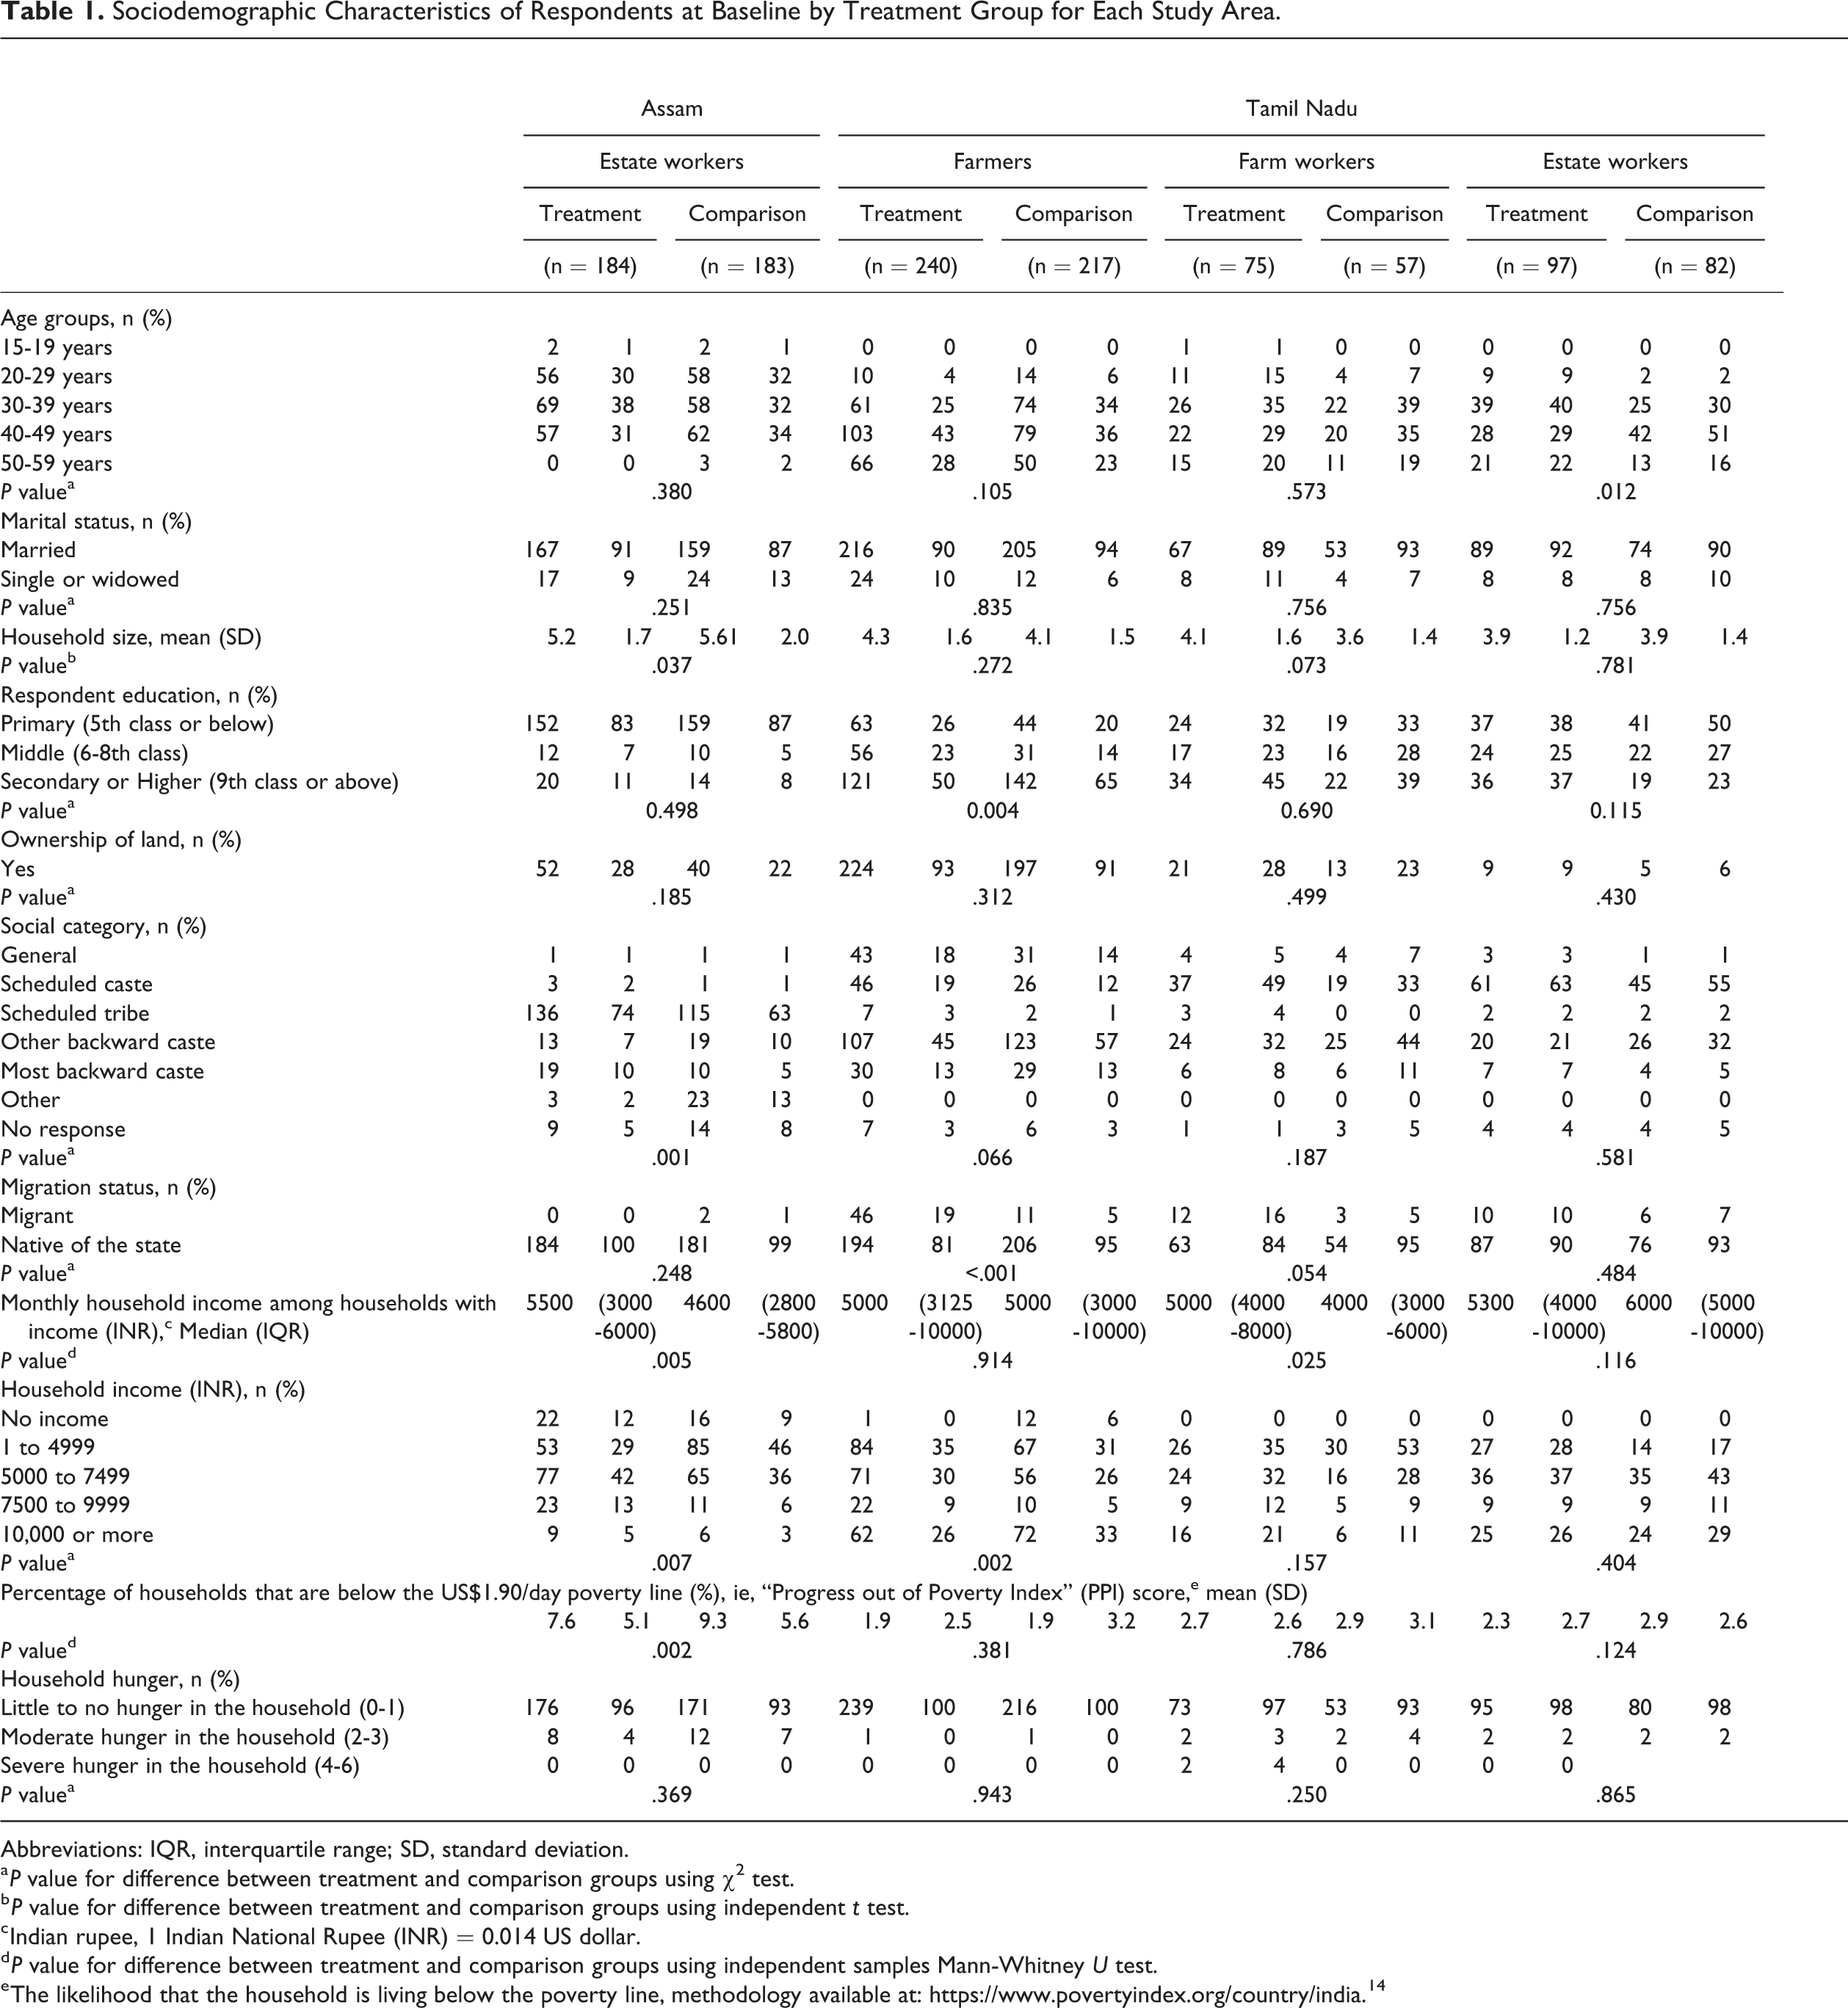
Abbreviations: IQR, interquartile range; SD, standard deviation.
a P value for difference between treatment and comparison groups using χ2 test.
b P value for difference between treatment and comparison groups using independent t test.
c Indian rupee, 1 Indian National Rupee (INR) = 0.014 US dollar.
d P value for difference between treatment and comparison groups using independent samples Mann-Whitney U test.
e The likelihood that the household is living below the poverty line, methodology available at: https://www.povertyindex.org/country/india. 14
A small but significant increase in the mean DDS for all groups (ranging from a change of 0.3 to 0.7) between the baseline and endline (P < .05) was found (Figure 1). A significant increase in the percent of women achieving minimum dietary diversity (MDD-W) was detected among farmers (+15%) and estate workers (+24%) in Tamil Nadu (Figure 2).
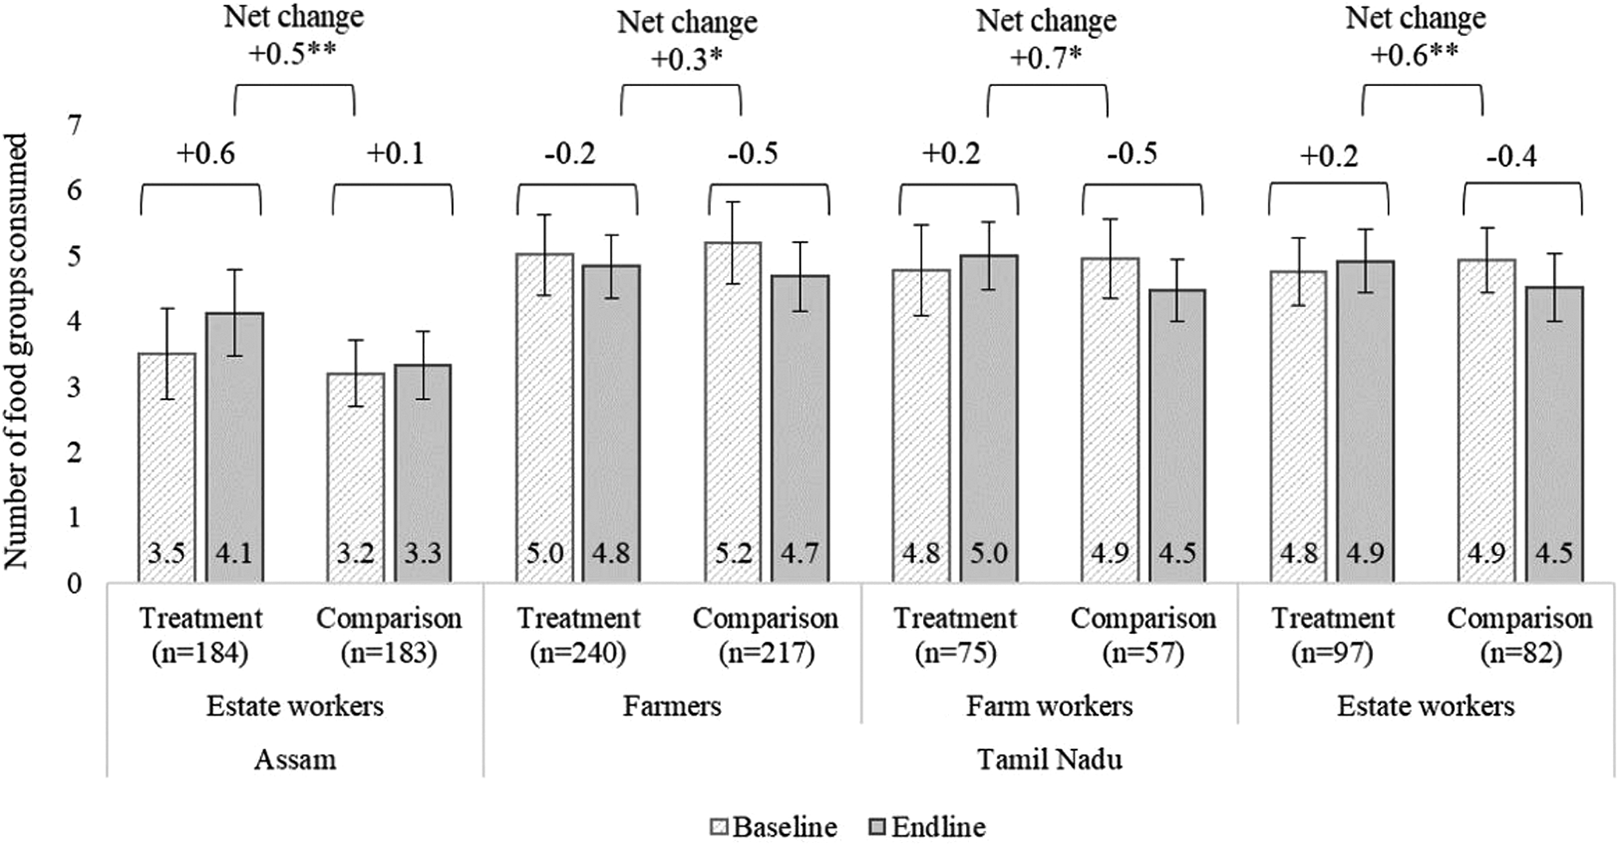
Mean Dietary Diversity Score (DDS) at baseline and endline by treatment group for each study area. The DDS is defined as the total number of food groups consumed in the last 24 hours using the following 10 groups: 1. Grains, white roots and tubers, and plantains; 2. Pulses (beans, peas, and lentils); 3. Nuts and seeds; 4. Dairy; 5. Meat, poultry, and fish; 6. Eggs; 7. Dark green leafy vegetables; 8. Other vitamin A-rich fruits and vegetables; 9. Other vegetables; 10. Other fruits. The error bars represent the standard deviation. The figure shows differences between baseline and endline (mean DDS at endline − mean DDS at baseline) and the net-change/difference in difference (DID) (difference for the treatment group − difference for the comparison group). Statistically significant using regression for DID controlling for household size, education, social category, migration status, and household income; *P value < .05, **P value < .01.
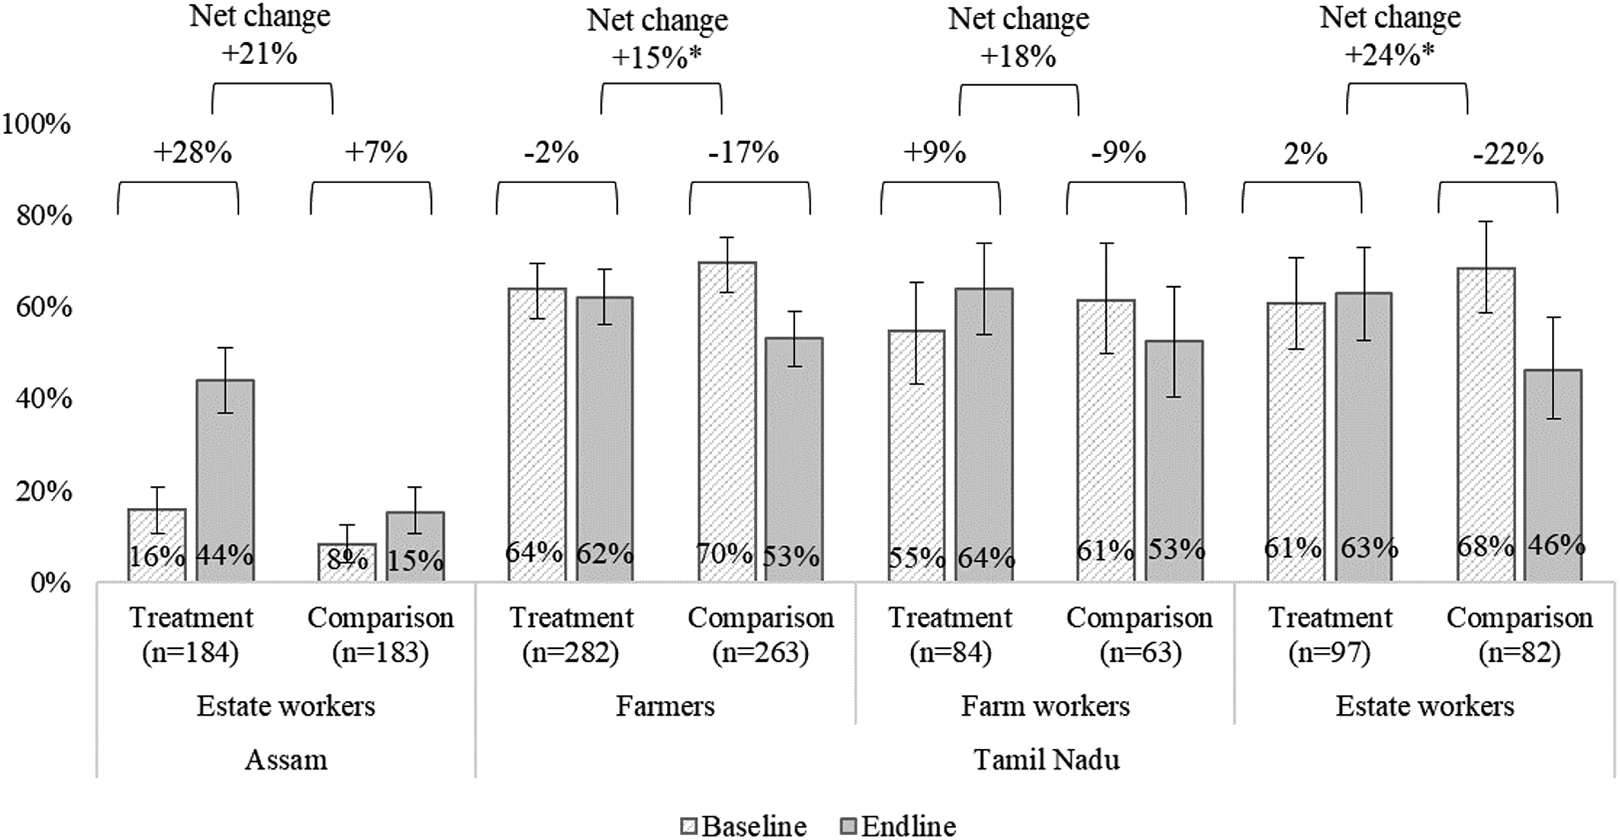
Minimum Dietary Diversity for Women of Reproductive Age (MDD-W) at baseline and endline by treatment group for each study area. The dietary diversity score (DDS) is defined as the proportion of women who consumed at least 5 out of 10 defined food groups the previous day or night (DDS ≥ 5). The error bars represent the 95% confidence interval. The figure shows differences between baseline and endline (% MDD-W at endline − % MDD-W at baseline) and the net-change/difference in difference (DID) (difference for the treatment group − difference for the comparison group). Statistically significant using regression for DID controlling for household size, education, social category, migration status, and household income; *P value < .05.
Minimum dietary diversity for women of reproductive age was especially low among estate workers in Assam at baseline (16% of the treatment and 8% or the comparison group). In Tamil Nadu, on average half of all women surveyed achieved MDD-W at endline.
To better understand the relatively low DDSs and the changes seen across both treatment and comparison groups, we examined food group-level data that generate the DD score. In Assam, the 0.5 DID score improvement was increased consumption of pulses (36% increase, P < .001) and dark green leafy vegetables (24% increase, P = .001) drove the DID score change. Whereas in Tamil Nadu, vitamin A rich fruits and vegetables (18% increase, P = .007) and other fruits (19% increase, P = .001) among farmers; pulses (20% increase, P = .046) and eggs (19% increase, P = .018) among farm workers; and other fruits (28% increase, P = .002) among estate workers accounted for the improved scores relative to the comparison groups (data not shown).
With respect to handwashing behaviors, the mean number of handwashing moments increased among estate workers in Assam and farmers in Tamil Nadu but no significant difference was observed among the other 2 groups (Figure 3).
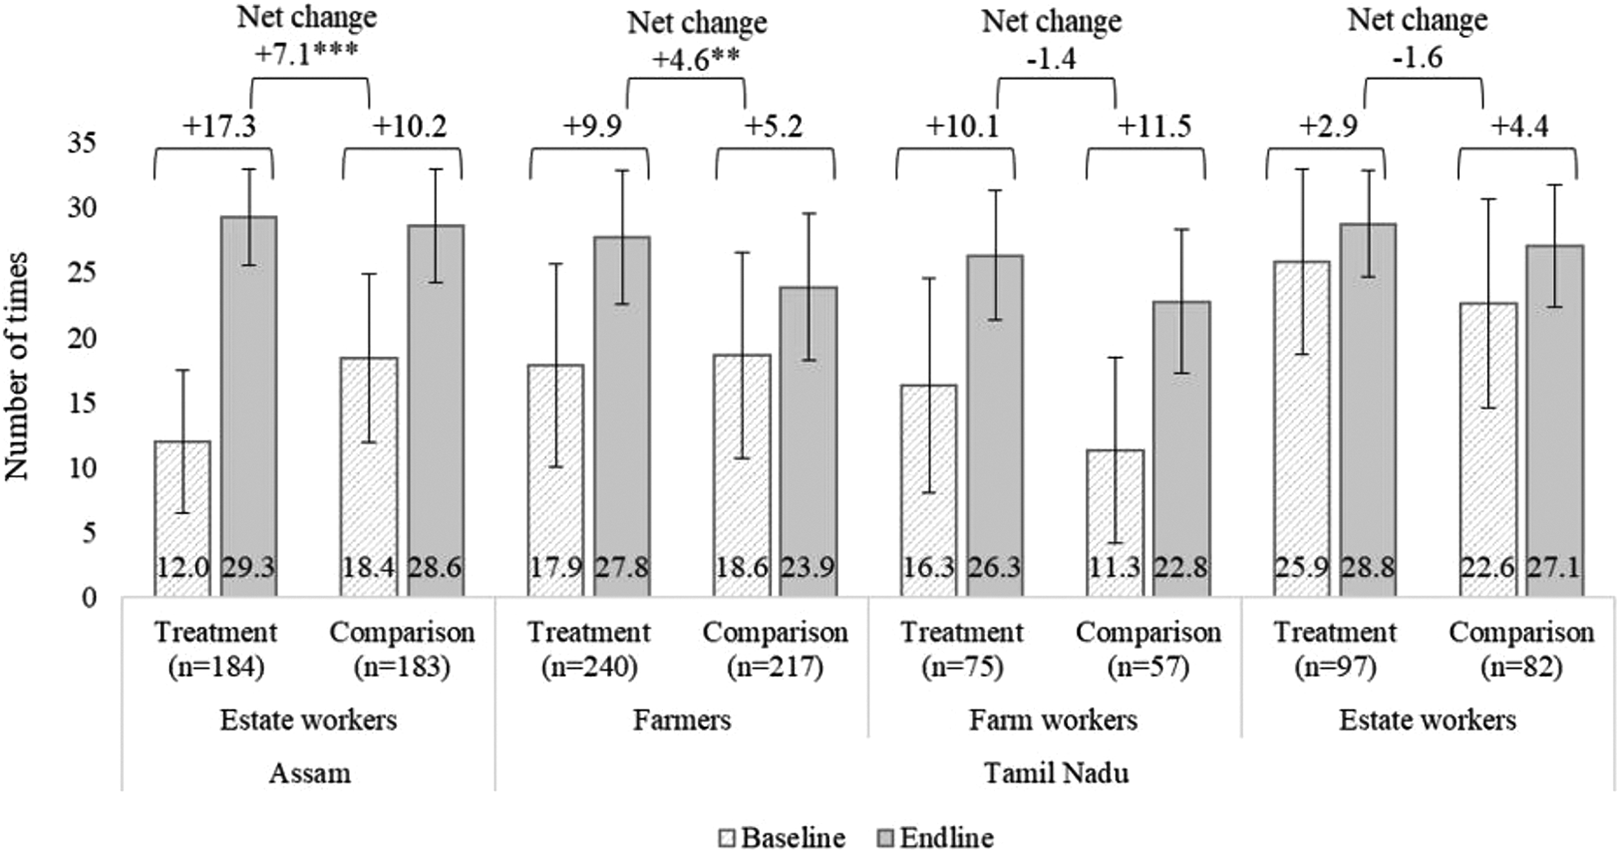
Mean number of times respondents reported washing hands with soap at 5 key moments during the previous 7 days at baseline and endline by treatment group for each study area. Key moments are defined as before breakfast, before lunch, before dinner, after defecation, and while bathing. The error bars represent the 95% confidence interval. The figure shows the net-change/difference in difference (DID) (difference for the treatment group − difference for the comparison group). Statistically significant using regression for DID controlling for household size, education, social category, migration status, and household income; **P value < .01, ***P value < .001.
With respect to changes in knowledge scores based on the survey questions, there was a significant increase in recall of the mean number of benefits of a healthy diet reported after the intervention among estate workers in Assam and farmers in Tamil Nadu but no significant difference was observed among farm workers and estate workers in Tamil Nadu (Figure 4). Participant recall of the number of food groups that form a healthy diet did not improve between baseline and endline. Finally, knowledge related to recalling the 5 key moments for handwashing between baseline and endline increased among farmers in Tamil Nadu, but not among the other groups.
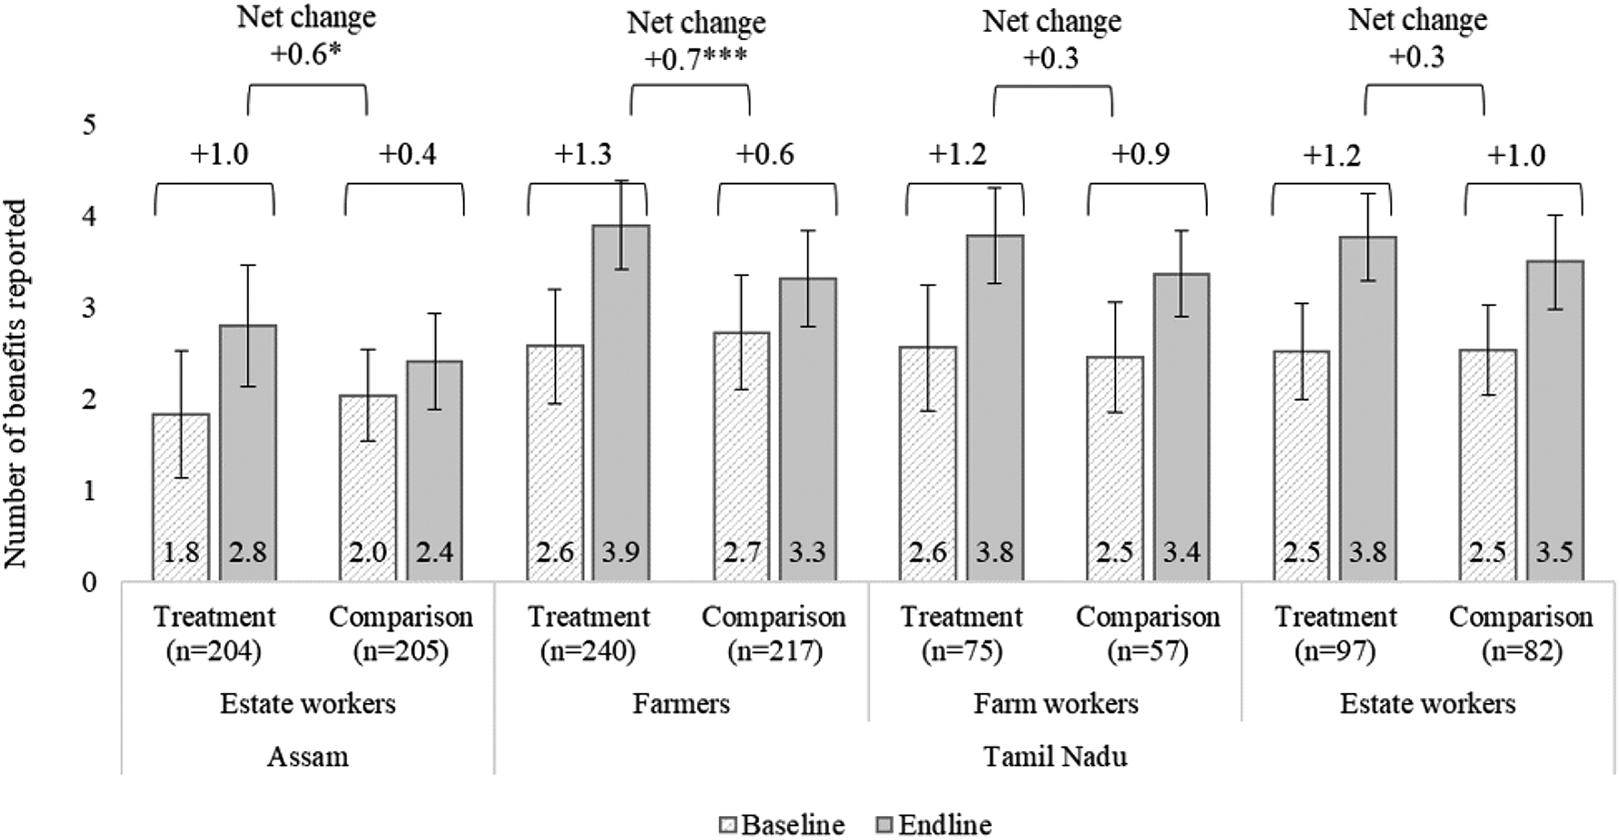
Mean number of benefits of a healthy diet reported at baseline and endline by treatment group for each study area. Benefits reported include increased growth, improved cognitive development, more energy, increased productivity, improved health, and less disease. The error bars represent the standard deviation. The figure shows the net-change/difference in difference (DID) (difference for the treatment group − difference for the comparison group). Statistically significant using regression for DID controlling for household size, education, social category, migration status, and household income; *P value < .05, ***P value < .001.
The proportion of estate workers in Assam with home gardens increased to almost two-thirds but this increase was seen in both the treatment and the comparison groups. Only in Tamil Nadu among farmers was there an increase in the use of home gardens (Figure 5).
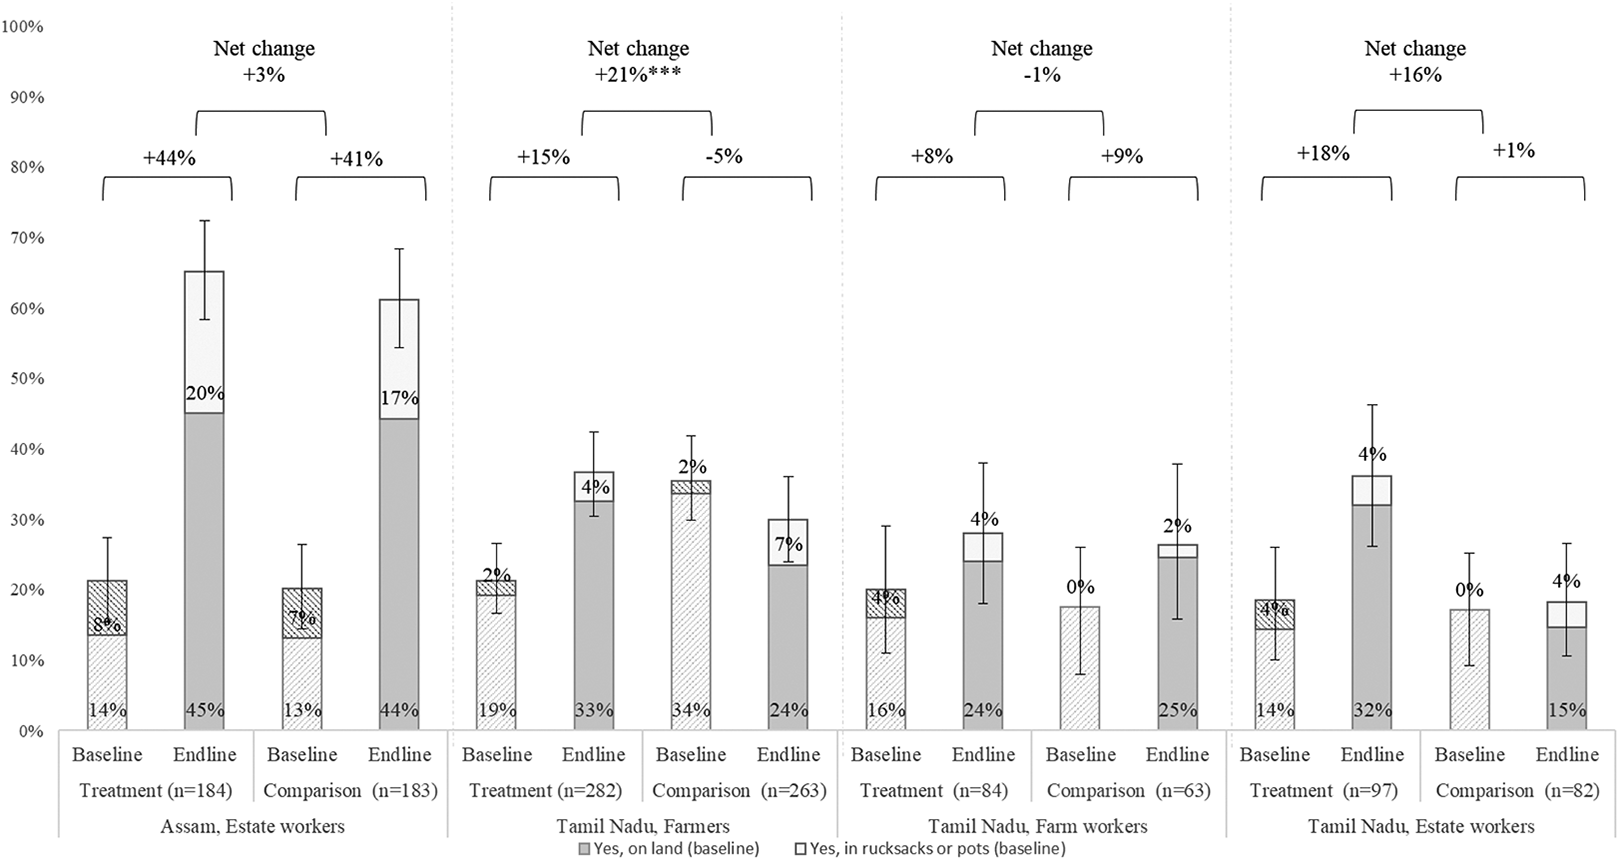
Proportion of household who reported keeping a home garden (on land or in a rucksack or bag) in the previous year. The error bars represent the 95% confidence interval. The figure shows the net-change/difference in difference (DID) (difference for the treatment group − difference for the comparison group). Statistically significant using regression for DID controlling for household size, education, social category, migration status, and household income; **P value < .01.
Discussion
Addressing the diets for supply chain farmers/workers through and with the private sector has few existing and tested models. The promising yet mixed impact of the SOP program on tea workers in Assam and Tamil Nadu offer important learnings for program improvement in this uniquely challenging setting.
Improvements in dietary diversity were observed in all 4 study populations, which can be attributed to the SOP program however, dietary diversity remains very low, especially among estate workers in Assam. Despite improvements in the dietary diversity among all 4 worker groups, the interventions were not intensive enough to sufficiently improve diets to a level that will address women’s micronutrient requirements. The literature examining the effectiveness of different behavior change strategies to shift dietary behaviors seems to suggest that more intensive and prolonged interventions are more effective at generating sustained change, provided underlying determinants including food access are addressed. 15 -17 Monitoring data indicate that attendance rates for the 9-week group BCC sessions were high (between 74% and 99%), so the program was successful in implementing the intended intensity-level.
The handwashing BCC component was moderately successful given that a measurable increase in self-reported behavior was seen in 2 of the 4 worker groups. The notable increase in all groups, including comparison groups suggest a strong respondent bias may be skewing the results. In this case, most likely respondents may be experiencing a social desirability bias whereby they overreport what is perceived to be “good behavior.” 18 This bias could also be influencing the result of the self-reported dietary diversity among respondents in the treatment group.
The findings from the study indicate that home gardens are not likely increasing availability of vegetables for workers, given that their use remains limited. Lack of available time to tend to gardens among tea workers may explain some of these findings. Therefore, any dietary improvements reported most likely came from acquisition of foods through other means (eg, purchases, bartering, gifts, foraging) however small.
In Assam, affordability and availability were likely key barriers to meeting the minimum dietary diversity. A cost of the diet analysis conducted by the team as part of formative research in Assam illustrated the unaffordability of reaching the MDD-W cutoff as 5 price-and-nutrient optimized food groups cost an average family INR 1000 to 1100 per week (if rations where provided) while the weekly income is INR 822. The findings of the formative research conducted in Assam are consistent with national-level estimates suggesting that around 43% to 64% of the rural Indian population could not afford the recommended diet, as it would account for 50% to 60% of male wages 70% to 80% of female wages in 2011. 19 A recent assessment of the cost of the EAT Lancet recommended diet would cost the equivalent of INR 260 per day per person (or INR 1300 per day per household). 20 Other studies focusing on behavior-change in rural-Indian households have also noted affordability as a key barrier to improving diets. 21,22 In addition, in Assam tea estates, food markets are only held on a weekly basis making the availability of fresh nutritious foods limited. The combination of barriers including the unaffordability and unavailability of safe, fresh, and nutritious foods means that regardless of the effectiveness of the behavior change interventions, farmers are not able to increase their dietary diversity meaningfully. More innovative approaches to increase access to nutritious and safe foods, such as the inclusion of fortified food at rations shops, training of food vendors, and bringing markets closer to workers could be considered for future programming.
Despite improvements in some intended behaviors, these findings were not reflected in any detected improvements in knowledge scores. It is possible that the questions used to assess knowledge were not appropriate or sensitive. Literature suggests that knowledge is not in and of itself sufficient for changes in dietary behavior 23 but less is known about the extent to which it is necessary. One plausible mechanism for behavior change without the ability to share retained knowledge is that of an emotionally driven motivator. Indeed, while evidence for this pathway is still emerging as applied to nutrition behavior change programs, one study conducted in Indonesia demonstrates the efficacy of utilizing gossip (an emotional motivator) to improve dietary diversity among children aged 6 to 24 months. 24 It is likely that the community activities in this project may have contributed to eliciting emotional responses to the key nutrition messages, even if the aim was to increase knowledge. Further research is needed in community-nutrition programs to understand the comparative advantages of emphasizing knowledge retention as a precursor to behavior change, focusing on creating emotional motivators for making better dietary choices.
Limitations
Several factors may have contributed to the lack of consistent or measurable changes in some groups. The social desirability and recall biases are likely a factor in this study, where changes in behavior rely on self-reporting. In addition, representative comparison-groups were difficult to obtain in this setting, introducing a sampling bias as only the most well managed estates (perhaps where social programs are more common) allowed data-collection more than a year ahead of the intervention. Finally, a handwashing training program rolled out in schools in Assam in parallel with this program. These are likely to have influenced both comparison and intervention groups and therefore minimized any additional impact of the SOP program.
Conclusion
Promoting workplace nutrition with the private sector continues to be a challenging area in which to implement. We know that tea pickers and small holder farmers are nutritionally vulnerable. While the SOP program resulted in improvements in dietary diversity, most tea farming women still do not achieve minimum DDSs. Nutritious food access may be an important constraint to further improvement. Demand creation approaches like these can be used and combined with other supply side interventions in the broader context of living wages and other labor rights efforts, in order to improve tea worker diets in the longer term. This public–private partnership, with implementation funded by private sector, has the potential to be a sustainable model.
Footnotes
Authors’ Note
CND, MV, GS and MK wrote the manuscript, BW designed the program, NS and LMN designed the evaluation, NS conducted and led the evaluations, and NS, MV, CND, and EWD conducted the data analysis, all authors reviewed and approved the manuscript.
Acknowledgments
The authors would like to thank the many individuals who were involved with implementing the Seeds of Prosperity program and its related monitoring and evaluation work: From Unilever: Katja Freiwald, Ans Eilander, Daleram Gulia; GAIN India: Biju Mushahary; Solidaridad India: Deivanai Mahadevan, Hariprasad V. M. Arjun, Shatadru Chattopadhayay, Uddhab Chandra Sarmah, Digvijay Jamwal, Shukla Hegde, Jiggu Kotargiri, Pollobi Borah, Daizy Bori, Pooja Kini, and Nitin Rao.
Declaration of Conflicting Interests
The author(s) declared no potential conflicts of interest with respect to the research, authorship, and/or publication of this article.
Funding
The author(s) disclosed receipt of the following financial support for the research, authorship, and/or publication of this article: The Ministry of Foreign Affairs of the Netherlands, Reference number 4000000622.