
Abstract
Background:
Recent literature, largely from Africa, shows mixed effects of own-production on diet diversity. However, the role of own-production, relative to markets, in influencing food consumption becomes more pronounced as market integration increases.
Objective:
This paper investigates the relative importance of two factors - production diversity and household market integration - for the intake of a nutritious diet by women and households in rural India.
Methods:
Data analysis is based on primary data from an extensive agriculture-nutrition survey of 3600 Indian households that was collected in 2017. Dietary diversity scores are constructed for women and households is based on 24-hour and 7-day recall periods. Household market integration is measured as monthly household expenditure on key non-staple food groups. We measure production diversity in two ways - field-level and on-farm production diversity - in order to account for the cereal centric rice-wheat cropping system found in our study locations. The analysis is based on Ordinary Least Squares regressions where we control for a variety of village, household, and individual level covariates that affect food consumption, and village fixed effects. Robustness checks are done by way of using a Poisson regression specifications and 7-day recall period.
Results:
Conventional measures of field-level production diversity, like the number of crops or food groups grown, have no significant association with diet diversity. In contrast, it is on-farm production diversity (the field-level cultivation of pulses and on-farm livestock management, and kitchen gardens in the longer run) that is significantly associated with improved dietary diversity scores, thus suggesting the importance of non-staples in improving both individual and household dietary diversity. Furthermore, market purchases of non-staples like pulses and dairy products are associated with a significantly higher dietary diversity. Other significant determinants of dietary diversity include women’s literacy and awareness of nutrition. These results mostly remain robust to changes in the recall period of the diet diversity measure and the nature of the empirical specification.
Conclusions:
This study contributes to the scarce empirical evidence related to diets in India. Additionally, our results indicate some key intervention areas - promoting livestock rearing, strengthening households’ market integration (for purchase of non-staples) and increasing women’s awareness about nutrition. These are more impactful than raising production diversity.
Introduction
Since human nutrient requirements are multifaceted, diet diversification is important for nutritional security. 1 Inadequate dietary intake, in terms of quantity and diversity, is an immediate cause of poor nutritional status. 2 In addition, diet diversification is vital in fighting the triple burden of malnutrition—undernourishment (ie, lack of calories and proteins), micronutrient deficiencies, and excessive energy intake (that gets manifested as overweight and obesity). 3 In particular, developing countries like India have diets that are energy rich and lacking in micronutrients. This is because food consumption is primarily plant-based and largely consists of staples, with minimal consumption of fruits, vegetables, and animal products. 4 This has led to malnutrition, which manifests itself in different ways in different contexts. Underwood 5 shows that this is one of the important factors that has led to high rates of anemia in India.
Dietary diversity scores (DDSs), which enable us to quantify diversity in diets, have gained importance because of their association with a variety of well-being outcomes, such as nutritional and health outcomes. For example, DDS has been shown to be positively associated with women’s mean adequacy ratio in Mali 6 and their anthropometric outcomes in Burkina Faso. 7 Similarly, DDSs have been found to have a significant positive relationship with children’s nutrient adequacy and anthropometric outcomes in the Philippines, 8 Bangladesh 9 and a number of other developing countries. 10 In the Indian context, DDSs have been used to analyze nutritional status of children. 11 -13 In particular, Chandrasekhar et al 11 find evidence that dietary diversity is associated with lesser child stunting and wasting. Menon et al 12 record evidence showing positive association between children’s diet diversity scores and their anthropometric scores.
In this article, we investigate the determinants of DDSs for women and households in India. Our primary objective is to identify the relative importance of 2 factors—production diversity and household market integration—for the intake of a nutritious diet. Bulk of the literature on the determinants of diet diversity has focused on the role of production diversity, but a growing literature examines the importance of other factors. Different studies, most of which are based on data from sub-Saharan Africa, have highlighted the role of production diversity (Sibhatu and Qaim 14,15 provide an excellent review of the associated literature). Traditionally, production diversity has been based on a simple count of the number of crops, or food groups, cultivated by the household in the field at a given point of time. In this article, we highlight the limitations of such a definition in the context of the rice–wheat production system that is found in consecutive seasons in the Indo-Gangetic Plains (IGP) in India. Our focus is on 4 districts spread across 3 states: Munger in Bihar, Maharajganj in Uttar Pradesh, and Kalahandi and Kandhamal in Odisha. Farming in Munger and Maharajganj is characterized by a rice–wheat cropping system as in the IGP. District-level data compiled by International Crops Research Institute for Semi Arid Tropics (ICRISAT) show that for Munger and Maharajganj nearly 90% of the area under cultivation is used for rice in the kharif or monsoon season and wheat in the rabi or winter season (note 1). In Odisha, nearly all of the area under cultivation is devoted to rice in the kharif season in both Kandhamal and Kalahandi, while cultivation in the rabi season is dominated by pulses (50% of area) and rice (70% of area), respectively. Taken together, these data indicate that for the most part field-level cultivation is predominantly a monoculture of staple crops such as rice or wheat in any given season. This results in an average production diversity score (count of crops) of close to 1 in a given season. In such a situation, there is, in effect, no diversity in production, especially when viewed from a nutrient perspective. Even if one were to add up the number of crops grown in a year as opposed to a given point of time, then the production diversity score would go up (closer to 2 because of rice in one season and wheat in the next). This increase however is more a reflection of an increase in the intensity of cultivation since rice and wheat both represent staple cereals. Furthermore, if we measure production diversity in terms of food groups, we find that since rice and wheat belong to the same food group (cereals), the production diversity score remains closer to 1. We therefore find that both forms of the traditional definition of production diversity, that is, a count of the number of crops or the number of food groups grown in the field, are limiting the context of such rice–wheat cropping systems in India.
It is against this background that we propose the use of on-farm diversity as a more relevant measure of production diversity. We distinguish it from field-level production diversity by bringing in 2 additional activities that supplement a household’s agricultural production: kitchen garden 16,17 and livestock rearing. Furthermore, we retain plot-level cultivation of pulses and vegetables. This is similar to the approach adopted by Sibhatu and Qaim 18 and Malapit et al. 19 Put together, we argue that this is a more accurate way of measuring “production diversity” and a more context-specific measure to model the effect of diversity in production on DDS, one that reflects the role of nonstaple food groups in what is otherwise a cereal centric production system. Kitchen gardens often complement household crop production by making fruits and vegetables available for household consumption throughout the year. A study from Bangaldesh 20 finds evidence that household presence of vegetable gardens improves the dietary diversity of the household. This is in line with evidence from Nepal, where Dulal et al 17 find that enhanced homestead food production is positively associated with maternal and child diet diversity. Similarly, rearing of livestock by the households has also been associated with improved nutritional outcomes. This can occur by way of availability of animal source foods such as eggs and meat (ie, production pathway) as well as by way of additional incomes from the sale of livestock (ie, income pathway). Workicho et al 21 use data from Ethiopia to show that household livestock ownership improves diet diversity despite controlling for household’s economic and social characteristics. Similarly, Kim et al 22 find that households with access to livestock are almost 5 times more likely to have children who consume animal source foods.
While production diversity can be an important source of dietary diversity, at a macro level, the extent to which a diverse diet is sourced from own production versus the market varies by the stage of a country’s economic development. 23 This implies that with structural transformation, economies advance and income level rises, lowering the importance of agricultural production for own consumption, while raising market dependence for own consumption. This aspect has been highlighted in some studies—Sibhatu et al 24 find that relative to agricultural production diversity, it is market access and market transactions that hold greater potential for improving the diet diversity among smallholder farming households across Asian countries. More recently, Gupta et al 25 find a significant association between per capita market purchases of nonstaple food groups, such as pulses, meat/fish/poultry, eggs, and dairy products, and women’s DDSs in rural India. Koppmair et al, 26 using data from Malawi, provide evidence that market food transactions (buying and selling) have a relatively larger impact on diet diversity than producing a more diverse set of foods. They also find that the effect of production diversity falls in magnitude when market access (distance to district market) and market participation (share of maize and other food crops sold) are included in the empirical specifications.
In this article, we separately investigate the determinants of women and household diet diversity in rural India using primary data collected from 3600 households in the states of Bihar, Odisha, and Uttar Pradesh. In particular, we focus on the relative importance of 3 key factors shaping dietary diversity in smallholder households—production diversity (both on-field and on-farm), market access, and women’s role in household diets. In all empirical specifications, we control for time-invariant village-level factors affecting other aspects of market access in addition to individual-, household-, and village-level factors. The results indicate mixed effects of production diversity—while the total number of crops or food groups grown on the field shows no significant effect, households that have grown pulses in the last 12 months consume 0.2 more food groups. Growing vegetables and having a kitchen garden are not significantly associated with neither household nor individual diet diversity. However, the ownership of livestock has an additional positive association with women’s dietary diversity after controlling for other factors, which implies the importance of livestock in reducing gender imbalances in DDS. We also find that increased awareness of nutrition among women, higher household food expenditure on nonstaples (like pulses and dairy), and female literacy are associated with higher dietary diversity among women and households. Additionally, we demonstrate that the aforementioned results are not sensitive to changes in the recall period of the DDS measure, neither are they sensitive to the empirical specification.
In investigating the determinants of dietary diversity in the Indian context, we make several contributions. First, we add to the existing literature by presenting rigorous evidence for the South Asian region. Second, an additional novelty of our analysis is that we use disaggregated dietary consumption data for 2 units—individual (here, women) and other household members. There are very few studies that do so. 20,26 -28 This enables us to shed light on the similarities and differences in factors that affect these 2 groups, which can be useful in the design of holistic policy that accounts for intrahousehold allocation differences. Third, we adapt commonly used indicators of field-level production diversity to one of farm-level diversity that more accurately reflects the Indian context—which by itself is a contribution to this literature. This enables us to examine in more specificity the role of production diversity in shaping dietary diversity in the Indian context. And finally, our disaggregated dietary data for women and households reflect intake in the short (24 hours) and relatively longer run (7 days). The use of multiple recall periods is limited in the current literature. 7 Incorporating different recall periods leads to 2 further advantages—one, it allows us to capture day-to-day variations in consumption, and second, it acts as a robustness check to variations in recall period.
The rest of this article is structured as follows. Section 2 discusses the literature which explores different determinants of dietary diversity. Section 3 provides information on data and methods, while section 4 presents the main results. In section 5, we discuss the policy recommendations based on our results along with our conclusions.
Determinants of Dietary Diversity
In this section, we summarize the discussion within the literature on the other important individual, household (and/or agricultural), and regional factors that are associated with DDSs across different settings.
Role of Markets
In the context of India, we expect local markets to play an important role in determining smallholder farmers’ diets—primarily due to stronger market linkages in South Asia. Gupta et al 29 identify the degree of market orientation of households in the Chandrapur district of Maharashtra in terms of the proportion of crop harvest that is sold. They find that while cash-cropping households sold nearly all of the crop (cotton and/or soybean) that they cultivated, food-cropping households reserved significant proportions of their rice (40%), lentil (40%), and gram (50%) harvest for sale in the market. These findings are similar to those for the larger Vidarbha region for cash crops such as cotton and soybean. 30 The latter study also finds that farmers sold nearly all of their pulses and vegetables that they produced. These numbers from India are higher than corresponding marketable surplus in sub-Saharan Africa, especially for food crops. In Malawi, for instance, households sold less than 10% of their production of subsistence crops such as beans, maize, sorghum, and wheat. 31
Various studies suggest that these market linkages would enable smallholders to consume a diverse diet through both the demand and supply side. On the demand side, increased incomes, via enhancing households’ ability to sell part of their produce in the market, could raise their demand for a more diverse set of foods. 26 This may reduce the role of own production in dietary diversity, as higher incomes (through market sale) could enable the household to buy a diverse food basket from the market. Gupta et al 25 find that income from sale of cereal crops has been associated with significantly higher DDSs for women in India. On the supply side, it is argued that markets can make more diverse and nutritious foods available to households, possibly across seasons. 32 This again reduces the reliance on own production for food consumption especially in the lean season. Using data from India, Rao and Pingali 33 document evidence for heterogeneous effects for different crop categories—own production pathway is statistically associated with improved body mass index for women only in the case of cereal crops, whereas for more nutritious crops (such as pulses), it is the market pathway that plays an important role for women’s nutrition. In a similar vein, market purchases of nonstaples such as pulses, meats, eggs, and dairy products have shown a positive and significant association with women’s dietary diversity in some parts of rural India. 25
For the purposes of this article, we rely on the monthly household noncereal food expenditure (such as pulses, dairy, fruits and vegetables, and meat/fish/poultry) as a measure of a household dependence on local markets. Indicators such as household food expenditures or quantities purchased are a more direct measure of the degree to which households actually rely on markets for diverse foods and are similar to the approach taken in other studies. 25,31,34 -36
Production Diversity
Sibhatu and Qaim 14 provide an exhaustive review of the literature investigating the relationship between diversity in production and consumption. In their review, they find that an increase in production diversity by one crop/livestock tends to increase household dietary diversity scores (HDDSs) by 0.06 food groups: “In other words, farms would have to produce 16 additional species in order to increase dietary diversity by one food group.” They also conclude that the mean marginal effect of increased production diversity on DDS is the lowest in Asia relative to other regions. Additionally, the evidence from India on this is mixed—using a nationally representative data set, Bhagowalia et al 37 find that agricultural production conditions are one of the primary determinants of household dietary diversity (note 2). Meanwhile, Kavitha et al 36 use data from the states of Telangana and Maharashtra and find no significant association between HDDSs and crop diversity. They conclude that while production diversity itself is not significant, whether or not the household cultivated at least one crop (food group) had an effect on dietary diversity, showing the importance of the extensive margin of production and not the intensive margin. Similarly, the production diversity of nonstaples has not shown any significant association with women’s dietary diversity in the Indian states of Uttar Pradesh, Bihar and Odisha. 25 Having said that, some studies have found different measures of farm production diversity to be associated with increases in HDDSs 2 and intake of food items belonging to micronutrient-rich food groups—legumes, vegetables and fruits, meat/fish. 8 Jones 31 finds that farm agrobiodiversity (note 3) is associated with household dietary diversity in Malawi even after accounting for production orientation and market integration of farming households. Other studies have looked at the relationship between production and consumption in the context of other south Asian countries such as Bangladesh and Nepal. Using data from Nepal, Malapit et al 19 find a significant positive association between production diversity and diet diversity. Related to this, Stevens et al 38 find significant seasonality in consumption—both diet diversity and food security are much lower in summer and spring.
We add to this literature by making a distinction between field-level and on-farm production diversity in order to account for the specific nature of cropping system found in our study locations—the cereal-centric rice–wheat production. Our measure of on-farm diversity includes both field-level cultivation of nonstaple food groups such as pulses and vegetables and farm-level activities such as the presence of kitchen garden and rearing of livestock by the household. The construction of these indicators is described in the Methods section below.
Nutrition Awareness
Using focus group discussions (and conversations) with communities and implementing organizations, we attempted to understand other cultural/socioeconomic factors that might shape diets in these regions. We found a substantial number of people citing lack of knowledge/awareness about the importance of nutrition being a significant barrier. On further discussion, it became clearer that this was the case due to the fact that the deleterious impacts of malnourishment mostly have long-run physical manifestations, unlike most diseases that have considerable short-run effects. This nature of malnourishment leads people to discount the importance of nutrition and makes them focus on it only when there are some visible effects. This discussion prompted us to include questions in our survey probing the nutrition knowledge of the index woman of the household (the one with the primary responsibility for food preparation). In particular, we ask whether the index woman has been involved in any activities involved with gaining awareness about nutrition and related concepts discussed in meetings or workshops in the 3 months preceding the survey. This is a unique piece of information, one that the literature has not yet discussed. Given the relative success (and focus) of recent interventions on nutrition-related behavior change, 39 knowledge of nutrition a priori seems to be an important determinant of dietary diversity at the household and individual level. Having said that, this measure has rarely been incorporated in such analyses. The nearest similar indicator that we have found in recent work is by Menon et al 12 and Harris-Fry et al. 20
Other Factors
In addition to the aforementioned factors, we include in our empirical specifications other commonly identified determinants of dietary diversity. These include household size, 26,35 -37 wealth, 31,37 off-farm income, 26 and the number of nonagricultural income sources. 35 Also found relevant is the household-level ownership of agricultural assets such as irrigation, farm equipment, poultry, and livestock. 37 At the individual level, education and age of household head, and women’s education and decision-making were significant determinants of household dietary diversity in India 36,37 and elsewhere. 24,26,31 In the case of India, Bhagowalia et al 37 also use dummy variables for region and religion and find those to have a statistically significant association with HDDSs (note 4). This is analogous to Menon et al, 12 who account for the caste/tribe of the household head and religion, in addition to region-level dummies. In our model specifications, we account for a majority of these factors.
Methods
Sample and Data Collection
We use primary data collected as part of a baseline survey designed and implemented by the program on Technical Assistance and Research for Indian Nutrition and Agriculture (TARINA) in India. This is a consortium of research organizations and implementation agencies that are working toward the design, promotion, and evaluation of nutrition-sensitive food interventions in India. The bulk of the activities are concentrated in 4 districts spread across the 3 states: Munger (Bihar), Maharajganj (Uttar Pradesh), and Kalahandi and Kandhamal (Odisha). Munger 40 falls in the Eastern Plain subhumid (moist) eco subregion of India. The district experiences an average rainfall of 952 mm from June to September (also known as the kharif or monsoon season). The major soil type is clayey. The major field crop (both in terms of area under cultivation and output) in the kharif season is rain-fed rice and in the winter (or rabi) season is rain-fed wheat. Maharajganj 41 falls in the same agroecological subregion as Munger. The average rainfall in the monsoon season is 1182 mm and the district is characterized mainly by alluvial loamy soils. Rice is the main crop cultivated in the kharif season and it is rain fed. In the winter and summer seasons, the major crops are wheat (irrigated) and sugarcane, respectively. Both, Kalahandi 42 and Kandhamal 43 districts of Odisha belong to the agroecological subregion known as Garhjat hills, Dandakaranya and Eastern Ghats hot moist subhumid eco subregion. Both districts receive approximately 1200 mm of rainfall between June and September and have a significant amount of the total geographical area under forest cover. The major soil in Kalahandi is red soil, while in Kandhamal, it is red, light texture soil. The cropping pattern in Kalahandi is characterized by rice (irrigated and rain fed) in kharif and rabi (irrigated only). Lentils (green gram, black gram, and arhar) are also cultivated (rain fed) in both the seasons, while cotton is cultivated in the kharif season alone. In Kandhamal, the major crops are rain-fed rice and maize in the kharif season and irrigated rice in the rabi season.
The TARINA Baseline Survey (TBS) consists of a sample of 3600 households from these 4 districts. The sampling design was as follows: In the first step, based on population size and the geographical areas in which the partner nongovernmental organizations operated, 30 villages were selected in each district. This led to a total of 120 villages in our sample. In the second step, a village census was done in these chosen villages and 30 households per village were selected randomly.
Each of these selected households was administered 2 separate surveys—one to a male respondent (identified as the index male) and the other to a female respondent (identified as the index female). The index man was the primary decision maker in the household. Since the index male is expected to know most about the cropping practices and other economic status–related variables, he was administered sections that focused on these topics. The index woman was selected based on the age-group (15-49 years old, nonpregnant, nonlactating) and was typically the person in charge of food preparation in the household. The index woman was administered a separate module that sought information on food access, infant and young child feeding practices, water sanitation and hygiene, group membership, and empowerment in agriculture. The women were also administered a detailed module on dietary intake for herself and other members of the household over the past 24 hours. In addition to this, data on frequency of food intake over the past 7 days were also collected. In addition to these surveys, the TBS also collected village-level information. This comprised of indicators on demographic profile, government services (related to health, education, public distribution system [PDS]), and market access (such as distance and time to market) among other data.
Construction of Key Variables
Dietary diversity scores
Data on dietary intake in the past 24 hours (and 7 days) were collected at the individual (woman) and household level using a list of foods that are commonly consumed in the districts within our sample. The list of foods was arrived at using a 3-step process. As a first step, extensive focus group discussions and in-depth interviews were carried out with women in each district as part of a Food Systems Diagnostics Study. The foods indicated therein were then shared with the program implementation partners in each district to ensure that they were valid and to identify any omissions in the food list. Based on feedback received from the implementation partners, the food list was revised and included in the questionnaire. Lastly, the list was again “tested” as part of the pretesting of the questionnaire and during the training of the field staff. This last step ensured that any feedback from the field regarding the relevance of the food items was incorporated before the final data collection began. The list of foods included staple and nonstaple crops, pulses, tubers, peas/beans, nuts and seeds, an extensive list of vitamin A-rich fruits, vitamin A-rich vegetables, other fruits, other vegetables, vitamin C-rich fruits/vegetables, wadi (orchard) fruits, forest produce, spices, dairy products, meat products, and snacks/sweets/beverages. A final category in the questionnaire accounted for “other” food items wherein enumerators were able to record any foods that may not have been included in the food list. Taken together, we accounted for foods that are cultivated in the field, cultivated in orchards (known as WADI plots), and those collected from the forests.
For each food item, information was recorded about whether or not it was consumed by (1) the index woman and (2) by any other member of the household in the past 24 hours (7 days). All food items were eventually clubbed into key food groups to arrive at the number of food groups consumed by the woman and by any member of the household over a 24-hour period (7 days). The total number of food groups consumed was used to compute DDSs for women and households based on Food and Agriculture Organization (FAO) guidelines. 44,45 For women, the DDS is known as the minimum dietary diversity–women (MDDW) and ranges from 0 to 10. The HDDS is calculated on a scale that ranges from 0 to 12. In both cases, a larger score signifies a higher diversity in the underlying diet. The food groups included in their computation are summarized in Table 1. For the purpose of this article, the HDDS is based on 11 of the original 12 food groups. Two food groups: meat and fish/seafood have been merged. More recently, the MDDW has gained traction and is one of the top 2 nutrition-sensitive indicators recommended by the FAO for tracking outcomes of nutrition-sensitive interventions. It has been validated to reflect nutrient adequacy (which reflects diet quality) in women of reproductive age-group. 45 On the other hand, the HDDS is considered to be a measure of a household’s economic access to dietary energy/higher kilocalories (which reflects household food security) and has not yet been validated as a measure of micronutrient adequacy. 44
Food Groups Included in the Dietary Diversity Scores.
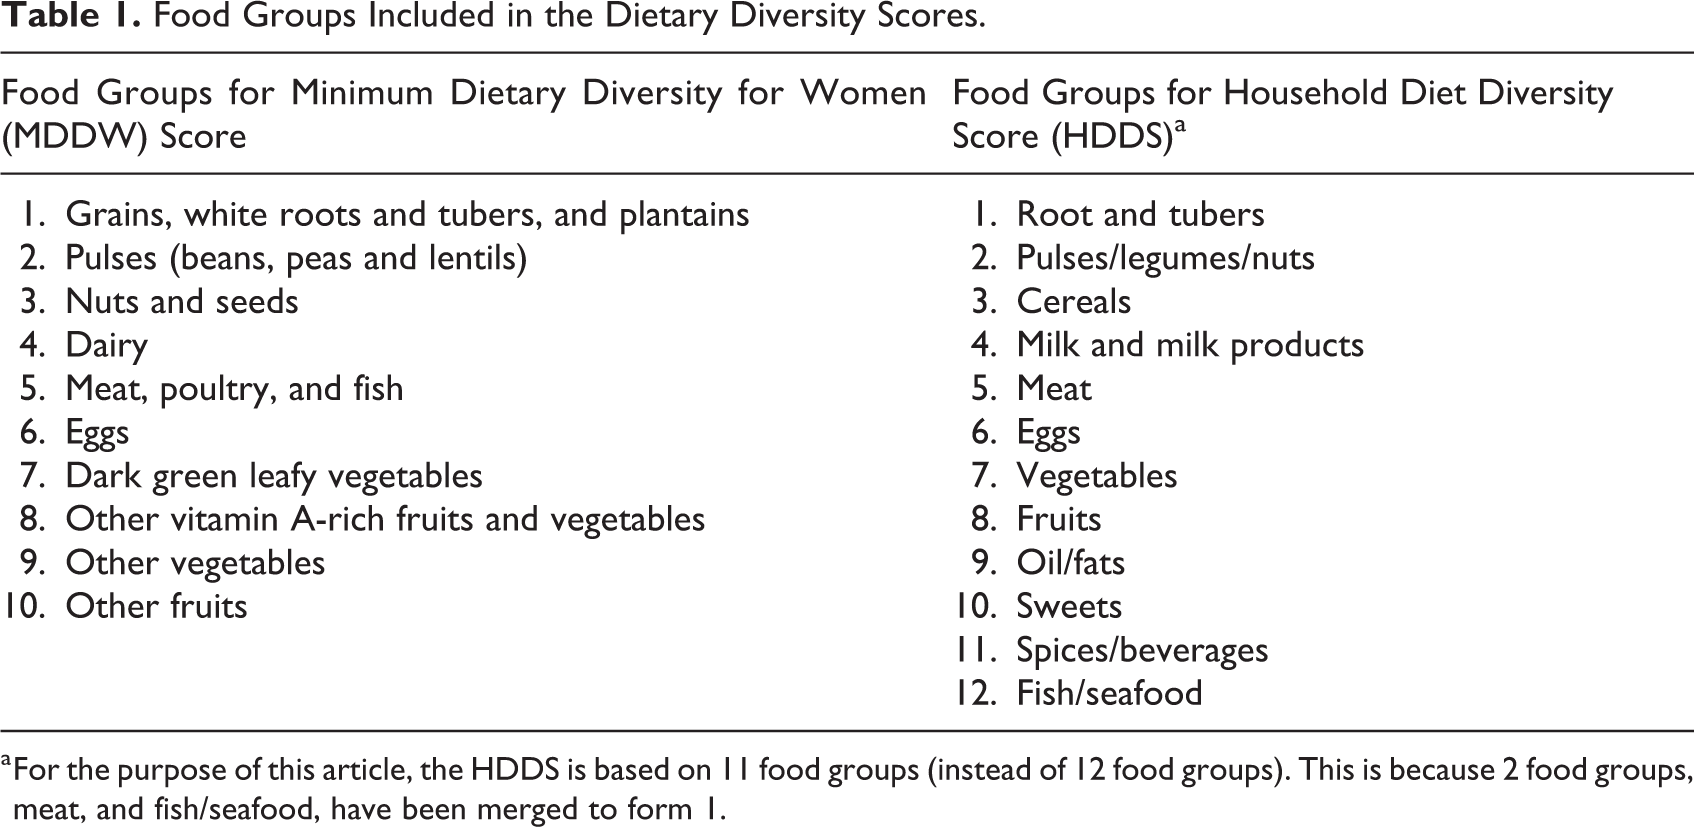
a For the purpose of this article, the HDDS is based on 11 food groups (instead of 12 food groups). This is because 2 food groups, meat, and fish/seafood, have been merged to form 1.
Respondents are typically asked for their consumption of different food items for a predetermined recall period. Some of the more commonly used recall periods in the literature are 24 hours (eg, MDDW, HDDS), 3 days, 7 and 7 days. 6,9,10,34 The 30-day recall period has been used to a much lesser extent. The literature does not recommend the universal use of one particular recall period for DDS calculations, with the choice depending on the context. In our analysis, we use multiple recall periods (24 hours and 7 days) to account for variations in day-to-day consumption. This allays concerns that our results are driven by the recall period of the DDS. If the inferences we make differ across recall periods, then it would point toward the importance of recall period in such analyses (note 5).
Production diversity scores
In this article, we measure production diversity in 3 different ways. Across the different definitions, we consider production diversity over the course of an agricultural year as opposed to contemporaneously. The first 2 definitions are based on agricultural production that occurs in the field. To begin with, we define field-level production diversity in terms of a simple count of the number of crops cultivated in a given agricultural year (past 3 seasons). Next, we account for production diversity in terms of the sum of distinct food groups being cultivated by the household on the field over the course of a year. The food groups we focus on are cereals, vegetables, fruits, and pulses. This is similar in approach to Sibhatu and Qaim 18 and Malapit et al. 19 However, both these definitions are limited in reflecting nutritional diversity in production (as discussed in the Introduction). Therefore, we propose a third definition of production diversity that goes beyond field-level diversity to farm-level diversity. We measure on-farm diversity in terms of production activities that take place on the agricultural field as well as allied agricultural activities like kitchen gardens and livestock rearing that the household is engaged in. Accordingly, our definition of on-farm diversity is conceptualized as a set of 4 activities conducted by the household: (1) whether or not the household undertakes field-level production of pulses (2) and of vegetables, (3) whether or not the household has a kitchen garden, and (4) whether or not the household owns livestock. In terms of food groups, these 4 (pulses, vegetables, kitchen gardens, and livestock) reflect protein and micronutrient-rich foods that are nonstaples. It also corresponds to food groups that are commonly used to measure dietary diversity and are similar to the use of crop nutritional functional richness by Jones. 31 These we believe adequately capture the specific nature of household production that could lead to more diversity in their diets.
Production diversity information was elicited using an extensive list of field crops that were arrived at after an initial Food Systems Diagnostics Study that involved focus group discussions and in-depth interviews with community members. This was followed by discussion with the program implementation partners in each district. Finally, any remaining changes to the list of crops were incorporated after pretesting and field training. In total, the questionnaire included 25 crops, fruits, vegetables, and seeds. While the response was elicited mainly based on a predetermined list of crops, the survey included an option of “other” to allow the enumerators to record any crops that may have been missed. In addition to field crops, we also elicit information about the presence of kitchen gardens in the household.
Household market integration
We account for the role of markets by focusing on their ability to meet the food consumption needs of the households, as opposed to it being a source of income (sellers of produce). We therefore use food expenditures as one of the measures used to account for a household’s reliance on local markets for improving the diversity in the food consumed. This constitutes a direct measure of a household’s reliance on markets for food, as opposed to using various income-based measures (eg, income from sales, proportion of crops sold, etc) as a proxy for the same. While Thorne-Lyman et al 34 disaggregate food expenditures into grain and nongrain expenditure, we go one step further by focusing on the amount spent by the household on individual food groups in the previous month. This includes monthly expenditure on staple cereals as well as on nonstaples. The nonstaple food groups we focus on are pulses, dairy, fruits and vegetables, and meat/fish/poultry. By focusing on disaggregated food group expenditures in general, as opposed to total household food expenditure, we are able to focus on the relative importance of each food group for improved dietary diversity. Furthermore, by focusing on noncereal food groups in particular, we are able to gauge the ability of households to access protein-rich (pulses, meats) and micronutrient-rich (fruits and vegetables) foods from local markets. Moreover, we controls for village fixed effects in the specifications we use (see below), which in the cross section would account for village-level factors related to markets such as quality of transport infrastructure, distance to closest market, and other market-level factors that are common to all households within the village.
Empirical Methodology
As part of our primary objective, we investigate the determinants of household and women’s dietary diversity. To do so, we regress the MDDW and HDDS on a variety of explanatory individual and household characteristics. In these specifications, we apply Ordinary Least Squares (OLS) assumptions and include village-level fixed effects, in addition to individual and household-level controls. The village fixed effect would control for any factors at the village level that do not change across time. Since our data do not have multiple time periods, it controls for village-level factors not captured in the other control variables. Equations 1 and 2 refer to the 11-point HDDS and 10-point MDDW respectively.
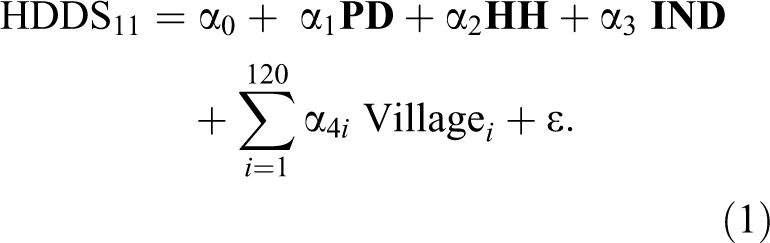
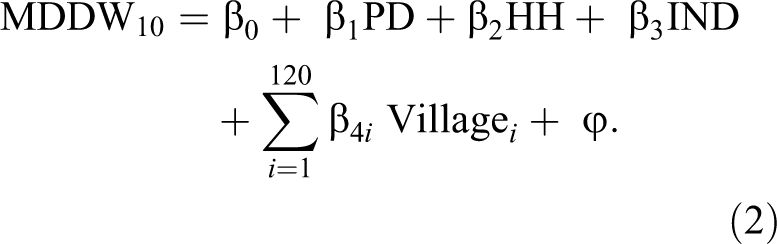
In the above equations, PD refers to production diversity. Each equation is run thrice to account for the 3 different definitions of production diversity: (1) field-level count of food crops, (2) field-level count of food groups, and (3) on-farm diversity (ie, whether or not the household was involved in field-level cultivation of pulses, vegetables and whether or not the household is engaged in kitchen gardens and livestock rearing). Household (HH) is a vector of household-level characteristics that can influence dietary diversity. These include whether or not the household has accessed food from the PDS (binary) in the 1 month preceding the survey; household size; household monthly food expenditure (in rupees) on pulses, dairy, fruit/vegetables, and meat/fish (note 6); and caste (3 binary variables for scheduled caste, scheduled tribe, and dalit). IND is a vector of individual-level characteristics that are expected to influence dietary intake at the individual level. These include age and age-squared of the index woman, whether or not she is literate (binary), and whether or not she participated in any nutrition awareness-related workshops in the 3 months preceding the survey (binary; note 7).
The presence of a large set of control variables reduces the possibility of a large omitted variable bias. Reverse causality might not pose a major threat in this setup—this is because the data on the agricultural diversity (production) pre-dates the data on diet diversity (consumption). The survey asked for consumption in the past 24 hours and 7 days, while the production information comes from the agricultural cycle in the past 12 months.
We conduct 2 robustness checks of our results. Both of these are carried out for our measure of on-farm production diversity. First, we use a different recall period for assessing determinants of dietary diversity. In this check, we use a 7-day recall period, instead of the 24-hour recall period used in the main results. We then replicate the analysis in equations (1)-(2) using this new recall period of 7 days—if the results remain the same across the 2 reference periods, then it would allay concerns that our results are driven by the recall period of the DDS. If the inferences we make differ across recall periods, then it would point toward the importance of recall period in such analyses (note 8). The second robustness check we conduct is that we apply a Poisson specification instead of the OLS. This is done to account for the fact that the outcome of interest (DDS) is a count variable.
Results
Descriptive Statistics
Our sample consists of rural populations from 4 districts of India. Descriptive statistics are presented in Table 2. Although there are a few wealthy households in the sample, the average monthly expenditure on cereal grains is ₹780. Similarly, expenditures on pulses (₹350 per month) and dairy products (₹230 per month) are also low. Around 55% of the sample owns some form of livestock, whereas only 10% has a kitchen garden. Put together, this leads to low levels of average diet diversity in these regions—women in these regions consume around 4.3 food groups. Analogously, other household members consume 5.9 food groups. Education and awareness are also fairly low compared to national averages—only 40% of the women in these households reported being literate, whereas only 14% reported being aware about nutrition.
Summary Statistics.
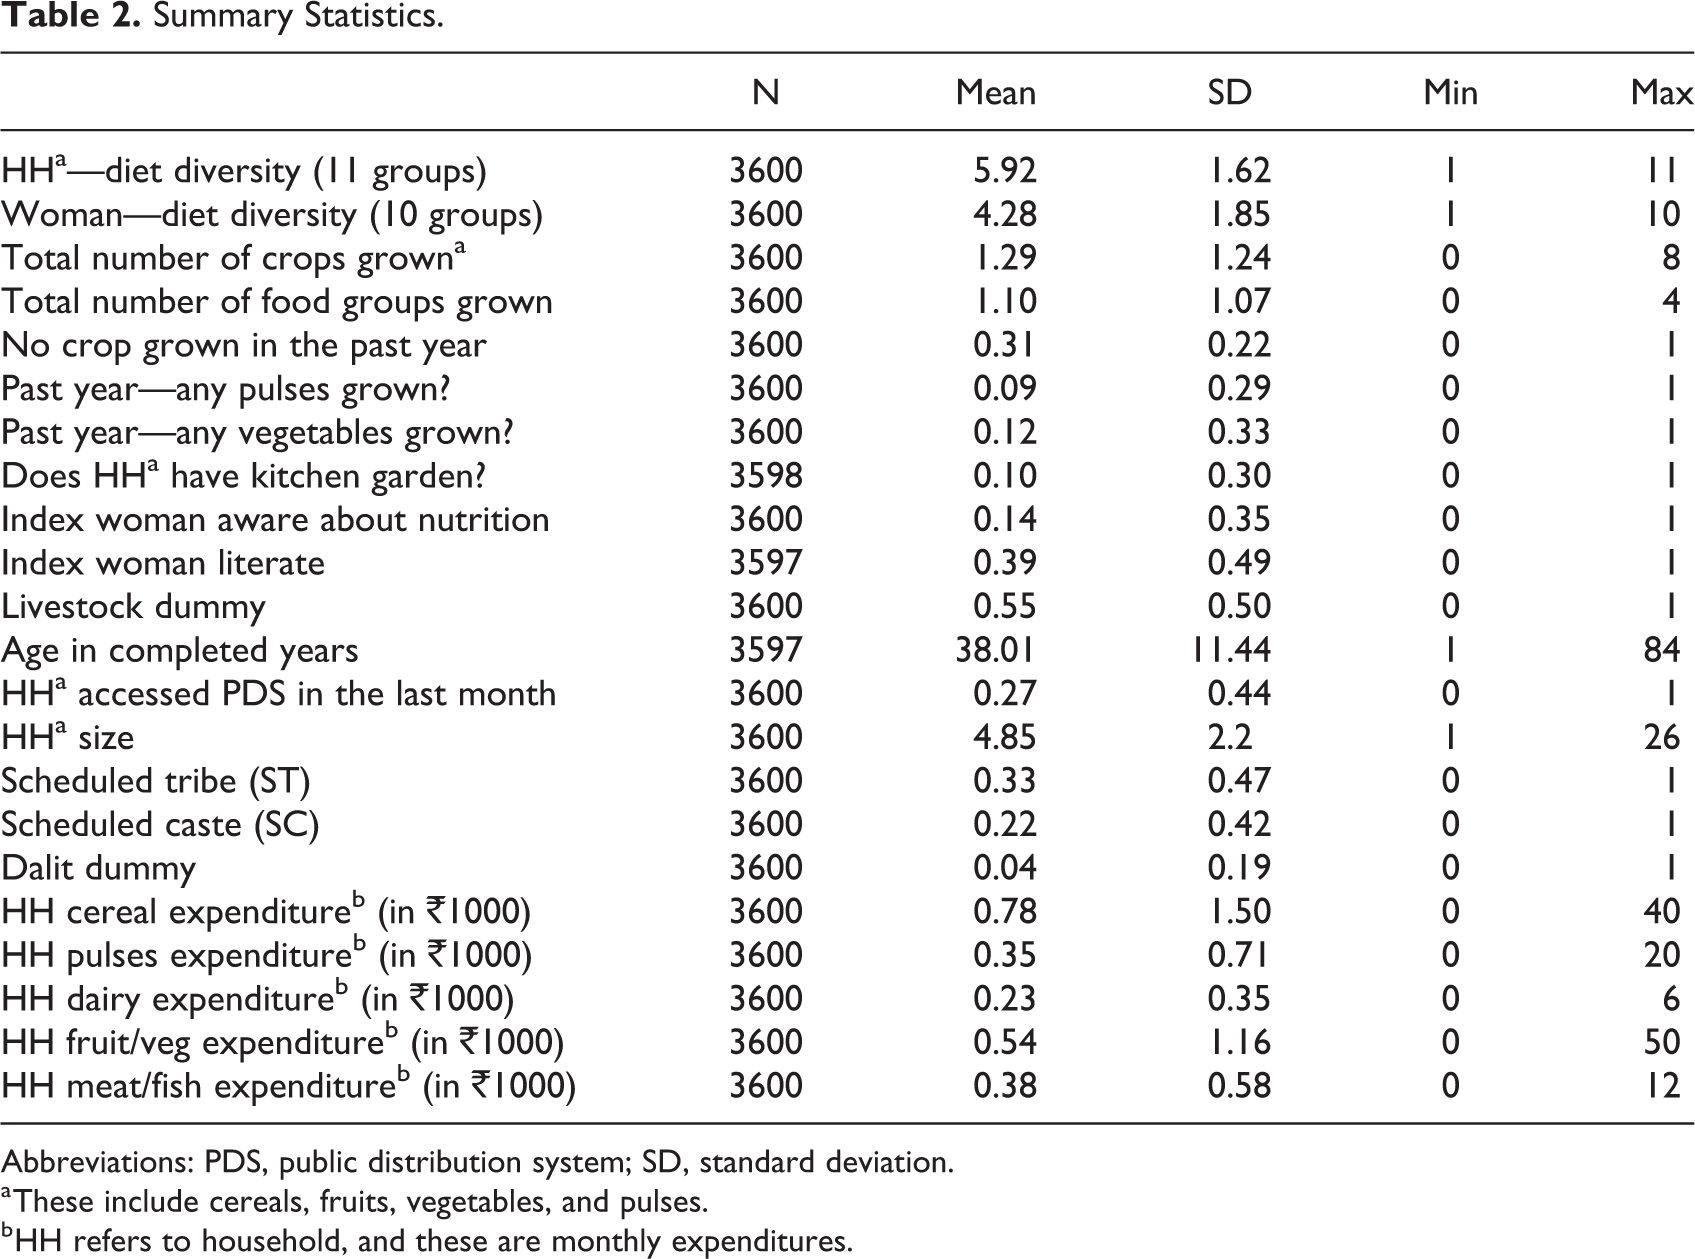
Abbreviations: PDS, public distribution system; SD, standard deviation.
a These include cereals, fruits, vegetables, and pulses.
b HH refers to household, and these are monthly expenditures.
Status of Dietary Diversity Across Districts Using 24-Hour and 7-Day Recall
As per the definition of individual dietary diversity provided in the methods section above (MDDW = scale of 10), the mean DDS for the women sample in our sample is 4.3. Further, when broken down into food groups, we find that the staple diet for women across all districts consists of cereals, pulses, and other vegetables, while the consumption of micronutrient-rich food groups (such as green leafy vegetables, vitamin A-rich fruits and vegetables, meat/fish/poultry, and eggs) is very low (less than 30% women in any given district). Results in Table 3 indicate that on average women in the 2 districts in Odisha (Kalahandi and Kandhamal) consume 4.7 and 4.8 food groups. This is almost one food group higher than the diet diversity score for women in Munger (Bihar) and Maharajganj (Uttar Pradesh). One could argue that the differences in means observed here are due to some outliers or extreme values in certain regions. However, since around 50% of women have scores below the mean in all the districts, the mean does not seem to be driven by a few extreme values. Therefore, in Munger and Maharajganj, there seems to be a rather large number of women who have low diet diversity scores, thus showing large regional variances in dietary diversity.
Average Diet Diversity Scores and Proportion of Women With DD Below Mean (24-Hour and 7-Day Recall).
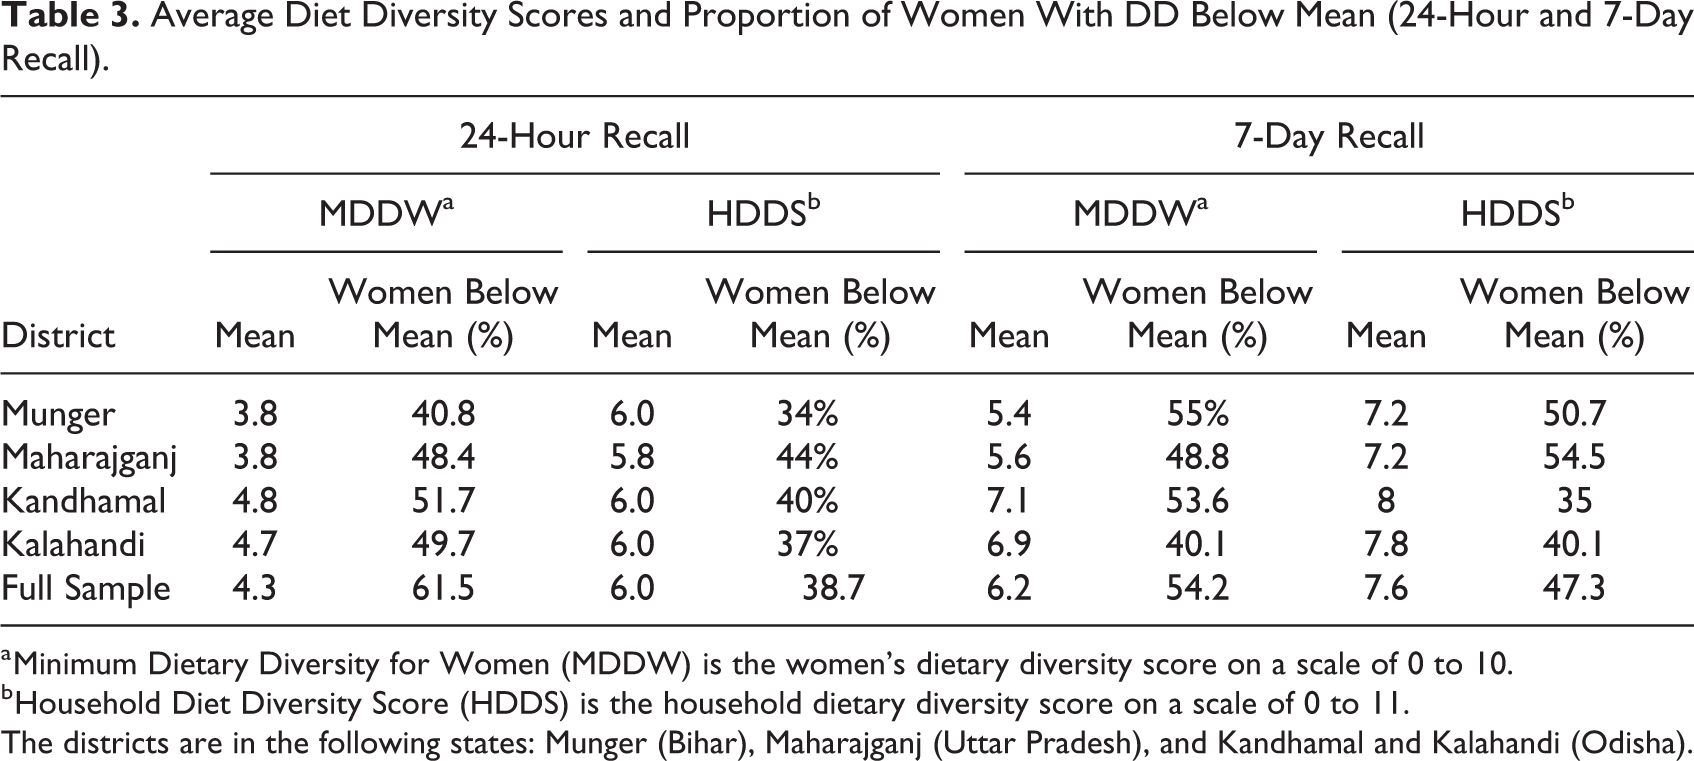
a Minimum Dietary Diversity for Women (MDDW) is the women’s dietary diversity score on a scale of 0 to 10.
b Household Diet Diversity Score (HDDS) is the household dietary diversity score on a scale of 0 to 11.
The districts are in the following states: Munger (Bihar), Maharajganj (Uttar Pradesh), and Kandhamal and Kalahandi (Odisha).
Table 3 also presents results for household-level DDSs. Based on the HDDS definition, the average household in the sample consumes 6 food groups over a given 24-hour period. Additionally, there are no significant regional differences in the HDDS scores with the 24-hour recall. We also find that the results using the 7-day recall period are qualitatively similar to the results with the 24-hour recall.
Determinants of Women DDS and HDDS
Further, we explore the determinants of diet diversity for women and households separately in Table 4. In this table, these scores are constructed based on a 24-hour recall period. As one of the important independent variables, these specifications include production diversity. We find that on-farm production diversity in columns 1 and 2 is a significant determinant of DDSs. More specifically, it is the production of pulses and ownership of livestock by the household that has a positive and significant association with household diet diversity. This is in line with expectations that households who produce a wider variety of crops (in addition to the staples) are more likely to consume diverse diets. 18,46,47 The presence of livestock in the household is associated with a higher women’s diet diversity and not that of the household. This relationship remains despite controlling for other factors indicates the importance of livestock in addressing within-household diet imbalances. In contrast to our measure of on-farm production diversity, the conventional definitions of production diversity do not show any significant association with dietary diversity for women or households in our sample. Both the number of distinct crops and food groups grown in the field in the past 12 months have a positive but statistically insignificant association with DDS for women and households. These results are presented in columns 3 to 6 of Table 4.
Determinants of Women and Household DD With 24 Hour Recall—Using Three Different Definitions of Production Diversity.a
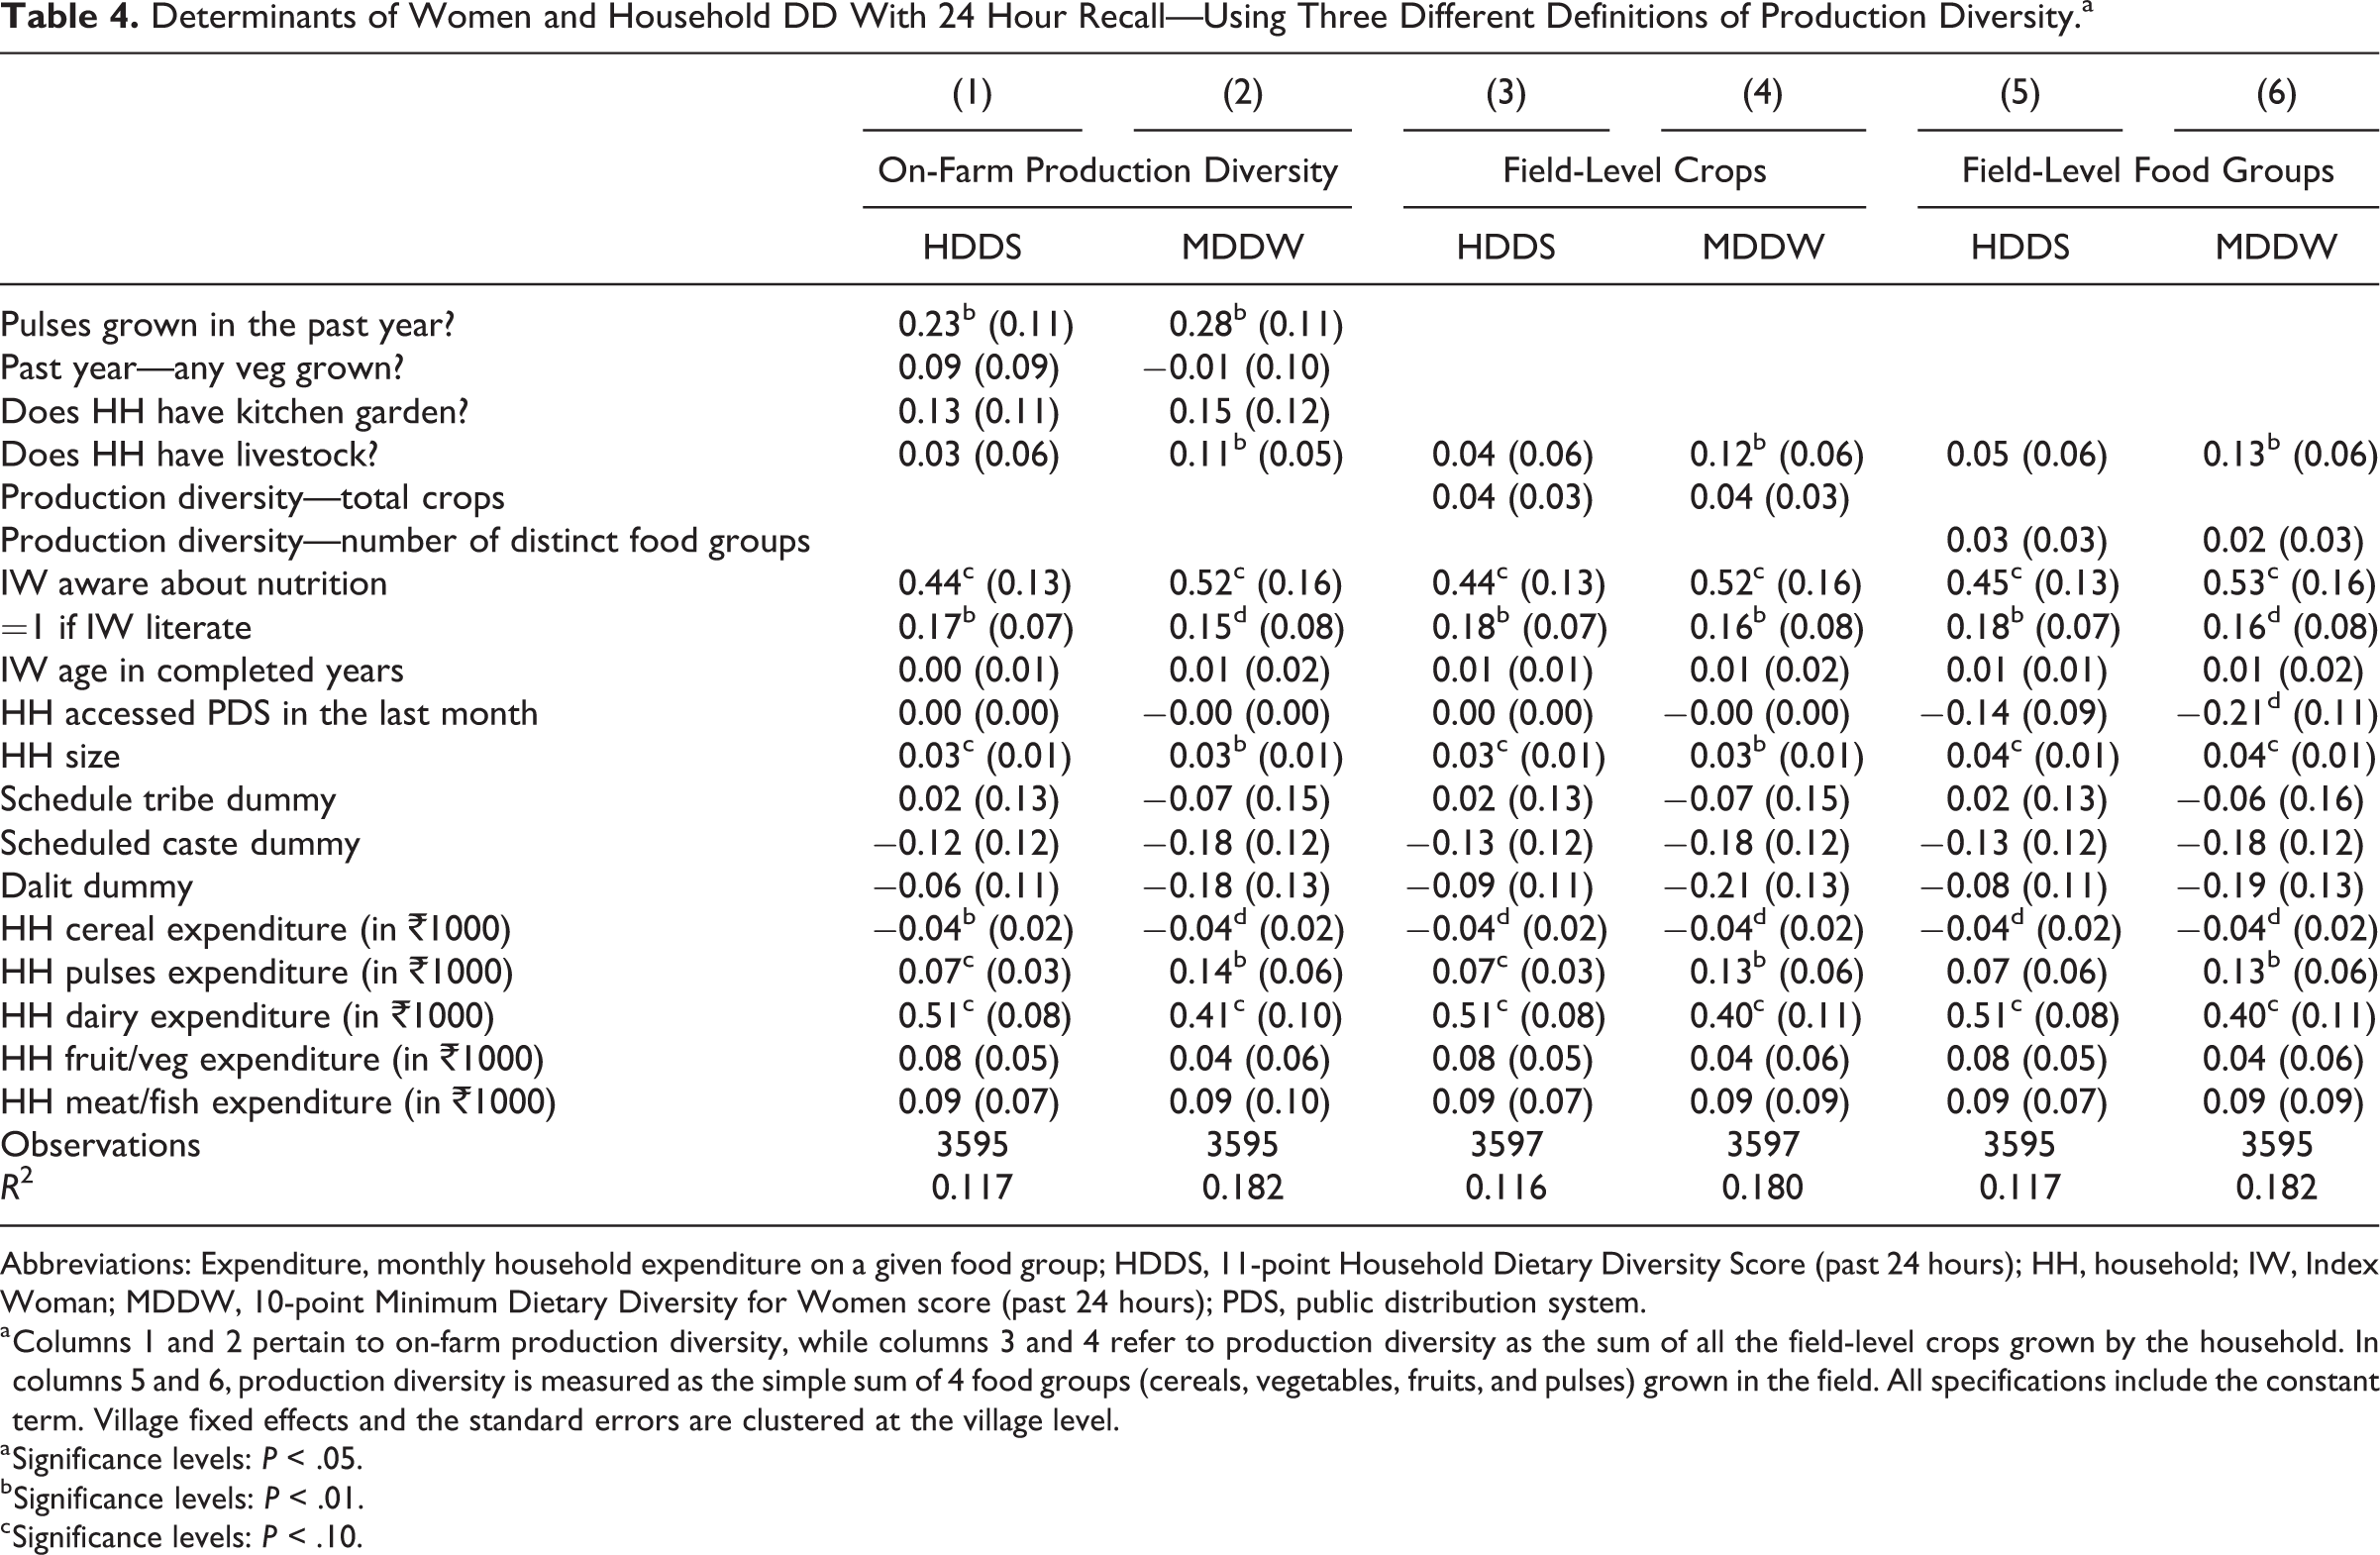
Abbreviations: Expenditure, monthly household expenditure on a given food group; HDDS, 11-point Household Dietary Diversity Score (past 24 hours); HH, household; IW, Index Woman; MDDW, 10-point Minimum Dietary Diversity for Women score (past 24 hours); PDS, public distribution system.
a Columns 1 and 2 pertain to on-farm production diversity, while columns 3 and 4 refer to production diversity as the sum of all the field-level crops grown by the household. In columns 5 and 6, production diversity is measured as the simple sum of 4 food groups (cereals, vegetables, fruits, and pulses) grown in the field. All specifications include the constant term. Village fixed effects and the standard errors are clustered at the village level.
a Significance levels: P < .05.
b Significance levels: P < .01.
c Significance levels: P < .10.
Results relating to other determinants of dietary diversity such as market integration, women’s awareness, and literacy as well as household size are preserved across the different definitions of production diversity. Table 4 also highlights the importance of market integration for improved dietary diversity. We find that household expenditure on pulses and dairy has a positive and statistically significant relationship with the intake of a nutritionally diverse diet for women and households. This implies that although own production diversity is not associated with a greater diversity in consumption, higher market purchases of nonstaples are associated with higher dietary diversity. At the same time, the expenditure on cereals has a significant but negative association with dietary diversity. This is in line with expectations as a higher expenditure on cereal (staple grains) would leave less resources to diversify the diet with more micronutrient-rich foods. Related to this, Thorne-Lyman et al 34 use data from Bangladesh to establish that household nongrain expenditure has a higher correlation with diet diversity than total food expenditure (or total household expenditure).
We also find that across different specifications of production diversity, women’s awareness about nutrition has a large positive statistically significant association—women who report being aware about the concept of nutrition consume 0.4 to 0.5 more food groups compared to women who are not aware about nutrition. In addition to this effect, women’s literacy also has a positive relationship with diet diversity—literate women consume around 0.1 to 0.2 more food groups. This result is in line with literature that shows a positive effect of women’s education on a number of well-being outcomes. 48
Variation in Recall Period (7 Days)
We verify whether the results for our measure of on-farm production diversity are robust to changing the recall period of the DDS used in the analysis—using a 7-day recall period instead of a 24-hour recall. The results imply that the determinants of dietary diversity are independent of the recall period of the diet diversity measure. Online Appendix Table 1 presents the results from the specifications where we replicate the analysis in columns 1 and 2 of Table 4 (24-hour recall) using a 7-day recall period. We find that most of the associations remain consistent—pulses cultivation, women’s literacy, and household expenditures on pulses/dairy still have a positive and significant association with both household and women diet diversity. Interestingly, in addition to pulse cultivation, the presence of kitchen gardens too is associated with significantly higher DDSs for households and women when a longer recall period is used. Moreover, while market purchases of cereals are no longer a significant determinant of dietary diversity, purchases of fruits and vegetables are significant for households.
Variations in Empirical Strategy (Poisson Regressions)
Online Appendix Table 2 presents results for a robustness check of results in Tables 4 and 5 after changing the empirical specification. Instead of using an OLS model to estimate the relationships, we use a Poisson regression. 24 We find that most of our results for on-farm production diversity remain robust to this change.
Discussion
We use primary data from 3600 households in India to analyze the determinants of dietary diversity for women and households. In the analysis, we expand upon the traditional measurement of production diversity by accounting for the multiple production strategies that households often employ (farm-level activities such as kitchen gardens and livestock rearing, in addition to field-level cultivation of pulses and vegetables). This more accurately captures the realities of cropping patterns in India. We also control for market access of different food groups—we use household expenditure on different food groups as proxy variables. Together, they enable us to identify the relative importance of own production versus purchases and the role-specific food groups (pulses, dairy, fruits/vegetables) for different target groups, especially women. Further, we capture time variations in consumption by making use of multiple recall periods. Our results highlight potential nodes which public policy can target in order to improve dietary intakes. These can be categorized into the following broad domains.
Production Diversification Versus Market Access
While our results highlight the importance of on-farm production diversity for improved dietary diversity, they still show that its relative importance may be lower than that of food purchases in influencing dietary diversity outcomes. Our measure of on-farm production diversity allows us to identify the specific nature of farm-level production that contributes to better diets for women and households. For instance, field-level cultivation of nonstaples like pulses in particular is consistently associated with significantly higher diet diversity scores for both women and households irrespective of the recall period used. But the results also highlight the importance of market access—after controlling for production and other village-level factors affecting access, we find that market purchases of pulses/dairy/fruits and vegetables are associated with higher diet diversity. This indicates the important role that markets can play in complementing own production, more so in the long run. This in turn highlights the importance of ensuring that households have access to nonstaples in local markets at affordable prices. This can be achieved by ensuring adequate market infrastructure (roads, transport, storage) as well as supporting price policies.
The results also indicate the need to promote provision of nonstaples in order to improve dietary intake—we find that the MDDW and HDDS significantly lower as household expenditure on cereals increases. Our results indicate that reliance on cereals either from the market or from the PDS is associated with lower levels of dietary diversity for women and households. Taken in conjunction with the results on the role of market purchases of noncereals (discussed above), the results point toward the importance of reorienting agricultural policy in India away from cereals (like rice and wheat) and toward nonstaples. In addition, there is also need to ensure that there are investments in rural infrastructure to support the access to markets that make nonstaple foods available to households at affordable prices. 49,50
Role of Livestock
In addition to field-level crop production, our results also point to the importance of livestock management in improving diets, especially for women. We find that women’s DDSs are significantly higher when the household owns livestock. It is possible that livestock acts as a source of animal source foods and/or as a source of income that contributes to a more diverse diet. As indicated earlier, it could also be the case that owning livestock may imply more sources of meat products for the household, which potentially increases the amount of these products consumed. This in turn might mean more opportunities for women to consume these food groups. Accordingly, there is a need for government policies to promote livestock rearing as a viable livelihood strategy for smallholder farmers. This can be achieved through linking households to dairy value chains and/or providing them with information about (and access to) modern breeding practices and veterinary services. While linking households to value chains can primarily facilitate an increased income, our results also point toward the importance of ensuring that households are able to access dairy products from the markets at affordable prices (as discussed above).
Promoting Nutrition Education and Awareness
In addition to accounting for indicators related to production and purchase, we also find an important role for women’s awareness and education. Women who are literate not only themselves have significantly higher DSSs, but other members in the household also consume more diverse diets. The results remain robust with both the 24-hour and 7-day recall periods. The strong and significant association between women’s awareness about nutrition and dietary diversity is a result that is novel to this literature, since such a variable has seldom been included as a determinant of dietary diversity. This is particularly important because this relationship is present despite controlling for other factors related to women’s literacy, caste, religion, and region. This implies that knowledge of nutrition has a particularly significant impact on the dietary diversity at the individual and household level. Therefore, information campaigns that sensitize people on the importance of nutrition might be a cost-effective way of improving dietary outcomes.
Conclusion
In addition to the policy implications of our results (discussed above), this article makes key methodological contributions. By relying on detailed primary data, we are able to empirically investigate the role of markets and production diversity for 2 target groups—women and households. This is in contrast to most studies that focus on one of the two. Furthermore, since our data were collected for 2 different recall periods, we are able to account for fluctuations in day-to-day consumptions at both, the individual and household level. We also use multiple definitions of production diversity ranging from the traditional field-level count of crops/food groups cultivated to a context-specific measure of on-farm production diversity in our analysis. We find that unlike the traditional count of number of crops cultivated, it is a disaggregated look at cultivation of both field-level crops and allied activities such as kitchen gardens and livestock which is more relevant for the Indian context. Our results indicate the field-level cultivation of nonstaples that is more relevant for determining dietary diversity of both women and households in India. This highlights the need for adapting commonly used metrics to the specific nature of agricultural production that characterizes a given location. In addition to accounting for the role of production diversity, we also control for a direct measure of household market integration that allows us to identify the role played by specific nonstaple food groups. And finally, we find that an important role is played by the inclusion of nutrition awareness in the analysis. This brings forth evidence on the critical nature of information campaigns in changing behaviors and practices related to nutrition.
Even though we use cross-sectional data in our analysis, we believe that the use of 2 recall periods (to some extent) allows us to track changes in daily consumption. Errors due to inaccurate recall are unlikely in the case of diet diversity data—since these scores are based on relatively short recall times of 24 hours and 7 days. There is a potential for such error in the production diversity, which is measured using cropping activity of the household over the past year (as on the survey date). Such issues are more likely in detailed information regarding production (such as amount, prices, crop use, etc) but are less likely in the reporting of the number and nature of crops grown over the past 12 months (which contribute to the calculation of production diversity), which we expect respondents to recall fairly reliably. Regarding livestock, we note here that the presence of livestock by itself doesn’t reflect the actual production and consumption of animal source foods by the household. The lack of detailed data on household production of animal source foods limits us in exploring this relationship further in this article.
Studying the determinants of diet diversity in different regions provides policy makers with a variety of evidence on the different factors that can shape diets in different contexts—in regions where markets are strong, their role is enhanced as opposed to places where they are not as prevalent. Such analyses hold the potential of informing the design of public policies related to improving diets of women and households in different parts of the world.
Supplemental Material
Supplemental Material, FNB_-_Appendix_-_FINAL - Market Access, Production Diversity, and Diet Diversity: Evidence From India
Supplemental Material, FNB_-_Appendix_-_FINAL for Market Access, Production Diversity, and Diet Diversity: Evidence From India by Soumya Gupta, Naveen Sunder and Prabhu L. Pingali in Food and Nutrition Bulletin
Footnotes
Acknowledgments
The authors would like to thank Dhiraj Singh (research staff at TCI’s Program for Technical Assistance and Research for Indian Nutrition and Agriculture) for his help in collecting and cleaning the data.
Author's Note
Naveen Sundar is currently affiliated with the Department of Economics, Bentley University, Waltham, MA.
Declaration of Conflicting Interests
The author(s) declared no potential conflicts of interest with respect to the research, authorship, and/or publication of this article.
Funding
The author(s) disclosed receipt of the following financial support for the research, authorship, and/or publication of this article: Data for this study were collected as part of the Technical Assistance and Research for Indian Nutrition and Agriculture (TARINA) program led by the Tata-Cornell Institute for Agriculture and Nutrition at Cornell University. TARINA is funded by a grant from the Bill and Melinda Gates Foundation (# OPP1137807).
Supplemental Material
Supplemental material for this article is available online.
Notes
References
Supplementary Material
Please find the following supplemental material available below.
For Open Access articles published under a Creative Commons License, all supplemental material carries the same license as the article it is associated with.
For non-Open Access articles published, all supplemental material carries a non-exclusive license, and permission requests for re-use of supplemental material or any part of supplemental material shall be sent directly to the copyright owner as specified in the copyright notice associated with the article.