
Abstract
Background:
Despite a reduction of child mortality in low-income countries, acutely ill undernourished children still have an elevated risk of death. Those at highest risk are children with severe acute malnutrition (SAM) who often show metabolic dysregulation that remains poorly understood.
Objective:
We performed a pilot study to examine changes in urinary organic acids during nutritional rehabilitation of children with SAM, and to identify metabolites associated with the presence of edema or with mortality.
Methods:
This study included 76 children aged between 6 and 60 months, hospitalized for SAM at the Moyo Nutritional Rehabilitation and Research Unit in Blantyre, Malawi. Urine was collected at admission and 3 days after clinical stabilization and metabolomics were performed using gas chromatography–mass spectrometry. Metabolite concentrations were evaluated with both uni- and multivariate approaches.
Results:
Most metabolites increased 3 days after clinical stabilization, and total urinary concentration changed from 1.2 mM (interquartile range [IQR], 0.78-1.7) at admission to 3.8 mM (IQR, 2.1-6.6) after stabilization (P < .0001). In particular, 6 metabolites showed increases: 3-hydroxybutyric, 4-hydroxyhippuric, p-hydroxyphenylacetic, oxoglutaric, succinic, and lactic acids. Urinary creatinine was low at both time points, but levels did increase from 0.63 mM (IQR, 0.2-1.2) to 2.6 mM (IQR,1.6-4.4; P < .0001). No differences in urinary profiles were found between children who died versus those who survived, nor between children with severe wasting or edematous SAM.
Conclusions:
Total urinary metabolites and creatinine increase after stabilization and may reflect partial recovery of overall metabolism linked to refeeding. The use of urinary metabolites for risk assessment should be furthered explored.
Trial registration:
TranSAM study (ISRCTN13916953).
Keywords
Introduction
Malnutrition directly or indirectly accounts for an estimated 3.1 million child deaths annually. 1 Severe acute malnutrition (SAM) manifests as severe wasting, edematous malnutrition, or a combination of these phenotypes. 1,2 Per the Community-Based Management of Acute Malnutrition Guidelines, only children with SAM and medical complications or appetite loss are admitted to hospital for clinical management which involves a stabilization phase followed by a rehabilitation phase. 3 -5 Mortality still remains between 10% and 35% in nutritional rehabilitation units that follow guidelines established by the World Health Organization (WHO). 4,6 -8 Furthermore, postdischarge mortality risk is high 9 ; in Malawi, an estimated 20% of children admitted for inpatient treatment of SAM die within the first year after leaving hospital, 10 with a large proportion of surviving children showing restricted linear growth and experiencing relapses of SAM. 10
Severe acute malnutrition is associated with signs of disturbed metabolism including electrolyte disturbances, increased oxidative stress, hepatic steatosis, hypoalbuminemia, hypoglycemia, and macronutrient malabsorption. 11 -15 With novel metabolomic approaches, hundreds of metabolites in biological fluids can be quantified to identify dysregulations of specific metabolic pathways and possibly lead to novel biomarkers that can help identify children with SAM at risk of poor clinical outcome. To date, a limited number of studies have examined the metabolite profiles of children with SAM. 11,16 -21 In serum, several circulating metabolites are reduced including phosphopholipids, acylcarnitines and amino acids such as tryptophan. 11,17,18 A study by Bartz et al 11 showed that children with SAM discharged to outpatient rehabilitation programs still showed differences in their plasma fatty acids, amino acids, and acylcarnitines. 11 These results suggest that dysregulation of metabolism and energy production in SAM patients can persist and metabolomics could reveal changes associated with poor recovery or mortality. 11,18,22
Metabolomics can detect more than 400 different metabolites in urine with techniques such as gas chromatography–mass spectrometry (GC-MS). 23 In contrast to blood sampling, urine collection is low-cost, noninvasive, and does not require trained professionals, making urine an ideal biofluid for clinical use. Water-soluble urine metabolites are filtered out of the blood by the kidneys and include breakdown products of food, drugs, environmental contaminants, and bacterial waste. 23
To our knowledge, only 2 studies have focused on analyzing metabolic profiles in urine of children with SAM. Terán-García et al 19 studied 39 children and showed that several metabolites including lactic and succinic acid were elevated in the acute phase of SAM. However, this study was conducted prior to WHO recommended changes in management strategies where children presenting with only SAM, that is, without other complicating comorbidities, are to be treated through outpatient programs. 3,5 Therefore, the population studied differs from current inpatients being treated for SAM. More recently, Farràs et al conducted a metabolomics study examining 20 children hospitalized for SAM in Zambia. 20 They found that urine metabolites related to microbial byproducts, and energy and muscle metabolism were associated with indicators of environmental enteric dysfunction. 20
Our study aimed to describe how urine metabolites of children with SAM change from hospital admission to 3 days after clinical stabilization. Secondary objectives were to identify urine metabolites associated with edema status or mortality in children with SAM.
Methods
Reporting of this observational study follows the STROBE Statement. 24 Informed consent was obtained from legal guardians and the project was approved by the College of Medicine Research Ethics Committee of the University of Malawi in Blantyre, Malawi, and the Research Ethics Board of the Hospital for Sick Children in Toronto, Canada.
This metabolomic study was conducted within the framework of TranSAM (ISRCTN13916953), a double-blind randomized controlled trial done to compare 3 isocaloric recovery formulations given to the children after stabilization. 25 Inpatients recruited for TranSAM were between 6 and 60 months of age and met the 2006 WHO criteria for SAM: (1) a mid-upper arm circumference (MUAC) of less than 115 mm; (2) a weight-for-height Z-score below 3 standard deviations (SDs) from the median WHO growth standards; and/or (3) the presence of nutritional bilateral pitting edema. 2 Exclusion criteria were admission to a nutritional rehabilitation unit in the previous year, hemodynamic instability, hematocrit equal to or less than 15%, severe neurological symptoms (eg, convulsions or loss of consciousness). Participants who absconded (n = 4), had unknown HIV status (n = 1), or provided insufficient urine at either time points (n = 5) were excluded. Metabolomic analysis was conducted in the 76 children. Clinical and anthropometric data were recorded daily. Children with mixed SAM phenotypes (ie, severe wasting with edema, n = 5) were categorized as having edema.
Urine Collection and Metabolite Measurements
Samples were obtained using infant urine collection bags in the first 24 hours of hospital admission and again 3 days after clinical stabilization as defined by WHO criteria. 26 Collection bags were placed in the morning and checked every hour. Once urine was obtained, it was stored immediately at −80°C until further analysis. Samples were discarded if visibly contaminated by stool.
The Metabolomics Innovation Centre in Edmonton, Canada, analyzed the urine samples using GC-MS. For this, 1 mL of sample was incubated with 200 μL of methoxylamine hydrochloride (75 g/L) at 60°C for 30 minutes and 3 drops of 6 M HCl were added until pH was 1.0 or below. The mixture was extracted twice, first with 3 mL of ethyl acetate and then with 3 mL of diethyl ether. The obtained supernatants were combined and incubated at 37°C under nitrogen for complete evaporation and the residue dissolved in 40 μL of hexane and 30 μL of N, O-Bis(trimethylsilyl)trifluoroacetamide (BSTFA). The mixture was then incubated at 60° to 90°C for 10 minutes after which the BSTFA-supplemented extract was placed into a GC-MS autosampler vial. Derivatized organic acids were analyzed using an Agilent 5890 Series II GC-MS operating in electron impact ionization mode. A 2 µL aliquot was injected with a splitless ratio onto a 30 m by 0.25 mm by 0.25 µm DB-5 column (Agilent Technologies, Palo Alto, USA). The injector port temperature was held at 250°C and the helium carrier gas flow rate was set to 1 mL per minute at an initial oven temperature of 70°C which was then increased at 6°C per minute to 310°C for a final run time of 54 minutes. Supplemental Table A.1 lists all metabolites measured in at least one sample (n = 56). Creatinine was quantified independently with a liquid chromatography–mass spectrometry kit assay.
Statistical Analysis
Anthropometric Z-scores (ie, length-for-age, weight-for-age, and weight-for-length) were calculated with the WHO igrowup package (http://www.who.int/childgrowth/software/en/). To compare nominal variables, Fisher exact test was used and 2-way analysis of variance for continuous variables. As recommended for targeted metabolomics, 27 metabolites were filtered out if below the limit of detection (LOD) in more than 40% of samples at both time points. In the metabolites kept for analysis, values below the detection threshold were set to half of the LOD. We used principal component analysis to assess sample outliers, but none were identified.
Creatinine is routinely used to adjust metabolites for overall variation in urine concentration, but measured levels in our population were too low (ie, 88% of admission and 51% of stabilization samples were below the recommended 30 mg/dL cutoff for use in normalization procedures). 28 Normalization methods based on total metabolites were evaluated, but quantile normalization was chosen to correct for differences in overall urine concentration as suggested by Emwas et al. 29 This was done using the preprocessCore R package. 30 Negative binomial models with mixed effects were used to evaluate differences in both raw and normalized metabolite concentrations between children at admission and 3 days after stabilization while adjusting for age, sex, and HIV status with a random intercept to account for repeated measures within children. Associations between metabolites and mortality or edema status were also tested. All P values were adjusted with Benjamini and Hochberg false discovery rate correction to account for multiple comparisons.
Sparse multilevel partial least square discriminant analysis (PLS-DA) was used to evaluate differences in overall metabolite patterns between time points in children with available samples both at admission and 3 days after stabilization, (n = 37). For this, quantile normalized values were adjusted for age, sex, and HIV, and then pareto-scaled. Using the mixOmics package, 31 metabolite profiles were analyzed with sparse PLS-DA with 5 fold cross-validation and time point included as a multilevel factor to account for repeated measures. Feature stability was assessed through internal 5-fold cross-validation (ie, the data were subdivided into 5 parts and the analysis serially repeated using 4 of the 5 subsets). For each of these subanalysis, the top 10 metabolites that most robustly discriminated between time points were selected. Variables with correlation values of at least 0.6 with PLS-component 1 and selected as top 10 at least 90% of the time across the subanalysis were considered the most robust and stable features that best discriminate between time points. Classification error rate based on maximum distance, area under the receiver operating characteristic curve, R2, and Q2 values were used to assess discriminative power. R2 indicates the variance explained by the PLS-component while Q2 is a qualitative measure obtained by cross-validation that captures the consistency between the predicted and original data. Negative Q2 values indicate that the component is not predictive; while no critical threshold is established to attest significance, empirical values of at least 0.4 are deemed of acceptable predictive value for biological models. 32 All statistical analysis was performed in R (version 3.4.0; R Core Team, 2017). 33
Results
Characteristics of Participants at Admission
Admission characteristics of the 76 children hospitalized for SAM are presented in Table 1. The female to male ratio was around 50%, but the prevalence of edema was high at 66%, and 36% of children were reactive to rapid HIV antibody testing. Ten children died during their hospital stay and at admission had a lower prevalence of edema, were younger, and had lower anthropometric measurements including MUAC, weight-for-age, and weight-for-length Z-scores. Compared to survivors, children who died did not differ in their prevalence of HIV reactivity or length-for-age Z-scores.
Characteristics at Admission of Children Hospitalized for Severe Acute Malnutrition.a
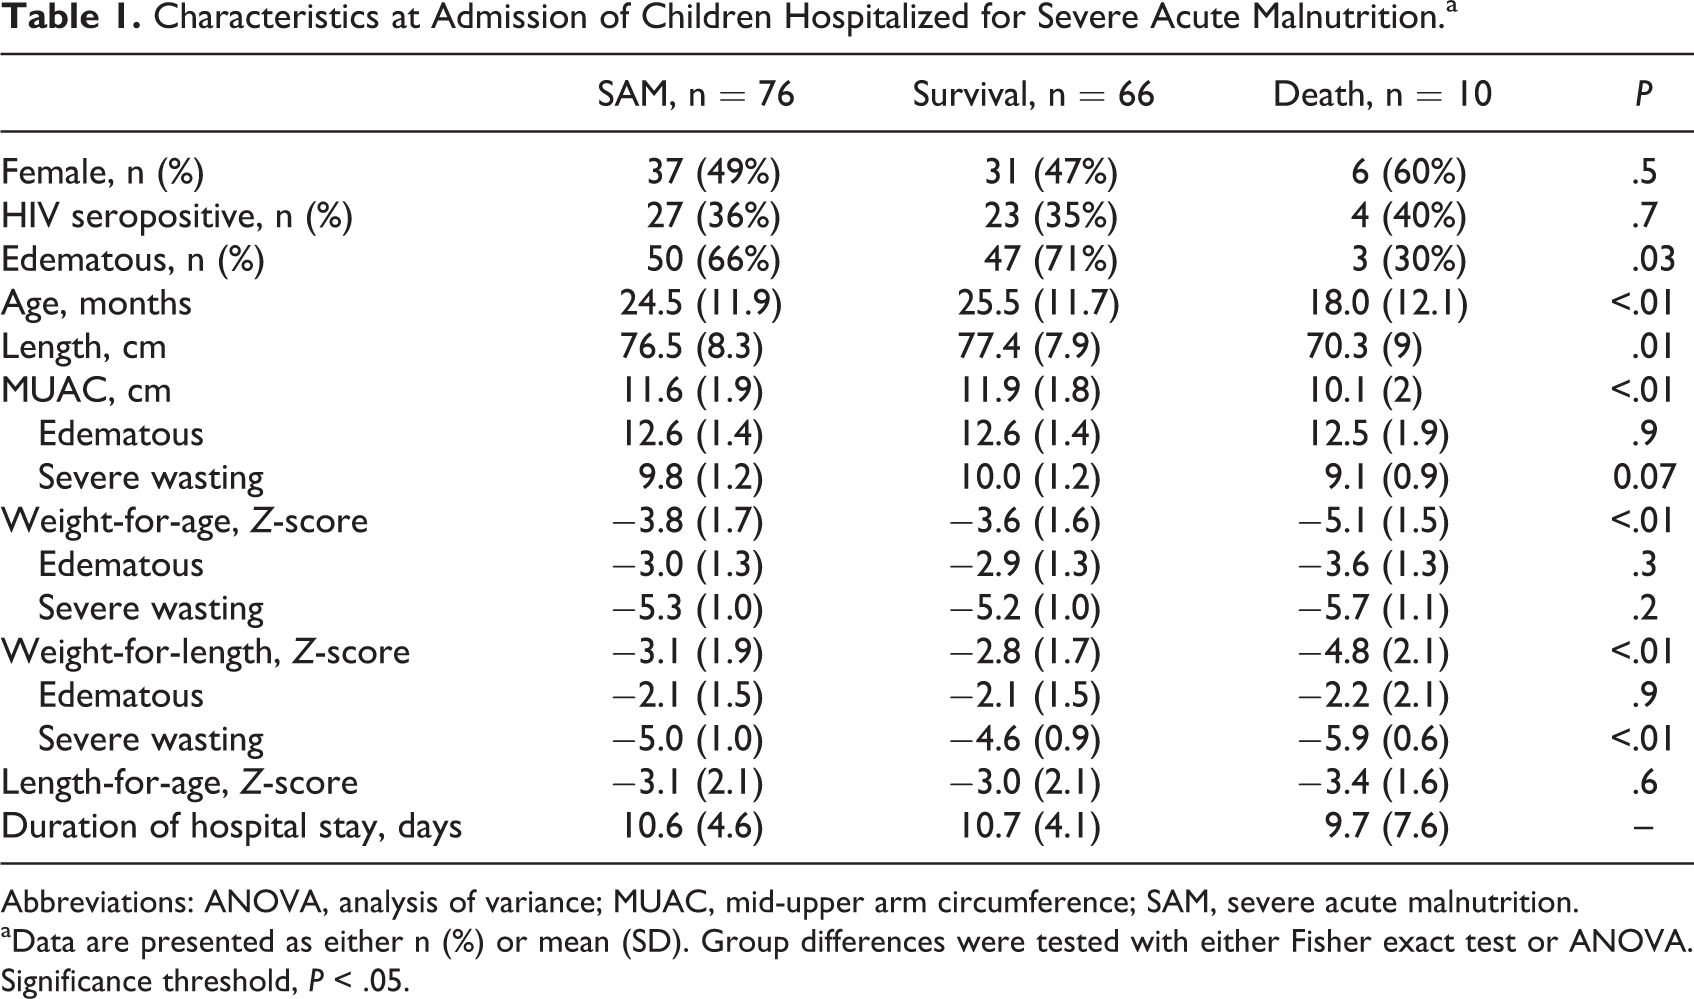
Abbreviations: ANOVA, analysis of variance; MUAC, mid-upper arm circumference; SAM, severe acute malnutrition.
aData are presented as either n (%) or mean (SD). Group differences were tested with either Fisher exact test or ANOVA. Significance threshold, P < .05.
Concentrations of Urinary Metabolites Increase Between Admission and 3 Days After Stabilization
From the cohort of 76 children, urine samples were collected at admission in 63 children including those from the 10 death cases, and in 50 children 3 days after stabilization. Of these, 37 children had samples at both time points. All urinary metabolites detected by GC-MS in at least one sample at either time point (n = 56) are presented in Supplemental Table A.1. Twenty passed the detection threshold (ie, were above the LOD in at least 60% of samples at either admission or after stabilization). Metabolite concentrations at both time points are presented in Figure 1 and Table 2. The total urinary concentration increased from 1.2 mM (interquartile range [IQR], 0.78-1.7) at admission to 3.8 mM (IQR, 2.1-6.6) after stabilization (P < .0001; Figure 2 and Table 2). All detected metabolites increased but specifically higher levels were seen for 3-hydroxybutyric acid, 4-hydroxyhippuric acid, lactic acid, oxoglutaric acid, p-hydroxyphenylacetic acid, and succinic acid (Table 2).
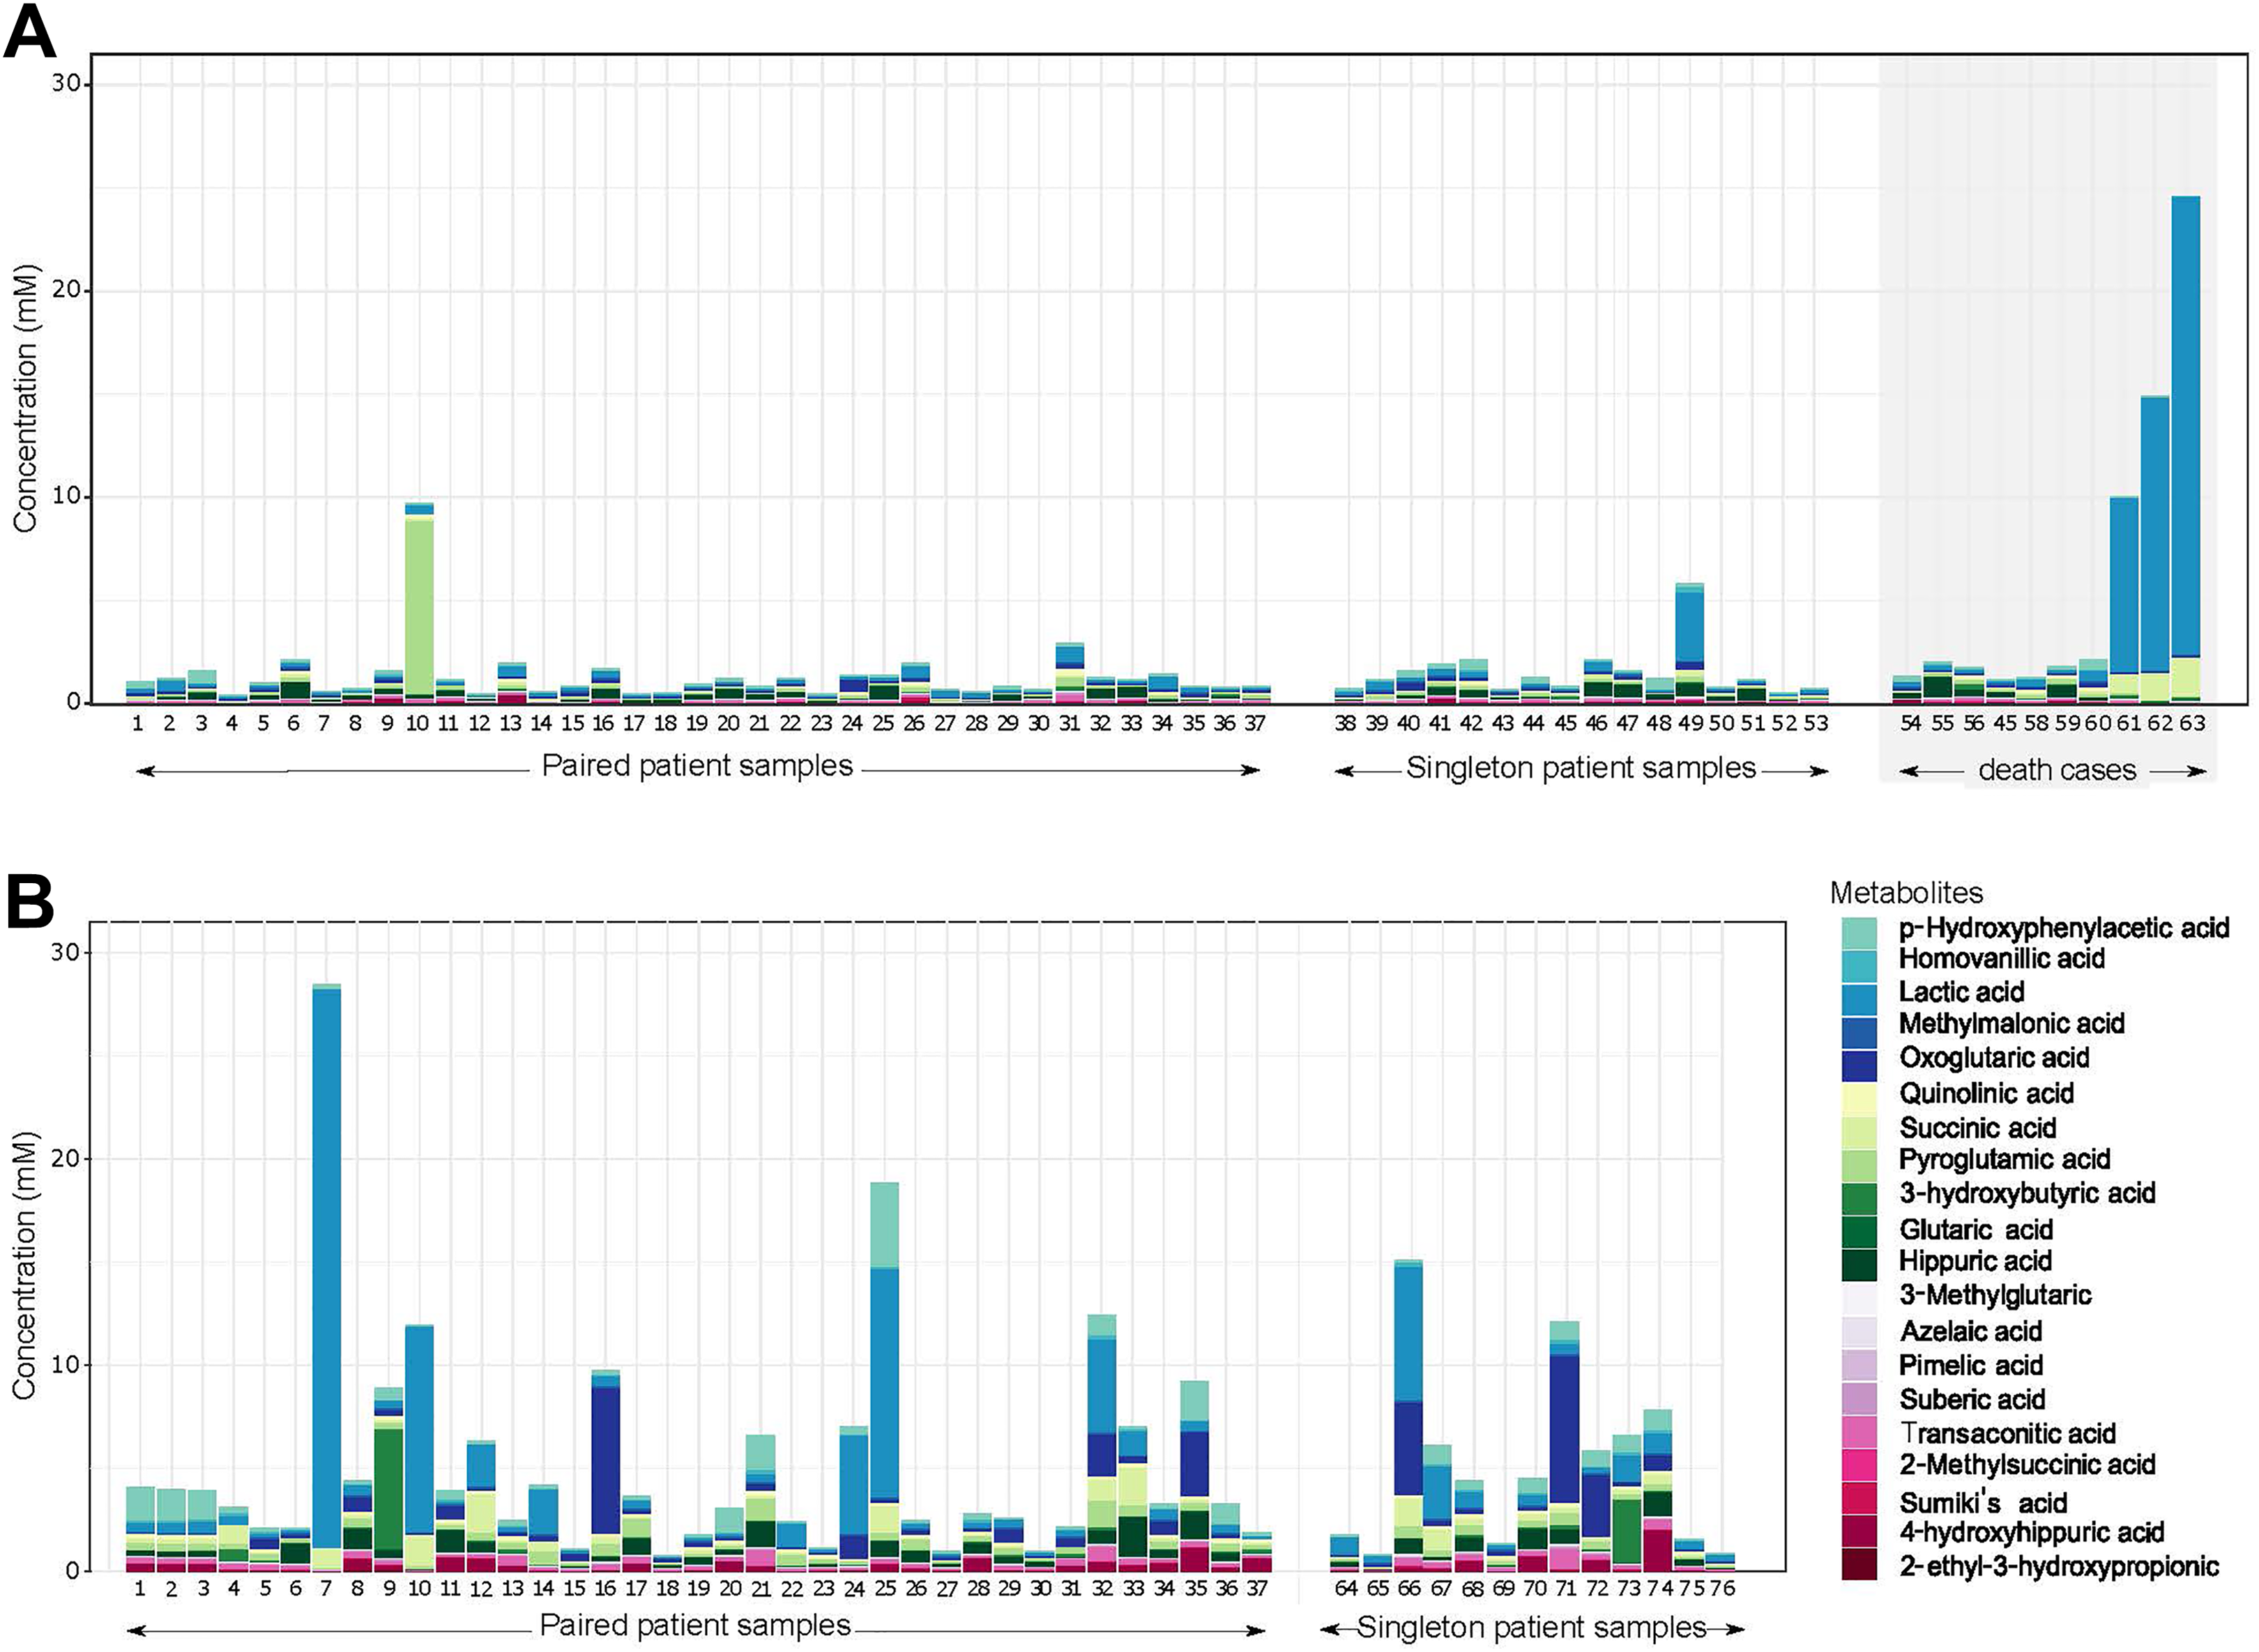
Stacked barplots representing urinary metabolite concentrations at (A) admission and (B) 3 days after stabilization. The patients with paired samples (n = 37) had sufficient urine collected both at admission and after stabilization; singleton patient samples indicate cases with only one sample collected at either admission or 3 days after stabilization. The grey shadow box indicates urinary metabolite profiles from children hospitalized for SAM who died. Colors in stacked bars refer to specific metabolite concentrations as depicted in the legend. SAM indicates severe acute malnutrition.
Metabolite Differences in Urine of Children With SAM Between Hospital Admission and 3 Days After Clinical Stabilization.a
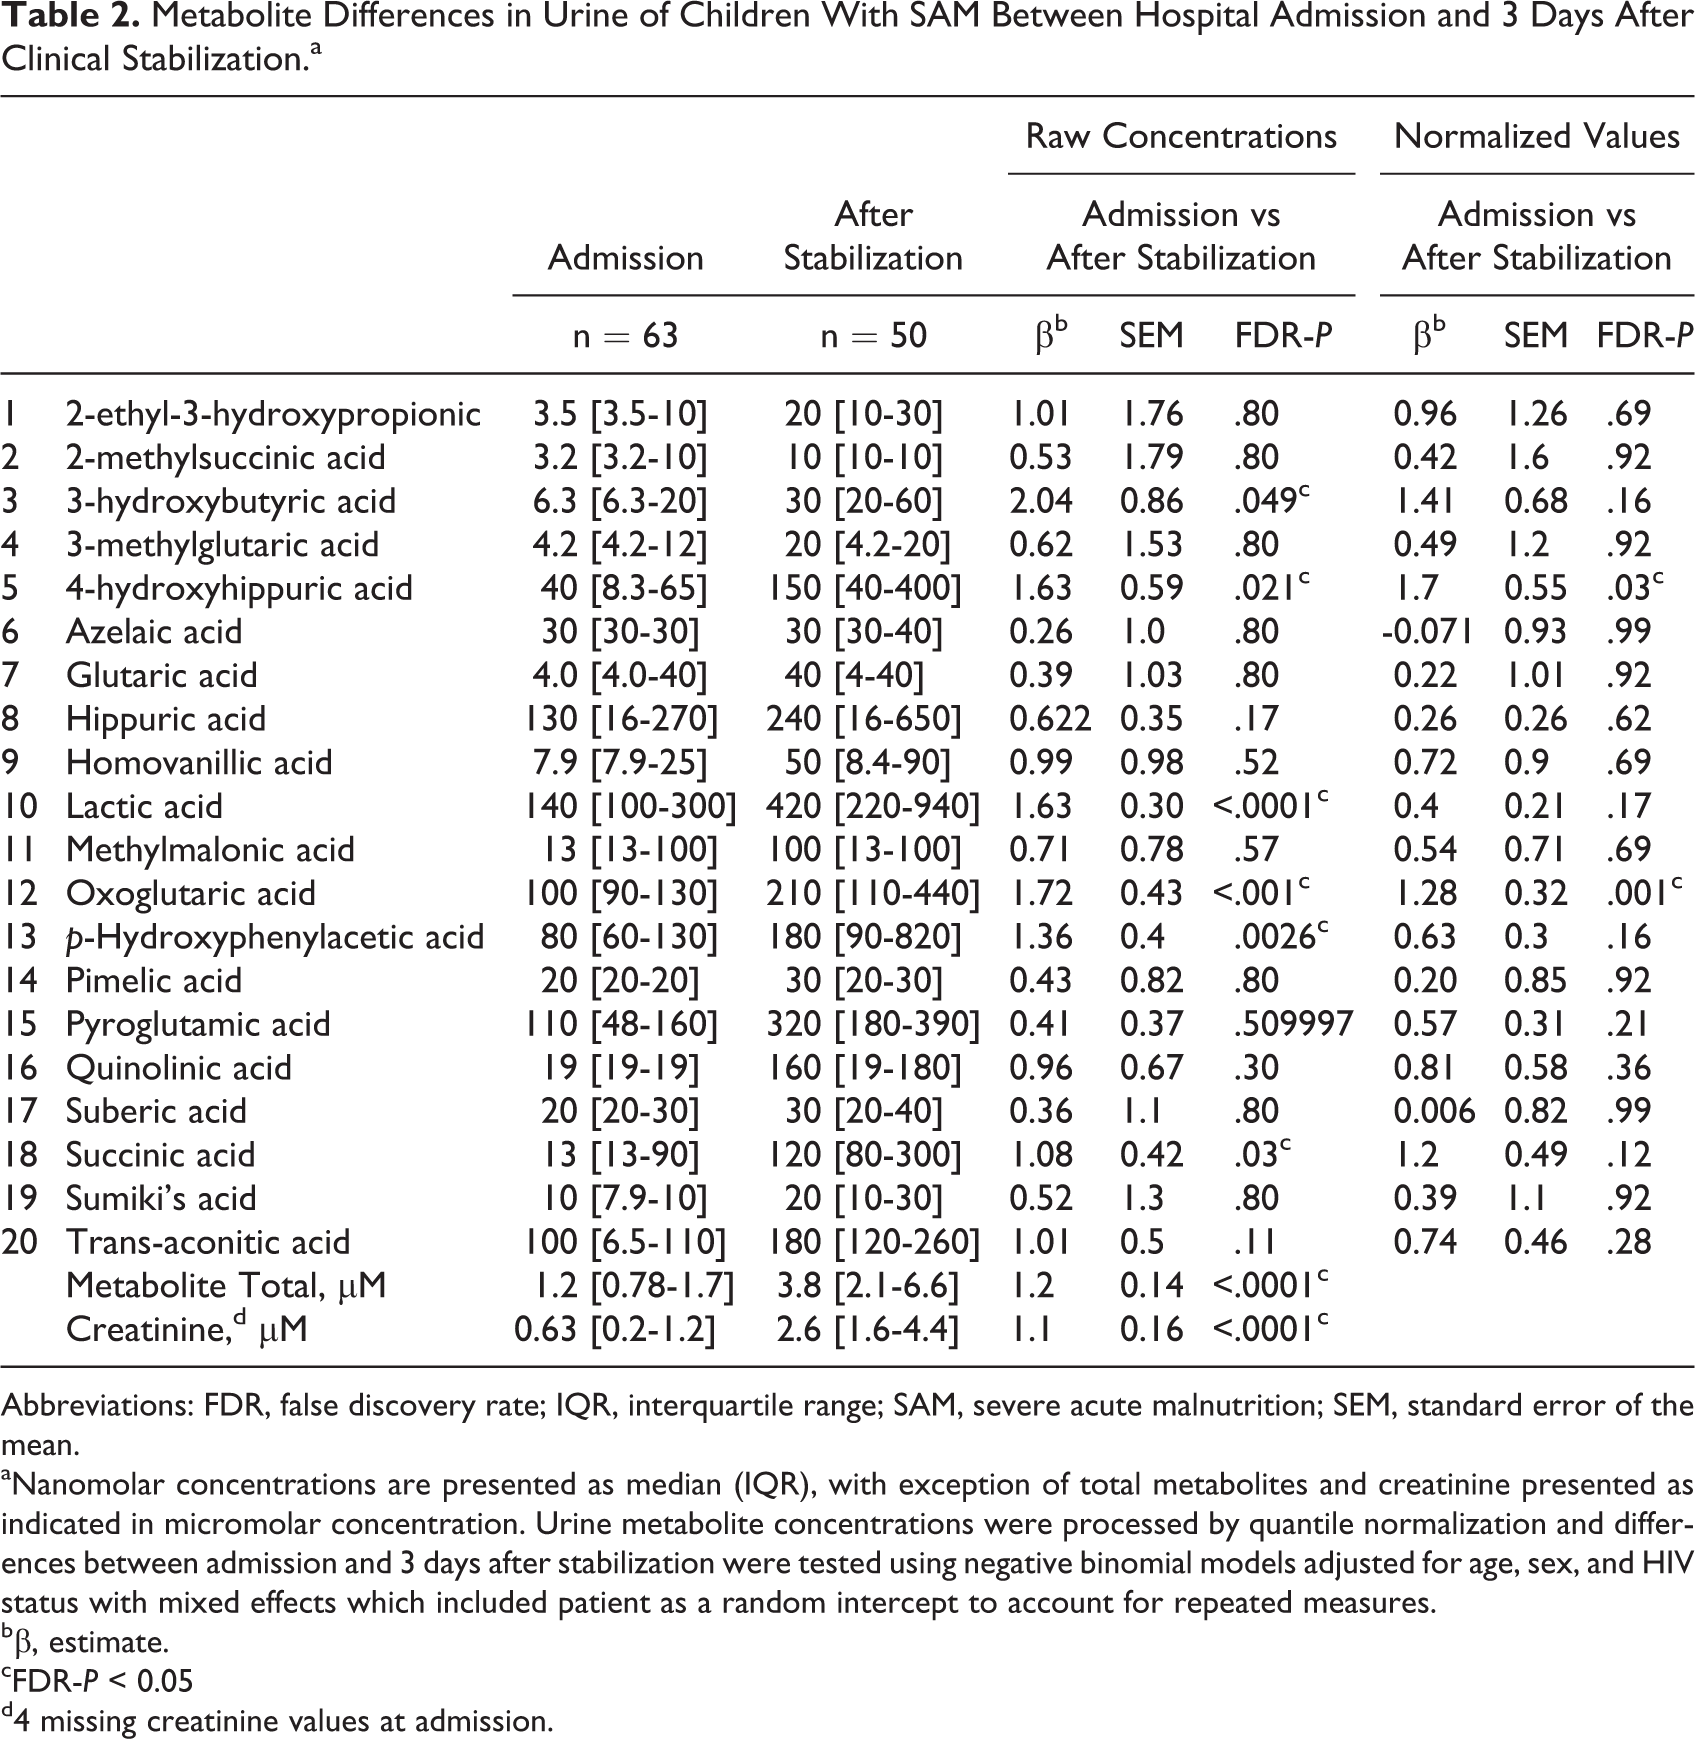
Abbreviations: FDR, false discovery rate; IQR, interquartile range; SAM, severe acute malnutrition; SEM, standard error of the mean.
aNanomolar concentrations are presented as median (IQR), with exception of total metabolites and creatinine presented as indicated in micromolar concentration. Urine metabolite concentrations were processed by quantile normalization and differences between admission and 3 days after stabilization were tested using negative binomial models adjusted for age, sex, and HIV status with mixed effects which included patient as a random intercept to account for repeated measures.
bβ, estimate.
cFDR-P < 0.05
d4 missing creatinine values at admission.
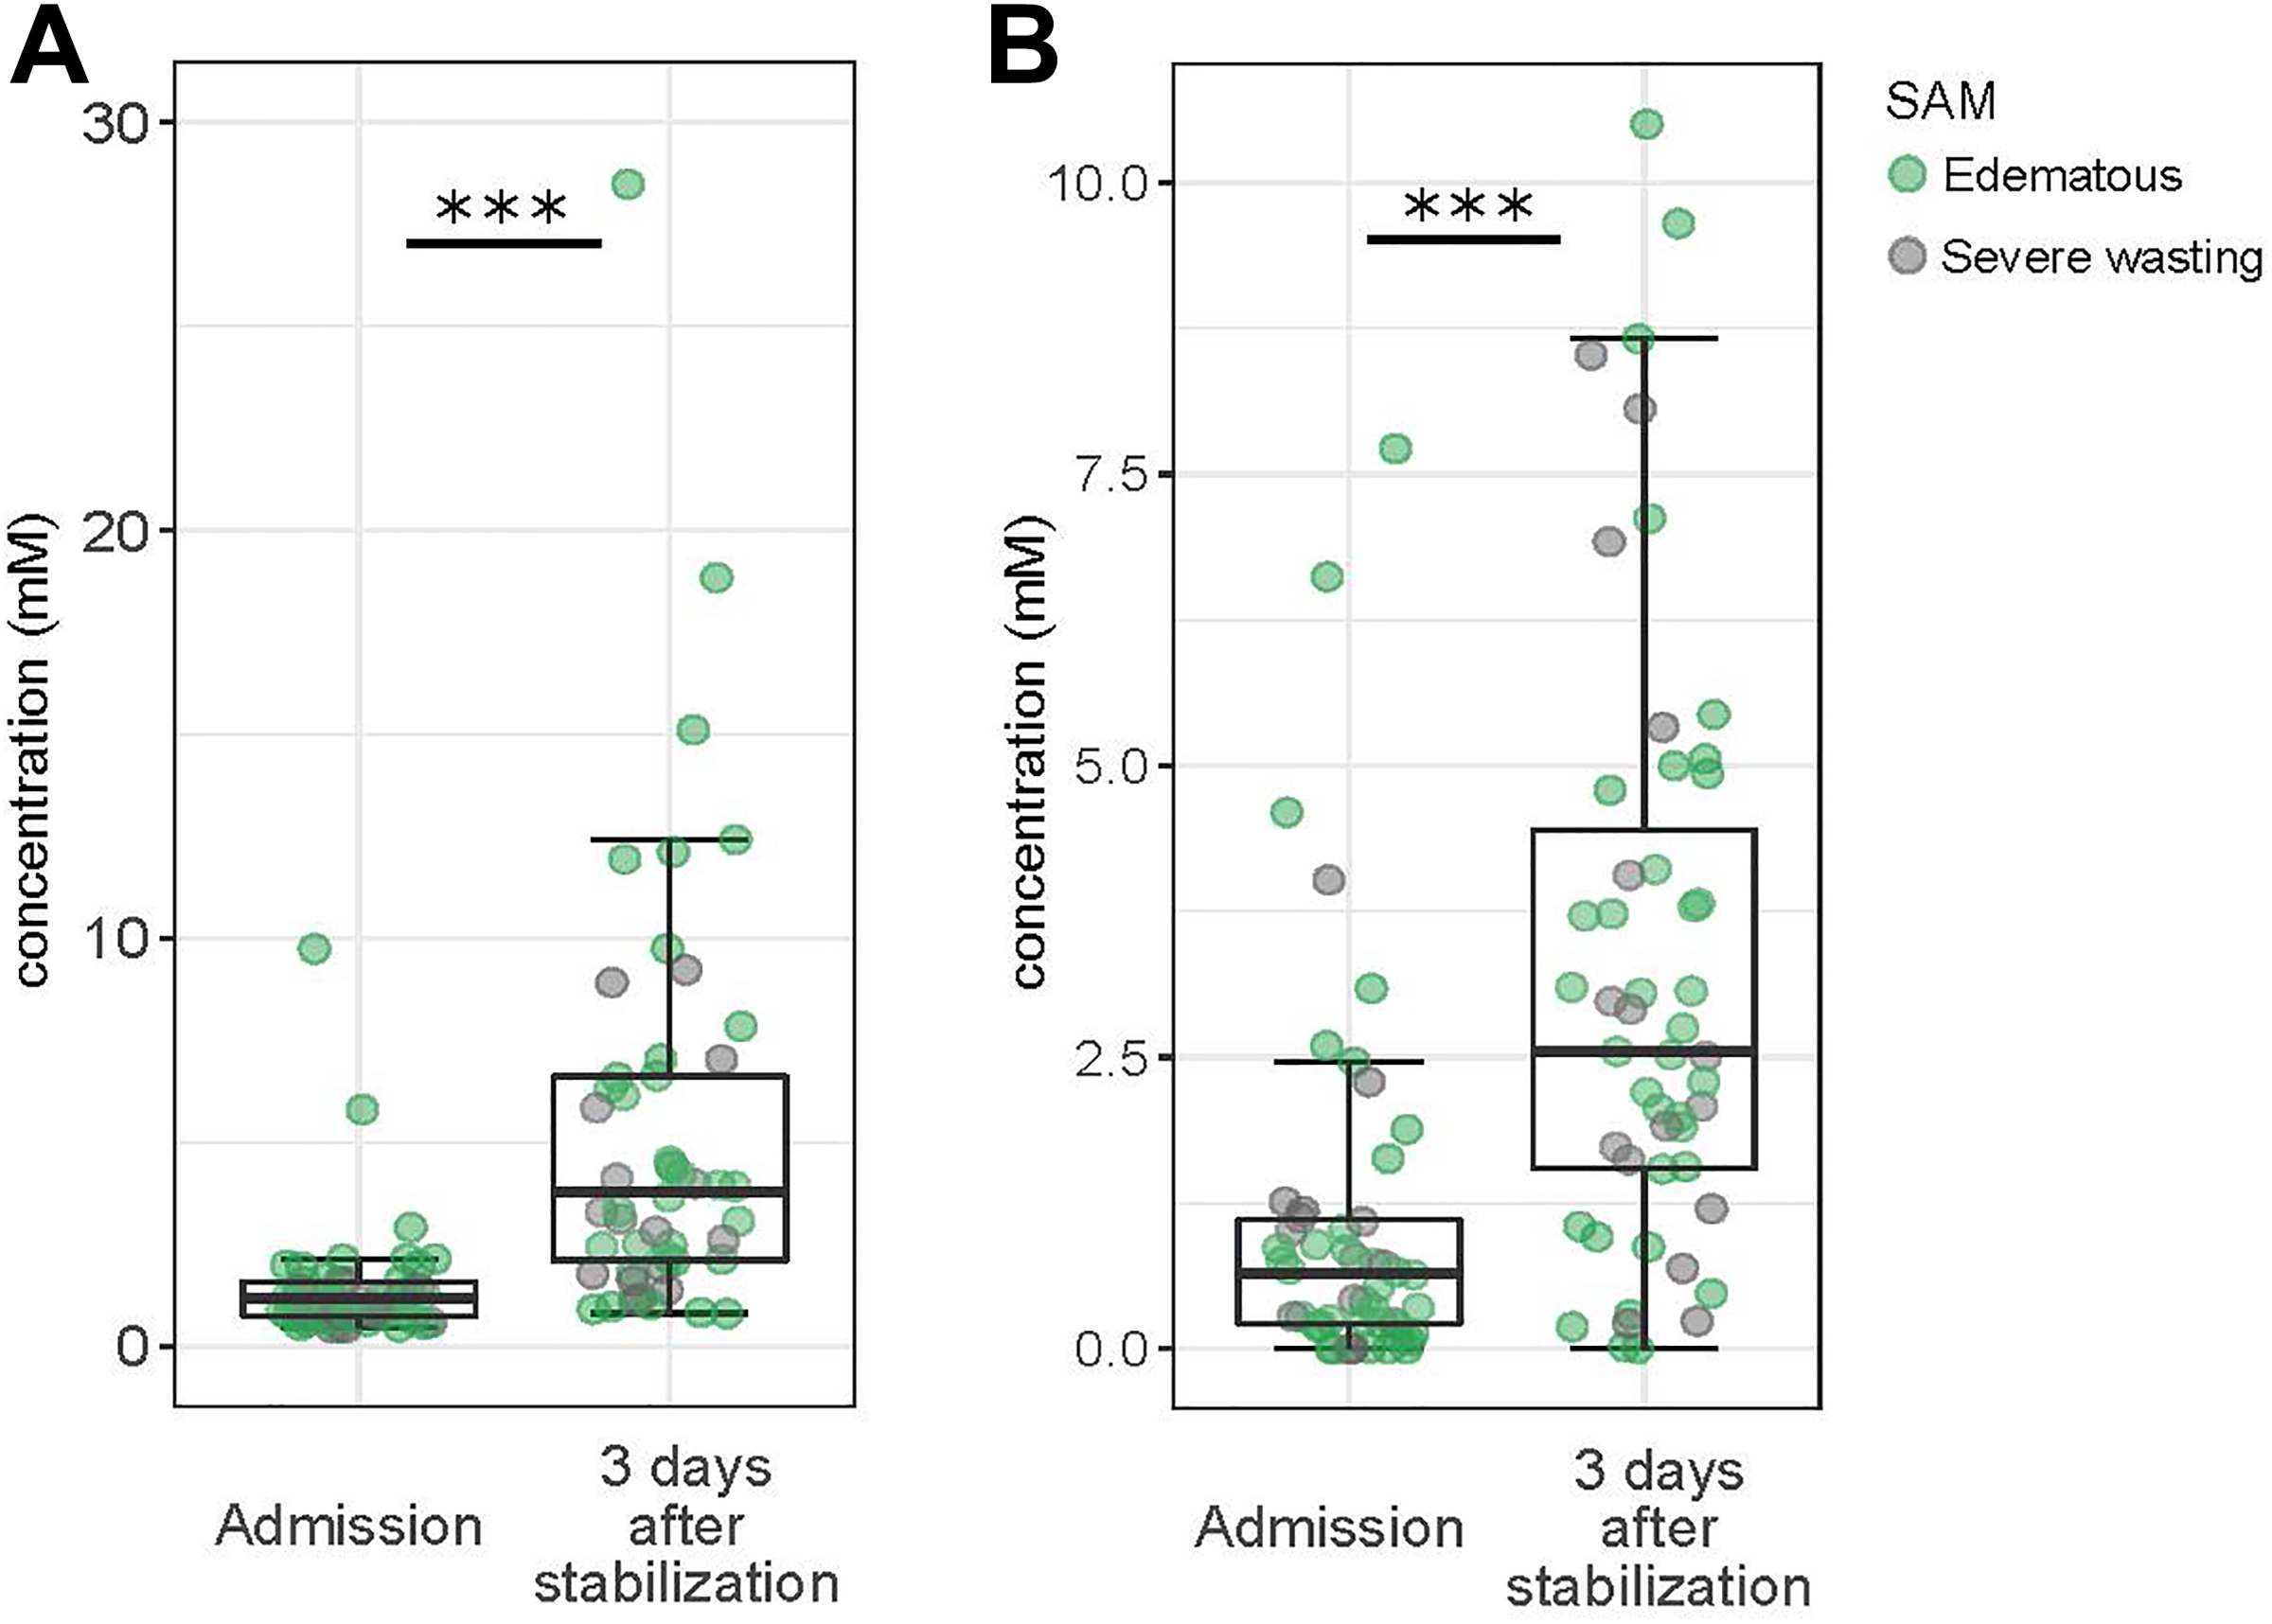
Boxplots showing differences between admission and 3 days after stabilization in urine metabolites (A) total metabolites, and (B) creatinine. Overlaid dots are data points of specific individuals, and their color codes for the phenotype of SAM of that individual as depicted by the legend. SAM indicates severe acute malnutrition.
Creatinine was very low in children hospitalized with SAM, especially at admission, although levels did increase between admission and after stabilization from 0.63 mM (IQR, 0.2-1.2) to 2.6 mM (IQR, 1.6-4.4; P < .0001; Figure 2 and Table 2). Creatinine levels were, as expected, higher in males but not associated with age, HIV status, edema, mortality, or other anthropometric indices.
To compare differences in organic acid profiles between admission and after stabilization that would be independent of the generalized increase in urine concentration, we tested differences between time points using quantile normalized values (Table 2). Two metabolites were increased after stabilization: 4-hydroxyhippuric acid, a microbiota derivative, and oxoglutaric acid, a keto acid involved in regulatory function of the tricarboxylic acid (TCA) cycle.
Sparse PLS-DA was conducted in 37 children with samples at both time points and showed that urine taken at admission versus after stabilization could be distinguished (Supplemental Figure A.1). Partial least square-variate 1 explained 42% of the variance in metabolites had a classification error rate-based on maximum distance of 9.2%, had a mean area under the ROC curve across folds of 0.96 (SD = 0.3, P value < .0001), and a Q2 value of 0.68; all suggesting discriminative power. However, even after computational normalization, all metabolites positively correlated with PLS-component 1 and detected as being increased between admission and after stabilization (Supplemental Table A.2).
Urinary Metabolites Between Children Who Died Versus Survived and Between Children With Different Phenotypes of SAM
We did not find any significant differences in urinary profiles of organic acids between children who died versus those who survived nor between children with severe wasting or edematous SAM, but numbers were small for these subgroup analyses. However, mortality was associated with higher total urinary metabolite concentration at admission of 1.9 mM (IQR, 1.5-8.1) compared to survivors with 1.2 mM (IQR, 0.7-1.6; <.0001; Supplemental Table A.3), but this was mostly driven by high levels of lactic acid in 3 death cases with severe wasting (Supplemental Figure A.1).
Discussion
This study is the largest to date evaluating urine metabolic profiles serially in acutely ill children with SAM. A total of 20 urinary organic acids were detected in at least 60% of samples at either admission or 3 days after clinical stabilization in children with SAM. The overall urinary metabolite concentration increased between admission and after stabilization. Creatinine concentration was also significantly higher 3 days after stabilization.
The overall increase in urinary metabolites most likely reflects partial restoration of metabolic function due to refeeding during nutritional rehabilitation. Several circulating metabolites detected in serum or plasma, such as amino acids and nutrient transport proteins, are also increased in children with SAM following nutritional rehabilitation, and the higher levels of blood metabolites would be reflected in urinary output. 11,18,34 Other physiological changes that may explain the increase in urinary metabolite concentration are shifts in renal function or changes in hydration status.
In our study population, particularly at admission, creatinine was low or undetectable which likely reflects both low muscle mass and low baseline muscle metabolic activity. 35 -37 The median urinary creatinine levels after stabilization were lower than those previously reported in children with edematous SAM. 38 Increased creatinine after stabilization could be linked to reinstated muscle metabolism, as significant muscle gain is not expected in the time frame of our study.
Two individual metabolites showed marked increases during nutritional rehabilitation. The first was 4-hydroxyhippuric acid, a by-product of metabolism of polyphenols which could indicate an increase in microflora activity related to the refeeding. 39 The other was oxoglutaric acid, a ketone derivative of glutaric acid that functions as an important intermediate of the TCA cycle. 40 Hepatic mitochondrial dysfunction and defects in the TCA cycle has been reported in an animal model of severe acute malnutrition as well as in severely malnourished children. 15,41 -43 As seen in the study by Terán-García et al, 19 lactic and succinic acid were increased between time points but marked increases were seen in specific patients, including 3 out of the 10 death cases which suggests that mitochondrial dysfunction could play a role in the mortality of some children with SAM. After normalization, overall differences in lactic and succinic acids were only trends after correction for multiple comparison. Further, exploring the role of mitochondrial function adverse outcomes of ill malnourished children seems relevant in particular as interventions may be available to improve mitochondrial function during a critical illness in these children. In an animal model of SAM, we demonstrated that stimulating mitochondrial function by treating animals with fibrates improved hepatic metabolic function. 41
There were no significant differences in specific metabolites between children with severe wasting versus edematous SAM, but this finding is likely limited by our sample size. Children who died had higher total concentration of metabolites at admission compared to those who survived, but this was, as mentioned, mostly driven by high lactic in 3 children with severe wasting who died. These 3 children presented with watery diarrhea and vomiting; their diarrhea persisted and all 3 developed a fever within 3 to 5 days of admission. Studies in critically ill adults and pediatric patients have shown a strong relation between elevated plasma levels of lactic acid and mortality 44 -48 linked to sepsis-related tissue hypoxia. 22 These 3 mortality cases may have represented a specific subset of children who succumbed to sepsis. However, similar patterns of high lactic acid are also seen in some survivors 3 days after stabilization, thus, increased lactic acid may also reflect a critical transitional phase in metabolism and may not necessarily be a marker for poor outcome.
Limitations and Lessons Learned
This pilot study has several limitations. Although being one of the largest metabolomics studies done in children with SAM, the ability to conduct comparative analyses was limited by the sample size. For example, it was not possible to understand if specific metabolic pathways were impaired in children who died versus those who survived inpatient treatment. A larger cohort would be needed to determine if the high lactic acid pattern is associated with a specific subset of sepsis-related cases of mortality. Furthermore, we did not detect differences in urinary metabolites between children with severe wasting and edematous SAM which departs from reported differences shown in blood by other metabolomics studies. 18
We were unable to compare urine obtained from nonhospitalized children with SAM and/or nonmalnourished community controls. Thus, we cannot assess the deviance from normal metabolite values; nor can we establish whether stabilized children with SAM have achieved a urinary profile suggestive of metabolic recovery. As outlined by WHO guidelines, discharge criteria for children with SAM are not based on high-quality evidence, and post-discharge mortality has been reported to be high. 3,9,10 Urinary metabolites could be further evaluated as potential markers for recovery in the effort to establish more robust hospital discharge standards for children with SAM.
Although low-cost and noninvasive, urine collection in young children is challenging in low resource setting. Samples were only successfully obtained at both time points in 70% of patients who survived until 3 days after clinical stabilization. Missed sampling was mainly due to shortages of research staff and the difficulties of collecting urine in young, ill and often dehydrated children with SAM.
Furthermore, we did not investigate changes in renal function which could account for shifts in urinary metabolite profiles. In our low-resource setting, 24-hour urine collection for assessment of glomerular and tubular function would have been difficult, even if done only for research purposes. In future studies, we would recommend 24-hour urine collection, as this could validate a time point sampling method and take into account the renal function and hydration status of the children. Moreover, creatinine was so low in children with SAM that it prevented the use of standard metabolites to creatinine ratios to correct for differences in urinary concentrations. Since, other physiological measures were not available to use for normalization, we implemented alternative computational approaches which can sometimes outperform standard physiological normalization (Emwas et al, 2018).
First, we performed normalization based on total metabolites but found this to introduce bias due to cases where overall metabolite profiles were dominated by a particular metabolite, for example, lactic acid. Thus, total sum metabolite correction or range-scale transformations resulted in unphysiological relationships between metabolites and lactic acid. Instead, we used quantile normalization, a ranked-based method, which performed better but still presented challenges due to the high number of values under detection threshold, particularly at admission. This resulted in suboptimal computational normalization and thus the concentration differences between admission and 3 days after stabilization still accounted for the largest variance in metabolites as illustrated by results from supervised multivariate PLS-DA.
Lastly, only a limited panel of 20 metabolites were detected in more than 60% of samples at either admission or after stabilization in children with SAM. This suggests that excreted levels of urinary metabolites are below standard detection ranges, especially at hospital admission. A more robust quantification could have been achieved with GC-MS if the sample volumes were larger and allowed for the use of protocols to concentrate the urine prior to analysis.
Conclusions
In summary, we compared urinary profiles at admission and 3 days after stabilization of children hospitalized for SAM. Total metabolite concentration, and several individual metabolites, were increased after clinical stabilization which may reflect physiological processes of recovery in children hospitalized with SAM and likely relate to metabolic changes induced by refeeding. Using urinary metabolites in children hospitalized with SAM as indicators of poor outcome and/or of recovery status before discharge would need to be further explored in a study designed to account for the caveats and considerations described in this pilot study.
Supplemental Material
Supplemental_material - Urinary Organic Acids Increase After Clinical Stabilization of Hospitalized Children With Severe Acute Malnutrition
Supplemental_material for Urinary Organic Acids Increase After Clinical Stabilization of Hospitalized Children With Severe Acute Malnutrition by Allison I. Daniel, Matilda E. Arvidsson Kvissberg, Edward Senga, Christian J. Versloot, Philliness Prisca Harawa, Wieger Voskuijl, David Wishart, Rupasri Mandal, Robert Bandsma and Céline Bourdon in Food and Nutrition Bulletin
Supplemental Material
Supplemental Material, Supplemental_Material_Urinary_organic_acids_increase_after_clinical_stabilization_of_hospitalized_children_with_severe_acute_malnutrition_Strobe_Checklist - Urinary Organic Acids Increase After Clinical Stabilization of Hospitalized Children With Severe Acute Malnutrition
Supplemental Material, Supplemental_Material_Urinary_organic_acids_increase_after_clinical_stabilization_of_hospitalized_children_with_severe_acute_malnutrition_Strobe_Checklist for Urinary Organic Acids Increase After Clinical Stabilization of Hospitalized Children With Severe Acute Malnutrition by Allison I. Daniel, Matilda E. Arvidsson Kvissberg, Edward Senga, Christian J. Versloot, Philliness Prisca Harawa, Wieger Voskuijl, David Wishart, Rupasri Mandal, Robert Bandsma and Céline Bourdon in Food and Nutrition Bulletin
Footnotes
Authors’ Note
Allison I. Daniel and Matilda E. Arvidsson Kvissberg are cofirst authors (equal contributions). R.B. and W.V. contributed to conception and design of the research. M.A.K., A.I.D., E.S., C.J.V., P.H., D.W., R.M., and C.B. contributed to acquisition, analysis, or interpretation. M.A.K., A.I.D., and C.B. drafted the manuscript. All authors critically revised the manuscript, agree to be fully accountable for ensuring the integrity and accuracy of the work, and read and approved the final manuscript.
Acknowledgments
Authors thank the hospital staff at the Moyo Nutritional Rehabilitation and Research Unit of the Queen Elizabeth Central Hospital in Blantyre, Malawi.
Declaration of Conflicting Interests
The author(s) declared no potential conflicts of interest with respect to the research, authorship, and/or publication of this article.
Funding
The author(s) disclosed receipt of the following financial support for the research, authorship, and/or publication of this article: The study was supported by the A.S.P.E.N. C. Richard Fleming/Foundation Project Grant awarded to Dr. Robert Bandsma. The funder had no role in the study design, analysis, or interpretation.
Supplemental Material
Supplemental material for this article is available online.
References
Supplementary Material
Please find the following supplemental material available below.
For Open Access articles published under a Creative Commons License, all supplemental material carries the same license as the article it is associated with.
For non-Open Access articles published, all supplemental material carries a non-exclusive license, and permission requests for re-use of supplemental material or any part of supplemental material shall be sent directly to the copyright owner as specified in the copyright notice associated with the article.