
Abstract
Background:
Indigenous foods, which contribute largely to the majority of the households' food basket in rural Tanzanian communities, have not been fully characterized or documented.
Objectives:
The study aimed to document foods available and consumed in Kilosa District, Tanzania, in an attempt to promote, revive use, and build evidence for sustainable utilization of the rich local biodiversity.
Methods:
Data were collected from 307 households in 3 agroecological zones in Kilosa District during the beginning of the rainy season (February-May) and immediately after harvest (September-October). A list of food items was generated, and 24-hour recall was performed. Descriptive statistics were calculated and a student t test statistic was used to compare the means of the Food Biodiversity Score between the agricultural seasons.
Results:
A total of 183 edible food items were reported by households with more reported in the rainy season (n = 82) compared to harvest season (n = 64). The mean number of food items consumed per day during the rainy season was 4.7 (95% CI: 4.5-5.0) compared to 5.9 (95% CI: 5.7-6.1) during harvest season. About 50% of the households mentioned that wild edible foods were less accepted by household members.
Conclusion:
Despite the rich local food biodiversity, households relied on few food items which may be due to limited awareness and knowledge about the biodiversity of foods in the community. It is important to educate communities on the rich and affordable food base available locally to improve their food diversity, income, and nutritional status.
Introduction
Biodiversity is defined as the variability among living organisms from all sources, including terrestrial, marine, and other ecosystems and ecological complexes of which they are part; it covers diversity within species, between species, and of ecosystems. 1 Biodiversity can also be defined as the variety of life: the different plants, animals, and microorganisms, their genes and ecosystems of which are an integral part. 2
The relationship between biodiversity and ecosystem functioning has emerged during the last decade as a vigorous new research area linking community and ecosystem ecology. 3 Recently, biodiversity issues have arisen as one of the major concerns in food and nutrition. This implies a shift in the focus of nutrition interventions research from aspects dealing with single-based interventions such as single nutrient interventions, to a multidisciplinary focus where a combination of various factors in the environment is taken into consideration. The current emphasis on the use of biodiversity in nutrition improvement emphasizes the need for a more detailed understanding of the role of biodiversity in improving nutritional status and well-being. On the other hand, “the move focuses on the documentation of available species and their nutritional value.” It is argued that promotion of biodiversity will not only help in alleviating malnutrition but will also improve the income and the awareness among communities in conserving biodiversity.
Biodiversity offers a wide range of food systems that are important sources of micronutrients. However, these have been neglected due to changes in lifestyle and dietary patterns brought about by globalization and urbanization. 4 In addition, traditional knowledge is eroding due to shifting social values and nonparticipation of the younger generation in collection and processing of wild foods. 5 Loss of diverse genetic resources in the wild and domestic situations has been attributed to the loss of traditional and customary use of plants as well as changes in culinary tastes and habits. 6 This has resulted in the consumption of low-quality cheap foods that are high in energy and lack diversity. Consumption of low-quality diets has been associated with the occurrence of noncommunicable diseases and the associated comorbidities such as hypertension and heart diseases. 7 Diets low in fruits and vegetables and high in sodium have been reported to be the most common specific dietary risks for noncommunicable diseases. 7
Biodiversity is linked to dietary diversity where adequate diversity of the diet leads to proper childhood growth and development. Reduced dietary diversity has been shown as strong predictor of stunting in children. 8 Similarly, biodiversity has been shown to be positively and significantly related to nutrient adequate ratio and mean adequate ratio indicating a significant positive relationship between biodiversity of the household with dietary adequacy of the child’s diet. 9 Therefore, inclusion of a variety of food groups into complementary foods may be essential to improve nutritional status. Over 50% of the world’s daily requirement of proteins and calories come from 3 major crops: wheat, maize, and rice. These do not offer much diversity to those who rely on them. 10 A higher level of food insecurity in the study area calls for a need to utilize other food access strategies to combat food insecurity and improve dietary diversity. 11 Biodiversity increases an avenue in the provision of foods that are good sources of protein, minerals, and vitamins. In addition, a small increase in the variety of foods an individual consume will aid in the elimination of most nutrient deficiencies.
Diets of many households are monotonous and consist of very few items. It is not clear if this is related to the number of species of organisms present in a given area. The study aimed to document foods available and consumed in the study area.
Materials and Methods
Study Location
Kilosa District lies between latitude 60° south and 80° south and longitudes 360°30′ east and 38° west with a total population of 438 175 persons. 12 The district is endowed with an abundant agricultural land suitable for crop production, which is a major economic activity for almost 84.2% of the total labor force. 13 Recently, the area has been awash with persistent land conflicts especially between pastoralists and crop farmers who are fighting for the same land for grazing and farming.
Study Design
Repeated cross-sectional surveys were conducted whereby the same households were followed up in 2 rounds of surveys across agricultural seasons. The first surveys were conducted during the long rainy season (February-May) and the second survey during postharvest period (September-October) in 2011.
District Setup
The district is divided into 3 physiogeographic units, which also constitute 3 different agroecological zones: (1) mountainous and uplands, (2) plateau (cultivation steppe), and (3) flood plains. 14 Mountainous and uplands zone consists of the mountain ranges running from north to south and are part of the Eastern Arc Mountain system and comprise precambrian metamorphic rocks covered with coarse soils. With an altitude up to 2200 m (above mean sea level [amsl]), cultivation of temperate crops (such as wheat) is possible in the small pockets of agricultural land available. The plateau zone (cultivation steppe) is situated in the north of the district around Gairo and stretches toward Dodoma region. 14 At an altitude of around 1100 m (amsl), the zone is characterized by plains and dissected hills with moderately fertile and well-drained soils, which comprise sandy (clay) loams. Although these soils are highly susceptible to erosion, the area is intensively used for maize production and livestock keeping (agropastoralism). The combination of land use intensity and vulnerability of the soil to erosion leads to severe soil degradation. The floodplains zone comprises both flat and undulating plains extending to the foothills in the west where altitude is typically 550 m. A number of rivers, principally the Wami and Ruaha systems, incise the plains.
Sample Size and Study Population
Information was collected from 307 rural households among adult members of age older than 19 years in Kilosa District, Morogoro Region, Tanzania. Three villages representative of the 3 agroecological zones in Kilosa District were selected to participate in the study. There were a total of 168 villages (106 in the plateau zone, 15 in the flood plain, and 47 in the mountainous and upland zone). Each village was assigned a random number. One village from each agroecological zone was randomly selected using the Excel program. Villages and zones included in the study were Kisanga (mountain and upland zone), Rubeho (plateau/cultivation steppe), and Rudewa-Mbuyuni (flood plain). The sample size was calculated using Fisher formula. The prevalence used in the calculation was based on a nonacceptable (borderline and poor) food consumption prevalence of 23% found from the 2010 Comprehensive Food Security and Vulnerability report. 15
An attrition rate of 15% was used to account for the nonresponse rate. Based on this prevalence, the sample size was supposed to be 272, but with the consideration of this attrition rate, the sample size was increased to 313 households. Therefore, at the beginning of the study, 313 households were recruited, but the actual sample involved 307 households. Households were randomly selected using the Excel program by assigning random numbers proportionally to the size of the households in each agroecological zone based on the number of households in each village. The information of households was obtained from the village household register with the assistance of village leaders. The aim was to get a random representation of all households in the villages but proportionally according to population in each village.
Dietary Intake and Food Biodiversity Data
A list of all foods consumed in the study areas were developed in consultation with the community members and through market surveys prior to household dietary intake assessment. In each village, 1 round of visit was made to the existing markets. Food crop names were determined with the assistance of a botanist from Sokoine University of Agriculture. The food list was then compiled in local and common names. Dietary intake data were based on the 24-hour dietary recall method. Interviews were conducted with a mother or a person responsible for meal preparation to obtain information on all the types of foods consumed by the household in the period of past 24 hours prior to the day of the survey including food items consumed outside the home. Food biodiversity was assessed using the indicator guide for assessing consumption developed by the Food and Agriculture Organization. 1 Different parts, shapes, or stages of maturity of the same food reported to be consumed were counted separately; for example, birds and eggs, ripe or unripe mangoes and banana, cassava or cassava leaves, and meat and milk. The foods were reported irrespective of the frequency or consumed amounts. The Food Biodiversity Score (FBS) was developed by summing up different types of foods reportedly consumed by household members.
Data Analysis
The analysis was performed using SPSS version 20 computer software. 16 Descriptive analysis was performed to examine the background characteristics of the surveyed household members. The SPSS descriptive command was used to estimate the arithmetic means, confidence intervals (CI), and standard deviations of continuous variables, whereas proportions were estimated using frequencies. Student t test statistic was used to compare the means of the FBS between the agriculture seasons.
Ethical Considerations
Postgraduate research committee of the faculty of Agriculture of the Sokoine University of Agriculture reviewed the protocol and approved the study. The National Institute for Medical Research (NIMR) further reviewed the protocol and issued a certificate to conduct the study. The reference for the certificate issued by NIMR is NIMR/HQ/R.8a/VoI.IX/1I 89. The permission to conduct research in Kilosa District was granted by the district’s authority after submission of a formal letter. Verbal consent to participate in the study was obtained from the participating heads of the sampled households. Identified heads of the households were invited to a village office through their village leaders. The purpose of the study was told to the participating households, and they were further informed that participation in the study was voluntary and confidential. For majority of the household heads of the surveyed households who did not know how to read and write, the consent forms were read aloud in front of them in order to make a decision to or not to participate in the study.
Results
Demographic and Socioeconomic Characteristics
Sex, marital status, and age
A total of 307 farmers participated in the study. The proportion of females was 58.4% and that of males was 41.6% among the adults aged older than 19 years (Table A1). Eighty-four percent of household members were married and 8.2% were not married (Table A1). Others were separated, widowed, or widowers. The mean age of male adults was 45.8 (14.4) and of female adults was 39.3 (13.9).
Sources of income
Five main sources of income were identified (Table A1): self-employment in crop cultivation (99.3%), livestock keeping (62.9%), petty trading (25.7%), casual labor (16.9%), and salaried employment (2.3%). A higher proportion (67.3%) of households in the flood plain zone kept livestock compared to the other 2 agroecological zones. Crop cultivation was reported by all households in the mountainous/upland zone, and the majority (35.4%) of the households in the plateau were engaged in petty business.
Household size, farm size, and per capita household expenditure
The average household size for the overall population was 5.3 (2.6) (Table A1) ranging from 2 to 15 members. Household size in the flood plain zone was much higher (6.6 (2.8)), compared to the plateau zone (4.6 (2.4)) and the mountainous/upland zone (4.9 (2.0); Table A1). The average per capita household food expenditure was 172 750 TZS (134) 024 TZS US$108 (US$84) at the exchange rate of US$1 = 1600 TZS) per person per annum during the survey period. Per capita household food expenditure of the mountainous/upland zone was higher 216 650 TZS (160 792 TZS); US$134 (US$101) compared to that of the other 2 agroecological zones.
Crop Production
Types of crops produced and amount for the overall population
One to 3 crops were cultivated in each household during the 2010/2011 farming season, and the mean score was about 2 crops (1.9 [0.7]) per household (Table A2). Thirteen different crops were produced in the study area, including maize (93.2%; 516 kg), sunflower (31.3%; 440 kg), rice (25.7%; 643 kg), beans (16.3%; 195 kg), and other crops (pigeon peas, sweet potatoes, groundnuts, cowpeas, tomatoes, bitter tomatoes, green gram, cassava, and sorghum). The mean yield for maize, sunflower, rice, and beans was 515.8, 439.9, 643.2, and 195.4 kg, respectively.
Types of crops produced in each surveyed agroecological zone
The proportion of reported crops by the surveyed households in the 3 agroecological zones differed from one zone to another (Table A2). Although the majority (63.6%) reported to have been engaged in the cultivation of rice in the flood plain, 9.2% reported the same in the mountainous/upland zone. The crop diversity was higher (10 crops) in the mountainous/upland zone compared to 8 crops reported in the flood plain and plateau zones.
The amount of each crop harvested in the 2010/2011 farming season by agroecological zone
Crop yields varied across the surveyed agroecological zones (Table A2). Rice harvest was 686 kg per household in the flood plain. Maize yield was 573 kg in the mountainous/upland zones.
Food Biodiversity by the Household Level, Agroecological Zone, and Agricultural Season
The mean number of food items consumed during the rainy season (4.7; 95% CI: 4.5-5.0; February-May) was significantly different (P = .0001) from that (5.9; 95% CI: 5.7-6.1) during harvest season (September-October).
The mean number of food items reported to have been consumed by the surveyed households in the mountainous/upland zone was higher (7 food items) during the rainy season than in any other agroecological zone (Table A3). The lowest number (4) of food items was recorded during the rainy season in the plateau zone and 5 food items during the harvest season. Using the food biodiversity indicator guide for food consumption as a measure of biodiversity, 64 food items were identified during the harvest season and 82 food items during the rainy season. The proportion of households that consumed maize was relatively higher (95.4%) during the rainy season than during the harvest season (92.2%). Despite the high number of food items in both seasons, only a small proportion of the foods was utilized by at least 10% of the surveyed households. For example, during the harvest season, only 14 (22%) of 64 food items were reported by at least 10% of the surveyed households (Table A4). Among the 14 food items, 6 were vegetables including tomatoes (66.8%), onions (62.9%), African eggplant (19.9%), pumpkin leaves (16.6%), sweet potato leaves (14.3%), and amaranth (13%). The single most reported fruit was pawpaw. Other fruits were ripe banana (9.4%), watermelon (5.2%), and guava (0.3%).
Foods belonging to a wild edible category were reported by less than 10% of the surveyed households during the harvest season. These included vegetables such as Aeschynomene subspecies (mlendamwage; 6.5%), Manihot glaziovii (kisamvumpira; 6.2%), Sesamum angustifolia (mlendamgunda; 4.9%), Portulaca olaracea (mkombadole; 1%), mhwimbwiji (0.7%), and Cleome hirta (mgange; 0.3%). Other foods known for their potential nutritional and health benefits reported by a few included mushrooms (0.3%), palm oil (0.7%), and honey (0.3%). Cane sugar was consumed by 18.6% of the surveyed households during the harvest season. Sunflower oil was mainly consumed (39% of households) as an added ingredient to cooked dishes.
During the rainy season, 12 (14.6%) of 82 food items were reported by at least 10% of the surveyed households. These included maize, pumpkin leaves, sunflower, beans, amaranth, rice, S angustifolia (mlendamgunda), coconut, cowpeas, okra, cassava, and groundnuts. Tomatoes (2.3%) and onions (1.6%) were rarely included in the diets during rainy season compared to harvest season. Beans and cowpeas were the most reported legumes (by 25.7% and 14% of the surveyed households, respectively) during the rainy season. Beans consumption was the highest (62.9%) during the harvest season. Similarly, cowpeas were the least (2.6%) consumed during harvest season while the peanuts were the least (1%) consumed during the rainy season. Despite the fact that beans consumption remained the number 1 legume in the 2 seasons, its consumption decreased by almost 37% during the rainy season. Pigeon peas, cowpeas, Bambara nuts, and Vigna membranacea were reported by few (1%) surveyed households during the harvest season.
About 21 vegetables were identified during harvest season and 24 during rainy season. Generally, the proportion of households that consumed vegetables was higher during rainy season than it was during harvest season. For example, pumpkin leaves were reported to be consumed by 34.9% of the surveyed households during the rainy season, but it was reported to be consumed by only 16.6% of the surveyed households during the harvest season. Amaranth was reported to be consumed by 13% of the surveyed households during the harvest season as opposed to 25.7% of the surveyed households during the rainy season. In addition, the least consumed food item was cowpea leaves. Vegetables of wild edible origin were least consumed during the harvest season. P olaracea (mkombadole), Moringa oleifera, mgange, and mushroom were least consumed as reported by 0.3% of the surveyed households for each of the first 3 types of vegetables and 0.7% of the surveyed households for mushrooms. Only 1 insect locally known as sondo was reported to be consumed by 0.3% of the surveyed households.
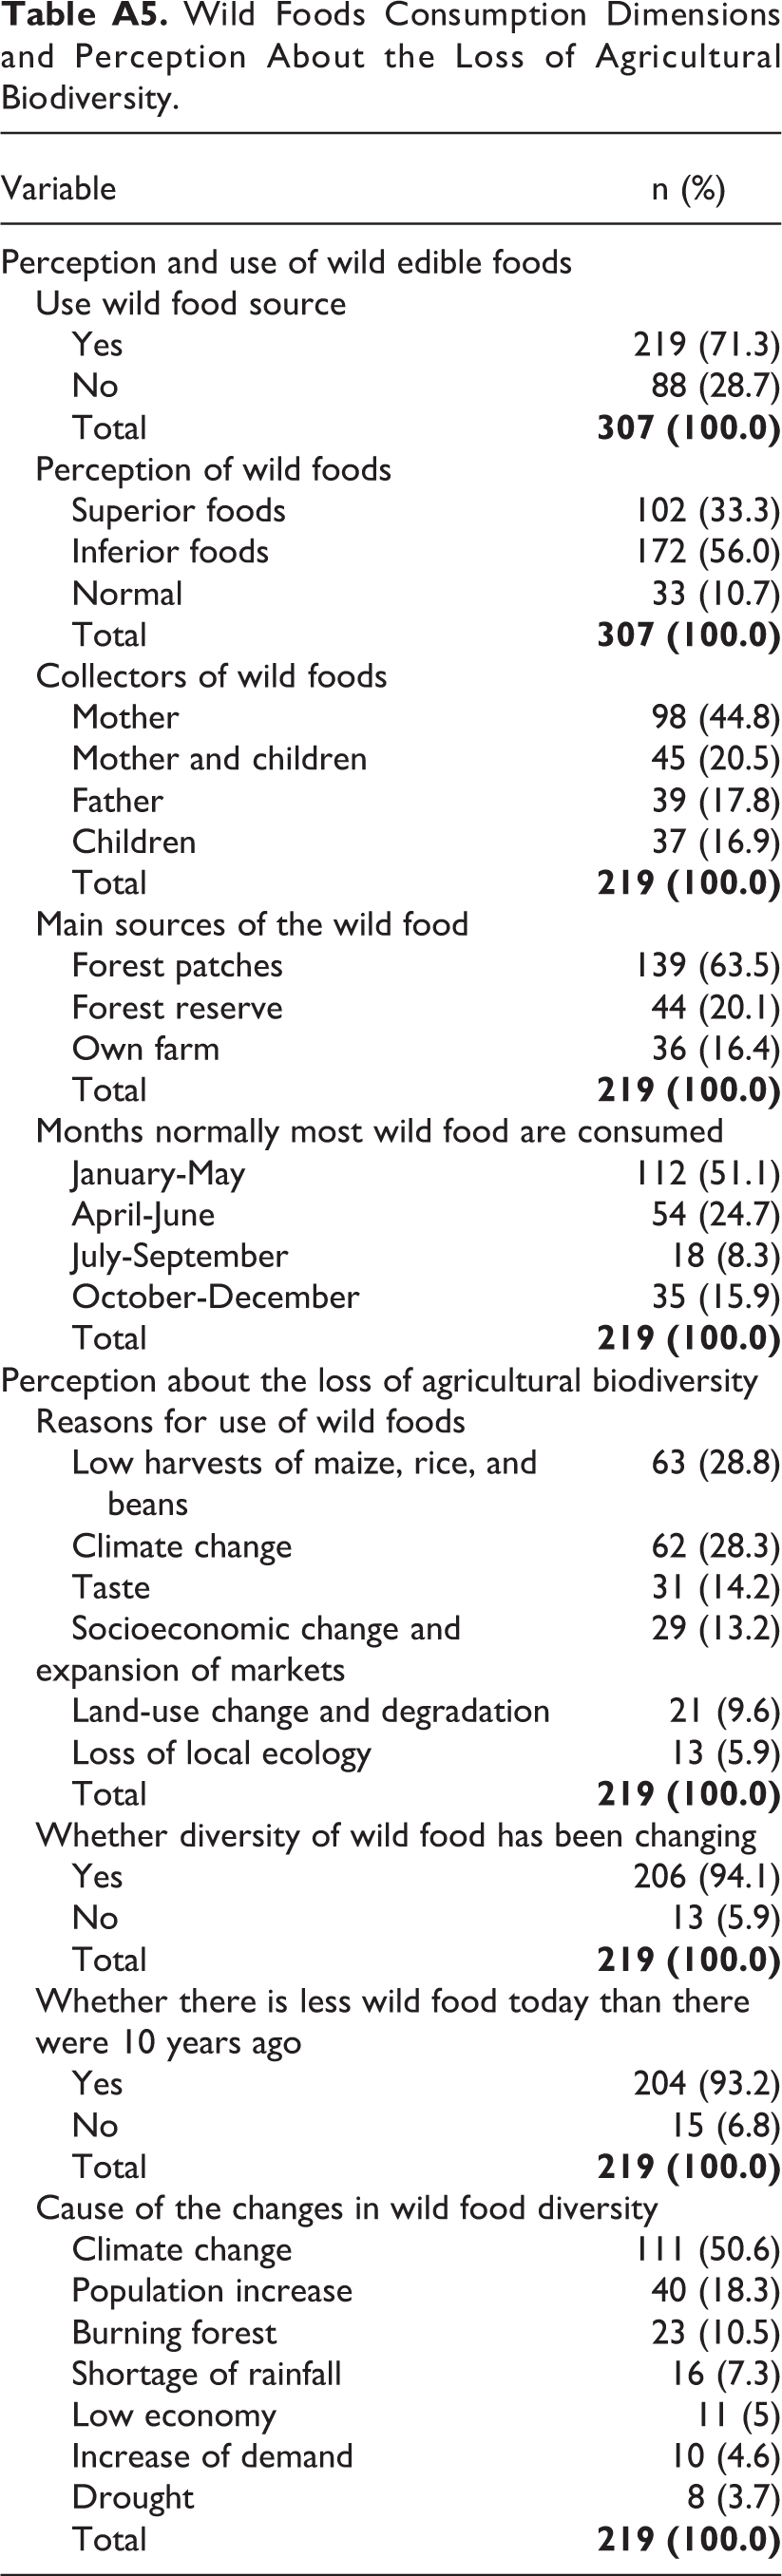
Perception and use of wild edible foods
A high proportion (71.3%) of the surveyed population reported to have used wild edible foods (Table A5). More than 50% of the surveyed population had a perception that wild edible foods are inferior in terms of acceptability. About 11% acknowledged that wild edible foods are superior foods. Mothers/wives (45%) were the main collectors of the wild edible foods. The wild edible foods were collected mainly from forest patches (64%). Potential sources of the wild edible foods were government forest reserves (20%) and farms (16%). Wild edible foods were mostly available (51%) during the rainy season (January-May) in each year, thus making it difficult to utilize these foods especially during the harvest season. However, a small proportion (8%) of the surveyed households reported to have access to wild foods during the dry season (July-September). The reported proportion was almost 6 times lower than the proportion reported during the rainy season. The reasons for utilization of wild edible foods include low harvest (28.8%) of maize, rice, and beans; climate change (28.3%); taste (14.2%); land use and degradation (9.6%); social economic changes; market expansion (13.2%); and loss of local ecology (Table A5).
Perception about the loss of food biodiversity
The respondents acknowledged that food biodiversity loss was evident in their communities (Table A5). About 94% of the surveyed households affirmed current reports documenting a decline of species diversity. Similarly, during the time of this study, about 93% of respondents admitted that there were less wild edible foods than 10 years prior to the survey, and they emphasized that more loss is likely to occur if no concerted efforts are made toward mitigating the situation. Loss of food biodiversity was reported to be mainly due to climate change (51%), population increase (18%), and the burning of forests (11%) for various reasons, including establishing new farm fields. Agricultural innovations, as a mitigation measure for the impacts of climate change, is however thought to invite new alien weeds that can cause an allelopathy effect to the existing biodiversity and hence leading to the loss.
Discussion
Food Diversity and Agricultural Seasons
The mean number of food items reported by the surveyed households differed significantly between the 2 agricultural seasons and among the surveyed agroecological zones. Households depended on few food items or a narrow range of food items. Wild edible foods were perceived to be inferior by the majority of surveyed households. Similar perception was shown by Molina et al who found that consumption of wild edible plants was perceived as a symbol of poverty and old fashioned. 17 Foods that are known for their potential nutritional and health benefits such as mushrooms, palm oil, and honey were reported to be consumed by a small proportion of the surveyed households. The drought-prone agroecological zone had adopted most of the processing techniques such as precooking of vegetables that ensured the sustainable supply of vegetables unlike the case with geographically suited areas in terms of rainfall onset and amount. Majority of the surveyed households were aware of the declining species diversity and acknowledged that climate change, social changes, population growth, and farming activities contribute to loss in species diversity.
Food Biodiversity
The rich biodiversity in the surveyed agroecological zones is underutilized. Although 183 edible food items were documented, households depended mostly on 82 food items (45%), indicating that there is a huge potential to increase food biodiversity in this community. Uprety et al recorded a total of 81 wild edible plants in a multiethnic region in India. 18 This observation is in contrast with the current global effort supporting dietary diversification and alleviation of malnutrition through sustainable utilization of local biodiversity. The available evidence shows that there is a great diversity of foods locally available in our environments; however, such foods are underutilized. 4 The available evidence from Kenya shows that 48.5% of changes in dietary intake could be attributed to changes in the utilization of agrobiodiversity. 19 This indicates that biodiversity offers some promise in the efforts toward alleviating malnutrition and improving dietary intake. Similarly, the majority had a wrong perception about the use of wild edible foods. This limitation in knowledge and the underutilization of locally available foods might have contributed to the observed level of food insecurity, inadequate dietary diversity, and undernutrition (results not shown).
Furthermore, wild edible foods were used as supplements to cultivated foods and sometimes sought after when there is a deficiency of the usual foods. Similar observations were made in a study done in Ethiopia indicating that wild edible foods served as supplemental foods to the major cultivated crops during periods of food shortage. 20 The inadequacies observed in the utilization of the rich local biodiversity and eroding appreciation of the contribution of the wild edible foods to the household food basket and nutrition security could be attributed to loss of indigenous knowledge in relation to the utilization of these foods due to generation gaps. Therefore, there is a need to address this issue in an attempt to improve food and nutrient availability and dietary quality for sustainable human well-being and development. 21 Limited consumption of a wide range of food items limits intake of a wide range of micronutrients. Therefore, promoting the consumption of these foods in a more sustainable way will be nutritionally beneficial.
The mean number of food items consumed during the harvest season was higher than the number of items reported during the rainy season. This implies that households experienced seasonal variations in food consumption leading to inadequate nutrient intake and greater risk of malnutrition during the rainy season than during harvest season. Consequently, residents in drought-prone areas such as the plateau agroecological zone had adopted most of the processing techniques that ensured the supply of the indigenous vegetables throughout the year as opposed to areas that received good rains in terms of onset and amount. Sun drying and precooking of indigenous vegetables were the most common processing techniques. Precooking is the practice that involves boiling or blanching. After boiling, the pot is first removed from the fire and then poured over a surface to allow drainage of water followed with drying of the boiled vegetables to ensure its availability during the dry period (harvest season). It was also observed that storage of indigenous vegetables that were either sundried or precooked was confined in areas with inadequate rainfall; however, “the supply of green leafy vegetables was confined in these areas during the harvest season.” This is a clear reason as to why the proportion of households that consumed vegetables in the flood plain did not differ significantly between the rainy and harvest seasons. Therefore, utilization of resources from the rich biodiversity in ensuring food and nutrition security and dietary diversity may be enhanced by improving local processing and preservation technologies, which are currently very limited in many rural communities. In addition, culinary practices, linking farmers to the markets, nutritional education through training on processing of these foods, and development and promotion of specific food recipes may enhance availability and utilization of indigenous foods which are wildly distributed in the rural areas. 22
Conclusion
The surveyed areas have great diversity in the number of crops, animals, and insects present. The majority of the rural communities perceived wild edible foods as inferior, and the majority of these identified foods were rarely consumed. The findings from this study have added to the body of knowledge by documenting the types of foods that are available in the study areas and the mean numbers of food items that are actually consumed at the household level. Also highlighted is the concept of perception with regard to food consumption and adoption strategies in food access. The patterns of biodiversity loss and the factors associated with the loss are among the topics requiring further investigation in the study area. It is important to educate communities on the rich and affordable food base that surround them in order to improve their food diversity, income, and nutritional status.
Footnotes
Appendix
Wild Foods Consumption Dimensions and Perception About the Loss of Agricultural Biodiversity.
| Variable | n (%) |
|---|---|
| Perception and use of wild edible foods | |
| Use wild food source | |
| Yes | 219 (71.3) |
| No | 88 (28.7) |
| Total |
|
| Perception of wild foods | |
| Superior foods | 102 (33.3) |
| Inferior foods | 172 (56.0) |
| Normal | 33 (10.7) |
| Total |
|
| Collectors of wild foods | |
| Mother | 98 (44.8) |
| Mother and children | 45 (20.5) |
| Father | 39 (17.8) |
| Children | 37 (16.9) |
| Total |
|
| Main sources of the wild food | |
| Forest patches | 139 (63.5) |
| Forest reserve | 44 (20.1) |
| Own farm | 36 (16.4) |
| Total |
|
| Months normally most wild food are consumed | |
| January-May | 112 (51.1) |
| April-June | 54 (24.7) |
| July-September | 18 (8.3) |
| October-December | 35 (15.9) |
| Total |
|
| Perception about the loss of agricultural biodiversity | |
| Reasons for use of wild foods | |
| Low harvests of maize, rice, and beans | 63 (28.8) |
| Climate change | 62 (28.3) |
| Taste | 31 (14.2) |
| Socioeconomic change and expansion of markets | 29 (13.2) |
| Land-use change and degradation | 21 (9.6) |
| Loss of local ecology | 13 (5.9) |
| Total |
|
| Whether diversity of wild food has been changing | |
| Yes | 206 (94.1) |
| No | 13 (5.9) |
| Total |
|
| Whether there is less wild food today than there were 10 years ago | |
| Yes | 204 (93.2) |
| No | 15 (6.8) |
| Total |
|
| Cause of the changes in wild food diversity | |
| Climate change | 111 (50.6) |
| Population increase | 40 (18.3) |
| Burning forest | 23 (10.5) |
| Shortage of rainfall | 16 (7.3) |
| Low economy | 11 (5) |
| Increase of demand | 10 (4.6) |
| Drought | 8 (3.7) |
| Total |
|
Declaration of Conflicting Interests
The author(s) declared no potential conflicts of interest with respect to the research, authorship, and/or publication of this article.
Funding
The author(s) received no financial support for the research, authorship, and/or publication of this article.