
Abstract
Background:
Height and body segments in children have differential pubertal growth characteristics. Lower leg length is a sensitive indicator of child’s nutritional status.
Objective:
The purpose of this study was to estimate differential timing and tempo of height and knee height (KH) growth in 9- to 17-year-old boys (n = 475) and girls (n = 500) from Merida, Mexico.
Methods:
In this cross-sectional study, the Preece-Baines growth curves—model 1 (PB 1) was fitted to the anthropometric data for height and KH.
Results:
Based on the PB 1 model, KH had earlier age at maximum increment than height in boys (height = 12.37 years, KH = 11.54 years) and girls (height = 11.01 years, KH = 10.93 years). Peak velocity of these 2 dimensions was different in both sexes (boys: height = 7.11 cm/yr, KH = 2.25 cm/yr; girls: height = 5.14 cm/yr, KH = 1.45 cm/yr). Differences (P <.001) by sex were also observed for the estimated size at peak velocity and final size of height and KH.
Conclusions:
When compared to height, KH was shown to have earlier adolescent growth spurt and a smaller difference between final size and the size at maximum (peak) velocity indicating an earlier age for achieving adult size. Overall, the studied boys and girls had short estimated final size, an earlier age at maximum increment, and a lower peak velocity in height than urban Guatemalan peers, the only regional reference available.
Introduction
Human body size and segments have differential timing and tempo of growth. Girls generally have an earlier growth spurt and also reach final size earlier than boys of the same age. Following the cephalocaudal principle of human growth, the lower extremities, especially the distal segment or knee height (KH) as often measured at the tibia, grow faster relative to other body segments. 1 Populations with generally short adult stature or height have usually experienced a long-term history of nutritional insults due to socioeconomic factors, particularly during childhood and adolescence. 2 From the perspective of developmental plasticity, leg length in terms of both absolute size and size relative to height is a sensitive indicator of the quality of life, nutritional status, and socioeconomic environment of children during physical growth. 1,3 -6 The lower leg growth is extremely responsive to nutrient shortage, chronic energy deficiency, infection, and other adverse life conditions during infancy and childhood that can lead to relatively short leg length and consequently short adult height. 4,7,8 An excellent example of this phenomenon is the generally short height in ethnic Maya populations in Mexico.
Southern Mexico and the Yucatan Peninsula are historically home to large populations of ethnic Maya people. For almost 5 centuries, the Maya people have experienced the consequences of European colonization, including adverse living conditions that have affected their cultural, social, and economic changes. To date, life conditions in most Maya communities are characterized by poverty and very limited economic, social, and human development possibilities. 9,10 It is probable that these adverse environmental conditions have been expressed in the Maya population’s poor biological status, specifically in short adult height, a parameter that historically has remained very low. 11 -14
Contemporary Maya children and adults commonly have life histories involving chronic undernutrition. 14 -18 In addition, the Maya population in the state of Yucatan is known to have undernutrition in childhood and obesity in adulthood. 19 The former has been quantified in studies of rates of chronic undernutrition (<−2 standard deviations of height-for-age Z-score) in the largely Maya-populated, corn-growing regions of Yucatan, where they range from 37.7% to 82.1% in children younger than 10 years of age. 20 -24 Despite improvements in living conditions over the last 30 years, Maya populations in Yucatan, continue manifesting the signs of severe poverty and marginalization, which reflect a high rate of undernutrition and infectious diseases. 25 -27 Prevalence of undernutrition in children was recorded mostly from rural Yucatan, 26 but there are also available reports from urban areas. For example, in a recent study of 6- to 9-year-old Maya children (53 boys and 56 girls) from Merida, Yucatan, low height-for-age (stunting) was present in 15% of boys and 7% of girls. 15 Previous studies documenting the remarkable frequency of stunting in adolescents (boys >6% and girls >15%) from Merida, Yucatan, 28,29 used the same database as employed in the present study. However, very little data have been collected on KH and body proportionality in children and adolescents of Maya ancestry on the Yucatan Peninsula. 30,31
The hypothesis of the present study was that existence of differential pubertal growth characteristics of height and KH could identify the contribution of KH to the final or adult height. In the present study, we address the differential timing and tempo of height and KH growth during puberty in a sample of children and adolescents, including some of Mayan ancestry from Merida, Yucatan. It became clear in earlier studies from Merida, Yucatan (as mentioned in the previous paragraph) that analysis of age and size at maximum increment and peak velocity of height and KH during puberty among the participants would help to better understand the phenomenon of stunting in such populations. Moreover, this analysis could contribute to future research into leg length, both in terms of absolute size and in terms of size relative to height as a sensitive indicator of nutritional status and physical growth in children. No comparable data have been reported to date in Mexico, although studies done in Merida, Yucatan, do address growth and nutrition in children and adolescents. 17,32 -37
The principal objectives of the present study were: to use Preece-Baines model 1 (PB 1) to estimate age and velocity at maximum increment for height and KH from cross-sectional data for 9- to 17-year-old children and adolescents; to estimate final or adult size of height and KH; to document the differential growth patterns for height and KH at puberty by sex; and to observe the distribution of knee height ratio (KHR = (KH/height) × 100) by age and sex.
Methods
Participants
The sample constituted of 975 children and adolescents (475 boys and 500 girls) aged 9 to 17 years from public and private schools in the city of Merida, Mexico. Sample size by age and sex is presented in Table 1. Decimal age was calculated from the recorded date of birth. The study was cross-sectional, and the participants were measured only once during 2008 to 2009 as a part of a research project (see Acknowledgment). For the present study, we used a purposive nonprobability sample 38 that was not representative of the city of Merida and was both ethnically and socioeconomically heterogeneous as reported earlier. 28,29 Participants’ ethnic background was defined as either Maya or Mestizo (a mix of Maya, other Mexican, and/or European ancestry). In Mexico, people use 2 surnames, the first is the father’s first surname and the second is the mother’s first surname. In the studied sample, participants with 2 Maya surnames (11.9%) were considered to be Maya, while those with 1 Maya surname (28.6%) or no Maya surname (59.5%) were considered to be Mestizo. However, in the present study, we could not estimate differential height and KH growth patterns (using PB 1 model) among the participants of different household socioeconomic status (SES) and ethnic background, since sample size by age, sex, ethnicity, and SES groups was not adequate.
Descriptive Statistics of Height (cm), Knee Height (cm), and Knee Height Ratioa by Age and Sex From Merida, Yucatan.
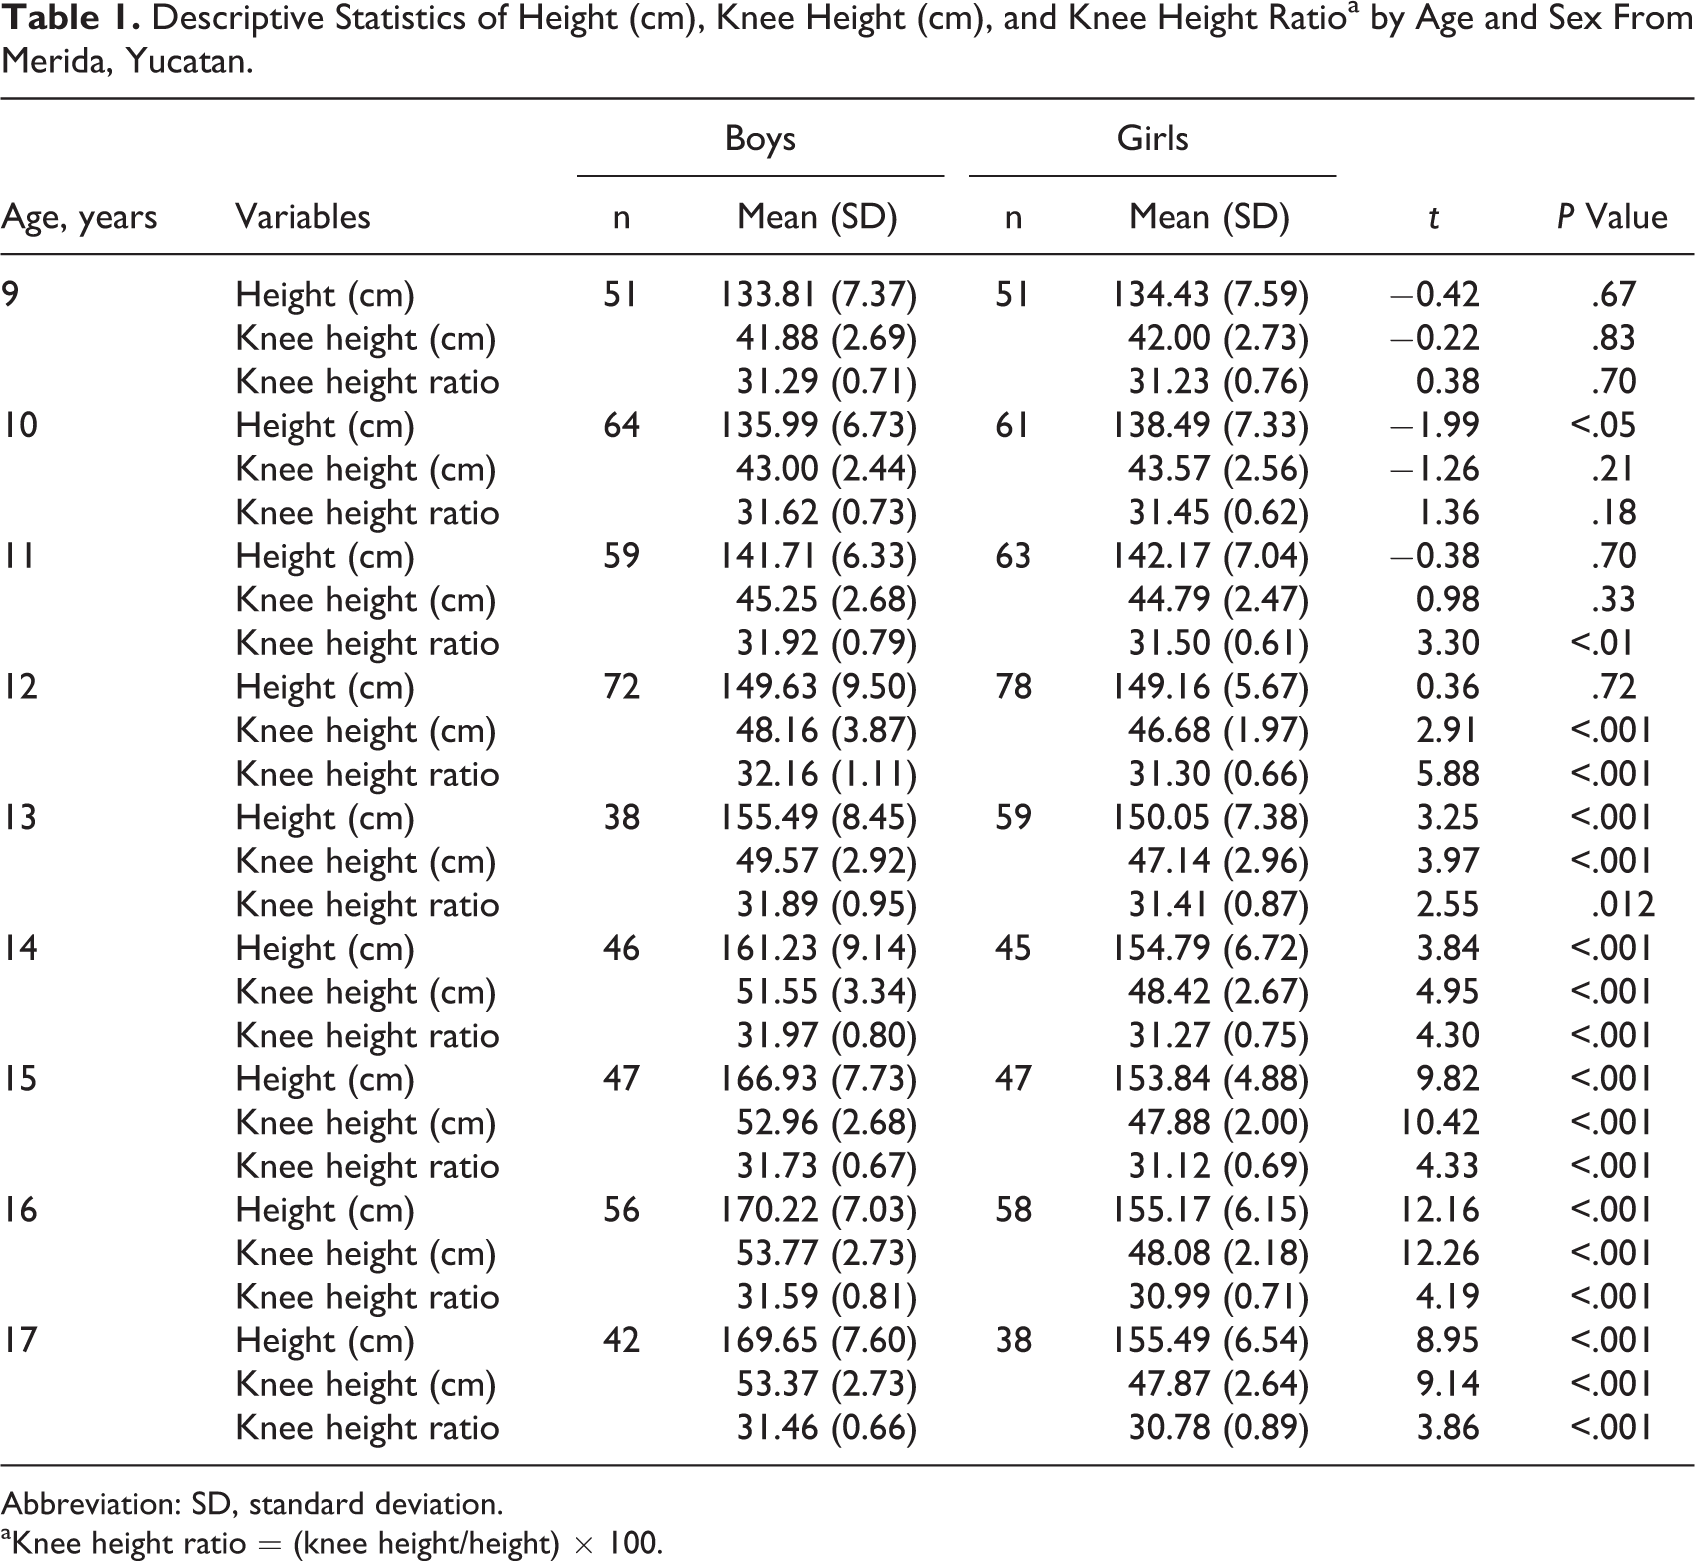
Abbreviation: SD, standard deviation.
aKnee height ratio = (knee height/height) × 100.
Ethical Concern
The research design was approved by the Bioethics Committee for the Study of Human Beings of the Center for Research and Advanced Studies of the National Polytechnic Institute, Mexico (Centro de Investigación y de Estudios Avanzados del Instituto Politécnico Nacional or Cinvestav-IPN in Spanish acronym). The Secretary of Education of the State of Yucatan, and the administrations of the schools where data were collected, authorized our access to the schools. Written informed consent was obtained from each participant’s parents or guardians before the study began. All participants provided verbal consent. After data collection, families were provided a report on the physical growth and nutritional status of their participating child.
Anthropometric Measurements
Trained personnel from Cinvestav-IPN collected data on height and KH following standard international protocol. 39,40 Technical error of measurements was used to validate measurement data quality. Test–retest reliability was estimated using intra-class correlation coefficients (ICC, repeated measures) with 95% confidence intervals 41 ; The ICC values were ≥0.85 of anthropometric measurements. 42 Height was measured using a standard stadiometer with platform (Seca model no 225, Hamburg, Germany). The KH was measured using a “segmentometer,” a device designed ad hoc by 1 of the coauthors (FD) following instructions from Dr A. Roberto Frisancho, PhD, Professor of Anthropology, University of Michigan, USA (personal communication, 2008-2009, through emails and visits). As reported previously, this device was standardized and validated before use in data collection. 30,31 Measurement of KH was done of the left knee with the participant seated and barefoot and the lower leg positioned at a 90-degree angle to the thigh. The segmentometer shaft was held parallel to the lower leg, and a movable horizontal blade placed on the anterior surface of the thigh. The measurement was taken as the distance the femoral condyles, at the highest point the patella to the surface of the floor. All measurements were recorded to the nearest 0.1 cm. The KHR ((KH/height) × 100) was also calculated.
Fitting the Preece-Baines Growth Curve
The PB 1 is one of the several structural or parametric methods for analyzing anthropometric traits. 43 These are fitted using nonlinear least squares and mostly longitudinal series of data. Studies have been done of fitting height growth curves in longitudinal series of data from children and adolescents in the United Kingdom, 43 Belgium, 44 -46 rural India, 47 urban India, 48 Aboriginal Australia, 49 Guatemala, 50 and in 2 West African (Gambian) villages. 51 However, the PB 1 model has also been applied to several cross-sectional studies worldwide. 52 -61 The model includes functional or mathematical parameters as well as estimated biological parameters to determine the timing and tempo of growth events of anthropometric characteristics at puberty and until the measured values (height and KH in the present case) reach the final or adult size.
Statistical Analysis
Height and KH data were normally distributed following principles (Shapiro-Wilk test). Distribution of KHR by age and sex was done. We used the PB 1 model 43 to estimate 2 biological parameters for height and KH: mean values at the age of maximum increment (year) and peak velocity (cm/yr). The parameters were estimated based on least square error. The corresponding values were generated by applying the PB 1 model as follows:
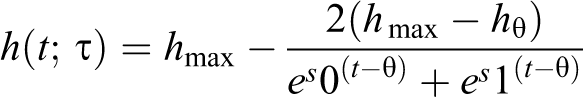
where τ = size in cm, including t = age in years; hmax (estimated mature or final size in cm), hθ (size at a threshold age θ in cm), θ (age at peak velocity in year), and S0 and S1 (prepubertal and pubertal rate constants controlling growth velocity, respectively, in cm/yr) were the 5 functional or mathematical parameters. For the sake of identifiability, it was assumed that S0 < S1. It was further assumed 58 that the values of all parameters were positive and the ratio of S1/S0 had to be greater than a constant value of about 5.828. Peak velocity is a measure of maximum rate of growth in size (height or KH) during a growth spurt. Age at peak velocity corresponds to the maximum velocity of growth. A Student t test was used to evaluate sex difference for height, KH, and KHR. All statistical analyses, tables, and figures were done with Microsoft Excel 2007 (Version 12.0) and the R software (Version 3.0). Statistical significance was set at α = .05.
Results
The descriptive statistics for height (cm) and KH (cm) by age and sex showed a growth pattern in these 2 body dimensions by age in boys and girls (Table 1). Differences (P < .001) were observed between the sexes, with higher mean values in boys for height and KH from 13 years of age onward. However, between 9 and 11 years, the girls were taller and also had higher mean KH values than boys of the same age. At 12 years of age, boys were marginally taller than girls (sex difference, P > .05). However, at 12 years of age, significant sex difference (P < .05) was observed for KH with higher mean value in boys. Distribution of KHR by age and sex showed that approximately 31% to 32% of total stature was comprised by the lower segment of leg (tibia + foot height), and significant sex difference was observed from 11 years of age onward with higher mean values of KHR in boys.
The mathematical parameters used and the biological parameters estimated for fitting the growth curves for height and KH using the PB 1 model in boys and girls are presented in Table 2. The 95% confidence interval values of the parameters are also presented. The age at peak height velocity (PHV) or age at maximum height increment was earlier in girls (11.01 years) than in boys (12.37 years). The age at maximum increment for KH was also earlier in girls (10.93 years) than in boys (11.54 years). Estimated PHV (cm/yr) was also higher in boys (7.11 cm/yr) than in girls (5.14 cm/yr). Maximum or peak velocity for KH was recorded to be higher in boys (2.25 cm/yr) than in girls (1.45 cm/yr). Boys were generally taller than girls, both for age at maximum increment (peak velocity) and for estimated final size. Boys also had longer KH than girls.
Average Biological Parameters (Mean Values) of the Adolescent Growth Spurt of Height and Knee Height (KH) in Boys and Girls From Merida, Yucatan, Estimated by Preece-Baines Growth Model 1. 43
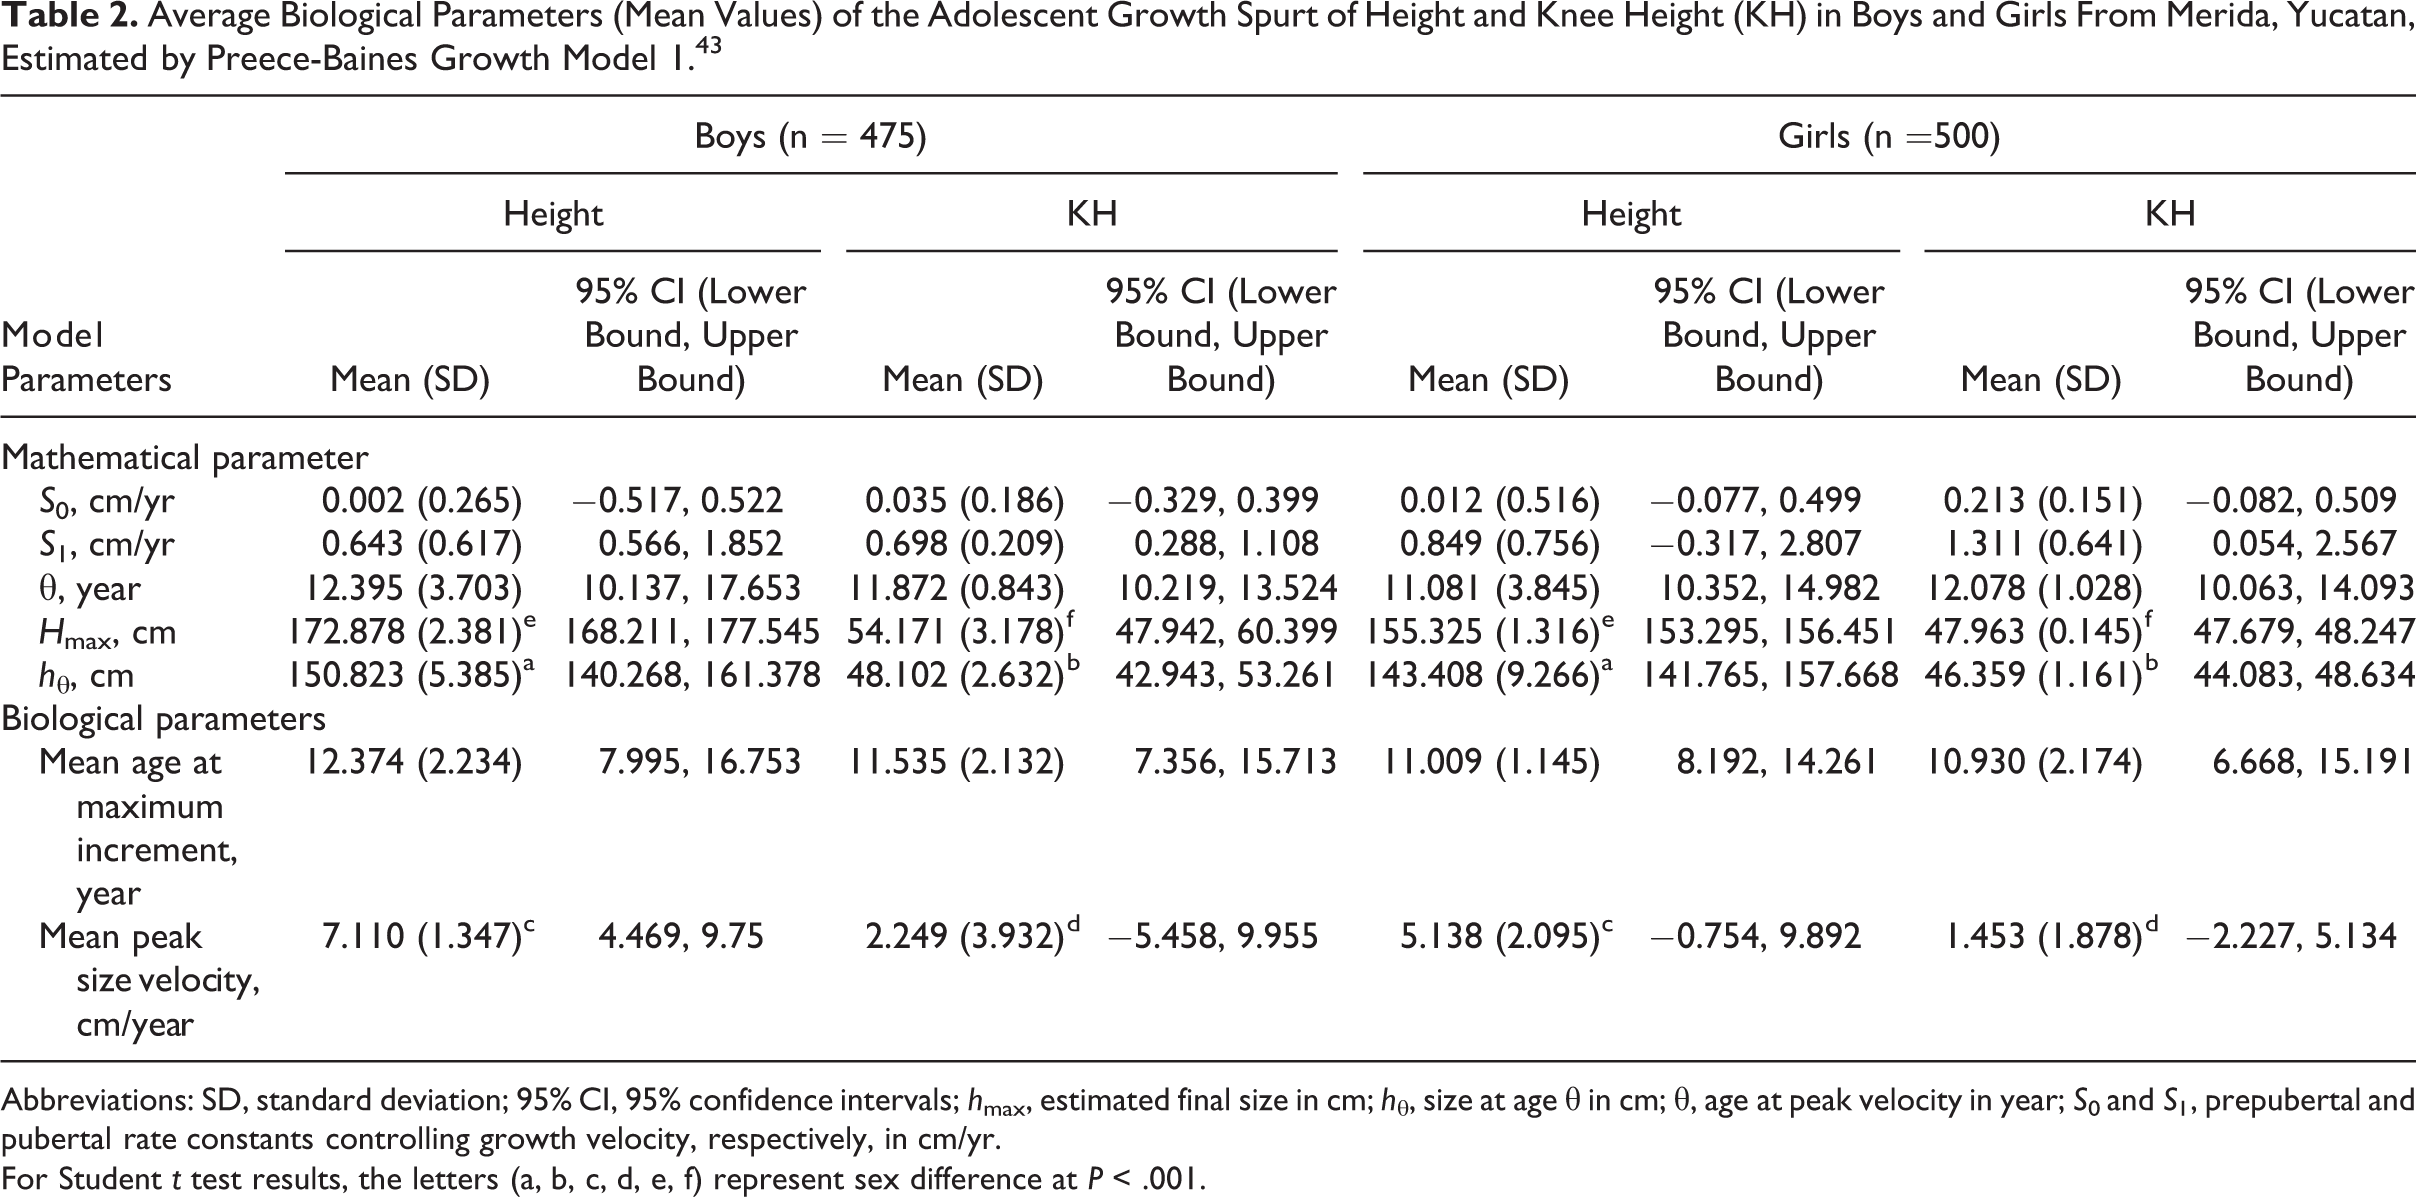
Abbreviations: SD, standard deviation; 95% CI, 95% confidence intervals; hmax, estimated final size in cm; hθ, size at age θ in cm; θ, age at peak velocity in year; S0 and S1, prepubertal and pubertal rate constants controlling growth velocity, respectively, in cm/yr.
For Student t test results, the letters (a, b, c, d, e, f) represent sex difference at P < .001.
Size at peak velocity for height in boys (150.82 ± 5.39 cm, ie 87.24% of adult size) was almost 22 cm shorter than at final size (172.88 ± 2.38 cm). In girls, however, the difference between the mean values for height at peak velocity (143.41 ± 9.27 cm, ie, 92% of the adult size) and final size (155.33 ± 1.32 cm) was 11.92 cm. For KH, the difference between size at maximum increment (48.10 ± 2.63 cm, ie 89% of adult size) and final size was 6.07 cm in boys and 1.60 cm in girls (size at peak velocity for KH = 46.36 ± 1.16 cm, ie, 97% of the adult size). Differences by sex were observed for hθ (size at peak velocity) and final size for height (hθ: t = 15.18, P < .001; final size: t = 143.40, P < .0001) and KH (hθ: t = 13.48, P < .0001; final size: t = 43.62, P < .0001). Differences by sex were also observed for peak velocity for height (t = 17.38, P < .0001) and KH (t = 4.07, P < .0001).
Growth for height and KH in boys and girls are represented graphically both as distance curves (Figures 1 and 2) and as velocity curves (Figure 3). Positive, steady increases in height and KH by age until reaching near to the final size were observed in the distance curves for both sexes. The velocity curves for height and KH in boys and girls also showed steady increases (cm/yr) in the measured anthropometric parameters during puberty until reaching peak values, after which they declined steadily to 17 years of age. The PHV (maximum increment, cm/yr) was higher than peak KH velocity in boys and girls (Figure 3) that corresponds to the results presented in Table 2.
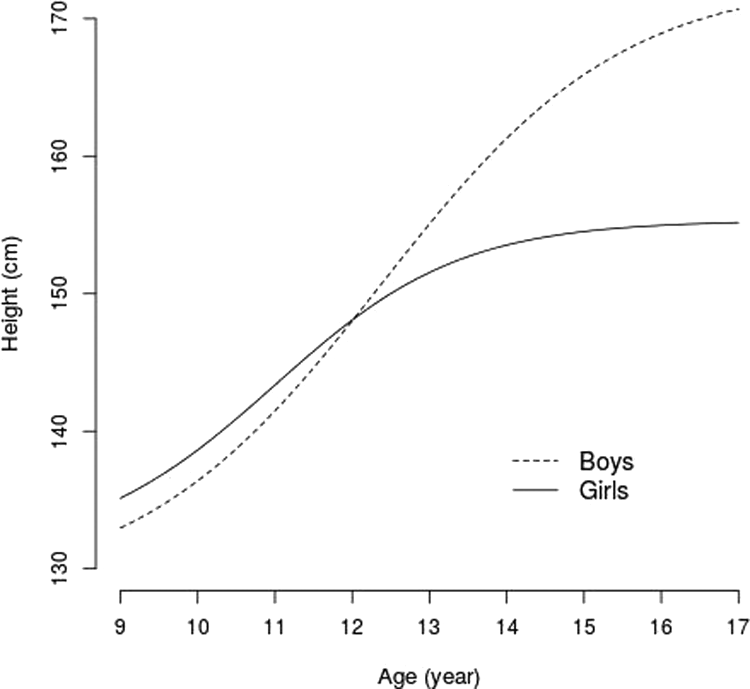
Distance curve for height in boys and girls.
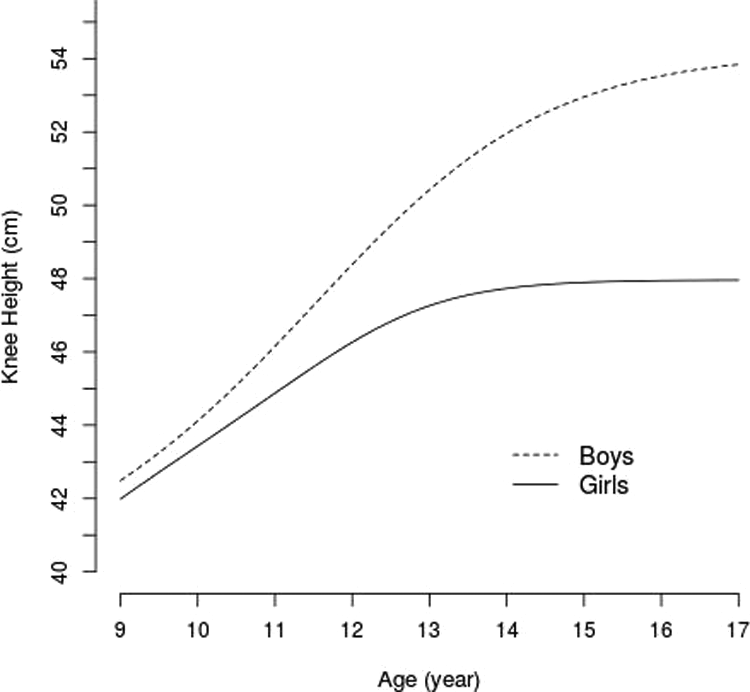
Distance curve for knee height in boys and girls.
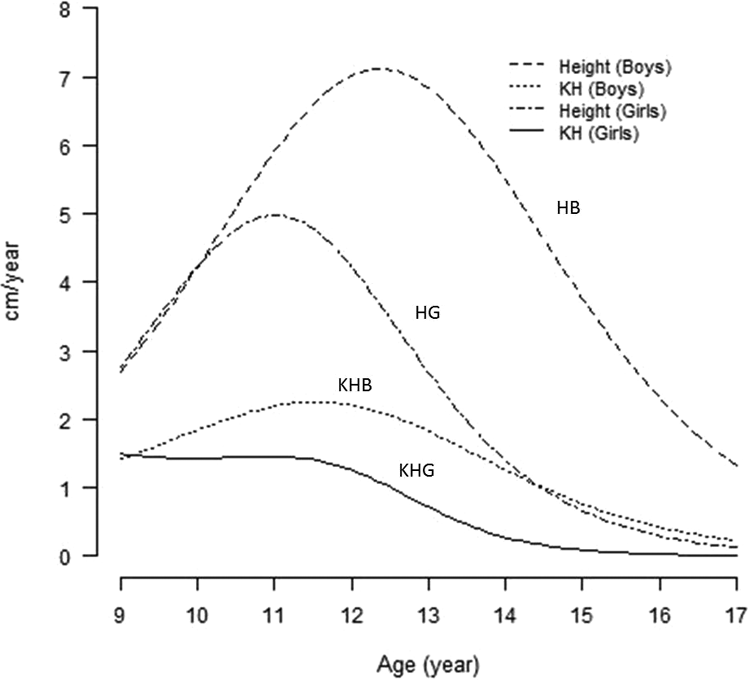
Velocity curves for height and knee height (KH) in boys and girls.
Discussion
The differential pubertal growth characteristics in height and KH in children and adolescents from Merida, Mexico, documented here showed age at maximum increment of KH to be earlier than that for height in both sexes. In contrast, velocity at the age of maximum increment was higher for height than for KH. Boys and girls in the studied sample apparently did not generally reach their adult size for height and KH by 17 years of age (Figures 1 and 2). However, as expected the difference between the values for size at peak velocity and final size for height and KH was much narrow in girls than in boys (Table 2). There was no surprise in the results that documented age at peak velocity for both these anthropometric characters was earlier in girls. This further indicates as usual that the girls would probably reach final or adult size earlier than boys, although this remains speculative since no data on maturity indicators were collected.
The results of the present study on biological parameters for height growth are comparable with some earlier reports where PB 1 had been used to estimate timing and tempo of height growth in children from West Africa, 51 Australia, 49 Belgium, 44 -46 China, 56 Great Britain, 43 Guatemala, 50 India, 47,48,54 and the Third Harvard Study. 61 However, no comparable data are available in the literature on KH growth parameters using PB 1 model. The earliest mean age at PHV (12.37 years) in boys is that observed in the present study (Table 2), while relatively late age at PHV was reported for West African boys (16.29 years). 51 Chinese girls 56 had relatively early age at PHV (10.60 years) in comparison with urban girls in India (12.35 years). 48 Mean age at PHV in girls in the present sample was 11.01 years. The lowest mean height velocity at the age of maximum increment (PHV; 6.91 cm/yr) was reported in Chinese boys, 56 whereas the highest velocity (10.30 cm/yr) was in boys from Australia. 49 Height velocity at age of maximum increment in boys in the sample from Merida City (7.11 cm/yr) were within range of mean values reported in samples representing other countries as mentioned earlier but much lower than those in neighboring Guatemala (9.52 cm/yr). 50 When compared to these previous studies, the girls in the present study had the lowest PHV (5.14 cm/yr), which was notably lower than the highest value (8.40 cm/yr) in girls from Australia. 49 Estimated mean final or adult height in the boys studied here was moderately high (172.87 cm), next to the boys from Australia 49 (172.13 cm) and those in the Third Harvard Study 61 (172 cm). But it was still lower than the 177.18 cm estimated final height reported for boys in Guatemala. 50 Girls in the present study were relatively shorter (155.33 cm), based on the estimated adult height than those from most other countries except India, where the Khasi girls had the least mean final height (147 cm). 54
Estimated final height in boys (172.87 cm) in the present results seems quite tall when compared to mean height (169.65 ± 7.60 cm) at 17 years of age (Table 1); minimum height in boys at this age was 160 cm and maximum was 183 cm. This suggests that at least some of the studied boys would continue growing even after 17 years of age. A considerable number of boys in the sample (n = 33) had height >175 cm (≥90 percentile) between the ages of 14 and 17 years. Of these 33, only 6 had been born and/or spent more than 10 years outside Merida, Yucatan: 5 in Mexico City and 1 in California, the United States. The height interval of boys taller than 175 cm varied with age: at 14 years (n = 4) it was 176 to 181 cm; at 15 years (n = 6), it was 175.2 to 187.8 cm; at 16 years (n = 12) it was 175.4 to 187.9 cm; and at 17 years, it was 175.1 to 182.7 cm. For girls, the estimated mean adult height (155.33 cm) was near the mean height value at 16 years (155.17 cm) and at 17 years (155.49 cm). Based on the mean and standard deviation values for height in girls at the ages of 16 and 17 years (Table 2), it is probable that the studied girls might have nearly reached their adult height at these ages. All girls in the study were born and raised in Merida, Yucatan.
It is noteworthy that the available literature on stature in adult women and men from Yucatan includes much lower mean height values than those estimated by the PB 1 model with the present data. Height data ranges from 141.8 cm in women aged 35 to 65 years in rural communities of Yucatan 62 in the 1930s to 148.5 (±5.6) cm in women aged 18 to 30 years in Progreso and Merida 63 in 1993 to 1994. Among men, reported mean height values range from 155.4 cm in rural Yucatan 62 to 163 cm in men aged 20 to 49 years from the urban areas of Merida. 64 This agrees with a study of secular change in stature in Maya populations from Yucatan that reported 14 increased stature during the decades prior to 1995. These authors compared data for 743 adults (375 men and 368 women) between 17 and 80 years of age from Merida and Progreso, Yucatan, studied between 1993 and 1994 to height data from earlier reports of rural and urban populations from Yucatan (1930s and early 1990s). Adult men had stature ranging from 155 to 170 cm and adult women from 140 to <155 cm. These data fall within height ranges reported in the literature. 65 -68 Of particular note is that these data were primarily from poor socioeconomic groups in urban (Progreso and Merida) or rural environments in Yucatan. In contrast, the data used in the present study were collected from a much more socioeconomically diverse population. Quantifying any discrepancy in height, based on socioeconomic origins of the studied population will require further study; for instance, a recent study using a sample from socioeconomic background similar to those of the presently studied population found short height (<150 cm, below −1.65 standard deviation in height-for-age Z-score) in women (n = 206) from Merida, Yucatan (mean = 147.19 ± 5.39 cm). 17 Short stature of women (146.84 ± 4.58 cm, sample size = 57) was also reported in a study of the degree to which short stature in mothers was predictive of overweight in their children. 69
This apparent disparity between estimated adult height in children and adolescents in the present study and the adult populations reported elsewhere may be an artifact of generation. To begin studying this trend, we recorded height in a random selection of the participant’s parents (28 fathers and 30 mothers). Mean height values in these fathers (164.79 ± 7.38 cm, range = 153-180 cm) and mothers (149.57 ± 6.87 cm, range = 130-167.4 cm) were much lower than the mean height values in the studied boys and girls. Mean height values within these ranges have been reported recently in a study of adults (22-45 years of age) in a Maya population in Dzemul, a rural town in Yucatan: 159.0 ± 5.0 cm in men and 146.0 ± 6.0 cm in women. 70 In the light of intergenerational differences in mean height, it is best to state that the PB 1 model is principally used for fitting height growth curves, using cross-sectional data, and in the present study, it effectively estimated final height based on growth pattern in the boys and girls between 9 and 17 years of age. Future studies on the secular trend of adult height in men and women in Yucatan across generations would help to identify any tendencies in this parameter.
In the present study, urban boys were reasonably tall, but the girls had a relatively short height in comparison with height growth results obtained in other studies worldwide. 43 -51,54,56,61 Of the 975 participants (475 boys and 500 girls), the frequency of stunting was higher among girls (19.2%) than among boys (13.5%). This corresponds to differential rates of stunting as reported previously in the same population. 28,29 In a subsample of 283 adolescents (127 boys and 156 girls) aged 12 to 16 years, drawn from the same database, frequency of stunting again was higher among girls (14.74%) than boys (6.3%). 28 A similar trend was observed in another subsample from the same database. This time a sample of 321 adolescents (156 boys and 165 girls) aged 15 to 17 years was studied: stunting was 18% in girls and 7.7% in boys. 29 In a further observation on mean values of KHR in the present study, sex difference was not significant at 9 and 10 years of age. Mean values of KHR were higher in boys than in girls with significant sex difference from 11 years of age onward. However, distribution of mean values of KHR by age and sex did not show any particular pattern. In other words, the lower leg segment to height proportion differed between boys and girls, but higher frequency of stunting in girls was not observed to be related to any differences in the length of the lower leg segment.
In a previous study, differential height growth at puberty in boys and girls from Britain, Belgium, rural and urban India, Australia, and Africa was interpreted in the context of socioeconomic environments. 50 Biological parameters of height growth events as estimated by the PB 1 model showed that rural Indian, Australian Aboriginal, and African (Gambian) boys and girls lived in adverse environmental conditions, which were reflected in their slower velocities of childhood growth, smaller PHVs (except for the Australian sample), compared to the Guatemalan, British, and Belgian children.
In the present study, participants’ household SES was heterogeneous, but it was generally higher than poverty levels in Yucatan based on government data. 71,72 As mentioned earlier, we could not use the SES data to estimate differential height and KH growth characteristics due to insufficient sample size by age, sex, and SES groups. Previous studies based on the same database reported remarkable association between height and SES in adolescent boys and girls from Merida. 28 -31 Participants representing 2 separate subsamples of 12 to 16 years and 15 to 17 years of age with higher household SES (as determined by proxy indicators including parents’ age, education, school types of the participants, monthly household food expenditure) were taller than peers with relatively lower SES. 28,29 In a study among 9- to 17-year old boys and girls, proxy SES indicators were maternal education, school types of participants, household crowding index (number of family members per bedroom), monthly income and employment status (employer, employee, or self-employed), toilet use, and access to potable water. 30 Low SES negatively affected height and KH growth among the participants. In that study, Maya ancestry of the participants was determined based on number of Maya surnames (2, 1, or none). Ancestry had no effects on KH and KHR but was found to be negatively associated with height (individuals with 2 Maya surnames were shorter in height by age and sex than others). It was also reported that adolescents (16- to 17-year-old boys and girls) from higher SES were taller and had longer KH than peers representing lower SES. 31 However, none of these studies 28 -31 estimated height and KH growth patterns using the PB 1 model.
Study Limitations
Lack of data for younger age-groups (<9 years) limited our ability to estimate other important biological parameters for height and KH, such as age at takeoff and mean values of height and KH for age at takeoff using PB 1 model. This prevented us from calculating other parameters such as duration of spurt, differences in size and growth velocity at takeoff and at maximum increment, percentage of adult size at takeoff, and so on. In addition, data for individuals aged 18 years and older would also help us to unequivocally identify attainment of final size for height and KH and compare it to the values estimated with the PB 1 model. Finally, the paucity of comparable data from Mexico hinders our ability to more precisely define functional parameters. Based on our literature review, it can be stated that leg length as a sensitive biomarker of environmental conditions particularly between birth and ∼10 years of age might be related to the growth of linear body dimensions in adolescence and thereby explain the fact of being short in adult height in any population that had experienced socioeconomic marginalization for long time. In the present study, we presumed that KH growth in adolescence could explain the same in the data from Yucatan having similar historical background of the population as stated in Introduction. However, the results did not show any probable impacts of nutritional insults on height growth, particularly before 10 years of age. The participants, particularly boys, achieved substantial amount of final size in height and KH when compared with previous reports on adult height from the region.
Conclusion and Future Research
The present results are important new data on pubertal growth characteristics of height and KH for children and adolescents from Merida, Mexico. Compared to previous reports from the populations of different countries other than Mexico, growth patterns for these 2 anthropometric parameters are within reported ranges for boys. However, height growth in girls was notably lower than reported in other studies in which PB 1 model has been applied to estimate height growth timing and tempo. Yucatan’s population clearly manifests a generally short height with respect to other populations worldwide, but the reason for this phenomenon, be it genetic background or due to the short lower leg length caused by chronic energy deficiency, is still unclear. As mentioned in Introduction, life histories involving chronic undernutrition in Yucatan’s population, irrespective of rural or relatively newly developed urban sectors, might be the other reasons behind this occurrence. Other issues remain unresolved, including the meagre difference in KHR between boys and girls and the lack of a broader data library with which to make comparisons and reach conclusions. These and other issues will be addressed in future research. In summary, when compared to height, KH was found to exhibit an earlier adolescent growth spurt in terms of earlier age at maximum increment, lower peak velocity, and a smaller difference between final size and size at maximum (peak) velocity. These indicate that the participants reached adult size at an early age.
Footnotes
Acknowledgments
The data reported in this article were collected and analyzed as part of a research project financed by CONACYT (Grant No 59994-H), Mexico. The authors thank Mr Armando Rojas and Ms Graciela Valentín (Cinvestav-IPN, Merida) for their assistance during fieldwork and data collection.
Declaration of Conflicting Interests
The author(s) declared no potential conflicts of interest with respect to the research, authorship, and/or publication of this article.
Funding
The author(s) disclosed receipt of the following financial support for the research, authorship, and/or publication of this article: financed by CONACYT (Grant No 59994-H), Mexico.