
Abstract
Background:
Height is essential for assessing growth and nutrition in children. Assessing height with appropriate measurement is important, although in certain physically disabled and hospitalized children direct height measurement is almost not possible. In these situations, segmental measurements can be used as proxy height. Knee height (KH) has been determined as the most reliable surrogate.
Objective:
This study aimed to establish a height-predicted equation using KH for use in both community and clinical practices.
Methods:
This was a cross-sectional study design that collected data from 1114 healthy children (596 boys and 518 girls) aged 7 to 12 years to develop the equations for predicting height from KH. A multiple linear regression analysis was used to develop the equations.
Results:
Two equations were established to predict height using KH: (1) for boys H = 29.895 + (0.081 × age [months] + (2.267 × KH)) and (2) for girls H = 26.297 + (0.110 × age [months] + (2.278 × KH)). The very high correlation between KH and actual height indicates a very strong agreement.
Conclusions:
Knee height can be used for prediction equations for height with a very good predictive power. The age variable using the month unit generates a more accurate equation.
Introduction
Height is the main indicator of a child’s health. Assessing children’s height with appropriate measurement is basic, crucial, and important to monitor growth. 1 -3 In addition to assessing growth, height, which is used as one of the values to calculate body proportions through a calculation of a body mass index (BMI) or body weight/height, is important to identify the nutritional status; presence of endocrine, metabolic, genetic, and psychosocial disorders; and chronic diseases. Height can also estimate the consequences of an illness, calculate drug dosages, assess fluid balance, and determine medical equipment and resuscitation settings. 1,4 Other uses are to assess energy requirements using equations (Schofield) and to estimate lung function and glomerular filtration rate. 5,6
A correct and accurate measurement technique is important for determining an effective child’s height assessment and is compromised without this precision. 1,7 Height measurements in children have been carried out routinely using classic anthropometric measurement methods. 5 For children aged 2 years or older, standing height measurement is recommended. 8 The most commonly used method to measure height is using a height board measurement tool (stadiometer) or microtoise. Height measurement depends on children who are able to stand straight and work closely with the examiner so that the measurement can be taken precisely, reliably, and without any difficulty. 7,9 This measurement results in a child’s actual height. The result was interpreted by comparing them with World Health Organization (WHO) standard growth curves or other references according to gender and age. 8
Difficulty in measuring height will arise when measuring a child who cannot stand or stand straight, likewise in children with physical disabilities. Limitations of these conditions can be temporary, such as in children who are being treated in a hospital—the emergency room, intensive care room, or other wards—and postsurgical treatments, or continuous conditions such as in children who need permanent aids because of their limitations or because of persistent diseases. 10 Many researchers have acknowledged difficulties in obtaining accurate assessments of height in those children groups or in those with kyphosis or scoliosis. 11 -14 Some researchers investigating nutritional status chose not to record height, while others have results that may underestimate height. 14 The study in Sweden and Norway found that 20% height in children with disabilities had to be discarded because of lack of reliability. 12 The reliable measurements of either recumbent length or height were unable to be obtained in 52% of a clinical population of children with cerebral palsy. 15 On the other hand, maintenance of nutritional status which is based on height measurements for these children is important for maintaining their health and quality of life. 16
The 2004 Global Burden of Disease found that 15.3% of the world’s population had moderate or severe disabilities. In the population of children aged 0 to 14 years, the prevalence is 5.1%. 17 In Indonesia, the population census in 2015 indicated that residents aged 10 years and older are experiencing disabilities of around 8.56% nationally. The population aged 10 years and older who have difficulty walking or climbing stairs was 3.76% or around 9.6 million people, of which an estimated one-third (3.2 million) was children. 18 Other data showed that the prevalence in children aged 2 years or older who suffer from walking disorders is 1.43% (1.3 million). 19 Moreover, the latest data from the 2018 basic health research stated that children with disabilities aged 5 to 17 years were 3.3% (3 million) of the population. 20
Children with physical disabilities have the potential to have their height not be measured by normal methods. An alternative method of measurement is needed to measure the approximate height that replaces the actual height measurement. 21 The best index of predicted height is one that changes little with age or disease. 22 Long bones of the body are selected as the best indicator for the purpose. 23 Measurement of a long bone, such as KH, tibial length (TL), upper arm length (UAL), arm span (AS), and ulna length (UL), is known as a segmental length measurement. 6,23,24
Of the alternative segmental length measurements, many researchers most recommend the use of KH measurements. Height can be estimated accurately through KH measurements because KH is the longest segment (30%) of height and is overall unaffected by shrinkage. 16 Meanwhile, other researchers stated that KH measurements are better compared to the length of UAL to estimate height because it is longer in size than the ulna bone, especially the measurement of UAL can be affected by the reduced mobility of the arm or shoulder joint. 22,25 Another superiority of KH measurement is that it is easier to measure compared to other segmental measurements such as sitting height and knee buttocks length. The measurements can be done in both sitting and lying positions with one examiner so that it is simple to do and reduces interobserver errors and reproducible; moreover, the landmarks are obviously identified. 5,15,16,22
The results of the KH measurement are then used to create the predicted height equation. Chumlea developed the equations based on KH measurement of normal children aged 6 to 18 years. Children were taken from data from the US National Health Examination Survey Cycles I, I, and III in 1960 to 1970 with a total number of 13 821 children. This study divides the KH equation based on gender, age, and race (Caucasian and African American). 5,16 At present, the Chumlea equation is the most commonly used worldwide as a reference. 16 Another recent equation was produced by Gauld as a result of measurements of 1144 healthy children aged 7 to 18 years in Australia. The participants were racial mix students. 6
Meanwhile, the WHO Expert Committee on Physical Status emphasizes the importance of reference models for each country in predicting height based on gender and age when the standard equation is not established yet. 26 Investigation of Gauld in line with WHO recommendation developed different predicted equations based on race differences (Caucasian and Asian subpopulation). The researchers did that because of the anthropometrically distinct subpopulation of Asian children. 6
The equation predicting height from knee height (KH) measurement in children has been developed in other countries but not established yet in Indonesian children. The purpose of this study was to develop a valid and reliable equation for predicting height using KH measurement of a normative sample of nondisabled, healthy 7- to 12-year-old Indonesian children. The goal of these equations was to cover a larger group range and to be simple enough for daily use. The equations will be used for children in a community setting and who are hospitalized who cannot be measured for height directly.
Methods
Study Design and Participants
The study used a cross-sectional study design. The multistage clustered randomized process was conducted between August and November 2019. Random clusters were selected first at the subdistrict level, second at the school level, and then at the class level. Six elementary schools were selected from 3 (of 30) subdistricts in Bandung City West Java Province of Indonesia. From each elementary school, 6 classes from grade 1 to grade 6 are determined. The students of the selected classes were stipulated as participants. Age was calculated in months for the day of measurement. They were divided into age-groups according to the grade of each child at the moment of the survey. Participants dress in light clothing (wore light short pants and shirt only) and were barefooted. 27 The same anthropometric equipment was used for each student. Two observers obtained all measurements. All measurements that were obtained during the study were made in schools. Data collection on general and socioeconomic characteristics was carried out at the school 3 days before anthropometry measurement. Classification of participant’s economic status (ES) consisted of parental financial status. Parental financial status was classified based on Indonesian Central Agency on Statistics Classification, namely, the low ES if the average income was <IDR 1.500.000 (<$107 US) per month, moderate ES if the average income was between IDR 1.500.000 and <IDR 2.500.000 ($107-<$180 US) per month, high ES if the average income was between IDR 2.500.000 and <IDR 3.500.000 ($180-<$250 US) per month, and very high ES if the average income was more than IDR 3.500.00 (>$250 US) per month. 28,29
Inclusion and Exclusion Criteria
Healthy, nondisabled children aged 7 to 12 years (84-155 months) who are attending elementary school in Bandung city and able to stand up straight were eligible for inclusion in the study. Each student underwent a brief medical examination of the spine. Children with scoliosis and kyphosis were excluded. Scoliosis and kyphosis are spinal curvature disorders that can lead to a loss of standing height. 30,31 The kyphotic deformity may be visible on basic inspection and palpitation. Physical examination by the Adam’s forward bend test was also done to screen scoliosis and kyphosis deformities. As the patient bends forward with feet together, knees straight, and arms hanging free, the examiner looks from behind and from the side, horizontally along the contour of the back. A rotational deformity known as a rib hump can be easily identified. 32,33 Congenital lower extremity diseases that can cause the same disruption to normal height were excluded too. Stunting and severe stunting children were excluded to avoid the influence of abnormal height on the equations. 34,35
Anthropometry
To maintain clarity of terms, height refers to the distance from the floor to the top of the head in a standing child measured with a General Care portable stadiometer, which was measured to the last completed millimeter (accurate to 0.1 cm). 36 Weight was measured by the participant standing on Seca 803 digital weighing scales, to the nearest 0.1 kg. 37 Both measures were assessed according to standards recommended by WHO. 27,38
Knee height refers to the distance from the base of the heel to the anterior surface of the thigh over the femoral condyles. 5,16,22,39,40 To measure KH, the participant was in the supine position, with both the left knee and the ankle joints flexed at an angle of 90°. 5,15,21,22,26,41 The angles were checked using triangle. 41 The caliper opened and place the fixed blade under the heel. The sliding blade pressed down against the tight about 2 inches behind the knee cap (patella). The shaft of caliper was placed in line with the large bone in the lower leg (tibia) and over the ankle bone (lateral malleolus). The measurement read to the nearest 0.1 cm. The process was repeated to take a second measurement. 5,41 Knee height was measured with the Vernier sliding caliper (Krisbow 500). The caliper accuracy was up to 0.05 mm.
The Vernier caliper was calibrated with a grade 1 gauge block according to the JIS B 7507-1993 calibration procedure by Metal Industries Development Center, Ministry of Industry. The range of error was −0.0005 to 0.09 mm. Portable stadiometer for height measurement was calibrated using standard linear measure according to JIS B 7516 (2005) calibration procedure. Meanwhile, the direct comparison method to reference weight standard was used to calibrate the weight scale according to OIML R76 (2006) procedure. Stadiometer and weight scale were calibrated by Metrology Directorate, Ministry of Trade.
To standardized methods, the researchers developed measurement guidelines. Height and weight measurement guidelines are in line with WHO guidelines. 38,42,43 Meanwhile, KH measurement guideline was in accord with international references. 5,15,16,21,40,41 The guidelines were reviewed by researchers and experts who have expertise in children’s growth.
Two researchers (F and R), who were intended tool guidelines users, were educated on the practice guidelines during a 4-hour in-service by the Ministry of Industry and Ministry of Trade officers. The researchers had 10 to 12 years in measuring children and measured 40 to 90 children per week. Supervisors and experts with an experience of 13 to 27 years in educating in children’s growth and anthropometric measurements supervised the use of guidelines.
Data Analysis
Body mass index (kg/m2) was calculated by dividing the measured weight (kg) by the square of height (m). Anthropometric parameters were classified using WHO growth reference for 5 to 19 years. 35 Weight-for-age z-scores (WAZ), height-for-age z-scores (HAZ), and BMI-for-age-z-scores (BAZ) were calculated using the software WHO Anthroplus version 1.0.4. 44 A cutoff point score <−2.00 SD for WAZ, HAZ, and BAZ was used to classify wasting, stunting, and thinness, respectively. A cutoff point z-score +1 SD to +2 SD, or > + 2 SD for BAZ was used to classify overweight and obese, respectively.
Statistical Analyses
The data were stored and analyzed using the Statistical Package for Social Sciences (SPSS for Windows Version 24) software. All variables were tested for normality by histograms and the absolute values of skewness and kurtosis. 45 Those analyses showed that all variables considered were normally distributed. P value ≤ .05 was adopted as the level of statistical significance. Descriptive statistics was analyzed by providing total statistical measure and percentage for categorical data, while for numeric data was performed by providing the mean, median, and range.
Before data collection, the pilot study was done for quality assurance objectives. There must be a set limit of agreement between repeated height and KH measurements (0.3-0.5 cm), weight measurement (0.1 kg), and good inter- and intra-rater reliability (>0.8). 46 For that purpose, 30 convenience sample of participants had their height, weight, and KH measured by researcher 1 (F) as a rater and researcher 2 (R). They were measured on accurately installed and calibrated instruments under standard conditions in nonblind and successive order.
The range of differences between the two height, weight, and KH measurements for the researcher 1 (F) were 0 to 0.1 cm (mean 0.03 cm), 0 to 0.1 kg (mean 0.01 kg), and 0 to 0.2 cm (mean 0.04 cm), respectively. The range of differences between the 2 height, weight, and KH measurements for researcher 2 (R) were 0 to 0.1 cm (mean 0.009 cm), 0-0.1 kg (mean 0.03 kg), and 0 to 0.3 cm (mean 0.03 cm), respectively.
The range of differences between the 2 height, weight, and KH measurements of 2 researchers (F and R) were 0 to 0.15 cm (M 0.02 cm), 0 to 0.1 kg (0.03 kg), and 0 to 0.1 cm (0.007 cm). The pilot study testing by Pearson’s correlation analysis revealed that the intra-examiner reliability of measurements was > 0.99 for 2 measurements, and the interexaminer reliabilities were 1.
The next step for analysis was by performing a linear regression to determine the equation for estimation of body height according to KH. Then, the predicted height will be compared to actual height. The agreement between the predicted height produced from the equations was determined by Concordance Correlation Coefficient (CCC) analysis. 47
Ethical Considerations
This study was approved by the institutional review board of the Research Ethics Committee of Faculty of Medicine Universitas Padjadjaran Bandung Indonesia. Written informed consent and written acceptance to participate were obtained from all parents of the participants or legal guardians, witnessed and signed by school teachers.
Results
Based on the data from 6 selected schools, there were 1279 children aged 7 to 12 years. Of those, 165 children were excluded from the study as shown in Figure 1. The study included 1114 participants, and 596 (53.5%) were boys who met the inclusion criteria. Table 1 shows the socioeconomic and nutritional characteristics of the participants. The prevalence of overweight was around 7.2%, and obesity was 5.1% for both boys and girls, respectively. Table 2 presents the anthropometry status of the study population. For both sexes, there were no statistical differences in variables: height (P = .180), weight (P = .583), knee height (P = .328), or BMI (P = .672).
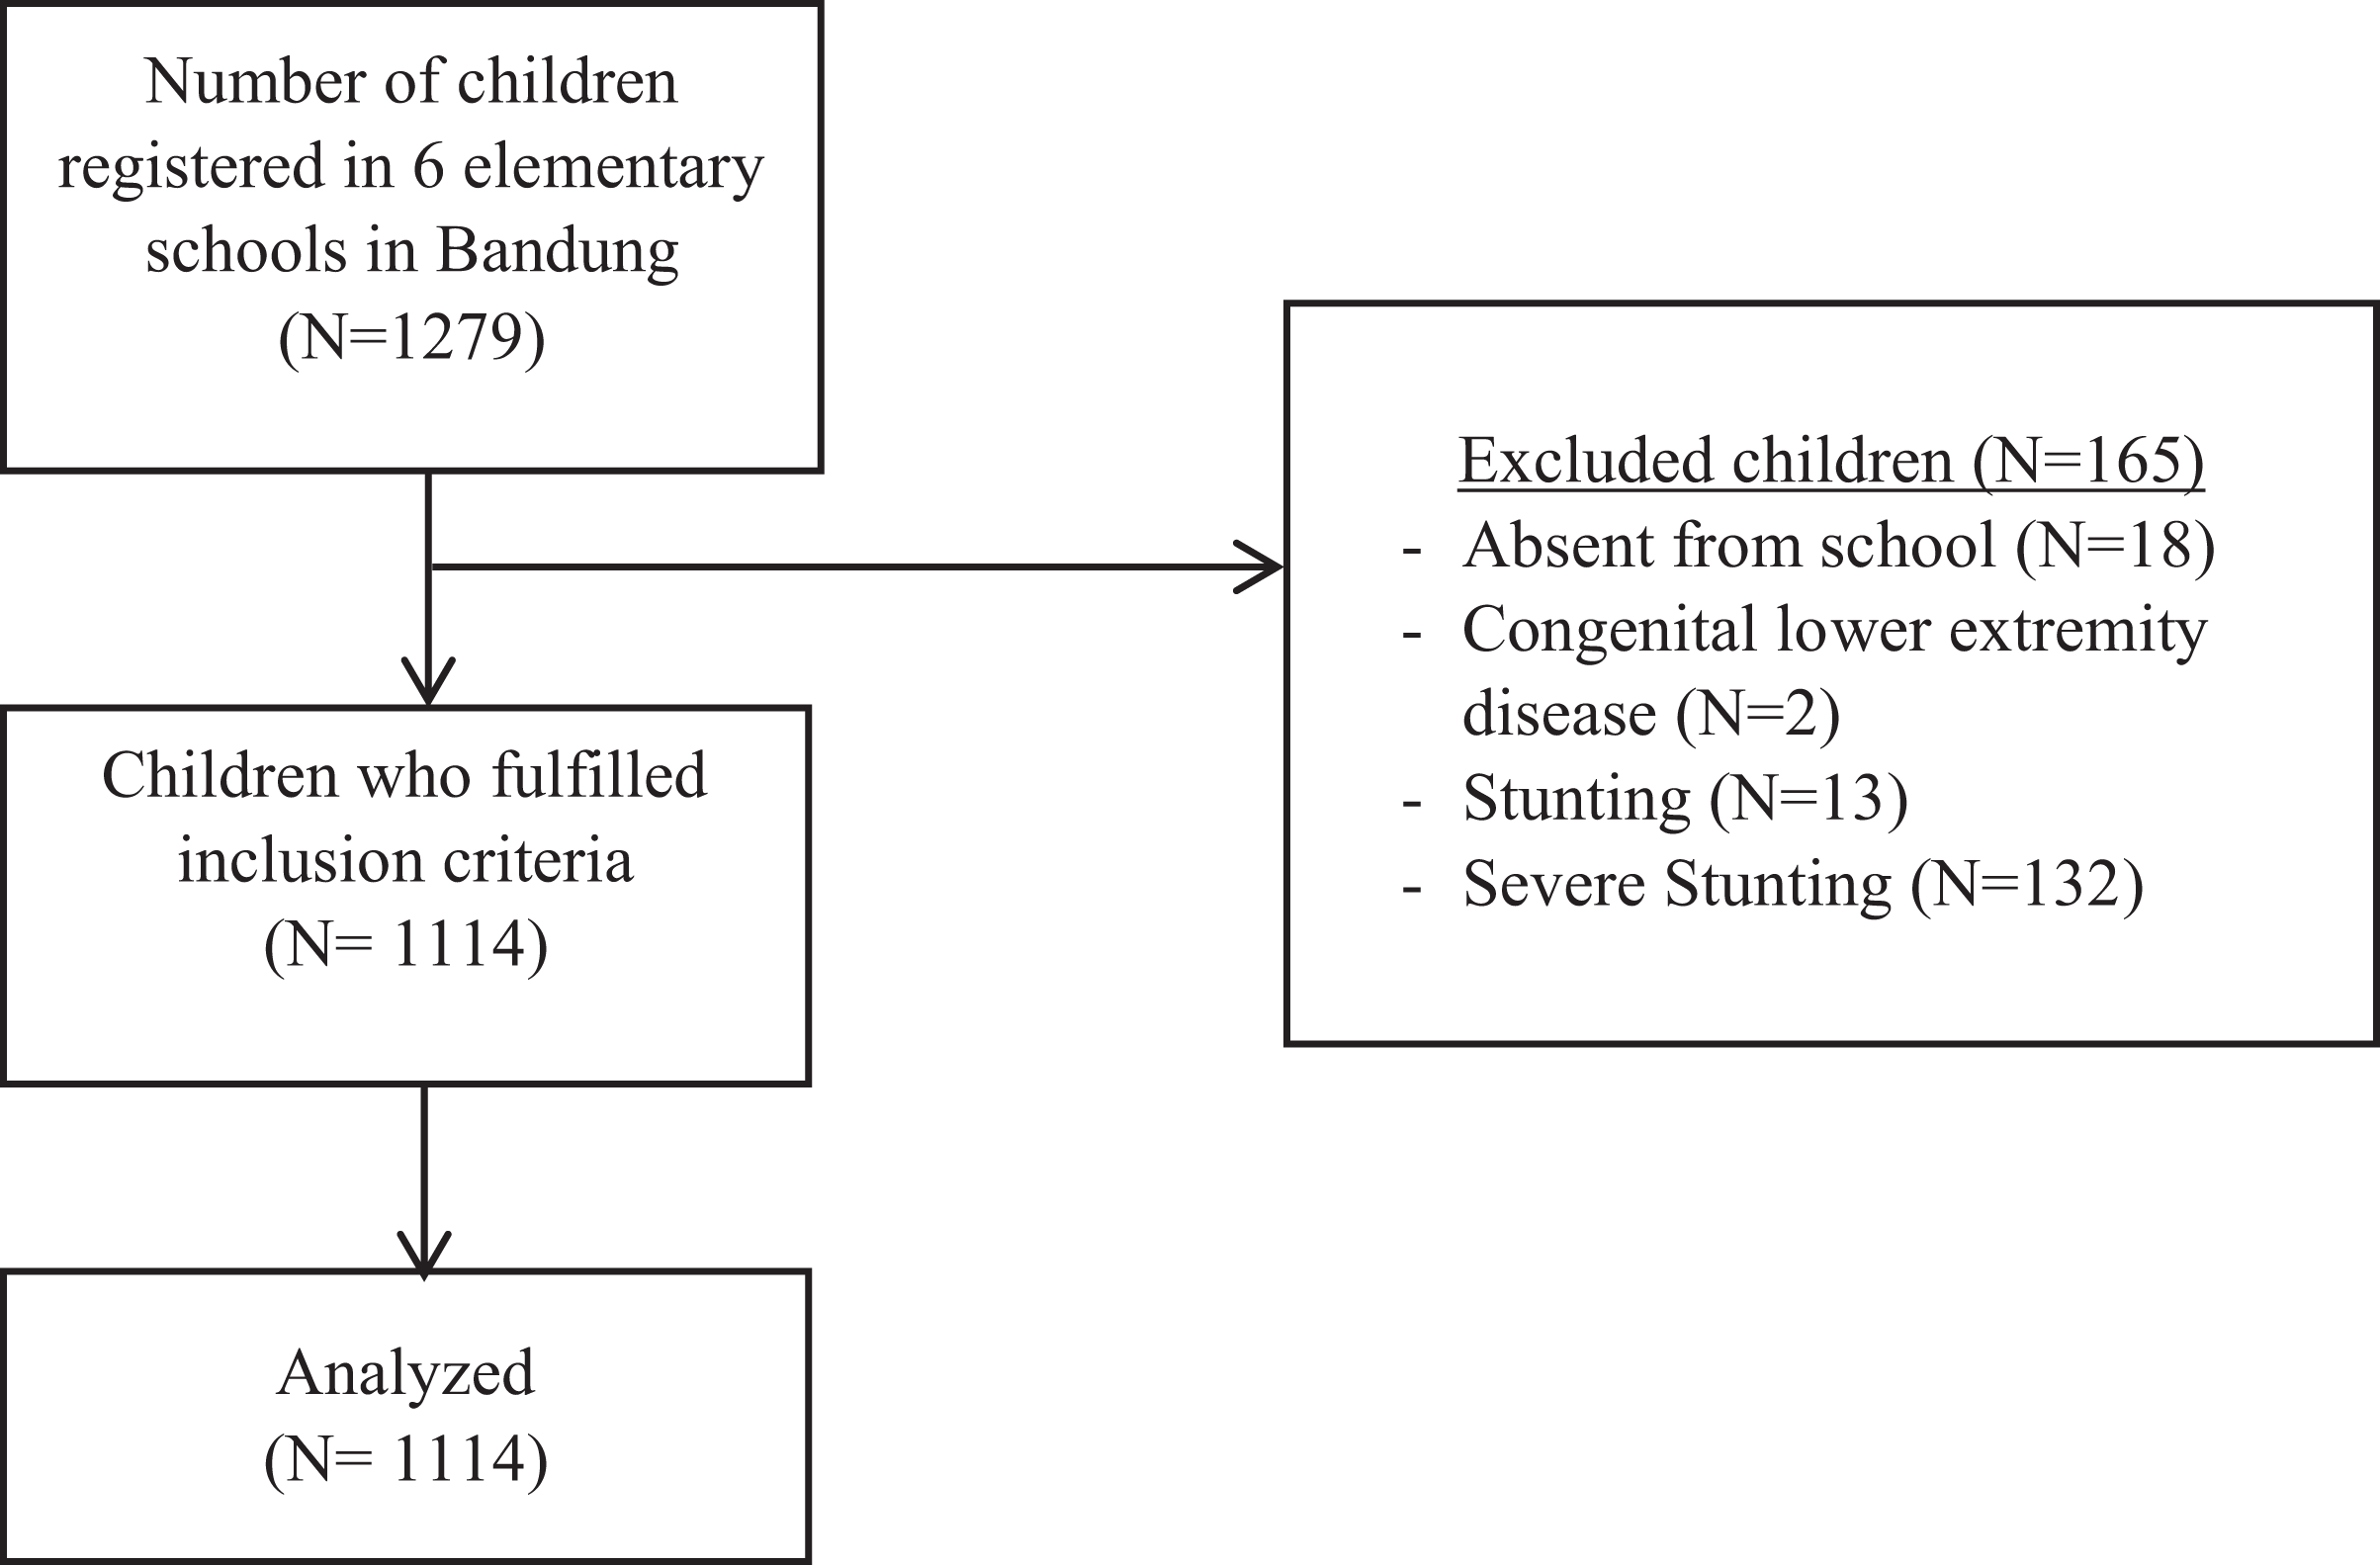
Participant selection flow.
Socioeconomic and Nutritional Characteristics of the Study Population.
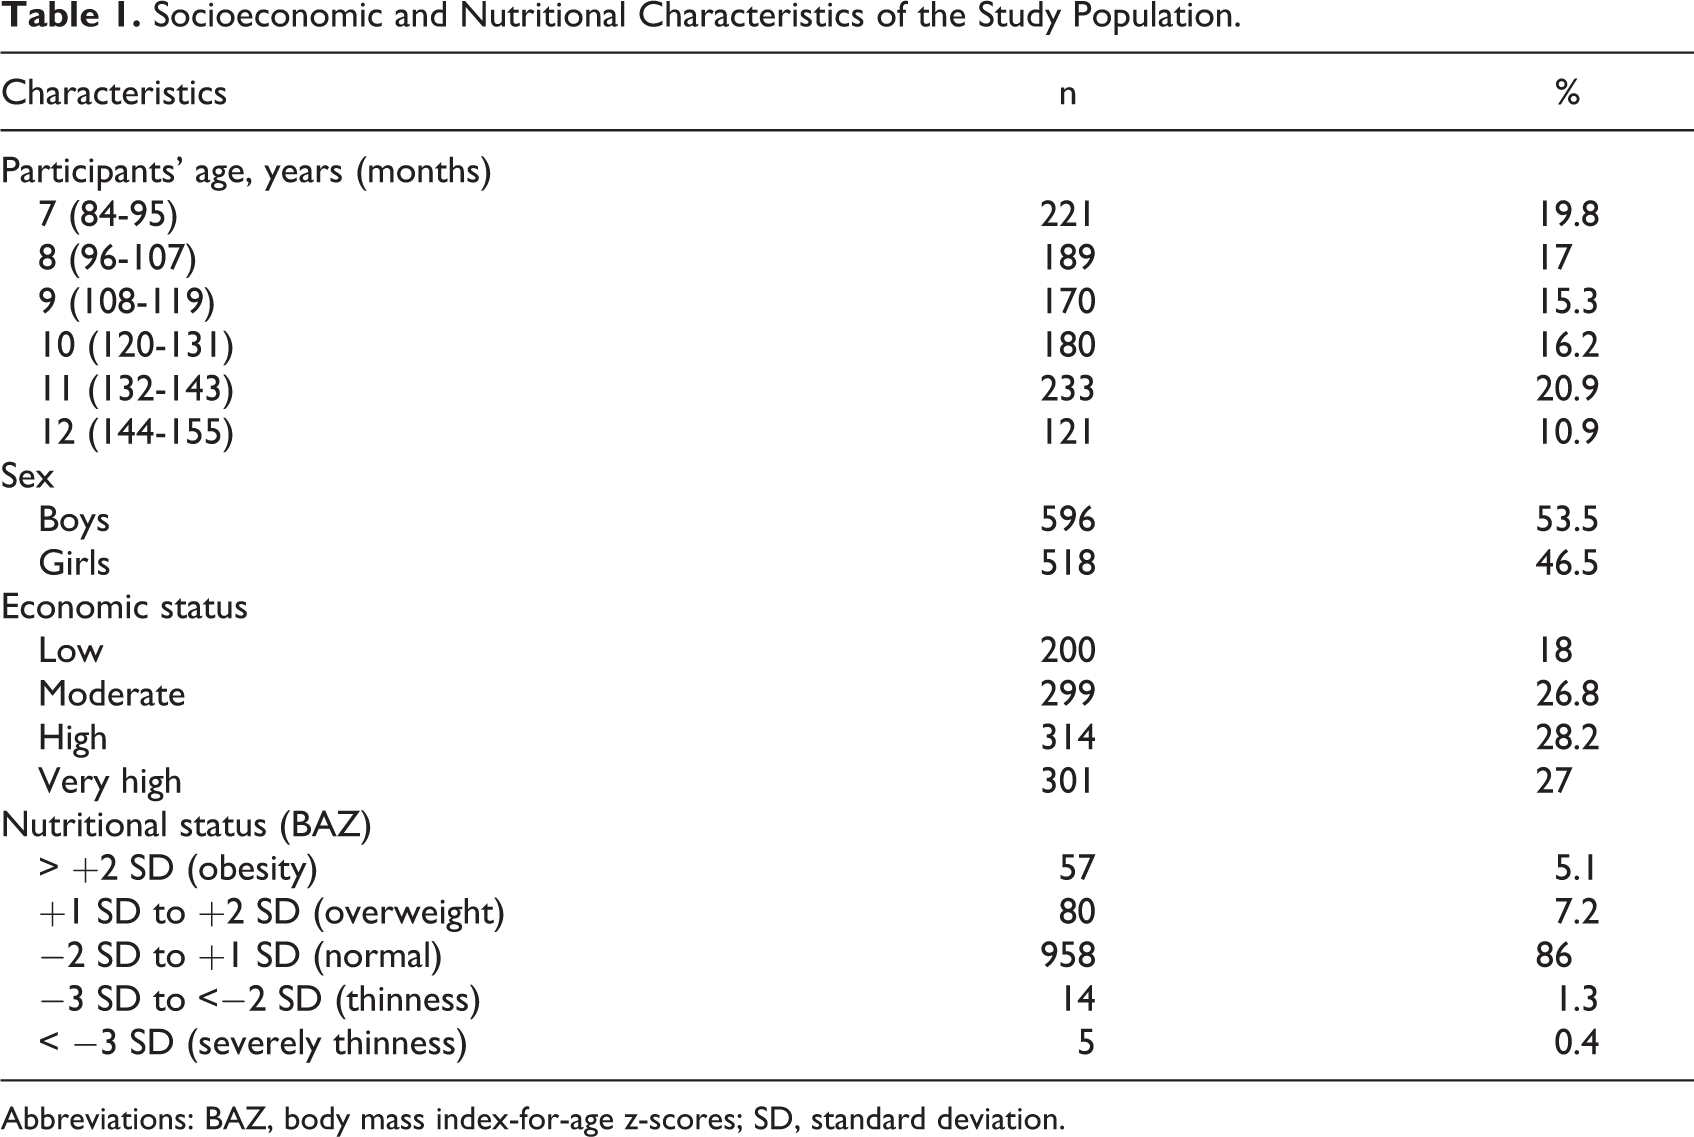
Abbreviations: BAZ, body mass index-for-age z-scores; SD, standard deviation.
Anthropometry Status of study Population.
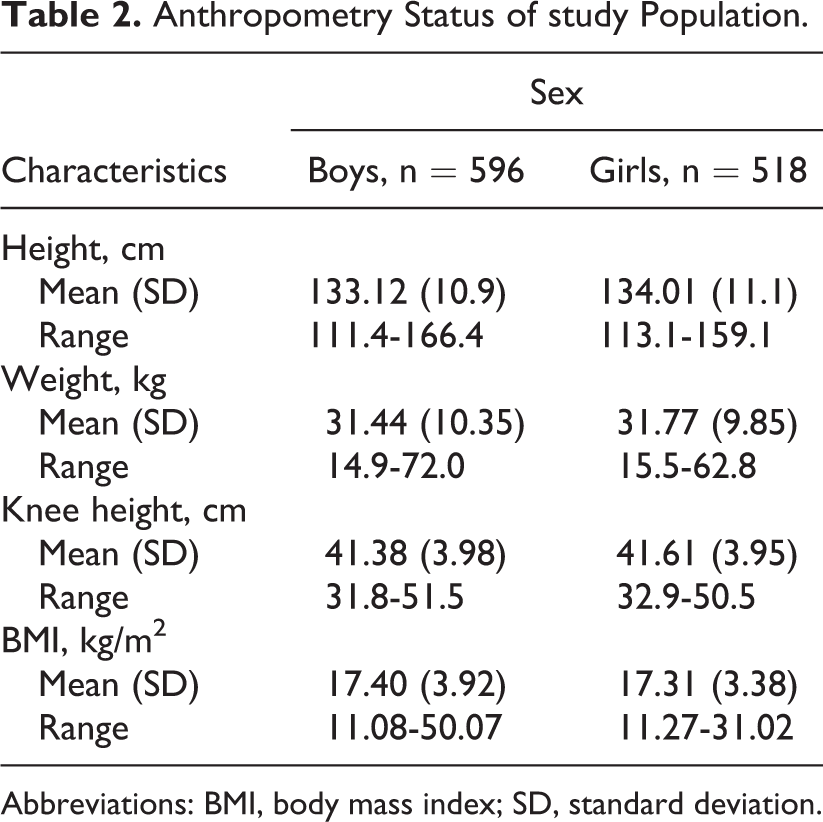
Abbreviations: BMI, body mass index; SD, standard deviation.
Data of each anthropometric parameter are presented in Table 3, including gender and age arranged separately. Estimates of mean, standard deviation (SD), range, and the 5th, 50th, and 95th percentile are included. With respect to the growth patterns, comparison between height and KH in linear growth rate, the curve shows a very similar pattern as can be seen in Figure 2.
Height and KH of Participant’s Percentiles 5, 50, and 95.
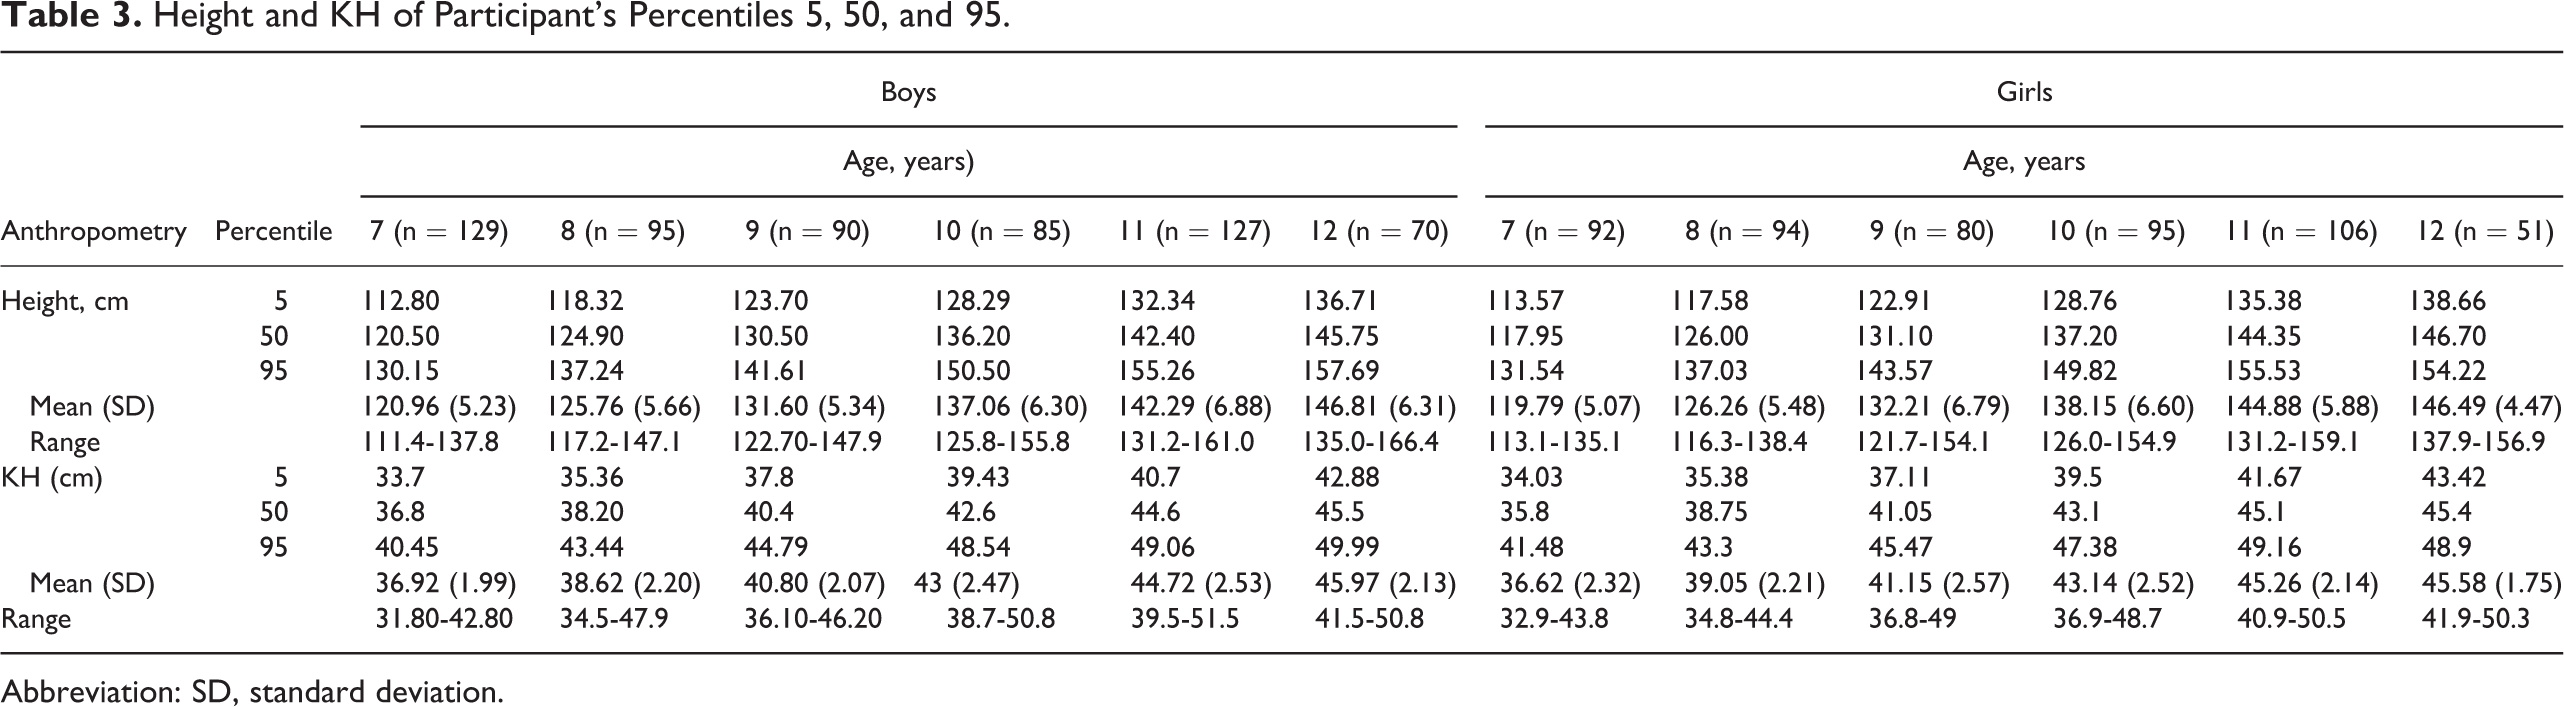
Abbreviation: SD, standard deviation.
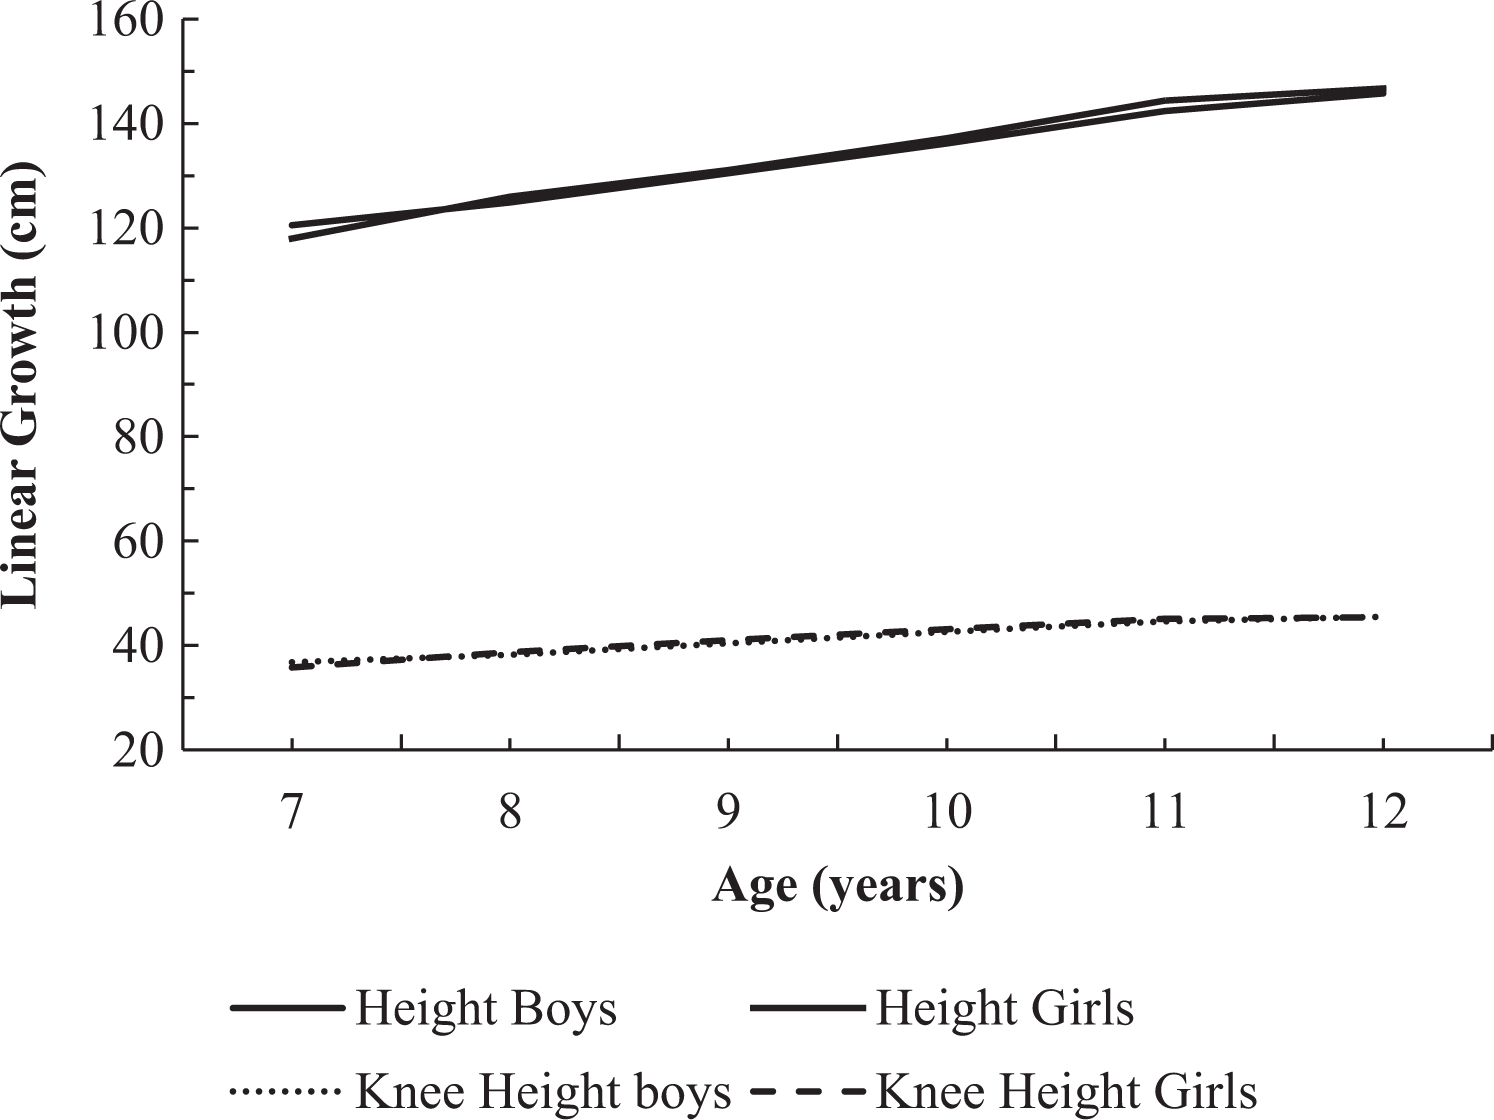
Comparison between height and knee height (KH) in linear growth rate pattern.
To develop the predictive equations, an analysis of height, KH combined with gender and age as covariates, was performed in a multiple linear regression model (Table 4). Covariate age was in the form of months-old unit instead of years to improve the accuracy of prediction. The R2, adjusted R2, root mean square error (RMSE), and standard error of estimate (SEE) were also analyzed. 48 The results are shown in Table 5.
Recommended Equations for Predicting Height From KH in Children (84-155 Months of Age).
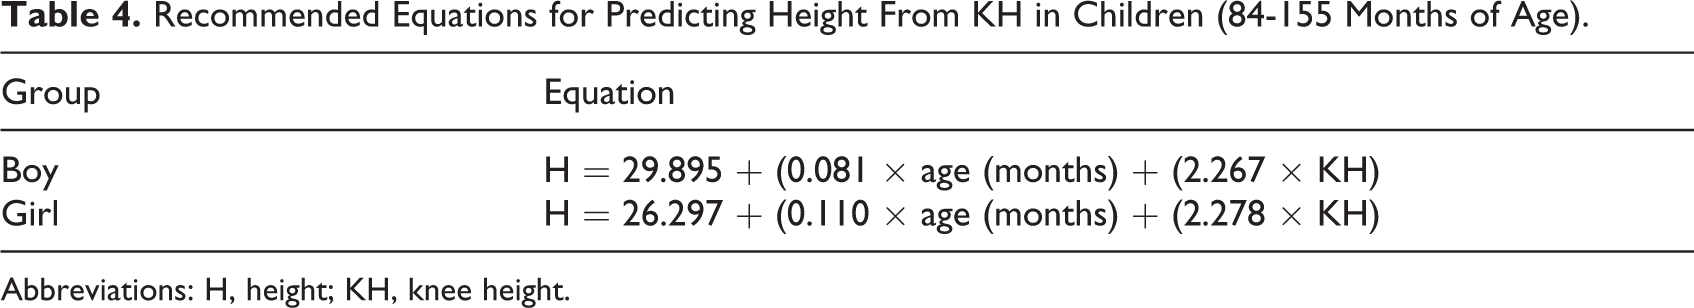
Abbreviations: H, height; KH, knee height.
Goodness-of-Fit Analysis: Linear Regression Between Height and KH.
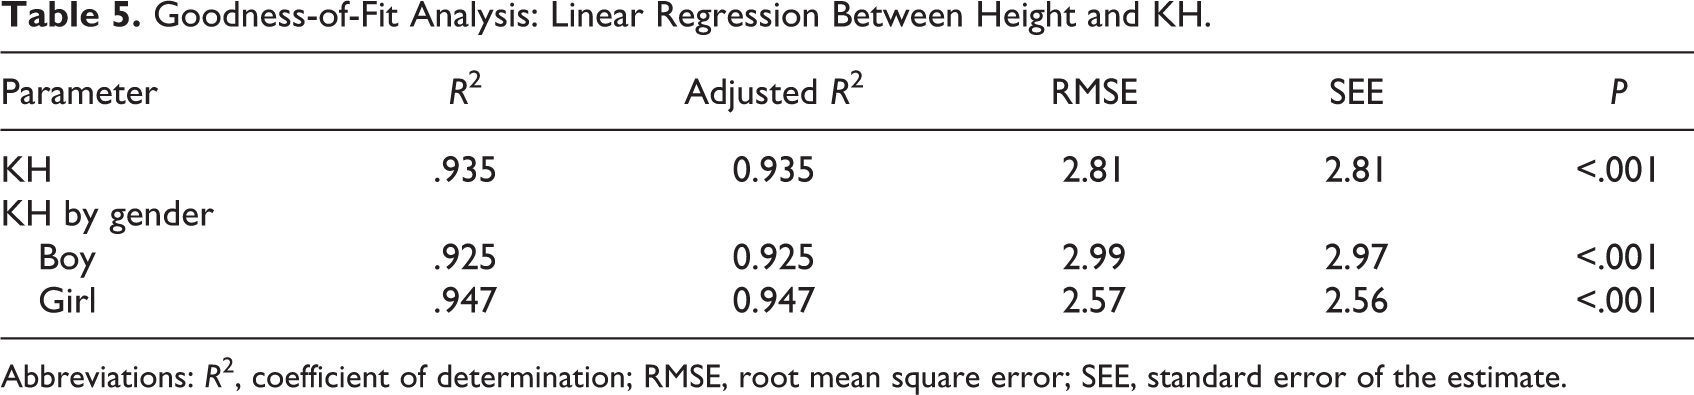
Abbreviations: R2, coefficient of determination; RMSE, root mean square error; SEE, standard error of the estimate.
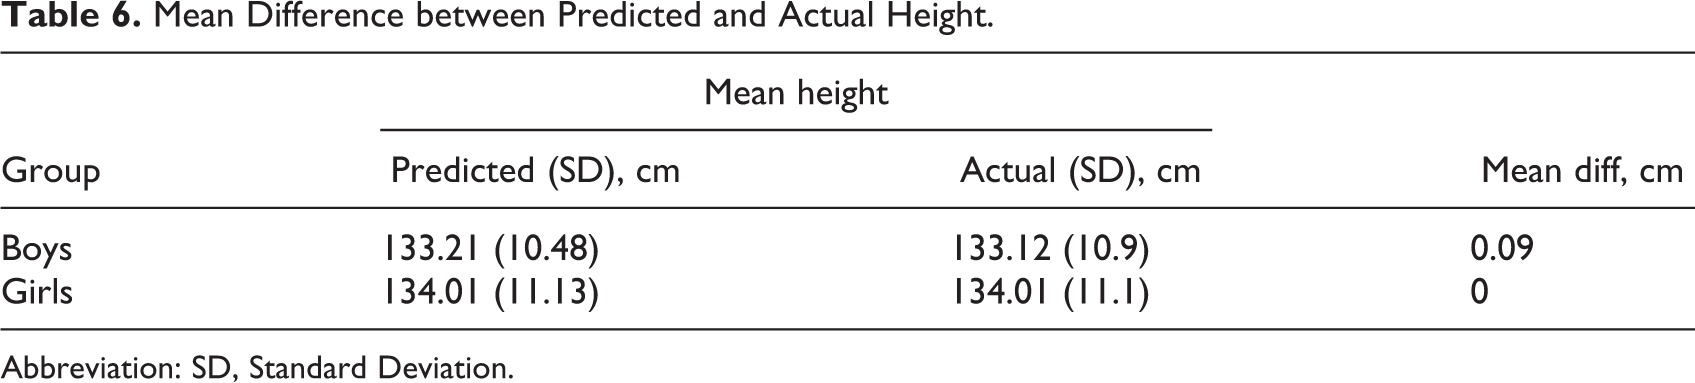
The coefficient of determination for each equation was found to be very high (R2 = .925 in boys, and R2 = .947 in girls). Whether sex not included as an independent factor, the RMSE was 2.81 cm. Plus or minus twice RMSE (± 5.62 cm) produces the 95% error bound for an equation regarding the prediction of height for a group. The SEE was 2.81 cm. The SEE of 2.81 cm indicates that the height predicted from the equation will be within 2 SEEs (± 5.62 cm) 95% of the time. The SEE is used when an equation is applied to a single child. When sex was included as an additional covariate, the SEE and RMSE in girls became smaller, but the values in boys were greater. The SEE and RMSE in girls were smaller than in boys, indicating that the equation in girls had a smaller error than that of in boys. From this analysis, the equations were developed for each gender (Table 5). The mean difference of value for each equation is displayed in Table 6.
Mean Difference between Predicted and Actual Height.
Abbreviation: SD, Standard Deviation.
Table 6 showed that there were no significant differences between actual and predicted height; moreover, there is no height difference in the girls group. Concordance correlation coefficient between predicted and actual height for each equation is displayed in Table 7.
Concordance Correlation Coefficient Between Predicted and Actual Height.
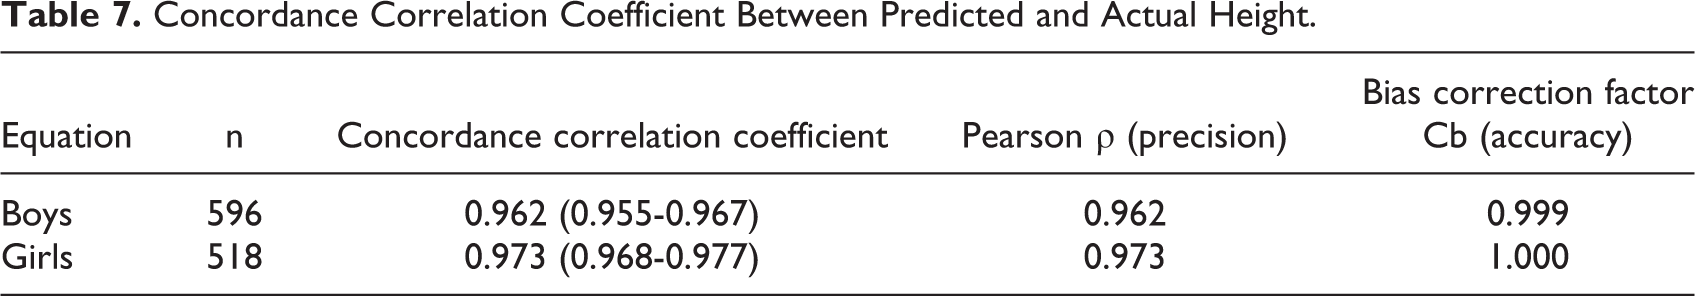
Conformity analysis according to CCC showed that the results in boys were 0.962 with 0.962 precision and 0.999 accuracy and in girls was 0.973 with 0.973 precision and 1.0 accuracy, respectively.
Discussion
Height is an essential part of growth monitoring and nutritional status in children, 3,48 although in some situations height measurement cannot be done accurately. In certain physically disabled and hospitalized children, for instance, direct height measurement is not possible. In these situations, some other anthropometric measurement that measures segmental body can be used as a proxies height. Knee height is the most reliable of that measurement as reflected by the low technical error and ease of measurement in either setting from a variety of body positions regardless of mobility status. 16 Moreover, KH is more precise than other segmental measures, and current reliability data are available. 15,16,22,25 Knee height has been suggested as the best alternative measure of stature in the severely handicapped individual. 48
This study is significant because it derives its height prediction equation using KH in children. KH presented a very strong correlation with height. Importantly, this is the first wide sample anthropometric data of Indonesian children with a focus on the KH measurement dimension. Only a few studies have had sample sizes equivalent to the current study such as the study in Australia. 6 Compared to Chumlea study that used the out-of-date secondary data to produce height equations based on KH, this research is superior. 16
An ideal KH measurement is using two similar devices known as knemometer and portable anthropometer. Both models can be used to measure KH in children >3 years old. 49 If those are not available they can be replaced with Vernier caliper, which was used in this study. 6,48 From some studies, this surrogate measurement proved to be accurate compared to more expensive instruments. 50,51 Moreover, the accuracy of estimation of stature from KH in their study was not affected significantly by the type of caliper nor associated with observer errors but would be expected to be larger if less rigorous attention was given to the measurement technique. 50 Other studies have found similar results. 51,52 The study found that the use of a Vernier caliper to measure KH was simple, caused minimal disturbance to the participants, easier to obtain, and an inexpensive method. Vernier caliper is commercially available, and at the time of writing, the cost of Vernier caliper was about $150, approximately 70 times less than that of the handheld electronic knemometer and 10 times less than that of anthropometer. The price is affordable, so health care professionals can use it in their practices. 48 However, experience in the use of the caliper should be acquired to minimize intra- and inter-observer variation in measurement. 51
The predictive equations for height have been developed with a linear regression model. These equations can be used in children aged between 7 and 12 years. The age variable in this study was month unit. For the first time, to the author’s best knowledge, this study used the month unit as age variable in the equations. The month unit generated a more accurate equation result, as expressed by mean difference analysis between predicted height, produced by the equation, and actual height which was almost zero in boys and equal to zero in girls.
Included with each equation are the RMSE and SEE values. These values provide the distribution errors that can be expected using these equations. The predicted height for a participant has a 95% chance of being within double the SEE of participant’s height. Nevertheless, the more a child differs from the sample used to develop the equations, the greater the SEE values. The RMSE values of the equations of the study are 2.99 and 2.57 in boys and girls, and SEE values are 2.97 and 2.56 in boys and girls, respectively. These values are smaller than other studies. Chumlea reported the RMSE values were 4.16 and 3.84 for Caucasian boys and girls and 4.44 and 4.25 in African American boys and girls. While the SEE values were 4.21 and 3.9 for Caucasian boys and girls and 4.58 and 4.39 for African American boys and girls. 16 A more recent study stated the RMSE values for their equation were 3.06 and 2.72 in boys and girls, but no SEE values were reported. 6 It can be concluded that this study produced equations with the smallest errors.
Note that the RMSEs and SEEs in Table 5 are very close in value; moreover, in parameter when sex unconsidered, the value is identical. This is as a result of the good measurement procedure, and the large sample sizes used in the analysis indicate the tightness of the confidence intervals for equations. 16 The known error of these prediction equations provides the health professional with an estimate of error that must be considered in predicting height and setting population based. 16,48
This result was enhanced by a concordance correlation analysis that generated a very high degree CCC between predicted and actual height in both genders. The KH measurement investigated is a precise predictor of height in children without disability (boys R2 = 0.925, girls R2 = 0.947). This accuracy result is similar to a previous study conducted by Chumlea 16 and Gauld. 6
There are some potential limitations of the study. The equations of the present study are based on the measurement of a sample of children in one Indonesian city, not representative of the entire Indonesian children population. Therefore, samples from all states of Indonesia are necessary. Children who have been eligible and had been registered but did not attend on the day of data collection were excluded. Caution should be exercised when applying these equations to other race groups. Also, the age-group range in the study does not cover the entire age of the children. The study intention is to first develop equations for children without disabilities and which variables affect the equations from this relatively large sample. The next step in our future research will conduct a clinical validation and modify these equations for use in children with disabilities.
Contrarily, this study has several strengths. It is one of the largest prospective studies published to develop equations in children, which made it possible to make accurate prediction equations. Most studies with larger samples use data sets. Additionally, the study is the largest research-based study on children in Indonesia that use KH measures to predict actual height. Moreover, the age variable in the equation is in months unit, making the result more accurate. The equations presented here provide an easy and reasonably accurate method (with known errors) of predicting height in children aged 7 to 12 years.
Conclusion
In summary, this study produced an equation to predict height from KH. It is shown to have very high compatibility with the actual height. If several limitations in this study could be overcome, the equations that were drawn from the study could be used as useful tools for the anthropometry and nutrition assessment of participants whose measured height is unreliable both in community and in clinical settings.
Footnotes
Author’s Note
Fernando Rumapea is also affiliated with the Bengkalis Hospital, Bengkalis District, Riau Province, Indonesia.
Acknowledgments
The author(s) thank all the students who participated in this study, the head and staff of SDN 051 Pasirkaliki, SDN 018 Sukagalih, SDN 071 Sukajadi, SDK Baptis Wastukencana, SD Priangan Istiqamah, and SD YKPPK Cihampelas Elementary Schools in Bandung for their support, especially for Rita Astriani Noviati, MD, MKM, MH.Kes, Mrs. Dra. Lydia Martini, Ersan Saputra, MD, TH, and Rita Puspa, SKM, MP. We would also like to express our appreciation to Professor Dwi Prasetyo, MD, MKes, PhD and Susi Susanah, MD, MKes, PhD at Department Child Health, and also Dr. Hadyana Sukandar, Mr. Evan Susandi, M.Stat, Sri Agustina Rumapea, MKom and Juliana Rumapea, MBA for their statistical work in this study.
Declaration of Conflicting Interests
The author(s) declared no potential conflicts of interest with respect to the research, authorship, and/or publication of this article.
Funding
The author(s) received no financial support for the research, authorship, and/or publication of this article.